



Abstract
This study investigated the effects of subsurface drainage on the long-term performance of pavements. The Specific Pavement Study 1 (SPS-1) experiment of the Long-Term Pavement Performance Program (LTPP) was selected to extract performance data. Four types of cracking, rut depth, and International Roughness Index (IRI) were used as the performance indicators. Other relevant factors affecting the pavement performance were also considered: surface thickness, base type, base thickness, subgrade soil classification, total thickness, age, and climatic conditions. The significant factors to long-term performance were identified using two methods: exploratory data analyses and mixed-effects models (MEMs). Results from the analyses showed that drainage only substantially affected the transverse cracking (TC) and rutting and had little effect on the other performance indicators. Sections in the dry and non-freeze region had the best riding quality and exhibited the least alligator cracking, non-wheelpath longitudinal cracking (NWPLC), and TC, but this climatic condition worsened the wheelpath longitudinal cracking (WPLC). The use of drainage in sections from the wet-freeze (WF) region significantly retarded the development of distress. For drained sections, the base comprising an asphalt-treated base over a permeable asphalt-treated base (PATB) better sustained the smoothness and resisted rutting. For undrained sections, the asphalt-treated base was a superior alternative. Sections on sites with fine subgrade showed less WPLC, NWPLC, and TC, while those on coarse subgrade sites showed less alligator cracking and better riding quality. Sections on sites with fine subgrade showed less WPLC, NWPLC, and TC, while those on coarse subgrade sites showed less alligator cracking and better riding quality.
Pavements in the U.S. are exposed to internal flooding about 15% of the year ( 1 ). Water trapped in the pavement structure weakens the subgrade and causes premature failure ( 2 ). Inadequate drainage design has thus become a significant cause of degraded pavement performance. The effects of excess water, when combined with those of traffic load and freeze-thaw, lead to subsidence, patchy bleeding, pumping, stripping, potholes, and other pavement damages ( 1 , 3 ). The maintenance costs needed for addressing drainage-induced damage and restoring pavement structural capacity reach ( 4 ). When having water drained properly, adding drainage can extend pavement life up to 4 years and save life-cycle costs up to 40% ( 5 ).
The entrapment of water into the pavement structure is hardly avoidable ( 2 , 6 ). How to timely remove retained water and effectively regulate water from trapping in the pavement structure has been a question attracting extensive research efforts for decades. The use of a subsurface drainage layer has been a typical approach for water removal ( 7 ). A subsurface drainage layer places a sheet of permeable granular materials, either stabilized or unbound, between the pavement surfacing materials and the subgrade ( 6 ). This drainage layer can function as a base layer or a subbase layer ( 2 , 6 ). For rapid drainage, the drainage layer targets for the highest possible permeability ( 1 ). However, a high permeability base has risks of clogging by fines in the substrate unbound soil, which gradually decreases the drainage ability over time ( 8 , 9 ). A dense-graded gravel filter layer will be more effective than dense-graded asphalt filter to drainage ( 10 ). Properly proportioned fine and coarse particles are critical to the drainage performance. Additionally, the thickness and slope of the drainage layer matter. Thicker drainage layers increase drainage efficiency, but they compromise rut resistance ( 11 ). The increase of drainage blanket cross slope will also accelerate drainage ( 12 ). Zhang et al. demonstrated that inadequate compaction of the drainage layer was more likely to cause water damage ( 13 ). Additionally, well-compacted soil above the edge drainage helped move water out of the pavement in a timelier fashion ( 14 ). When a pavement contains no subsurface drainage layer, using longitudinal edge drains significantly increases the subgrade resilient modulus ( 5 ).
The field performance and economic impacts of including a drainge layer in pavements affect its adoption. Forsyth et al. pointed out that positive drainage can significantly extend pavement service life, and the cost of setting drainage facilities can be offset by the economic benefits of improving pavement performance and service life ( 3 ). To analyze the relationship between permeability and moisture damage, Ahmed et al. developed an analytical model and underlined that the damage of moisture decreases with the increase of pore permeability ( 14 ). Conversely, pavements with more dead-end porosity are more vulnerable to moisture damage. Harrigan reported that only one-third of permeable drainage layers function as designed; many suffer from infiltrating of fines from the underlying layer ( 15 ). Diefenderfer et al. compared the strength of pavements with and without subsurface drainage using a falling weight deflectometer ( 5 ). They concluded that adding a subsurface drainage layer has no adverse effects on the deflection, and thus introduces no weakness. They also noted that the benefits of subsurface drainage are not evident for all sites or conditions. Harvey et al. presented a laboratory study on the effect of drainage design on the pavement performance using the Heavy Vehicle Simulator (HVS) ( 16 ). They concluded that the undrained dense-graded aggregate base (DGAB) is slightly more resistant to rutting, and the one with permeable asphalt-treated base (PATB) exhibits a larger proportion of rutting in the asphalt bounded layer. Another study by this group revealed that the main failure mode of the section with PATB is excess rutting, while the undrained DGAB fails because of fatigue cracking ( 8 ).
The Specific Pavement Study 1 (SPS-1), an experiment in the Long-Term Pavement Performance Program (LTPP), included a series of factors to examine the impacts of subsurface drainage, structural combination, and site factors on the performance of flexible pavements. Chatti et al. analyzed the performance data of SPS-1 ( 17 ). They found that the base and subgrade soil types are critical factors for distress and riding quality. The efficiency of the drainage layer is also related to the climate. Haider et al. presented statistical analyses of the SPS-1 data to quantify the effects of the experimental factors ( 9 ). They approached the data analyses with logistic regression, linear discriminant analysis, and one-way analysis of variance (ANOVA). Hall and Crovetti analyzed the effects of factors in SPS-1 on distress and the International Roughness Index (IRI) using multiple regression models ( 18 ). They found equivalent pavement thickness and climatic conditions such as freeze index and precipitation depth are more relevant to pavement performance. Meanwhile, the base material type and inclusion of drainage only show minor impacts. To understand the effects of drainage and structural capacity on the performance of asphalt and concrete pavements, Harrigan analyzed data from in-service 91 pavement sections distributed in the U.S. and Canada ( 15 ). They reported that, for asphalt pavements with unbound aggregate base, adding edge drainage reduces fatigue cracking but contributes little to reducing rutting. Asphalt-treated permeable base helps reduce rutting.
Although these studies have generated valuable information for understanding the effectiveness and necessity of subsurface drainage, most only prove the advantages of setting a drainage layer. Very few situations where drainage layers are unnecessary lack the support of long-term pavement performance data. It is necessary to use field-observed performance data with long monitoring history and include more factors to analyze field performance and effectiveness of the drainage layer. To investigate the conditions under which the drainage layer is worthwhile or worthless, more distress types as performance measures are analyzed. This study aims to identify the effects of subsurface drainage on the long-term performance of asphalt pavements, coupling the influences of other structural and site factors. For this purpose, the data of climatic regions, total base thickness, base types, and surface thickness were extracted from SPS-1 of LTPP. The factors in SPS-1 are discrete variables, such as drainage versus no drainage, located in freeze or non-freeze region, among others. Considering the grouping nature of this data set, and inherent correlation for data within each group, mixed-effects models (MEMs) are proposed that simultaneously consider the between- and within-group variance, and thus more accurately analyze the variance among different experimental factors.
Methodology
Exploratory Data Analysis
To investigate the impacts of subsurface drainage coupling with other structural and environmental factors, two types of method were employed: exploratory data analysis (EDA) and MEMs. Representing data in graphics and analyzing their mean and standard deviation is a typical way of EDA. Among the factors in the SPS-1 experiment, several are binary, which are thus paired (drainage versus no drainage, thin asphalt concrete [AC] surface versus thick AC surface). For paired binary variables (drainage versus no drainage), a slopegraph can conveniently visualize the changes from one state to the other. A slopegraph is a type of data visualization that connects the two paired points through a straight line ( 19 ). When coupled with other covariates, the confounding effects of those covariates can also be represented in the slopegraph. Figure 1 exemplifies a slopegraph to show the overall trend of IRI when a section changes from drainage to non-drainage. Each line represents a survey; the red line connects the average of both states (drainage versus no drainage).
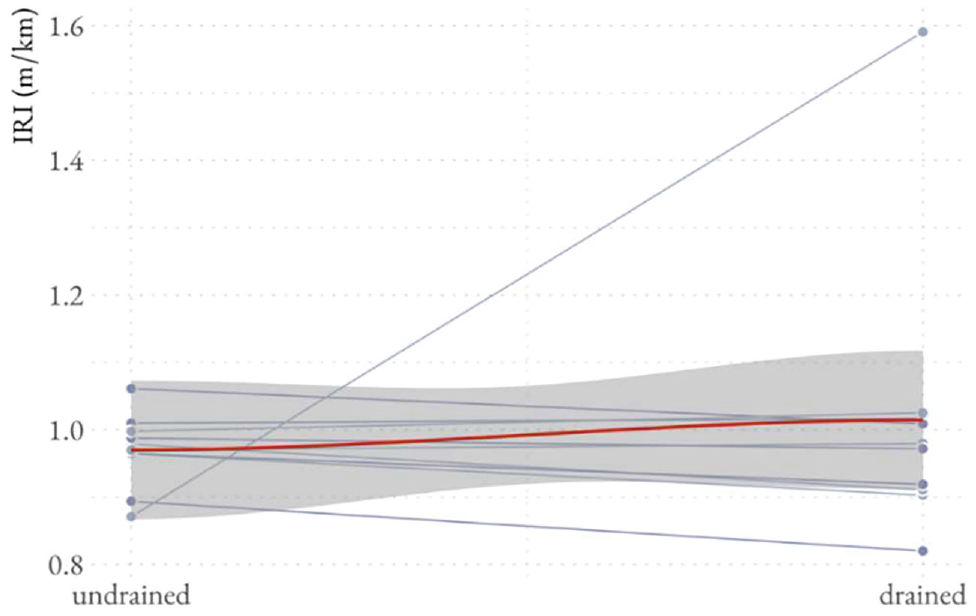
Illustration of a slopegraph for the International Roughness Index (IRI) of sections in the Texas site (state code: 48).
Mixed-Effects Regression Models
Ordinary regression (OR) models have been a popular approach for causal inference. Because of its restrictive assumptions—including linearity between the response and predictors, identically independent distributed (IID) residual errors, and homogenous variance—OR often generates inaccurate estimates ( 20 ). OR models are also called fixed-effects models, as their model estimates are fixed for all observations. When allowing the model estimates (including slopes and intercepts) to vary with each observation or group of observations, OR becomes a random-effects model, as each estimate is considered a random variable rather than a constant. An MEM is a special case of the random-effects model, where the model contains both fixed and random effects (estimates). Likewise, the fixed-effects model (OR) is also a particular case of the random-effects model, where all data live in only one group. For grouped data, the data are naturally of a leveled or hierarchical structure. Thus, MEMs are also called multilevel or hierarchical models. Because of their ability to account for the data hierarchy, MEMs have been applied extensively in analyzing longitudinal data or panel data ( 21 , 22 ). Figure 2 shows different groups of the same level. Depending on the variability in the model’s slopes and intercepts, the MEM can be divided into three types: varying-intercepts, varying-slopes, and varying-intercepts and slopes. This study used the varying-intercepts MEM for brevity and interpretability. Because MEM allows the variance of the residual errors to vary by groups, the OR’s IID restriction is relaxed.

Illustration of three types of mixed-effects models (MEMs).
Equation 1 shows the typical form of mixed-effects for a variable. The following presents the mathematical equations for the random-effects model:




where:
variables a and b are variables hinging on
In this sense, MEM can be seen as a statistical model in ANOVA, in which the total variance comprises between-group and within-in group variances (
23
). When

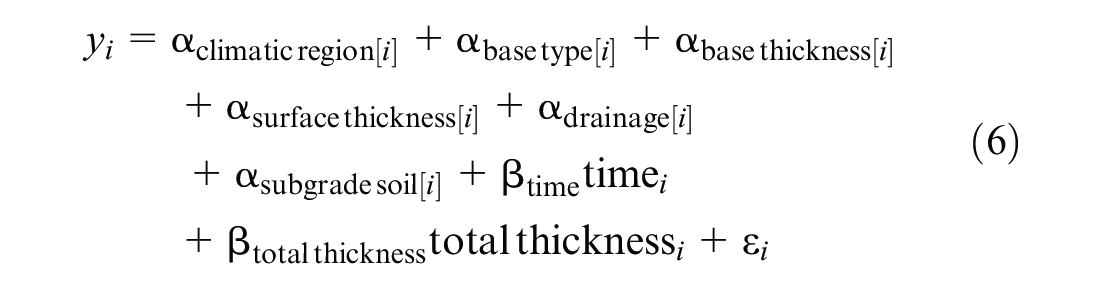
To compare the performance of the MEMs, fixed-effects models were constructed corresponding to the MEMs to serve as comparing baselines. Also, to increase the predictive accuracy, the sections’ total thickness and their service time since construction were also incorporated. Each experimental factor was considered a grouping variable, and each was included as a random effect. Therefore, all MEMs comprised of six fixed effects and six random intercepts (Equation 6). The MEMs were fitted using the R package lme4 ( 24 ). The fixed-effects models were built with glm function in the R stats package ( 25 ). Also, to reduce the effects of the data magnitude on model fitting, all response variables were normalized to the range of (0, 1).
Data
The data used in this study were obtained from LTPP, which has been monitoring more than 2,500 in-service sections for more than 30 years ( 26 ). The Federal Highway Administration (FHWA) currently manages LTPP. LTPP includes a series of experiments investigating the optimal strategies for pavement design, maintenance, and rehabilitation. The performance data used for this purpose are from the SPS-1 of LTPP. The latest release of the LTPP database, Standard Data Release (SDR) 33, was used. The following briefly introduces the SPS-1 experiment.
Specific Pavement Study 1 (SPS-1) Experiment
The SPS-1 experiment was primarily designed to study the impacts of various structural, site, and environmental factors on the performance of flexible pavements ( 26 ). The first few sites were constructed in the early 1990s and some were constructed slightly later ( 27 ). The SPS-1 sites distribute across 18 states, and each site has 12 core sections. Some sites are supplemented with extra sections. For instance, the Texas (48) site has 20 sections—12 core ones plus eight supplemental ones. Figure 3 gives the locations of the SPS-1 project sites. In all, there are 246 sections in the SPS-1 experiment. Only the data from the original core sections (216 sections) were used in this study. As shown in Figure 3, the wet-freeze (WF) and wet-no-freeze (WNF) regions contain the majority sections. The estimated annual equivalent single axle load (ESAL) for all 18 SPS-1 sites ranged from 113,000 to 524,000, with an average of 278,000. Because of lack of data on traffic volumes and water table, SPS-1 considers a total of six experimental factors, namely, the total base thickness, surface thickness, base type, drainage, subgrade soil type, and climatic conditions. Out of 12 sections, five have 8 in. (203 mm) base layer, five have a 12 in. (305 mm) base layer, and the remaining two have a 16 in. (406 mm) base layer. Also, two test sections have DGAB, two sections have asphalt-treated base (ATB), two sections have a combination of ATB/DGAB, three sections have PATB over DGAB, and three sections have ATB over PATB. In-pavement drainage is provided only for sections with PATB as the base. Table 1 presents a detailed factorial for these factors. In this table, the climate region is divided by precipitation and freeze index. The sites with average annual precipitation less than 20 in. (508 mm) are considered as dry, otherwise as wet. Meanwhile, the sites with average freeze index less than 83.38°C-day (150.08°F-day) are classified as not-freeze, otherwise as freeze. The freeze index is defined as the negative of the sum of all average daily temperatures below 0°C in a year ( 28 ). Among the sections containing a PATB layer, edge drains were enabled to allow water drain out of the pavement structure. Detailed material properties can be found in the work of Chatti et al. and Hana et al. ( 17 , 27 ).
Projects and Factorial of Specific Pavement Study 1 (SPS-1) Experiment Design ( 26 )

Note: AL = Alabama; AR = Arkansas; ATB = asphalt-treated base; AZ = Arizona; DE = Delaware; DGAB = dense-graded aggregate base; FL = Florida; IA = Iowa; KS = Kansas; LA = Los Angeles; MI = Michigan; MT = Montana; NE = Nebraska; NM = New Mexico; NV = Nevada; OH = Ohio; OK = Oklahoma; PATB = permeable asphalt-treated base; TX = Texas; VA = Virginia; WI = Wisconsin; NA = not available.

Locations of Specific Pavement Study 1 (SPS-1) project sites ( 26 ).
Three types of performance data were considered: distress, rutting depth, and roughness in terms of IRI. The distress comprised four types of cracking: alligator cracking, wheelpath longitudinal cracking (WPLC), non-wheelpath longitudinal cracking (NWPLC), and transverse cracking (TC). For cracking, measurements of different severity (low, medium, and high) were summed to obtain a single representative value. For rutting, values on the outer wheel path and inner wheel path were averaged. The IRI values were calculated likewise. For each section, data was only included when there was no preservative action that changes the pavement structure’s overall thickness. Figure 4 shows the distributions of performance monitoring time by different performance indicators. Overall, more than 80% of the sections served longer than 8 years before rehabilitating. Table 2 gives the summary statistics for the factors in the SPS-1 experiment.
Summary Statistics of Distress Measures and Riding Quality

Note: ATB = asphalt-treated base; DF = dry-freeze; DGAB = dense-graded aggregate base; DNF = dry-no-freeze; IRI = International Roughness Index; PATB = permeable asphalt-treated base; SD = standard deviation; WF = wet-freeze; WNF = wet-no-freeze.

Years of performance minitoring for different performance indicators: (a) alligator cracking, (b) wheel-path longitudinal cracking (WPLC), (c) non-wheel path longitudinal cracking (NWPLC), and (d) transverse cracking (TC).
Discussion of Model Results
Exploratory Data Analysis
Figure A1 (see Appendix) offers slope graphs for the distress indicators, and Table 2 shows the mean and standard deviation of these indicators. Climate regions exhibit substantial influence on distress. In WF regions, alligator cracking in drained pavements is 25% more than in those with no drainage. For WPLC, drained pavements in the freeze region consistently perform better than their undrained counterparts, which means pavements in the freeze region need drainage more. Compared with those in the freeze region, the WPLC of the no-freeze area reduces from 44% to 37%. Pavements in the DNF region show the shortest total NWPLC.
The base type also significantly influences the four types of cracking. The crack prevention performance of ATB/PATB is better than PATB/DGA for the pavements with drainage, and the distress of this base type is 7%–26% lower than the other alternatives. ATB performed the best among the three undrained base types. Pavements with a thicker AC surface show less alligator cracking and WPLC, but the thinner ones with drainage have less NWPLC. For the base thickness, drained pavements containing a thicker base have an evident advantage in preventing distress; however, the thick base of pavements without drainage is far inferior to the thin one. Sections on sites with coarse subgrade soil perform worse than those on fine. WPLC and TC of pavements with coarse subgrade are two to three times than that of fine subgrade, and drainage makes it worse.
Figures A2 and A3 (see Appendix) offer slope graphs for the rutting and IRI (these slopegraphs and the figures followed were placed into the Appendix to keep the text uninterrupted). The summary statistics of the two indicators are also shown in Table 2. Overall, the rut depth and IRI of the undrained sections in the DF region are less severe. Conversely, the rut depth and IRI of sections in the DNF and WNF regions are more severe. Different base types differ in their influences on the rutting depth and IRI. For the sections without drainage, the sections with a DGA base perform worse than ATB/DGA and ATB: the rut depth of pavements with a DGA base is 4% and the IRI is 22% higher than other base type alternatives. For the drained sections, ATB/PATB performs better than PATB/DGA: the IRI and rut depth of the former is at least 8% smaller than that of the latter. Sections with a thicker AC surface have less rutting than the thinner counterparts. The effects of base thicknesses on IRI is insignificant. For rutting, drained pavements with a 12 in. base show the largest rut depth. The sections on coarse subgrade sites are smoother than those on sites with fine subgrade soil. In all, drained sections are smoother than those with no drainage. In most conditions, the rutting depth of undrained pavements can be 15% deeper than the drained ones. The drainage pavements with larger rut depth may be pavements where the drainage system failed or the drainage layer was blocked ( 29 ).
Mixed-Effects Regression Models
OR and MEMs were developed for each performance indicator. Tables 3 and 4 present the estimates of the MEMs for the considered performance indicators, which consist of estimates (slopes and intercepts), standard errors (SE), p-values, and the 95% confidence interval. Since the variables are either nominal or normalized to the range of (0, 1), an estimated magnitude indicates its extent of influence. If the coefficient of a variable is 0, it has no influence on the response variable. The coefficient of determination, R 2 , measures a model’s fitness to the data. A model perfectly fitting the data has an R 2 value of 1, a less fit model has an R 2 value approaching 0. As shown in Figures A4 through A10 (see Appendix), the R2 values of the MEMs are significantly higher than the corresponding OR models, indicating MEMs are more accurate and more consistent than their OR counterparts.
Mixed-Effects Model (MEM) Results of Distress Measures.

Note
Bold text indicates the significance (95% confidence) of the corresponding variable.
Mixed-Effects Model (MEM) Results of Riding Quality.

Note
Bold text indicates the significance (95% confidence) of the corresponding variable.
Alligator Cracking
According to Table 3 and Figure A4> (see Appendix), alligator cracking, climate region, total thickness, and age were important factors. Pavements in the WNF regions experienced the development of fatigue cracking more compared with those in the DF, WF, and DNF regions. Thicker total thickness was equivalent to less alligator cracking, and the cracks of older pavements were more serious. Other factors like drainage, surface and base thickness, base type, and subgrade soil have little effect on alligator cracking.
Wheelpath Longitudinal Cracking (WPLC)
As shown in Table 3 and Figure A5 (see Appendix), for WPLC, the climate region, subgrade soil, and age are statistically significant. Different climate regions had substantially different levels of WPLC. The WPLC of pavements in the DNF, WF, WNF, and DF regions improve in order. Pavements built on fine subgrade perform better than on coarse subgrade in terms of WPLC. As in-service time and traffic volume accumulate, the WPLC increases as expected. The data fail to reveal any significant effects of drainage, base type, surface, base, and total thickness on the WPLC.
Non-Wheelpath Longitudinal Cracking (NWPLC)
As presented in Table 3 and Figure A6 (see Appendix), NWPLC, the climatic region, subgrade soil, and age are critical factors. Pavements from the WF region present the most NWPLC. Sections on sites with fine subgrade soil exhibit significantly less NWPLC than those on sites with coarse subgrade soil. Unsurprisingly, pavements which served longer show more NWPLC. Similar to the WPLC, the drainage, base type, surface, base, and total thickness have little impact on the NWPLC.
Transverse Cracking (TC)
For TC, the drainage, base type, and service time are critical factors (Table 3 and Figure A7 [see Appendix]). The use of drainage is beneficial. As the estimate of drainage is negative, which means drained sections are lesser likely to develop TC. The use of PATB/DGAB aggravates TC, and ATB and ATB/DGAB better retard this distress comparing with DGAB. TC increases significantly with the time of service. The data fail to show that the effects of the climate region, thickness (AC surface, base, and total), and subgrade soil type on the TC are significant. The climatic region is insignificant in the MEM, probably because of being confounded by other factors. A separate MEM was constructed that includes only the climate condition and ages of service (Figure A8 [see Appendix]). As shown, the climatic condition is significant in the simplified model, and the estimates cohere with the boxplots. The TC of sections in the non-freeze regions is similar, with the ones from the DF region being the worse. Concerning sites in the DF region, sections with a thin AC surface (4 in.), a thick base (12 in.), and a coarse subgrade have the worst performance. In such a case, TC of sections with drainage is at least 27.2% less than those without drainage.
Rutting
As shown in Table 4 and Figure A9 (see Appendix), in the MEM for rutting, the climate region, subgrade soil, and age are statistically significant. The average rut depth of sections in the WF region is the largest, while those in the DNF region have the least rut depth. Rutting was more likely to occur in sections with fine subgrade. Longer service time increases the risk of more rutting. The data fail to demonstrate whether drainage, base type, surface, base, and total thickness have any statistically significant impacts on rut depth. Sections with a thin surface (4 in.), a thick base (12 in.), fine subgrade, and located in the WF region performed the worst. Among such a set of sections, the rut depth of the drained ones was 10.1% less than those without drainage.
Roughness (IRI)
As displayed in Table 4 and Figure A10 (see Appendix), for IRI, all factors are critical, though not of the same direction and extent. The coefficient of drainage is negative, which means drainage can help maintain the smoothness. Overall, sections with a thick AC surface layer are smoother (smaller IRI). The IRI of sections in the WF sites is significantly larger than those in the DNF region. Concerning base types, the sections with ATB/DGAB are the smoothest, followed by ATB, DGAB, and PATB/DGAB. The sections on sites with a fine subgrade are rougher than those with coarse subgrade soil. The impacts of the base thickness and total thickness on the IRI are insignificant. The sections that perform the worst are those comprising a thin AC surface layer, thick base (12 in.), and fine subgrade soil. Within this set of sections, the IRI of drained sections is 4.5% less than the undrained ones.
Conclusions
This study investigated the effects of subsurface drainage on the long-term performance of pavements. The SPS-1 experiment of LTPP was the source of pavement performance data. Four types of cracking, rut depth, and IRI were used as the performance indicators. Other important factors affecting the pavement performance were also considered, including surface thickness, base type, base thickness, subgrade soil classification, and climatic conditions representing temperature and precipitation. Performance differences between pavements with or without drainage were compared using two methods—exploratory data analyses and MEMs—to identify the scenarios where drainage played a significant role. Based on the analyses, this study reached the following conclusions:
The climatic conditions significantly influence the development of distress. Sections in the dry and non-freeze region (with or without subsurface drainage) showed the least alligator cracking, NWPLC, and TC, and they also showed the highest riding quality. However, the WPLC of sections in this region was worse than the wet and non-freeze, and dry and freeze, as well as the wet and freeze zones. Sections with subsurface drainage in the wet-freeze region exhibited 25% more alligator cracking than those without drainage within the same region.
In terms of both cracks and driving quality (IRI and rutting), ATB/PATB was an effective base type for drained sections, while ATB was a better alternative for those undrained ones.
Sections on fine subgrade sites showed less WPLC, NWPLC, and TC, while those on coarse subgrade sites performed better as per alligator cracking, rutting, and IRI.
Within the four types of cracking, the use of subsurface drainage promoted pavement performance. For alligator cracking, WPLC, and NWPLC, the influence of drainage is not significant. However, concerning TC, drainage helped reduce this type of distress by at least 27.2%.
On average, subsurface drained sections were smoother than their no drainage counterparts. The IRI of drained sections was about 4.5% lower than those without drainage, while the rate of reduction of the rut depth is 10.1%. However, according to the MEM, the effect of drainage on rutting is statistically insignificant.
The MEMs, because of their consideration of data hierarchy and direct modeling of between-group variability, were more predictive than their conventional regression counterparts.
Supplemental Material
sj-docx-1-trr-10.1177_03611981211032649 – Supplemental material for Long-Term Effects of Subsurface Drainage on Performance of Asphalt Pavements
Supplemental material, sj-docx-1-trr-10.1177_03611981211032649 for Long-Term Effects of Subsurface Drainage on Performance of Asphalt Pavements by Pinyu Ji, Hongren Gong, Lin Cong, Xiaoyang Jia and Baoshan Huang in Transportation Research Record
Footnotes
Author Contributions
The authors confirm contribution to the paper as follows: study conception and design: P. Ji, H. Gong, L. Cong, X. Jia, B. Huang; data collection: P. Ji, H. Gong, X. Jia; analysis and interpretation of results: P. Ji, H. Gong; draft manuscript preparation: P. Ji, H. Gong. All authors reviewed the results and approved the final version of the manuscript.
Declaration of Conflicting Interests
The author(s) declared no potential conflicts of interest with respect to the research, authorship, and/or publication of this article.
Funding
The author(s) received no financial support for the research, authorship, and/or publication of this article.

Supplemental Material
Supplemental material for this article is available online.
References
Supplementary Material
Please find the following supplemental material available below.
For Open Access articles published under a Creative Commons License, all supplemental material carries the same license as the article it is associated with.
For non-Open Access articles published, all supplemental material carries a non-exclusive license, and permission requests for re-use of supplemental material or any part of supplemental material shall be sent directly to the copyright owner as specified in the copyright notice associated with the article.
