



Abstract
Large-scale planned special events (PSEs) can pose unique transportation and logistics challenges. Data collection and simulation are important tools to address these challenges, although they are often difficult because of event size and complexity. This paper discusses methods to address the challenge of multimodal simulation at large PSEs through the context of AirVenture, a large week-long airshow organized by the Experimental Aircraft Association in Oshkosh, Wisconsin. Sampling and data collection techniques are discussed for a variety of modal processes like private vehicles, pedestrians, and shuttles, and for different situations like vehicle arrivals and departures, pedestrian queues, and shuttle systems. A flexible simulation framework for integrating these three modes and numerous activities is developed as a network of heterogeneous queues and queue-dependent choices. The simulation tested a variety of proposed policy changes around the site, including rerouting shuttle lines, and adjusting the system of vehicle arrivals to the site. Results of this study demonstrate the effectiveness and flexibility of the data collection and simulation methodologies. The techniques developed in this work can be used to improve planning and transportation systems at many other forms of PSE.
Large-scale planned special events (PSEs) can strain transportation infrastructure through large and unique demand patterns, and therefore significantly affect travel safety, mobility, and travel time reliability ( 1 ). In the context of PSEs, previous studies have focused on understanding and predicting travel from and to the event sites ( 2 , 3 ), satisfaction of attendees at PSEs ( 4 ), social interaction networks at PSEs ( 5 ), evacuation from PSEs (6–8) and so forth. However, attempts to capture the complexity and interdependencies of processes inside such events have been limited.
Simulation as a tool has been used in a variety of contexts to model and understand complex systems including pedestrian dynamics at various locations like airports ( 9 , 10 ), malls ( 7 ), and sporting ( 11 ) and religious events ( 12 , 13 ), and to model traffic flow ( 14 , 15 ), supply chain ( 16 ), and manufacturing processes ( 17 ). Most studies that have tried to model interdependent processes at such events (like arrival at the event site, finding a parking lot, queueing processes, mode and routing choices, etc.) used simulation to do so. However, this has been done in a limited capacity, where only one or a few aspects of the event (like pedestrian flow, traffic flow, queueing, etc.) have been modeled. For example, Wojtowicz and Wallace ( 18 ) used traffic microsimulation to evaluate traffic management strategies during evacuation and traffic incidents. Lin and Chen ( 19 ) used simulation-based multiclass, multimodal traffic assignment to evaluate traffic control plans at PSEs. Xiao ( 20 ) used simulation to investigate congestion mitigation during the ingress of a planned special event. Studies that take a multimodal approach in transportation-related contexts include the work by Kotachi et al. ( 21 ) and Keceli ( 22 ), both of which are in the port operations contexts and model the interaction between modes like ships, trucks, and rail.
A more comprehensive framework is needed to capture the complexity and interdependencies in various modes and processes that take place at such large events. By incorporating a wider variety of modes and activities in a model of the event, the broader effects of proposed policy changes can be investigated and understood in greater detail. This framework has the potential to aid in decision making in a variety of scenarios and thus help in improving the overall user experience at such events, as well as eliminating potential public safety issues. This paper develops an integrated heterogeneous queueing-based multimodal simulation platform for a large PSE. Taken individually and collectively, these processes define the channels through which users (visitors) move into, around, and from the site of a large PSE. The framework focuses on simulating a dynamic, congested vehicle arrival process, the pedestrian and shuttle trips from the parking lots to the event entrances, the shuttle systems used to facilitate travel around the event, and the departure process.
While integrated into a single framework, each modal process is modeled according to its own mathematical foundations and interactions at various decision nodes. This multimodal simulation is intended to answer a variety of questions including how changes in one aspect of the event could affect other aspects, and where bottlenecks might form under various policies and service schedules. Variations on this set of modes and processes are applicable to a wide variety of large special events in sports, entertainment, religion, and politics, which have similar processes.
This study illustrates the simulation framework by developing a simulation for a large air show named AirVenture, organized annually by the Experimental Aircraft Association (EAA). The framework is multimodal and agent-based, in that it includes decision nodes that are largely driven by behavioral decision processes. The framework is applied to six different policy scenarios for which various performance indicators are evaluated to support the decisions of event organizers.
The primary contributions of the work consist of: (i) a flexible modeling framework that integrates multiple modes and logistical processes (involving private cars, shuttle buses, and large pedestrian crowds) into a network of queues for PSEs; (ii) integration of agent-based user decision processes into the model framework in conjunction with modeling the individual queueing components and their interactions; (iii) addressing an area of application that has received very limited attention in the literature, namely large-scale PSEs, and developing state of the art methodology to support planning and decision making; (iv) gathering of real-world data on these processes that can help in planning other special events; (v) comprehensive application with model calibration and validation, and illustration of the model’s utility through formulation and evaluation of various improvement measures. The framework developed can be a useful tool for planners of large special events to investigate policy changes to the transportation network.
The next section presents a description of the AirVenture event, including details of the event site and information about the journey of a typical visitor at the event site. The third section presents the model development process and simulation framework, which is formulated as a flexible network of heterogeneous queues. The fourtrh section discusses the data available and methods used to obtain it. The six different scenarios tested in this study are then presented, and the results from the simulation discussed. The final section presents the concluding remarks and identifies avenues for future research.
Event Description
General Information
EAA AirVenture Oshkosh is an annual event that is organized near Wittman Airport in Oshkosh, Wisconsin, during the last week of July (Monday to Sunday). It caters to aviation enthusiasts who can enjoy a multitude of activities such as attending aviation workshops, watching airshows (2:00–6:30 p.m. on all days), watching night airshows (Wednesday and Saturday 8:00–10:30 p.m.) or visiting exhibitors. In 2019, around 642,000 individuals attended the event with an average of 100,000 daily visitors. Figure 1 shows a map of the event area.

Map of the event area.
Attendees enter the event site using either Exit 116 or Exit 113 on the I-41 interstate. Several public parking lots are present near the exits, designated as Blue, Brown, Gray, Yellow, Pink, Gold, and Red, as well as permit-only lots such as G Lot reserved for event staffers and volunteers. Poberezny Road and Waukau Avenue are two major thoroughfares that provide access to the parking lots, and at night, EAA reverses lanes to facilitate the departure process. The parking lots are available on a first-come, first-served basis, creating high demand for parking lots close to the gates (Blue, Gray), and low demand for outer lots (Pink, Yellow, Gold, Red).
Visitors can reach the entry gate by walking or by shuttle if available (there are shuttles from/to Gray Lot and the EAA museum near the Brown, Pink, and Yellow lots). The majority of visitors arrive through the main gate, where two separate areas allow for purchasing tickets or redeeming pre-purchased tickets.
Inside the event grounds is a separate fixed-route shuttle system to transport attendees to the various activities of the event. The system is composed of four lines (Red, Yellow, Blue, Green), with major hubs at the ATC Tower and Hangar Café. Many visitors choose to camp on site, although there are still approximately 9,000 vehicles driving to the site each day.
Model Structure and Simulation Methodology
A multimodal simulation framework was developed to enable the study of transportation policy changes at PSEs and to provide unique insights. To develop an accurate and flexible simulation, models of the event are first developed based on event observations. Figure 2 depicts the simulation development process followed in this study. As the event model is a network of queues representing transportation processes, queue observations are focused on, and queue arrival rates, service times, and lengths over time are sufficient to model each queueing process accurately. This information can be collected by surveillance footage or other similar automated techniques. The queue process models presented in this section are calibrated based on observed arrival rates and service times, with special attention paid to the distributions of each. With the processes developed, they are arranged in a simulation software according to the event layout and necessary assumptions, and the simulation is performed. Initially an “existing conditions” scenario is performed and the simulated queue lengths checked against observed queue lengths to identify and adjust discrepancies in the simulation.
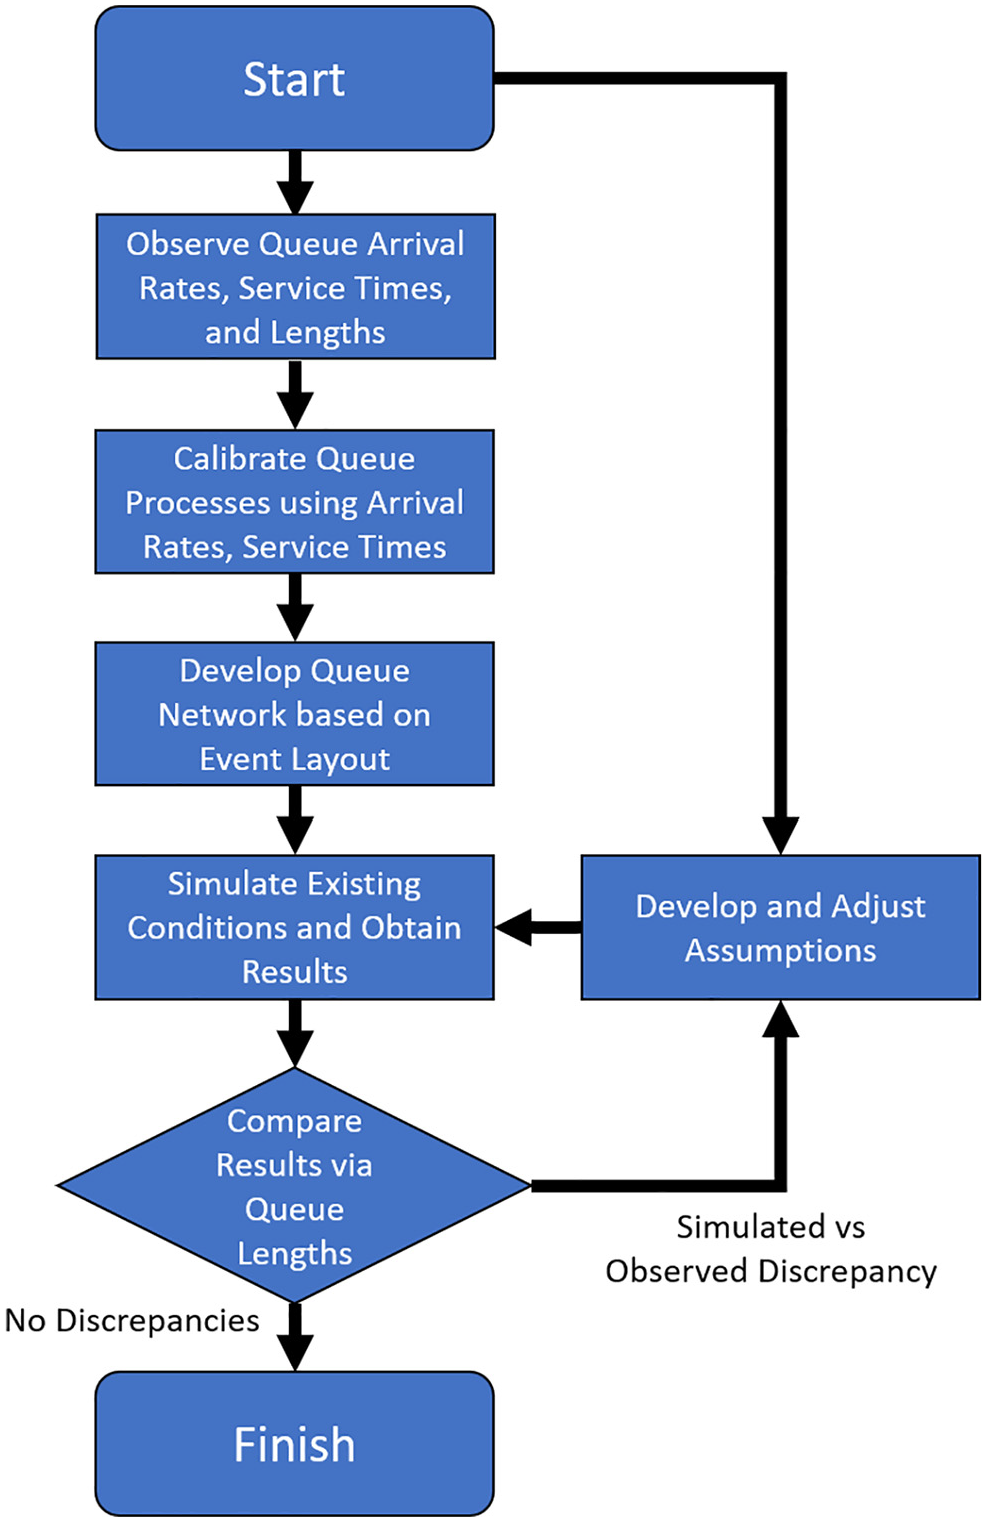
Model development process.
The simulation framework is composed of interconnected heterogeneous queueing processes and decisions dependent on queues. This format allows for flexibility across modes and activities. The three modes modeled and assorted processes are: (i) cars arriving at, parking in, and departing from the lots, (ii) pedestrians moving from the lots to the entrance gates and queueing, and (iii) shuttles moving passengers from lots to the gates and around the interior of the site. The general processes and choices modeled for each mode and the relationships between modes are shown in Figure 3.
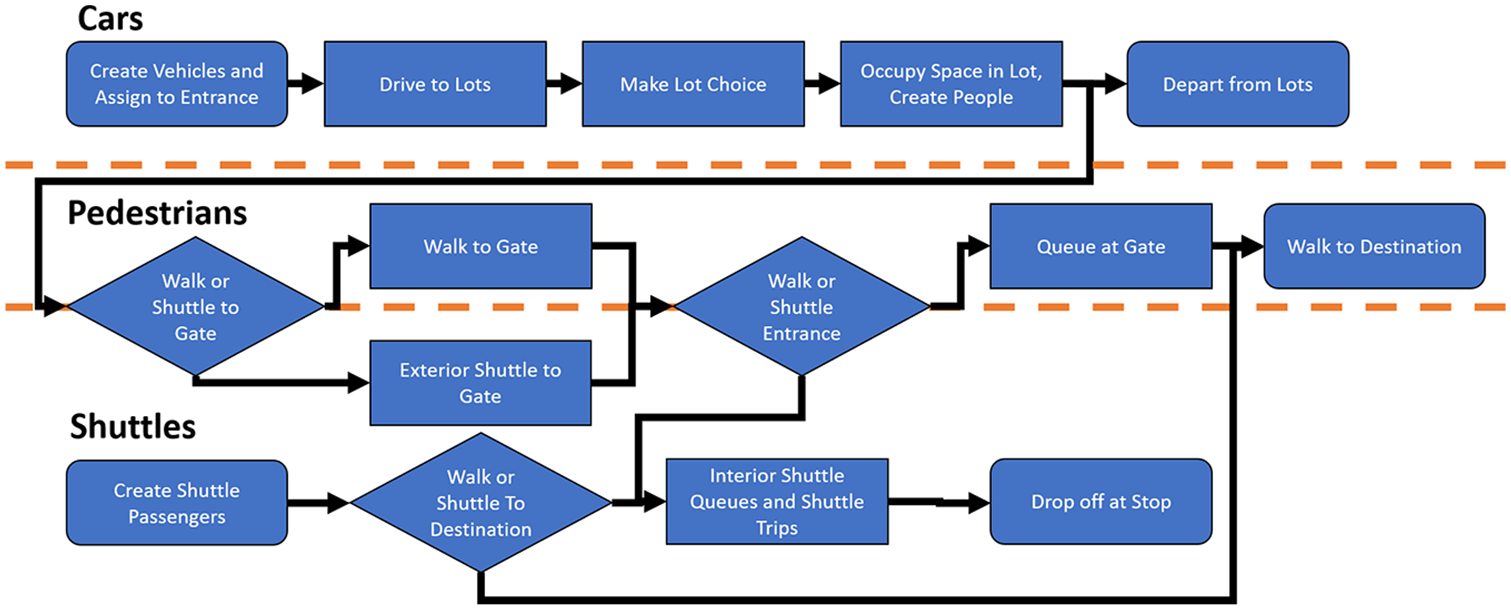
Vehicle and pedestrian simulation methodology.
Queue Process 1: Traffic Flow Model
The vehicle simulation models the arrival of visitors at a PSE. The visitors arrive from highway exits, traverse several local road segments, decide on which of the parking lots to use, then wait in line to enter the parking lot. Each of these steps is modeled within the simulation framework.
Vehicles are initially generated at the local highway exits according to exponentially distributed interarrival times with a mean equal to the inverse of the observed vehicular arrival rates for every 30 min segment. The exponential distribution (Poisson arrivals) is appropriate in this study because of relatively low upstream arrival rates compared with the capacity of the roadways ( 23 ). For this event nearly all local traffic consisted of visitors to the site. Some vehicles are created with assigned parking lots, including for the permit-only lots, but the majority of vehicles are not assigned a lot, and will choose a lot as they travel through the road system as described in Queue Process 2. After generation, vehicles are assigned to one of the two generation points (highway exits) according to a probabilistic mechanism.
The generated vehicles travel the roadway network, which is modeled as a network of segments, with each segment a queue. The service time for each road segment is based on the model of Greenshields et al. ( 24 ), with the traversal time (TT) equation based on the number of other vehicles within the segment and shown below in Equations 1–3:



where
The maximum number of vehicles that can be served simultaneously by a road segment is equal to the space on the roadway divided by the jam density, shown below in Equation 4:

If one segment reaches jam density, then vehicles coming from upstream cannot be served. These vehicles are held on the preceding segment until space is cleared. In this manner road jams propagate backward. With the model of Greenshields et al. ( 24 ), we account for congestion from slowing vehicles and increased density.
There were several pedestrian crosswalks throughout the parking lot area of the site. At these crosswalks pedestrians and cars interacted, and caused traffic delays. In each case, an observed average delay time was added to the appropriate segment to account for this interaction.
Queue-Based Decision Node 1: Parking Lot Choice
As arriving visitor vehicles without lot assignments traverse the road segments, they pass parking lots, and for each lot the driver makes a binary choice whether to park in the lot or keep driving, subject to available space in the lot. The spaces left in the lot are based on lot capacity minus the current number of occupied spots. This driver’s choice is modeled as the result of a simple probabilistic choice rule, stated in Equation 5:

where
Each lot has an inherent attractiveness to the visitor, with a higher attractiveness value increasing the chance that the lot will be selected. Because the lots are not viewed identically across visitors, the perceived attractiveness is normally distributed for each visitor, that is,
Queue Process 2: Parking Lot Queues
Queueing occurs at parking lot entrances as a result of the interaction of drivers with cashiers at the entrance. Once a visitor has selected a parking lot, they enter the queue for that lot. The service time of these queues is based on observed service times of the cashiers. In some instances, the visitors have pre-purchased parking passes that shortened the time, and the chance of having such a pass is accounted for in the service time expression. The maximum number of vehicles being served simultaneously is the number of cashiers at each lot, which varied throughout the day according to a schedule.
Queue Process 3: Occupation of Spots and Departure Queues
The occupation of spots in a parking lot is also modeled as a queue. The service time of the queue is the duration that the vehicle occupies a spot. The duration is dependent on a departure time distributed over a range of values according to departure rate data. Departures were observed at exits to the event site and from these observations departure rates were estimated for half-hour intervals throughout the day. Using the vehicle duration mechanism it is possible to emulate the departure schedule through the occupancy times of parking lots.
Once a vehicle finishes its occupation of a spot, it enters the departure queue for the lot. The maximum number of vehicles departing simultaneously is dependent on the number of exit lanes from the lot. The service time is exponentially distributed, based on observations of departing vehicles.
Queue Process 4: Pedestrian Travel to and Queue at Gates
A vehicle occupies a spot in the parking lot and creates an integer number of pedestrians according to an observed distribution of vehicle occupancy. These pedestrians choose to either walk or take a shuttle to the event gates, based on the shuttle/walk choice method (see below). The walk option is a queue with a normally distributed travel time to the gate and no capacity restriction on the number of pedestrians served simultaneously. The estimated standard deviations of the normal distributions were small compared with the mean, ensuring a positive travel time. One can also use a triangular/lognormal distribution to ensure positive numbers. The shuttle option enters the pedestrians into the shuttle queue before they board a shuttle vehicle that transports them to a stop near the gates or within the site. See the shuttle system methodology for more details.
The queues at the gates are modeled similarly to the lot queues, with service times based on observed times, and the number of cashiers as the maximum number of simultaneously served visitors.
Queue-Based Decision Node 2: Shuttle Passenger Generation and Shuttle/Walk Choice
In the shuttle network simulation model, two types of objects—passengers and shuttles—are interacting by means of queues at shuttle stations. Passengers and shuttles are created separately; shuttles pick up passengers from queues, and alighting passengers can transfer to other shuttle lines and join the new queue. A shuttle/walk mode choice based on the queue length is incorporated to represent the decision visitors make when moving around the site.
In the simulation, passengers are created through one of two processes. The first is by Poisson distribution with a mean equal to the hourly arrival rate at each stop of every shuttle route, which is estimated from observed data. This applies to shuttle stops that are on the interior of the event site with relatively independent demand rates. The second process creates passengers according to the output of a preceding queue process. For example, shuttle passengers at the parking lots are created based on the output of the parking lot queue process. Created passengers have a probabilistic choice of taking the shuttle or walking to their destination. This probability is based on the queue length of pedestrians waiting to board, according to an equation approximating a logistic distribution shown below in Equation 6. In the equation, the α, β, and γ parameters are calibrated according to observed shuttle/walk choices given a certain queue length. The wait time, found using Equation 7, is the number of people in the queue divided by four people per minute, which is an estimate of how fast the queue lines moved on average.


In this way it is possible to capture the choice passengers make between the shuttle and walking. If the passengers choose to take the shuttle, they are assigned to the queue at the station. In addition to passengers directly created at each station, passengers who transfer from other shuttles join the queue. These transfers are a time-dependent probabilistic choice, based on observed data. The simulated passengers at the queue will be picked up by shuttles based on the first-in-first-out rule. In the specific scenario when there are multiple lines that serve the passenger’s origin and destination, the passenger will choose the first arriving shuttle with available seats.
Queue Process 5: Shuttle Vehicle Simulation
Meanwhile, shuttles are generated and their starting times assigned based on estimated headways. Shuttles cycle through stations on their routes, and the travel time between stations follows normally distributed travel time estimates. Shuttles on both the interior and exterior of the event grounds were often delayed by pedestrian crossings. The accumulated time effect of this delay was observed through the travel times of shuttles between stops, and the variability in this delay represents most of the variance of shuttle travel times.
When a shuttle arrives at a station, it picks up passengers from the queue in accordance with remaining capacity on the shuttle. Meanwhile, passengers are dropped off from the shuttle, and the percentage of alighting passengers is based on off counts recorded by data collectors. The length of time that a shuttle spends at the stop is determined by the maximum of on and off counts multiplied by a time factor, which is validated by observed dwell times.
Data Collection
Sampling Methods
The size and duration of EAA AirVenture was such that sampling methods were routinely used throughout the event to collect representative data. The sampling took advantage of the similarity of the event across days to apply observed data from one day to multiple other days. In general, peak times did not vary from day to day, except for days with night events. Therefore, it was assumed that days with night events were similar and days without night events were similar, allowing samples of activities at different times of the day across multiple similar days. Samples of queue arrival rates, queue service times, and queue lengths were observed, and from these samples, estimates of data throughout the event were generated.
In this paper, only the Wednesday of the event week is simulated as it had the second-highest number of attendees and parked vehicles, and the schedule and traffic were representative of the other days of the week. While many visitors leave after the afternoon airshow (around 6:00 p.m.), there is also a night airshow on Wednesday ending at 10:30 p.m. Approximately 25% of the attendees remain onsite for this activity.
Traffic Flow and Queuing at Parking Lots
To capture the choices and experiences of visitors arriving at the event by car, it is necessary to collect data on the arrival rates, service times, and queue lengths on the roadways and parking lots. These data can be collected through surveillance footage or other observation of road entrances to the site, and parking lot entrances. From such data it is possible to reconstruct the arrival of vehicles, the flow of traffic on the roadways, the development of queues at parking lot entrances, and the occupation of parking spots by observing entering and departing cars in each lot combined with estimated lot capacities. Furthermore, a sample of vehicle occupancy should be taken to determine the generation of pedestrians as vehicles arrive.
Queue Arrival Rate Data at Parking Lots and Pedestrian Gates
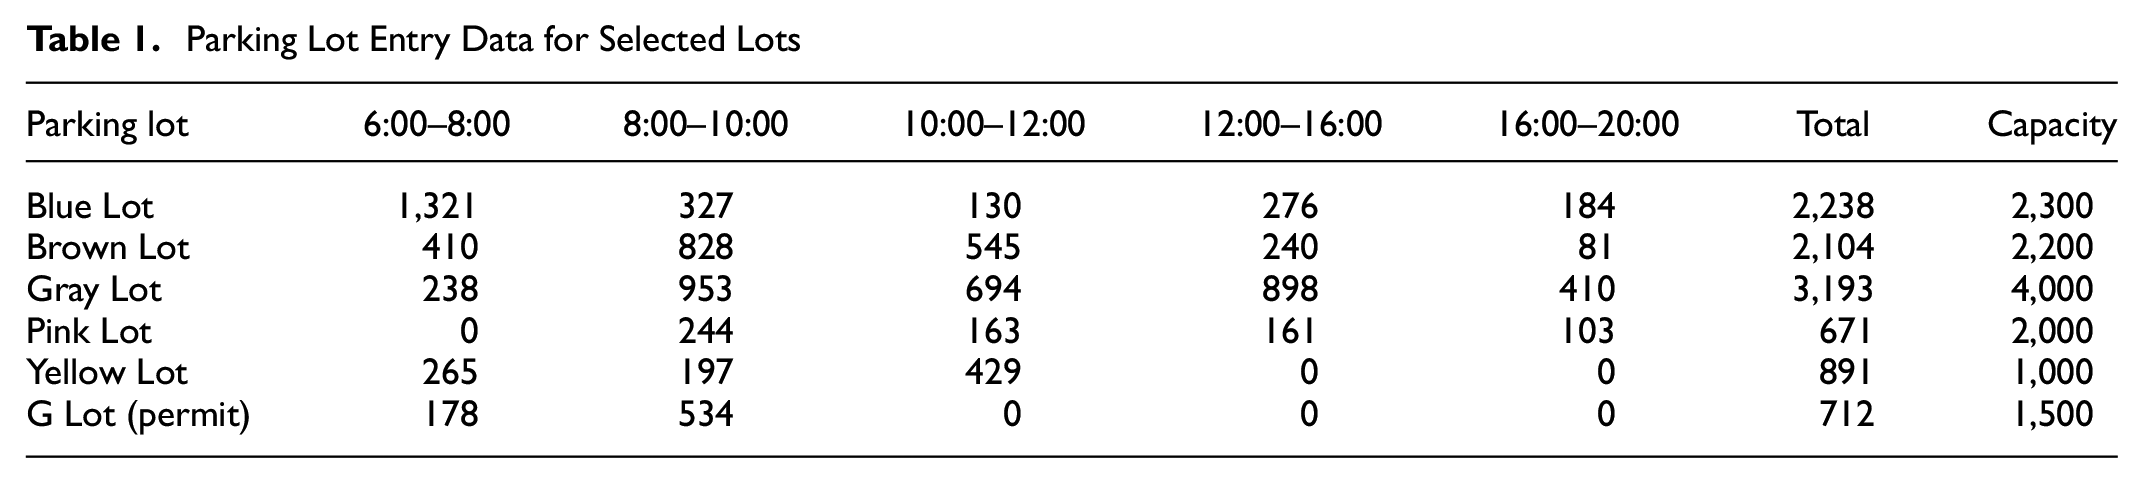
The capacities of parking lots were provided in this case by EAA based on historical data and checked using an area estimation technique with a consistent vehicle density. The data from Wednesday for selected lots at AirVenture is shown in Table 1 alongside the lot capacities. Data on the occupancy of vehicles were collected through observations of vehicle arrivals and an average occupancy of 2.5 persons per vehicle was determined.
Parking Lot Entry Data for Selected Lots
Queue Service Rate Data
Collecting data on queue service rates is essential for accurate modeling of the queue processes. Two important queues at AirVenture included parking lot entrance queues and pedestrian gate entrance queues. Data for these service rates was collected via observation from recorded video footages of visitor interaction times with cashiers.
For parking lot access during the event, visitors could either redeem pre-purchased parking passes or pay cash. Average service time for those with parking passes was substantially lower than for those paying cash, 8 s and 15 s, respectively. The percentage of parking tickets redeemed was also observed, which was 19%. Policies for increasing this percentage could accelerate cashier service times and mitigate queues at parking lots. From the service rates data, binned probability mass functions of service times (since the service times did not fit well with typical distributions) were produced. Using video footage, the service times of pedestrian queues at the main gate were examined, with two queues for ticket purchases or online ticket redemptions. A small difference in the time required to obtain a ticket was observed between the purchase and redemptions queues. Slight increases in the service times for larger groups of attendees were also observed, especially for groups of four or larger. During simulation, the service rate was randomly chosen from a probability mass function of binned service rates. The distribution data for these service rates is displayed below in Table 2.
Service Rate Data for Pedestrian Queues at Gates
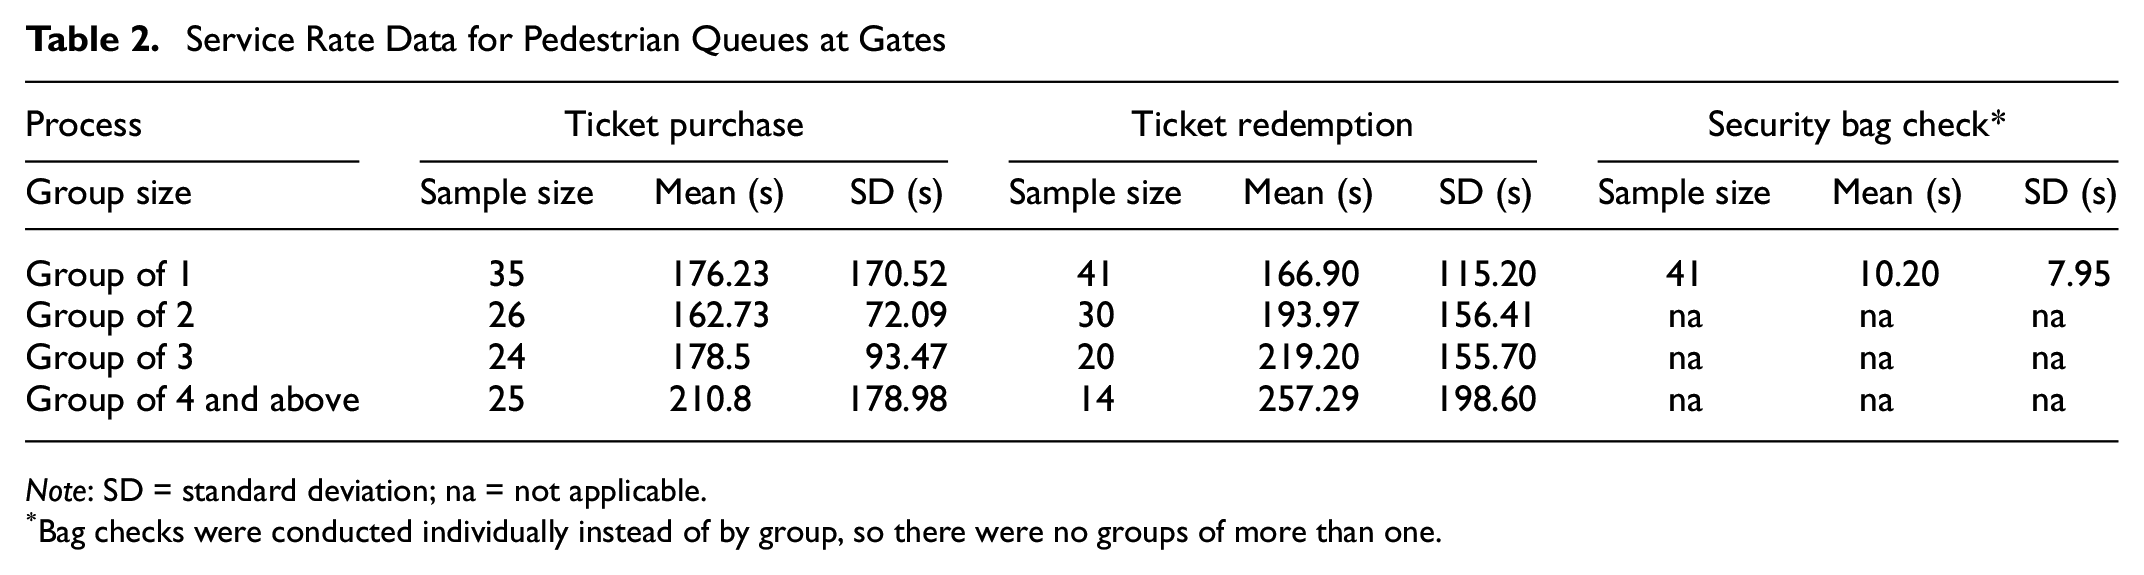
Note: SD = standard deviation; na = not applicable.
Bag checks were conducted individually instead of by group, so there were no groups of more than one.
Shuttle Data Collection
To simulate the shuttle system, characteristics of both shuttle performance and passenger movement were observed throughout AirVenture. These data can be collected through video footage at shuttle stops, or through observation aboard the shuttles themselves.
To facilitate collection of travel time data for shuttles at AirVenture, a GPS device was installed on each shuttle vehicle to track movement of trams, recording their trajectories by taking a snapshot every minute. Each full shuttle cycle was separated into travel time and dwell time at each stop, which were used in the simulation model to control shuttle movements.
Passenger ridership data were observed and reported by on-board data collectors, who collected data related to shuttle boardings and deboardings at each stop. Such data could also be collected by surveillance footage of shuttle stops.
The numbers of passengers unable to board each shuttle vehicle because of limited seats were collected and used to measure passenger arrival rates at shuttle stops. Passenger arrival rates can be estimated as the growth in queue length divided by the shuttle headway. Transfer rates between shuttles were observed at shuttle hubs from camera footage.
Scenario Definition
Using the above framework and data for modeling the EAA site, six scenarios were devised to address observed transportation problems at the event. The scenarios and a base case were simulated to test the success of each change. The base case scenario represents the existing conditions on the site for comparison with the other scenarios. The remaining six represent varied policy changes and demonstrate the flexibility of the model. The policy changes and their descriptions are as below:
Shuttle System Redesign: Under this system the network of internal shuttle lines at the site is redesigned to emphasize more frequent service to the center of the site with a minimum number of transfers. Shuttle redesign was included in all further scenarios as well.
Improved Service at Parking Lots: To reduce long queues in front of some parking lots, the number of cashiers at lots are increased by one, from between one and three per lot to between two and four per lot. Usage of pre-purchased parking passes is also increased. This improves the individual service rates of cashiers at lot entrances.
Lane Redirections and Lot Closures: Under this plan, the traffic for G Lot is redirected along Foundation Road to avoid heavily congested Waukau Avenue. Lots close to or inside the pedestrian area are closed to avoid conflicts with pedestrians, and those vehicles are redirected to nearby Blue Lot or G Lot.
Assigned Parking: Visitors currently focus on the most attractive lot that is not full, causing congestion near that lot. Instead, visitors pre-register for an assigned parking lot, eliminating the lot choice process and spreading demand for each lot throughout the day.
Alternative Parking Lot Focus: At the EAA site, about two-thirds of visitor traffic arrives at exit 116, creating congestion near the northern lots. Encouraging more traffic to use the southern exit and parking lots by increasing lot attractiveness scores reduces the volumes on northern roads and lots.
Departure Depeaking: At the end of the night airshow, thousands of vehicles leave within a half-hour time window, leading to queues of dozens of departing vehicles within parking lots. By depeaking the departure process with a less attractive activity to encourage some but not all visitors to leave later, departure wait times could be reduced.
Simulation Results
The results of the simulation framework based on queues include counts of entities served by each process, queue lengths, waiting times, and transfers on shuttles. These data can be used to evaluate various proposed changes to a planned special event without expensive real-world experiments. The insights provided also highlight the adaptability of the framework in studying many different activities and issues. First, the results were used to validate the simulation process, with queue lengths used as a comparison metric. This metric has several advantages: (i) it is easy to observe at an event and compute from the queueing processes in the simulation, (ii) its meaning is easily understood by users, and (iii) it measures a primary concern of users at the event site. If the simulation accurately reflects real-world conditions, then simulated queue lengths should approximate observed queue lengths. A sample of validation results are shown in Table 3. For the three selected pedestrian queues at shuttle hubs, it is apparent that the simulation provides good estimates of observed queue lengths.
Simulation Validation through Queue Lengths Sample

For the six policy scenarios of interest, the results are presented below through eight key performance indicators (KPIs): (i) total visitor time waiting in road congestion, (ii) time waiting in arrival lot queues, (iii) number of passengers served by shuttles (to indicate good service with short queues), (iv) time waiting at entry gate queues, (v) time waiting in shuttle queues, (vi) percentage of potential shuttle passengers who chose to walk instead, (vii) total number of shuttle transfers to indicate route effectiveness, and (viii) waiting time in departure lot queues. These outputs can be visualized in plots and tables. The KPIs were compared with the existing conditions; several examples are shown below.
Queue lengths and waiting times are often used as KPIs. Simulated queue lengths were plotted over time to compare queues developed under various scenarios. To exemplify this, queue lengths in front of one of the event’s busiest parking lots (Brown Lot) are shown below in Figure 4. This visualization demonstrates that most of the scenarios reduced the queue lengths at this particular lot. Not all did, however, as some scenarios increased the usage of Brown Lot, leading to longer queues.
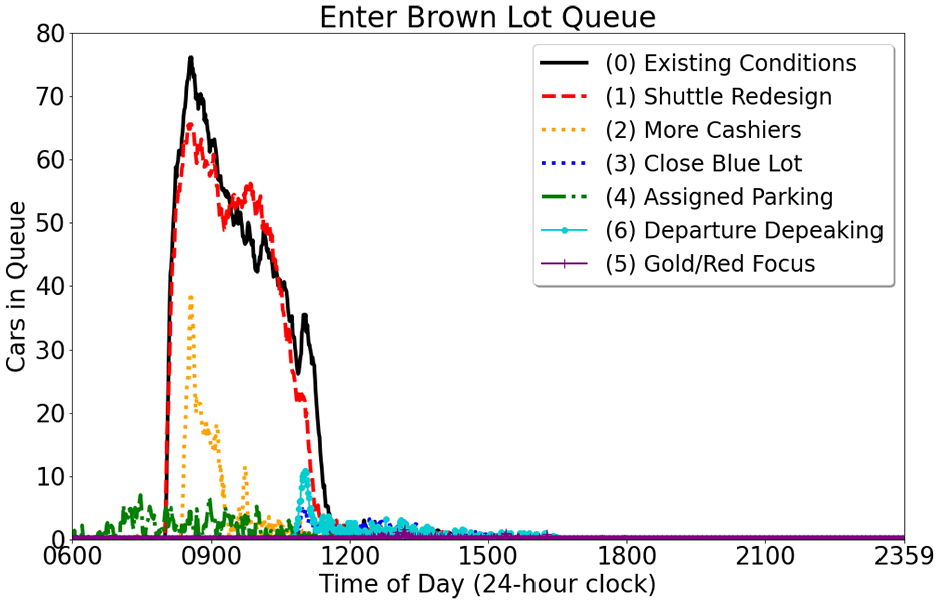
Comparison of Brown Lot entry queues for the simulated scenarios.
Individual waiting times can vary greatly, but an accumulated queue plot is a way of comparing the waiting time developed over a day between multiple scenarios for one queue. As an example, the queue time accumulated at a major shuttle stop for the site (the ATC Tower) is visualized in Figure 5, measured in a people-minutes metric. The visualization of accumulated wait time makes clear that the simulations of the redesigned shuttle systems saw shorter queues throughout the day.
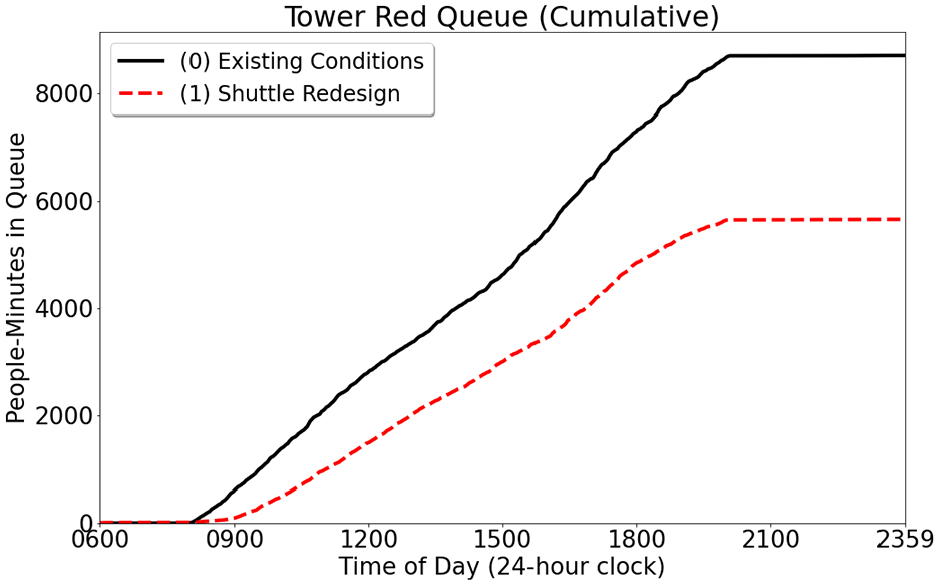
Comparison of accumulated queueing time for two scenarios at the ATC Tower.
Use and comparison of multiple KPIs makes comparison between different scenarios easy. Table 4 compares the results of the six scenarios developed for EAA AirVenture to the result values of the existing conditions scenario according to eight KPIs. By using the existing conditions as a benchmark, it is easy to see where scenarios improve or do not, creating valuable insights that may otherwise have been difficult to identify. In particular, the effect of interactions among the various system components can be captured. For example, the “more cashiers” scenario may initially look successful for its reduction of waiting time at parking lots. Instead, it increases road congestion by encouraging more visitors to use the same lots, and could lengthen gate queues as the bottleneck at parking lots is relieved.
Comparison of Key Performance Indicators for Simulated Scenario Results
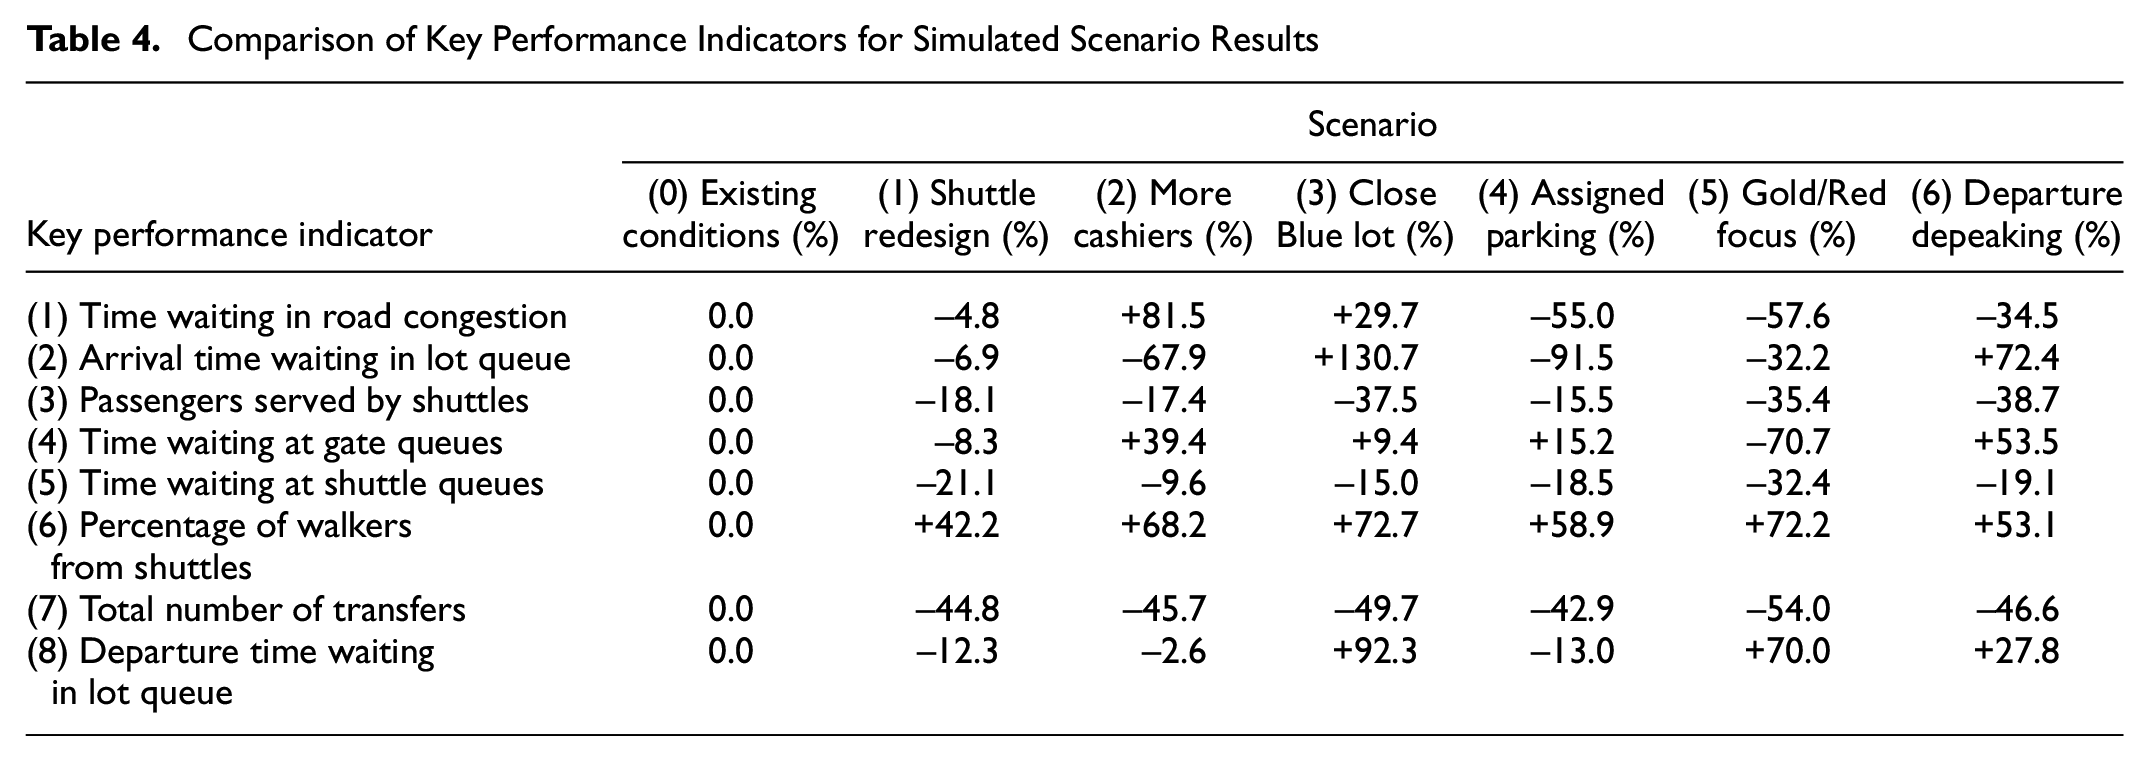
Furthermore, which KPIs are included and how they are weighted can greatly affect this comparison. Therefore, KPIs that reflect the primary goals of the policy changes should be selected. In this comparison the “Assigned Parking” policy performs the best, because it greatly reduces congestion by spreading the demand for parking lots out across lots and across the day
Summary and Conclusions
This study develops an interconnected framework of heterogeneous queues and decisions dependent on queues to simulate an array of modes, activities, and interactions among them at a large planned special event. The framework focuses on dynamic processes of arrival to a series of congested parking lots, the movement of pedestrians to and through gate queues, the use of shuttles on both the interior and exterior of the event to facilitate movement, and the interactions between modes in which upstream queues affect downstream processes. Several decision processes were also formulated to simulate the decisions that are made by visitors to the event. The simulation was validated through the comparison of results to real-world observations, and several policy scenarios were performed to demonstrate the variety of proposals the simulation could test.
Simulation of the interconnected activities that comprise a transportation network at a large planned special event offers a quick and effective way to test proposed changes of policy for the event. The framework developed in this work offers a more comprehensive way to simulate the varied activities of the network across several modes. Importantly, it captures interconnections between various system components that are typically analyzed in isolation, thus helping to identify the impact of changes in one component on the overall system. The results exemplify that numerous policy changes to different aspects of a special event can be tested and compared with each other, providing useful information to planners. The simulation methods are applicable to a wide array of special events in sports, entertainment, religion, and politics, which have similar modes and transportation processes as those developed in this study. Furthermore, the simulation employs a mesoscopic view of the site, which allows for detail of individual vehicles and visitors, while simplifying complex interactions such as microscopic vehicle and shuttle trajectories.
In any modeling study, decisions must be made about the level of detail appropriate to the processes and phenomena under investigation, and the questions that the models are intended to address. The modeling choices made in this study are appropriate for the system and event of interest. However, other situations may require different levels of representation. For instance, the macroscopic modeling of traffic flow in this work may be a limitation for other studies where more complex situations may be better reflected in a detailed microscopic simulation model. Similarly, the approach to pedestrian modeling may require greater richness in other, less organized situations, where interaction mechanisms between modes may require greater detail. The simulation framework developed focuses on pedestrian queues at entrance gates and passengers on the interior shuttle system. It does not simulate all pedestrians on the site and their movements between site activities. Interactions with other modes were modeled in a limited fashion appropriate to the system under consideration, by incorporating these interactions into existing activities. However, this method may not be sufficient for more extensive levels of interaction between modes.
Footnotes
Acknowledgements
The authors thank the EAA for their generous help with data sharing and access to the event site, specifically, Brian Wierzbinski, Jill Schumacher, Chris Farrell, and Dave Chaimson. Thanks to Ying Chen, Reut Noham, Bingyi Fan, and Aidan Sheehy for their help with data collection and processing. And thanks to Breton Johnson, Joan Pinnell, Andrea Cehaic, Goldie McCarty, and many other volunteers for their efforts during the data collection phase of this project.
Author Contributions
The authors confirm contribution to the paper as follows: study conception and design: C. Cummings, H. Abkarian, Y. Zhou, D. Tahlyan, K. Smilowitz, H.S. Mahmassani; data collection: C. Cummings, H. Abkarian, Y. Zhou, D. Tahlyan, K. Smilowitz, H.S. Mahmassani; analysis and interpretation of results: C. Cummings, H. Abkarian, Y. Zhou, D. Tahlyan, K. Smilowitz, H.S. Mahmassani; and draft manuscript preparation: C. Cummings, H. Abkarian, Y. Zhou, D. Tahlyan, K. Smilowitz, H.S. Mahmassani. All authors reviewed the results and approved the final version of the manuscript.
Declaration of Conflicting Interests
The author(s) declared no potential conflicts of interest with respect to the research, authorship, and/or publication of this article.
Funding
The author(s) disclosed receipt of the following financial support for the research, authorship, and/or publication of this article: The work for this paper is based on research that was funded by EAA AirVenture Inc. The project was called “EAA Air Show Access Logistics” and performed by the Northwestern University Transportation Center.
