



Abstract
This work deals with using time-domain reflectometry (TDR) to measure the electrical properties of roller compacted concrete (RCC). It is well known that TDR provides a non-destructive method to measure the dielectric constant toward an estimation of moisture content for soil materials. However, few studies have used TDR to determine the moisture content in concrete because of the inability to obtain TDR traces after the concrete hardens. To obtain TDR traces, a transmission circuit is initiated where a wave signal moves through the medium and reflects back in accordance with transmission line theory. In the literature, the TDR waveform has been interpreted empirically to estimate the relative permittivity (or dielectric constant) and electrical conductivity in a given material relative to the determination of associated water content. However, empirical models tend to ignore certain aspects related to the electrical properties of a medium, which has made interpretation of TDR measurements prone to systematic errors. In this paper, a new approach of test configuration and TDR response interpretation has been developed. For the test setup, the approach uses disposable metal probes that can be embedded into the concrete at different depths to obtain the TDR traces. The approach also employs the transmission line equation to estimate the dielectric constant, electrical conductivity, and reflectivity of an instrumented RCC mixture. These properties will affect the understanding of the RCC pavement behavior, especially curling and warping behavior, placement density, and development of long-term distresses.
Roller compacted concrete (RCC) pavements provide an advantageous cost alternative over conventional concrete pavements. One of the main differences between RCC and conventional concrete pavement is the dryness of RCC mix, which requires placement with asphalt-type pavers to achieve the density required for mechanical properties, while conventional concrete is placed with slip-form concrete machines or vibrating screeds. The absence of a complete understanding of RCC slab behavior, especially at an early age, limits it as a paving option on heavily trafficked roadways. Furthermore, using the current practice measurements of preplaced moisture and temperature sensors to investigate early aged behavior is not practical because of the method of construction used to place RCC pavement. Therefore, exploring a new approach to estimate the moisture profile of RCC can be vital to understand the RCC pavement behavior.
Time-domain reflectometry (TDR) provides a non-destructive procedure that has been used in the estimation of the bulk electrical conductivity as well as the water content of soil materials ( 1 , 2 ). TDR measurements are usually analyzed in two main steps; the first step is performed to estimate the electrical permittivity (dielectric constant), while the second step is performed to link the dielectric constant to the equivalent parameters such as water content. The estimation of the dielectric constant and the water content in soil has typically relied on empirical relationships based on an estimate of the apparent length of the TDR trace ( 1 ). To accurately estimate the apparent length, the probes and the coaxial cable are calibrated following manufacturer guidelines. This eliminates systematic errors from probe orientation, length, and diameter, thereby improving the estimation of the apparent length. To utilize TDR technology with different probe configurations (length, diameter, and materials), it is desirable to develop a new TDR methodology with disposable probes to obtain the TDR reflection as well as to analyze and estimate the electrical properties of the RCC. This methodology provides a reliable and practical way to measure the electrical properties of any composite material in the lab. Studying the electrical properties of the RCC will facilitate measurement methods for other properties of RCC mixes such as water content, density, and hydration rate.
Background and Literature Review
The utility of TDR measurements has often been associated with the detection of water in soil materials, as it has a higher dielectric constant than any other constituents of soil (1–3). The characterization of a TDR trace has been done with reference to transmission circuit development and calculation based on the propagation velocity of the voltage signal. This voltage signal is generally a step function with a frequency range of either 1.5 GHz or 20 kHz ( 2 ). The volumetric water content (θV, in cm3 per cm3 of soil) has been calculated based on Equation 1 in relation to the apparent dielectric constant (Ka), which is the ratio of the apparent probe length to the actual probe length ( 1 ).

The apparent dielectric constant in Equation 1 depends on the calculation of the apparent length, which can be determined in relation to the reflection coefficient and the time required for the signal to travel through the length of the probes (i.e., the propagation time) ( 1 ). Figure 1 shows representative TDR traces that are typically used to determine the travel time using Equation 2. The travel time consists of the start time t1 and the end time t2 of when the step signal enters and departs from the TDR sensor. The start and end times are associated with the first and second reflection positions numbered 1 and 2 in Figure 1, respectively. In previous research, t1 is linked with the spike and variation in the slope where a steep reduction occurs in the waveform at the first maximum voltage, and t2 is linked with the point where a sudden increase occurs in the waveform at the valley ( 4 – 6 ). The difference between t1 and t2 represents the travel time Δt (s) of the signal, which can be expressed in relation to the apparent dielectric constant, the velocity of the electromagnetic signal in free space c (m/s) and the apparent waveguide length L (m) as follows:

The physical properties of the TDR sensor are prime factors influencing the location of t1 on the TDR trace. As the TDR physical properties such as length and diameter are typically known, t1 should be constant for repeated measurements. Figure 1 shows two methods to determine the value of t1. Figure 1a shows the tangent intersection method. This method determines t1 by drawing a tangent line for the highest increasing point before the spike and the highest decreasing point after the spike and evaluating the t1 value based on the intersection of the two tangent lines (5, 6). Figure 1b shows the baseline method, which uses the intersection of the tangent line before the highest increasing point with the baseline constructed by the horizontal part at the left end of the TDR waveform (tb) plus the addition of a certain offset time tc to yield t1 = tb + tc (4, 6). For t2, the same procedure can be used or newly developed procedures such as the adaptive waveform clarification using Gaussian filters (AWIGF) described in reference ( 7 ). However, using the empirical method developed in reference ( 1 ) provides an effective and easy way to calculate all required parameters along with soil properties from TDR traces.
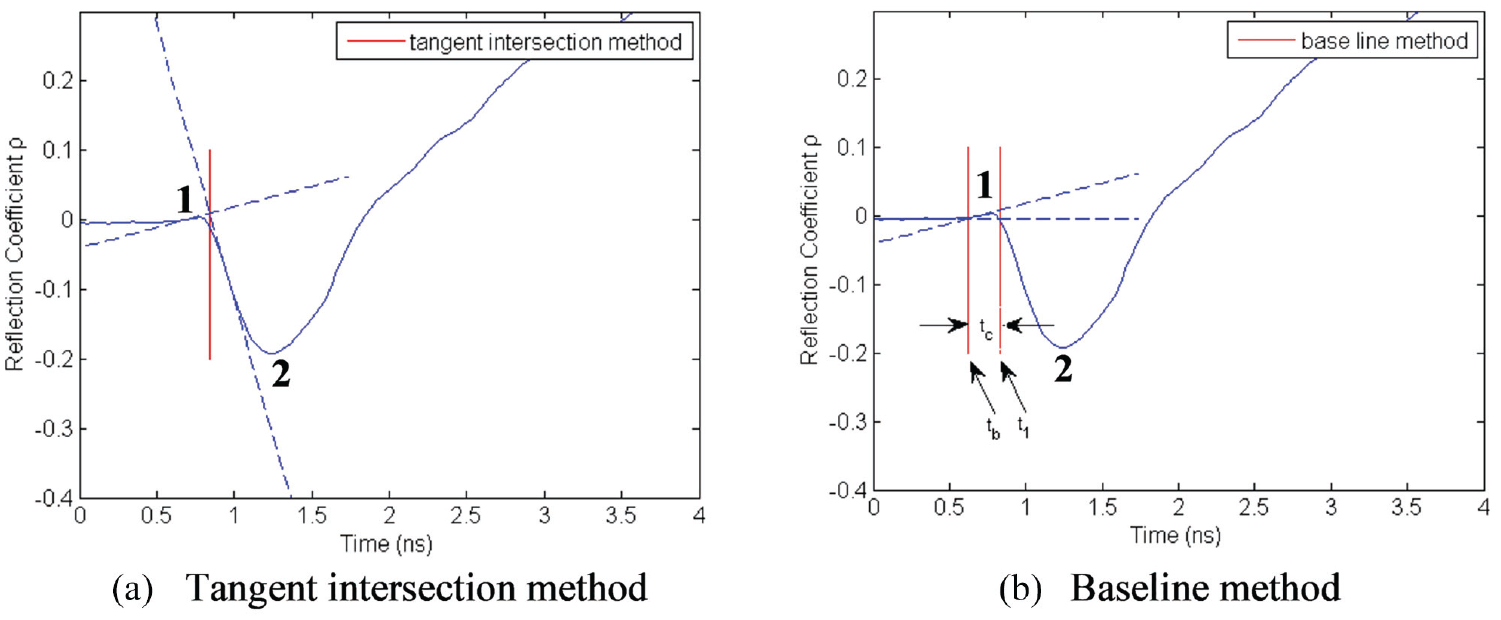
Typical time-domain reflectometry (TDR) traces and different methods to estimate t1 ( 5 ).
In this paper, the Campbell Scientific TDR 200 system with an output impedance of 50 ohms ±1% was used to obtain voltage traces. This system uses the concepts discussed earlier to determine the volumetric water content and the bulk electrical conductivity from the measured data. The relation between the volumetric water content and the dielectric constant has been explained in references ( 1 , 8 ) in both the linear and polynomial forms. The use of these expressions was automated by the output from the TDR 200, making these equations suitable for many applications. Equation 1 shows the calculation for volumetric water content in reference ( 1 ) while Equation 3 shows the calculation of the same parameter from reference ( 8 ):

Previous research has indicated that stay in place, disposable TDR probes can be used after the concrete has hardened to obtain TDR traces (9–11). In these efforts, the design of probes met manufacturer requirements for length, diameter, and spacing to facilitate accurate estimation of the apparent length and, subsequently, the associated dielectric constant. In this paper, the transmission line concept is employed to fit the TDR trace of any probe configuration to directly estimate the dielectric constant, electrical conductivity, and reflection coefficient. This will eliminate the need to calculate the apparent length and the travel time as well as the calibration of the probe.
Test Program
The application of the TDR 200 is limited to materials or media which permit the insertion of the probes. Any change in the dimensions or orientation of these probes results in uninterpretable TDR traces. Therefore, it was important to recalibrate the transmission line equation solution provided in reference ( 12 ) to adopt it for the determination of electrical properties of any material using stay in place and/or non-standard probes. The main objectives of this test program were (i) to provide preliminary data to evaluate the applicability of the proposed transmission line equation and (ii) to evaluate TDR traces of RCC specimens using disposable probes to determine the feasibility of obtaining suitable estimates of the electrical properties of RCC specimens with different aggregate gradation and curing conditions using the transmission line equation.
Instrumentation
The TDR 200 instrument by Campbell Scientific uses a pulse generator to apply an electromagnetic signal through a TDR sensor that is designed to detect a reflected response enabling determination of the volumetric water content or/and electrical conductivity ( 13 ). The TDR measurements are usually obtained by inserting the TDR probes in the material medium of interest. These probes are a waveguided extension of the coaxial cable for which reflections result from an impedance variation. Impedance variability occurs because of the geometry of the probe, which is also inversely associated with the dielectric constant of the material medium. The dielectric constant in porous media is highly sensitive to the volume of water in the media since water has a high dielectric constant. Applying a signal through a coaxial cable and into the embedded probes results in a reflection as a function of the impedance of the probe. As water has a large effect on the probe impedance, the shape of the reflection over the length of the probe is an indication of the amount of water present in the surrounding material and its bulk electrical conductivity. Figure 2 shows the TDR 200 measurement system in soil or similar materials.
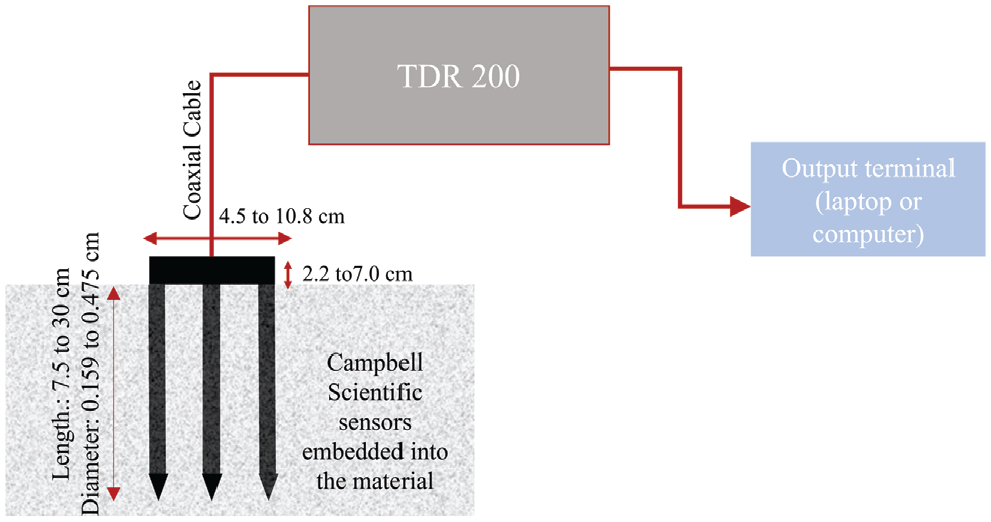
Typical TDR 200 schematic for voltage trace measurement—the schematic is not to scale.
TDR probes presented in Figure 2 are typically only usable in materials such as soil or fresh concrete, where they can be removed and reused. This same approach can be used to collect measurements for the electrical properties of RCC mixtures. However, if the mixtures begin to harden, the probe will become non-removable, and it is neither effective nor economical to use the commercially available probes provided by the manufacturer for measuring the reflection response. Therefore, carbon steel probes were inserted at multiple depths from the surface to collect TDR traces. At each depth, two disposable metal probes were horizontally spaced at 25.4 mm to record a voltage versus time trace. One of the probes was used as a waveguide, while the other was used for the reflected signal. The PC-TDR software was used to obtain the reflection trace. In usual cases, TDR measurements are obtained using a calibrated probe to accurately identify the apparent length required for the empirical calculations of dielectric constant and electrical conductivity. In this study, the electrical properties of the RCC were determined by fitting the voltage versus time trace using the transmission line equation. Therefore, the calibration of the disposable metal probes was not required. Consulting the TDR 200 manual ( 13 ), the use of 7.5 cm embedded probes was considered appropriate.
Mix Design
The soil compaction design method was employed for the mix design of RCC mixtures studied in this research. Four aggregate grades were used: ASTM C 33 No. 56 limestones, TxDOT Surface Aggregate Classification C and F rocks, as well as river sand. Coarse and intermediate aggregate types were sieved into their specific sieve size except for the river sand. Two aggregate gradations were then formed from these aggregate grades. The aggregate gradations were representatives of the specified lower limit (LL) and upper limit (UL) aggregate gradation established in the soil compaction mix design, Figure 3. The blended aggregate gradations were optimized with the lower and upper specifications considering a maximum aggregate size of 25.4 mm for both gradations. The initial RCC mix designs were developed to establish the required moisture-density relationships for both aggregate gradations. Based on commonplace practice, an initial cement content was assumed as 267 kg/m3, while the specific gravities for cement and combined aggregate were assumed as 3.15 and 2.63, respectively (based on typical mineralogy of the aggregate sources). The initial mix designs to establish the moisture-density curve are shown in Table 1.
Roller Compacted Concrete (RCC) Mix Design

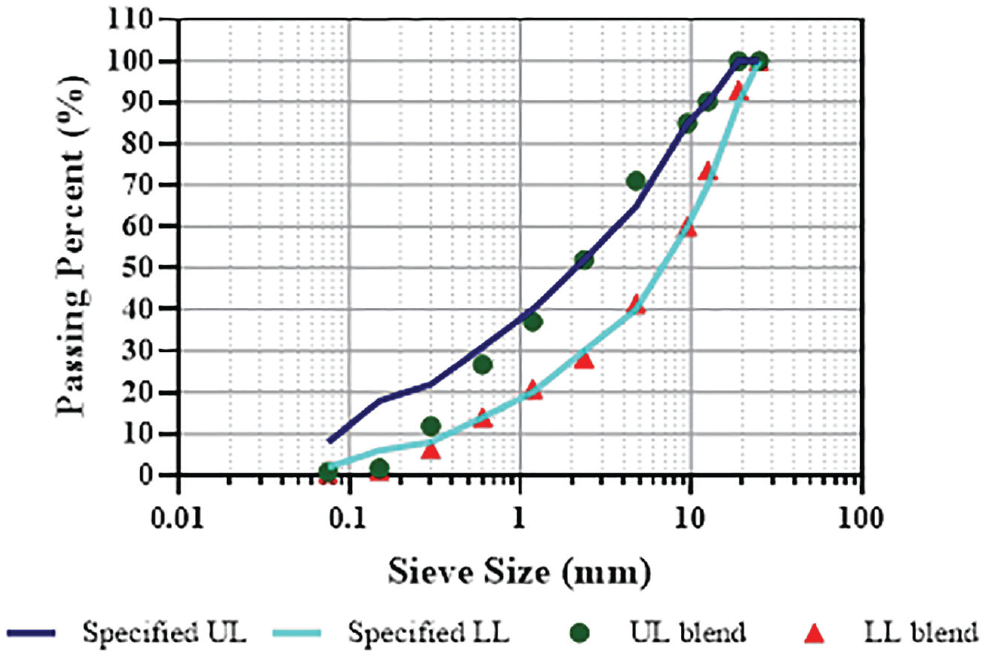
Upper limit (UL) and lower limit (LL) aggregate gradation specification of roller compacted concrete.
The Tex-113-E proctor test procedure, using the 152.4 mm diameter mold, was followed to determine the optimum moisture content at the maximum dry density of the mix. For the LL aggregate blend, a range of moisture of 4%, 6%, 8%, and 9% of the dry material weight was used to determine that the optimum moisture content is 6.1%, and the associated maximum dry density is 2,284.2 kg/m3. On the other hand, a range of moisture of 4%, 5.5%, 7%, and 8.5% was used for the UL aggregate gradation to determine that the optimum moisture content is 7.2% and the associated dry density is 2,329.1 kg/m3. Based on the optimum moisture content found from the proctor test, the initial material quantities were re-proportioned for one cubic yard (0.765 m3), as shown in Table 1.
Specimen Preparation and Test Setup
ASTM C1435 was employed to prepare four RCC cylinder specimens. The 152.4 × 304.8 mm cylinders were cast and compacted into four layers of RCC mix using a vibrating compaction hammer that matches ASTM C1435 requirements. Plastic cylinders were previously prepared for insertion of the two probes at 25.4 mm spacing by drilling holes into the plastic cylinders at 38.1 mm, 120.65 mm, and 222.25 mm from the exposed surface. The holes were duct-taped before compaction of the RCC specimens to prevent water leakage during compaction. After compacting the RCC specimens, two 88.9 mm probes were inserted through the taped holes in the plastic specimens. It was expected to have a very high electrical conductivity measurement for the RCC mix. Therefore, it was more accurate to keep probe lengths between 76.2 mm and 152.4 mm inside of RCC specimens ( 14 ). Economical and disposable metal probes were used to satisfy the requirements of probe length, being widely available, and stiff enough to withstand insertion into the dry RCC mix. The main obstacle was to secure a parallel insertion of probes. Therefore, a drill with a small bit size was used to make an insertion path before placement of the metal probes. The material was re-compacted after the insertion of all metallic probes to ensure the material–probe contact. A length (i.e., 19 mm) of the metal probes at the end was kept exposed for connection (via alligator clips) to the coaxial cables for taking measurements. Figure 4 shows a schematic representation of the specimen preparation. First-day measurements (1 day) were taken at different depths from the exposed surface within 1 h after mixing and compacting the RCC specimens.
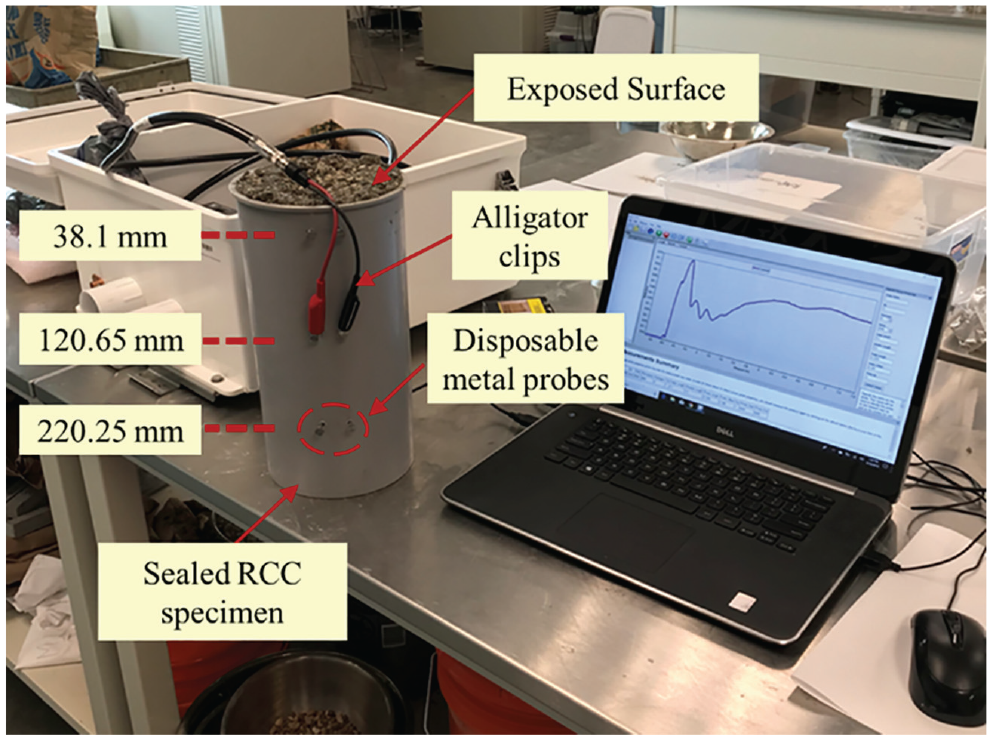
The proposed test setup.
Dielectric Measurements
The dielectric determination was investigated with respect to the aggregate gradation and the curing of the RCC specimens. The test specimen matrix is shown in Table 2. To investigate the time-dependent dielectric at different specimen depths, each aggregate gradation was subjected to two curing methods, which were air curing and moisture room curing. The one-dimensional water diffusion in RCC was modeled by exposing only the top face of the cylindrical specimen to the given method of curing. This one-dimensional diffusion process was preserved throughout the time of measurement by casting the concrete into 152.4 × 304.8 mm plastic cylinders and preventing water evaporation from the specimen’s sides and bottom. Two of the specimens were placed at a room temperature of 20°C and a relative humidity of 35 ± 5% to air dry, while the other two specimens were placed in the moisture room at 95% relative humidity and 20°C.
Test Matrix
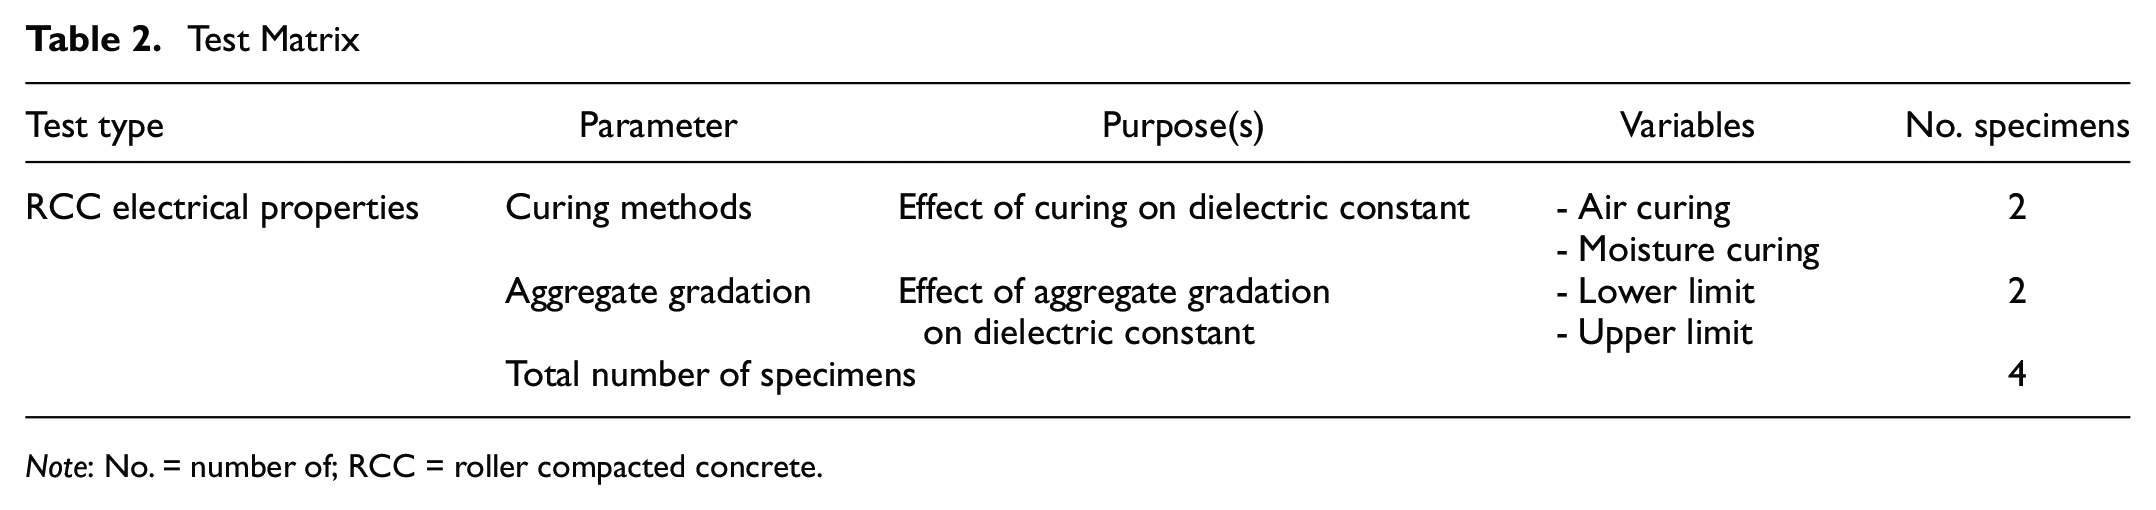
Note: No. = number of; RCC = roller compacted concrete.
Concrete is considered a dielectric material that resists electrical transmission through its components. Dielectric has been defined as the ratio of the composite material’s electrical permittivity to the air electrical permittivity ( 8 ). Therefore, the dielectric constant measurement can also provide information about the electrical properties of the concrete material, such as reflectivity and conductivity. As mentioned in references ( 14 , 15 ) and many others, water has the highest dielectric constant compared with other concrete constituents. Therefore, it has the highest impact on the dielectric measurements in the concrete materials. The dielectric constant of fresh concrete should result in a high dielectric constant compared with its value after a few hours. This is because free water in concrete initiates a chemical reaction (hydration) with the other components of the mixture to form the hardened concrete phase. As the hydration process continues, the free water content becomes lower, and therefore the dielectric constant becomes lower for the concrete material.
Research Methodology and Results
The basic approach proposed for determining the dielectric constant at different depths of hardened RCC is based on fitting the TDR voltage trace with the transmission line equation ( 12 ). The main features of this approach require:
Capture of the trace of voltage versus time from the TDR measurements.
Fitting of the transmission line equation and determination of the reflectivity Γ, conductivity σ, and composite dielectric constant ε parameters.
Transmission Line Equation
TDR voltage measures are analyzed for the material dielectric parameters such as dielectric constant, conductivity, and reflectivity calculated using the transmission line equation ( 12 ). Because this research uses non-manufactured probes to capture the voltage trace, it was important to use a method that considers all the noise that might affect the dielectric constant measurements. The expected noise can be any systematic errors such as probe orientation, probe length, probe spacing, or assumption of the unity of the RCC mixture magnetic permeability. To reduce such noise affecting TDR dielectric determination, the electrical properties of the conducting medium are vital. Therefore, the transmission line equation, shown below, was employed to fit the voltage trace calculated by the transmission line equation to the voltage trace measured from the TDR equipment, enabling the calculation of the dielectric constant, electrical conductivity, and reflectivity of the material. This equation accurately reflects the actual physics of wave transmission through a dielectric medium and determines the conductivity and reflectivity as well as the dielectric constant of the surrounding medium. The equation to calculate the relative voltage in relation to travel time can be expressed as by Lee et al. ( 12 ):

where
v(t) is the relative instantaneous voltage in relation to time travel of microwave,
σ is the material conductivity (siemens per meter),
t is time in seconds,
ε is the dielectric constant of the composite material (i.e., RCC),
ε
0 is the electric permittivity of free space and is equal to
Γ L is the amplitude of the reflected wave to the incident wave or reflection coefficient, and
ω is the angular frequency (Hz) of the voltage signal.
The above equation represents the relative instantaneous voltage on the transmission line for a lossless standing-wave pattern that includes multiple wave cycles, as shown in Figure 5. In the case of time-domain reflectometer measurements, probe length is relatively short, and the medium is not lossless, which means that the maximum and minimum voltage is captured whenever the electromagnetic field enters and exits the metal probe. Afterward, the trace starts to decay because of the impedance presented in the RCC mix. Because the equation above is meant to calculate the electrical conductivity, electrical reflectivity, and dielectric constant, an additional component is required to be known, which is the angular frequency. In this study, the relative instantaneous voltage was converted into a relative voltage by omitting the cosine term that includes the angular frequency and introducing the voltage decay in a lossy medium as discussed subsequently.

Electromagnetic wave voltage (V) in a lossless medium.
In Figure 5, the portion of the wave labeled 1 represents the first term in the equation, which is the curve from the maximum voltage value to the minimum voltage. The portion labeled 2 starts after the first minimum voltage and is controlled by the reflection part of the transmission line equation, which can be evaluated using the reflection coefficient. The reflection coefficient in materials can be defined as the amount of reflected electromagnetic wave arising from the impedance discontinuities of the transmission medium, and it usually ranges from −1 for a short circuit to +1 for an open circuit ( 16 ). Equation 4 solves for both parts as a continuous equation, which suggests considering the reflectivity coefficient in both parts of the curve. However, this equation must be modified to allow for the reflection coefficient to be a function of the distance or time. Therefore, a generalization for the reflection coefficient as a function of distance was introduced in reference ( 16 ). This generalization is significant in evaluation of the reflection that occurred because of the impedance discontinuities throughout the voltage travel time. Based on this generalization, the amplitude of the relative voltage as a function of distance can be expressed as:

The nature of the reflection wave depends mainly on the reflection coefficient. The resistor–capacitor circuit, formed by the existence of aggregate, cement, and water, suggests that the voltage will decay exponentially directly after the minimum voltage is achieved. This decay can be explained by the resistance of the aggregate and the hydrated cement, which reflects most of the electromagnetic waves. As concrete hardens, more reflection (i.e., resistance) is expected. Therefore, it is acceptable to represent the second part of the equation as a complement to the first term. Using the maximum voltage case described in reference ( 16 ), the previous equation can be represented as:

In the above equation, the first term is used to estimate the dielectric constant and electrical conductivity of the incident wave (wave initiated from the source), while the reflection coefficient is measured from the second term, which represents the reflected wave affecting the propagation constant (

Fitting TDR Traces
The TDR voltage measurements were taken using the BNC (Bayonet Neill–Concelman) female alligator test clips attached to the exposed metal probes. The BNC female alligator clips were attached to a 3.05 m coaxial cable connected to the TDR 200 instrument. The TDR instrument was connected through a USB port to a laptop. The measurements were taken at three different depths for 3 days. The voltage versus time responses were extracted and cleaned to evaluate the effect of aggregate gradation and curing on the electrical properties of the RCC mixture. Two aggregate gradations were used to cast RCC cylinders. These aggregate gradations were used to represent the LL and UL of the dense graded aggregate specification for an RCC mixture.
Figure 6 shows the effect of the aggregate gradation and curing on the voltage trace at a depth of 38.1 mm from the exposed surface. Specimen 1 refers to a specimen with no curing, and specimen 2 refers to a specimen with curing. The cured specimens were placed throughout the testing time in a chamber room with humidity of 95% and a temperature of 20°C. As shown in Figure 6, the aggregate gradation has a plausible effect on the voltage reflection with time. The following observations can be drawn about the aggregate gradation from Figure 6:
The initial maximum voltage in UL aggregate gradation is higher than the initial maximum in LL aggregate gradation.
The minimum voltage increases gradually with time in specimens with UL aggregate gradation, while minimum voltages are almost the same for all time measurements in specimens with LL aggregate gradation.
The maximum voltage in the reflection part is gradually increasing with time for specimens with UL aggregate gradation, reaching the initial maximum voltage after 3 days. On the other hand, the maximum voltage after reflection for the specimen with LL aggregate gradation is higher than the initial maximum voltage starting the second day. Also, no significant differences are noticeable in the reflection between the second and third days for specimens with LL aggregate gradation.
Moreover, curing seems to have a significant impact on the voltage traces. The effect of the curing is clear, specifically in Figure 6b, the LL aggregate gradation mix. Although the maximum and minimum voltages in the first part seem equal regardless of the curing, a big difference in the voltage after reflection is presented, especially on the first and second day, between cured and non-cured specimens. In contrast, voltage reflections are not significantly affected in specimens with UL aggregate gradation for which the voltage after reflection of the cured specimen is slightly lower than that of the non-cured specimen. In this case, the effectiveness of curing is related mainly to the depth of the measurement. As depth increases, the effect of curing decreases and vice versa. This can be noticed in the first-day voltage traces in Figure 6a. In general, curing showed a higher impact on specimens with LL aggregate gradation than on specimens with UL aggregate gradation.
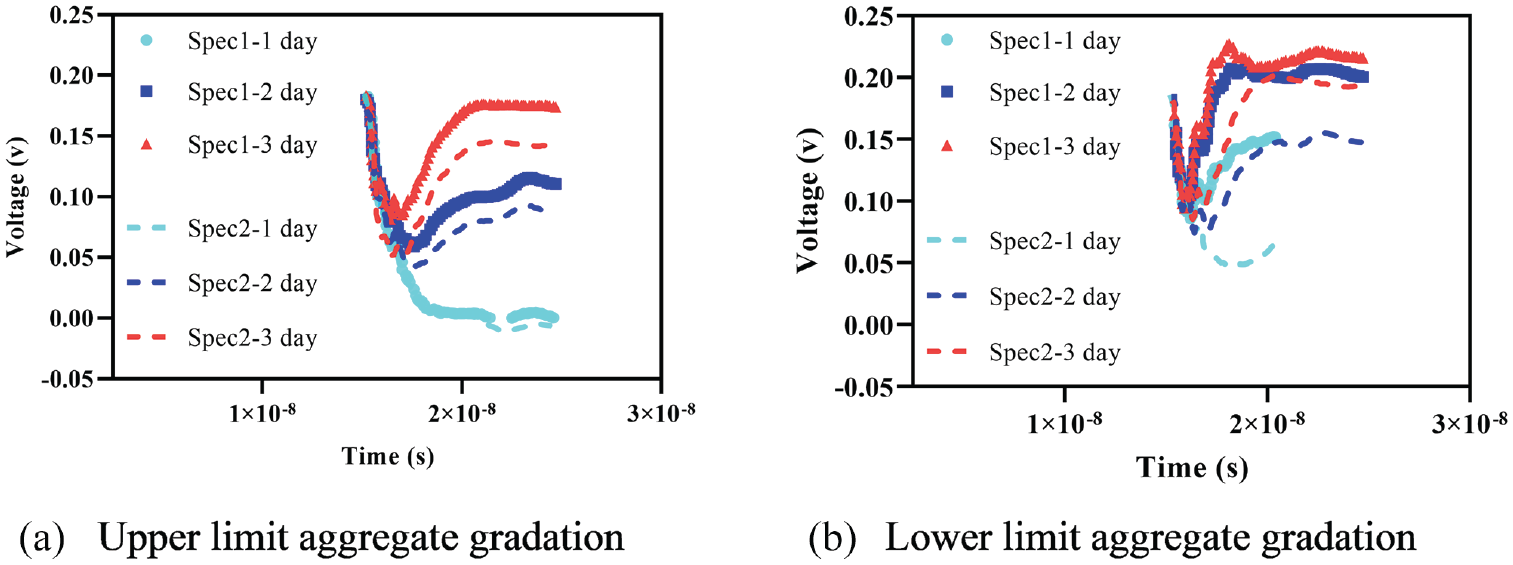
Voltage versus time measurements at 38.1 mm. from surface for different aggregate gradation and curing.
Figure 7 shows the typical voltage versus time traces and their transmission line (TL) equation fitting for 3 days at 38.1 mm from the exposed top surface. The presented measurements are taken from the RCC cylinder of the LL aggregate gradation with no curing (i.e., specimen 1). The nonlinear least square method was employed using a MATLAB code. The values of R-squared are 0.94, 0.96, and 0.91 for the first-day (i.e., 1 h after compacting the RCC), second-day, and third-day measurements, respectively.
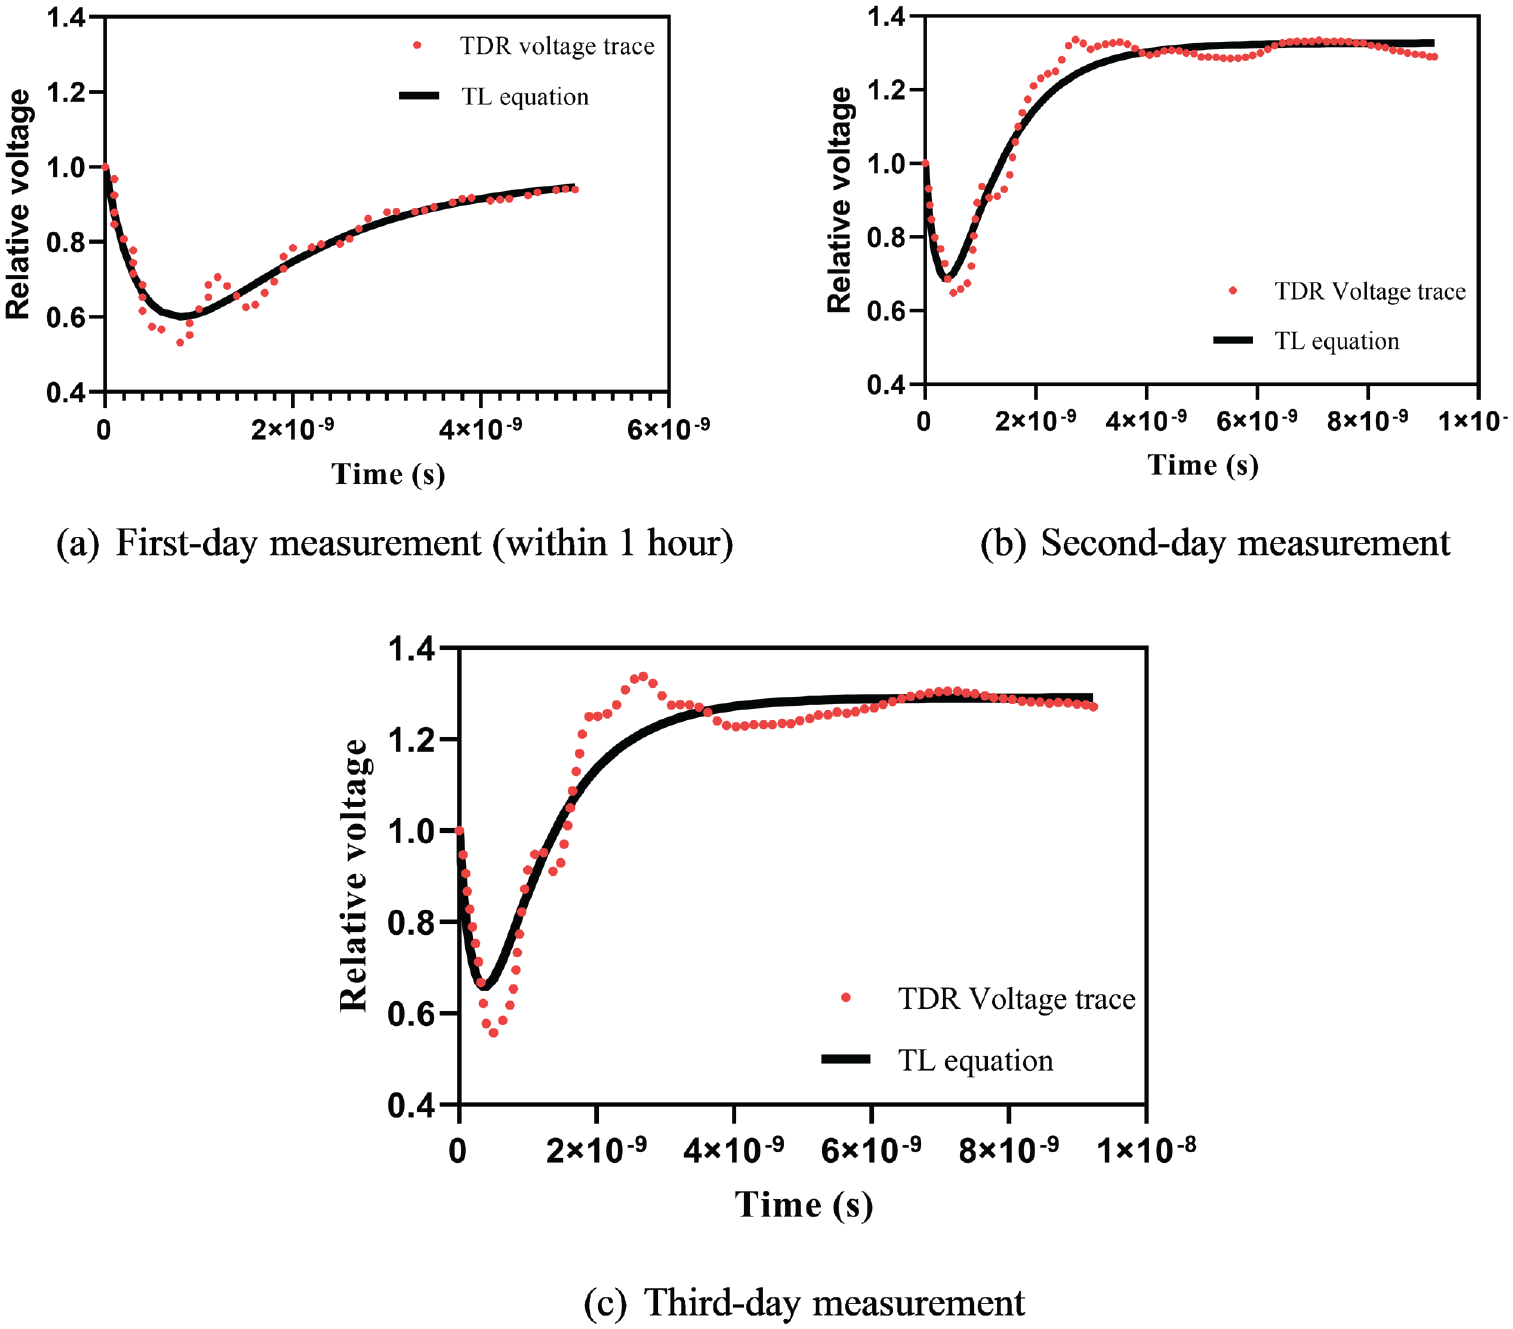
Voltage versus time measurements and fitting of lower limit aggregate gradation specimens at 38.1 mm from the exposed surface—specimen 1.
As shown in Figure 7, the voltage traces exhibit the same behavior, and the lowest minimum voltage is recorded on the first day. Similar traces were also captured for measurements at 120.65 and 220.25 mm. After the first day, the difference between the maximum and minimum voltage records significantly decreases, which indicates a decrease in the dielectric constant. Another significant effect is observed in the second part of the chart, which indicates the reflectivity of the RCC mixture. As shown in the figure, the maximum voltage in the reflection part on the first day is lower than the initial maximum voltage. In the second and third days, the maximum reflection voltage is higher than the initial maximum voltage, which can be related to the continuous hardening of the RCC specimen. The TDR traces of the RCC samples with UL aggregate gradation exhibit the same behavior. However, the voltage versus time relationship shows a gradual difference with age. Only the third-day measurement shows equal or slightly higher maximum reflection voltage compared with the initial maximum voltage. In general, the difference between the maximum and minimum voltage is the lowest for measurement at 38.1 mm from the surface compared with measurements at 120.65 and 220.25 mm. This indicates that the rate of hydration and the loss of free water is much higher at 38.1 mm than at 120.65 mm and 220.25 mm.
Effect of Reflectivity
Figure 7a shows that the relative voltage of the second portion of the curve is lower than the initial relative voltage. However, it becomes higher than the initial relative voltage on the second and third day, as shown in Figure 7, b and c . This may be connected to the reflectivity of the aggregate content, density of the layer, and cement hydration. The aggregate and density affect the reflectivity on the first day. However, as the hydration process continues, an insulating layer usually forms around the pore water within the cement paste ( 17 ), which consequently increases the reflectivity of the RCC mix. This can explain the TDR traces in Figure 7. The first-day reflection shows a lower voltage than the initial maximum voltage, which means that the insulating layer has not been established yet. On the second and third days, reflection voltages are higher than the initial maximum voltage, which can be explained by the formation of the isolation layer around the pore water along with the presence of a high percentage of coarse aggregate and the material density.
Electrical Properties of RCC
The fitting process was conducted on all UL and LL aggregate gradation specimens. Table 3 shows the measurements of the LL aggregate gradation specimens with age and depth. The table shows the dielectric, material conductivity, and reflectivity as well as the R-squared for each measurement. In the table, specimen 1 refers to the specimen with no curing, while specimen 2 refers to the specimen with curing. It is worth remembering that first-day measurements were taken 1 h after compacting the specimen.
Electrical Properties of Roller Compacted Concrete Specimens from Fitting Voltage versus Time Traces: Lower Limit Aggregate Gradation
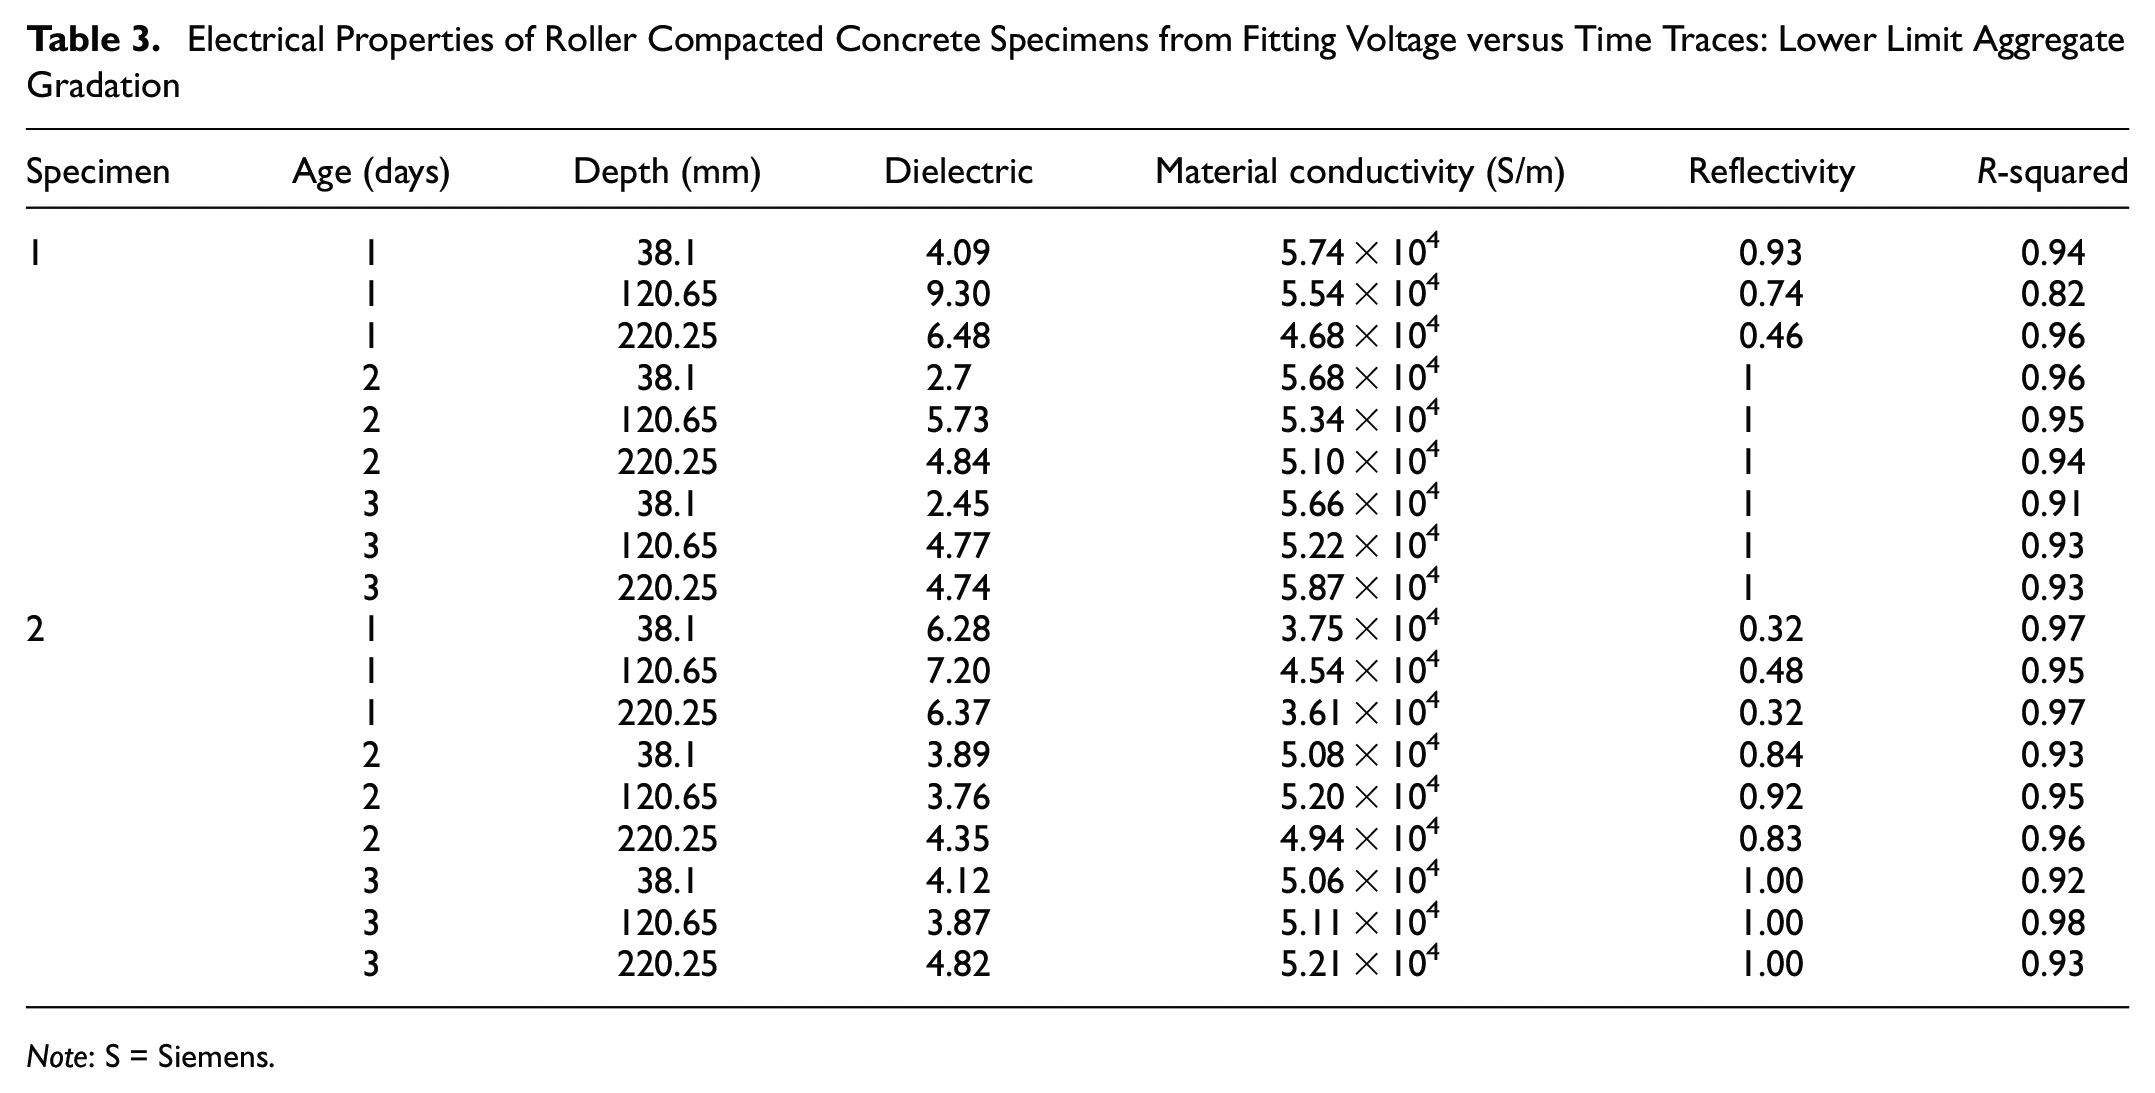
Note: S = Siemens.
The overall trend of the dielectric is decreasing with time, as shown in Figure 8. The rate of decrease in the dielectric constant with time is dictated by the ability of the RCC mix to retain moisture after casting. Retaining the moisture may be affected by the aggregate gradation, the presence of curing, and the depth of the measurement. As shown in Figure 8, a and b , for LL aggregate gradation, specimen 1 with no curing shows the lowest dielectric constant values at 38.1 mm from the surface compared with dielectric at 120.65 mm and 220.25 mm. Specimen 2 with curing shows a decrease in the dielectric constant on the second day but not on the third day regardless of the depth of the measurement, which might demonstrate limited moisture loss compared with specimen 1. In Figure 8, c and d , which represent the dielectric of the UL aggregate gradation, the dielectric constant changes significantly after 3 days. In Figure 8c, the decrease in dielectric constant at depth 220.25 mm is the steepest compared with the other two depth measurements. In Figure 8d, all depth measurements show almost the same rate of decrease in the dielectric constant.
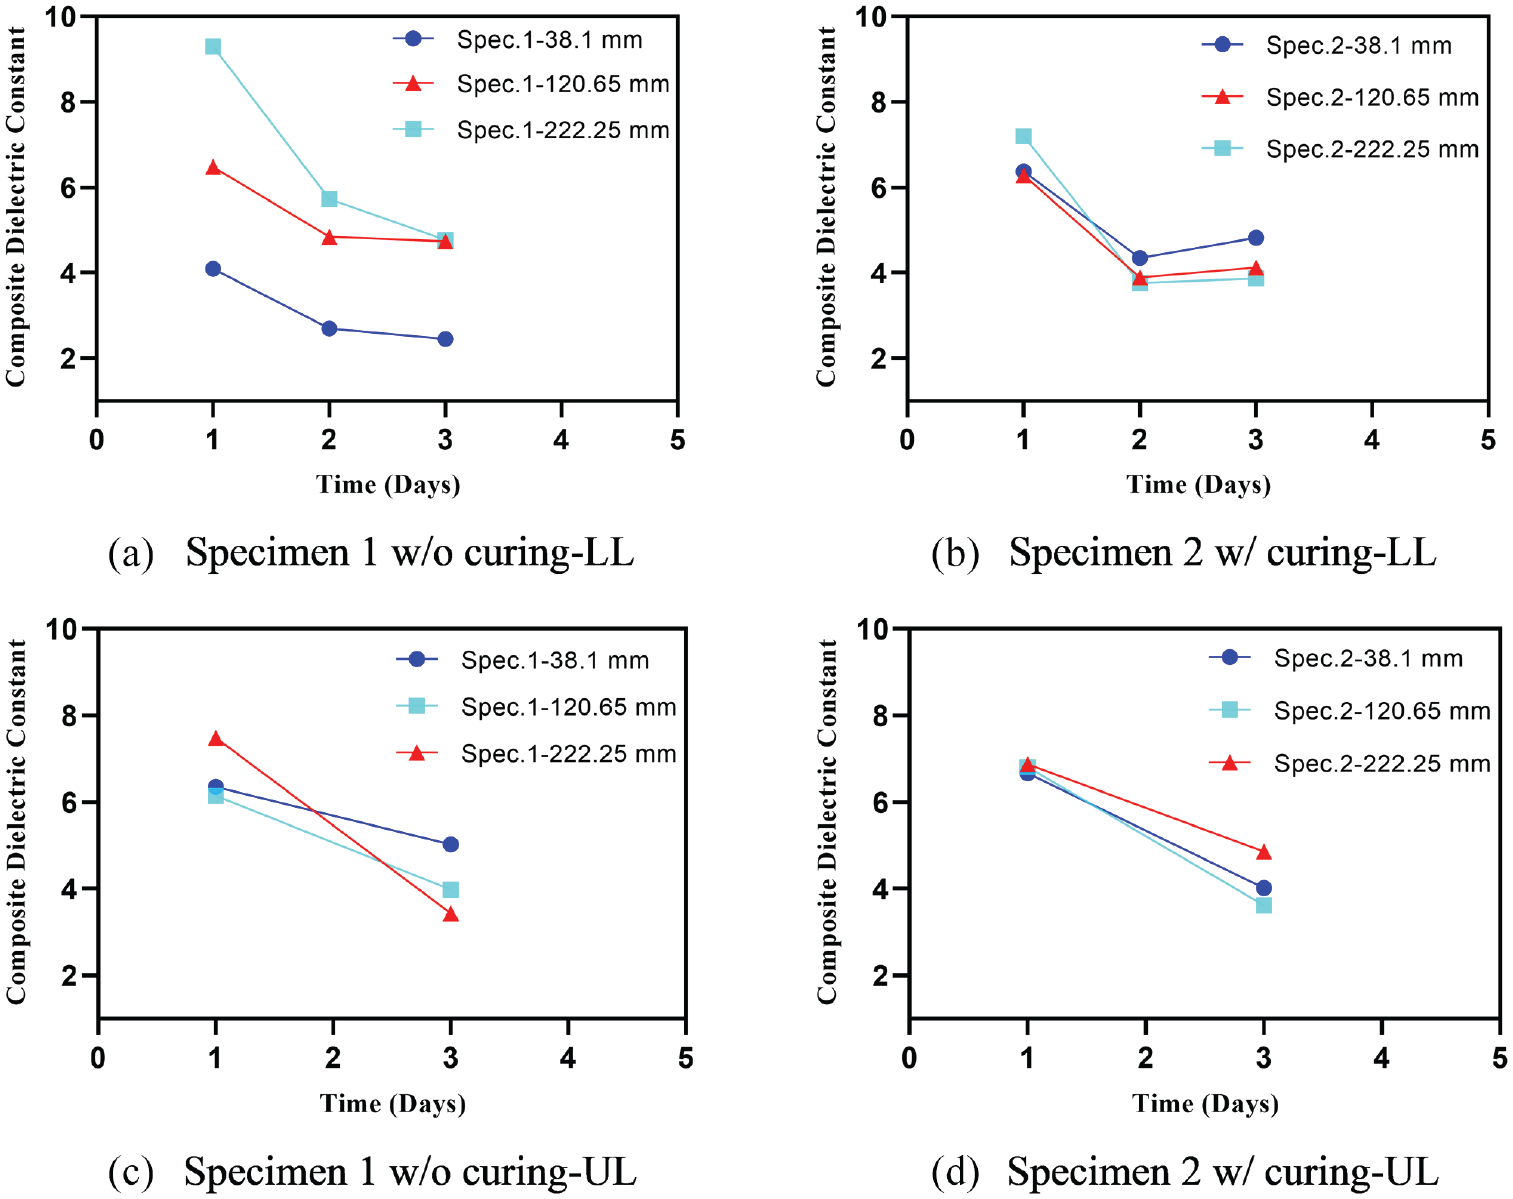
Dielectric constant of specimens with a lower limit and upper limit aggregate gradation.
Material conductivity shows an inverse proportion with dielectric constant. As the dielectric constant increases, the conductivity decreases. This relationship is important because it indicates the accuracy of the measured dielectric constant, which is directly related to the moisture content. Figure 9 shows the trend of the material conductivity of the LL and UL aggregate gradation. Unlike dielectric constant, conductivity was calculated with respect to the age only by taking the average of measured conductivities at all depths at each age. Figure 9a shows that the specimen with no curing (i.e., specimen 1) has a steep increase of conductivity, especially after the first day, which is relevant to the decrease in the dielectric constant shown in Figure 8a. On the other hand, the specimen with curing shows no significant increase in the average conductivity over the 3-day period. Figure 9b shows linear relationships between conductivity and age in both specimens, which emulates the linear decrease of the dielectric constant in Figure 8, c and d. Figure 9b also shows no large differences between specimens 1 and 2. However, the specimen with curing (i.e., specimen 2) starts with lower conductivity on the first day and ends with higher conductivity on the third day than the specimen with no curing (i.e., specimen 1).
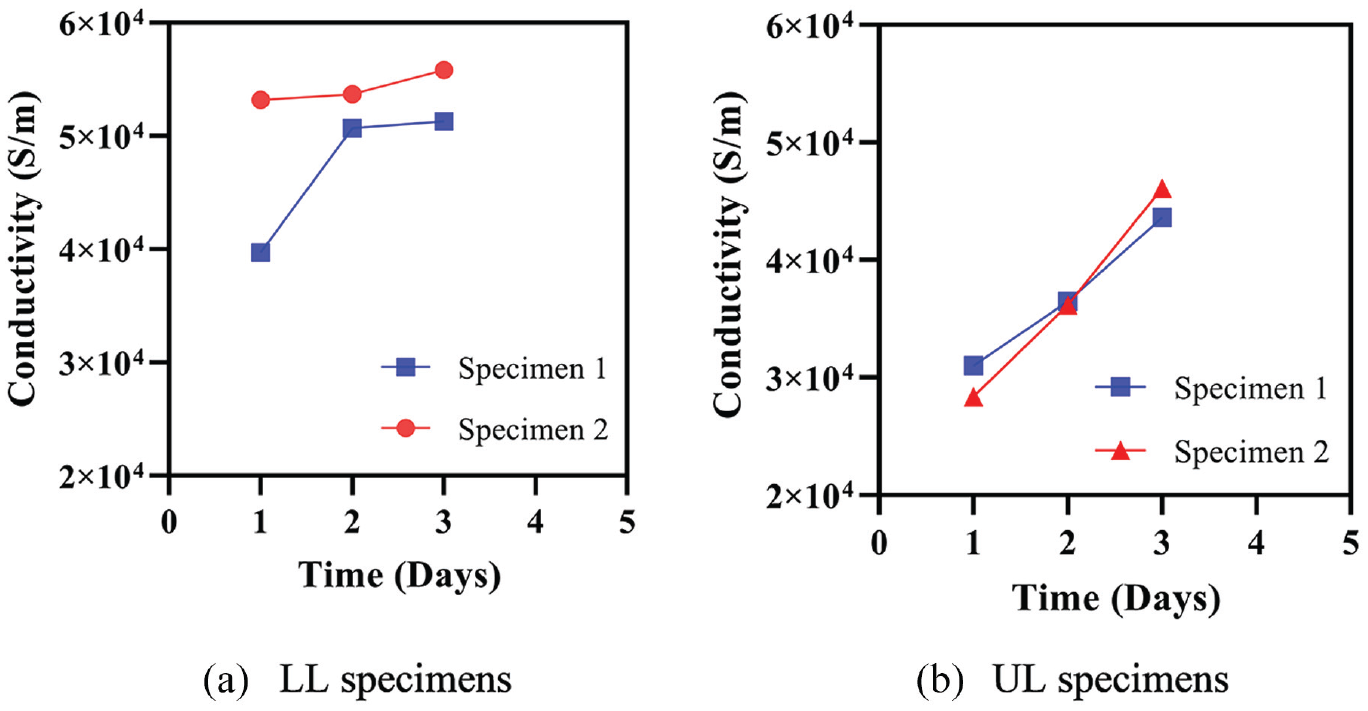
Material conductivity of specimens with a lower limit and upper limit aggregate gradation.
Conclusions
A new methodology to measure voltage trace from the TDR and a modified TL equation for determining the electrical properties of RCC specimens is developed and proposed in this paper. The proposed methodology revealed the following points about the electrical properties of RCC specimens:
The new methodology depends on fitting the voltage trace from the TDR by the TL equation in relation to conductivity, reflectivity, and dielectric constant, which does not require probe calibration. This allows for a wide range of materials to serve as disposable TDR probes without inducing systematic errors related to probe calibration and materials.
The TL equation presents an accurate and practical way to determine the dielectric constant at different depths from the surface. Instead of using empirical equations to estimate it, other electrical properties such as electrical conductivity and reflectivity serve as a determinant for the dielectric constant.
The voltage traces from the TDR are highly affected by the aggregate gradation and the curing method. The UL aggregate gradation shows a much more gradual change of voltage traces with time compared with the LL aggregate gradation. Also, the curing method has a high impact on the TDR voltage trace, especially in the LL aggregate gradation, which indicates the importance of curing for RCC pavements. LL aggregate gradation contains a higher percentage of coarse aggregate, which allows faster water loss than UL aggregate gradation. This result suggests applying an efficient technique of curing as well as maintaining aggregate gradation close to the UL.
The overall trend of the dielectric is decreasing with time while conductivity is increasing with time. Dielectric values are affected by the compaction effort (in the case of RCC mix) or/and the hydration of cement. Conductivity is affected by the presence of ions in the pores, which can be used as indications for the accuracy of the dielectric values. Because of the dryness of fresh RCC mix, the investigation of the RCC dielectric and conductivity on the first day is important and should be studied.
In general, high dielectric and low conductivity mean the RCC is holding the moisture and limiting movement—typical of the uncured concrete and the high-water content because of bleeding. As the water begins to move, the dielectric drops, and the conductivity goes up. The coarser the aggregate gradation, the more readily the RCC will allow water to move through it because of less surface area (type of aggregate would affect this as well because of the effect of surface energy). A finer aggregate and greater surface area hold the moisture for a longer period of time and keep the dielectric higher and the conductivity lower.
Using the TL equation to fit the voltage traces obtained from the TDR 200 was found appropriate and applicable for different RCC mixes and curing methods. Improvements in the collection and cleaning of the TDR traces will increase the accuracy of the modified TL equation. The current study does not address the variability of the results from the proposed test setup and RCC mixing. Future work will include additional testing of materials to evaluate the proposed methodology further.
Footnotes
Acknowledgements
The authors gratefully acknowledge the financial support provided by the RCC Pavement Council Fellowship. The authors also thank Mr. Jason Ritter from Campbell Scientific for providing technical information about the test setup.
Author Contributions
The authors confirm contribution to the paper as follows: study conception and design: Issa M. Issa, Dan G. Zollinger, and Robert L. Lytton; data collection: Issa M. Issa; analysis and interpretation of results: Issa M. Issa, Dan G. Zollinger, and Ibrahim Onifade; draft manuscript preparation: Issa M. Issa, Dan G. Zollinger, and Ibrahim Onifade. All authors reviewed the results and approved the final version of the manuscript.
Declaration of Conflicting Interests
The author(s) declared no potential conflicts of interest with respect to the research, authorship, and/or publication of this article.
Funding
The author(s) disclosed receipt of the following financial support for the research, authorship, and/or publication of this article: Financial support was provided by the RCC Pavement Council Fellowship.
