



Abstract
This study examined the visual characteristics of drivers with color weakness to improve their safety while driving. Significantly affected by the traffic environment, drivers with color weakness are not able to recognize traffic lights rapidly and accurately, which endangers traffic safety. In the first part of the research, through a static visual recognition test of color vision using the orthogonal method, the study explored the influence of light intensity, visual recognition distance, and color weakness type on the perception of traffic light colors by participants with color weakness. In the second part, a dynamic visual recognition test of color vision was conducted through simulating the driving environment of urban roads. Eye movement indexes between participants with color weakness and those with normal vision were analyzed by means of different vehicle speeds and time periods. The results indicated that the type of color weakness was the dominant factor affecting visual recognition of traffic lights. The eye movements of participants with deuteranomaly were close to those of people with normal vision, whereas the eye movement index of those with protanomaly and dyserythrochloropsia were significantly different. Distraction, slower responses, and higher color recognition error rates for the traffic lights were major characteristics—all representing risks that increase at night. To reduce the probability of road traffic injury, the driving safety of people with color weakness should be addressed.
The incorrect operation and judgment of drivers are considered to be primary factors that cause traffic accidents ( 1 , 2 ). Approximately 1.3 million fatalities occurred in traffic accidents worldwide each year ( 3 , 4 ). Ninety-five percent of fatal accidents have been found to be caused by incorrect operation of drivers ( 5 ). The personal condition and ability of drivers are considered to be important for driving safety, especially for drivers with acquired color vision defects. Drivers with limitations to their color vision (for brevity referred to as “color-weak” or “color weakness”) are a relatively distinct group of drivers. Approximately 50% of color-weak drivers admit to experiencing difficulties distinguishing the colors of traffic lights and those of front brake lights ( 6 , 7 ). This can easily lead to wrong judgments and incorrect operations, which can result in traffic safety problems. Thus, it is worth investigating the relationship between the visual recognition of traffic lights and the driving behavior of a color-weak drivers.
The relationship between the visual characteristics of drivers and their driving behavior has been investigated by scholars around the world. Drawing on their visual, auditory, tactile, and olfactory abilities to obtain road information, drivers can make accurate judgments and decisions while driving, however, over 80% of the external information needs to be captured by vision ( 8 ). Thus, the visual system, as the main access point for obtaining information, plays a very important role for drivers ( 9 ). Through eye movement tests, research has analyzed the gaze distribution and other indicators to explore the relationship between drive visual characteristics and driving behavior. As gaze and saccade behavior highly affect driving behavior ( 10 – 14 ), the visual search focus, gaze point distribution, frequency sweep range, and other indicators in different driving scenarios have been utilized to distinguish a “distracted driving” category ( 15 ). Road environment information also affects the eye movement indicators of a driver. Arakawa found that the viewpoint distribution of drivers in urban road environments was wider than that in suburban road environments, and that drivers were therefore more likely to be distracted when driving on urban roads ( 16 ). Through driving simulation and eye movement tests, Pyne et al. ( 17 ) and Liu ( 18 ) found that high vehicle speeds and large amounts of information make it difficult for the driver to observe signs. It is a common approach to evaluate driving behavior in relation to the visual attention distribution of individual drivers. However, few studies have explored the relationship between the visual characteristics of people with acquired color vision defects and their driving behavior.
While driving, color-weak drivers and drivers with normal vision present significant differences in the accurate recognition of traffic lights. Particularly under abnormal weather (e.g., rain, snow, fog, and other low-visibility weather) and traffic conditions (strong light intensity, complex ambient lighting at night, etc.), color-weak people have poorer color recognition ability than people with normal vision. Moreover, they are prone to failing to identify traffic lights rapidly and accurately. Numerous environmental factors have been proven to reduce the ability of people with color vision defects to recognize the colors of traffic lights. For example, in simulation tests, Verriest et al. demonstrated that people with color vision defects were poor at recognizing traffic lights at low light intensity and at long distance ( 19 ). Antonio conducted a questionnaire survey of 151 people with color weakness and 302 people with normal color vision. The results showed that it was more difficult for color-weak people to recognize traffic lights at night than people with normal vision ( 20 ). In a study by Kim et al., it was found to be difficult for patients with color weakness to recognize the color of traffic lights under conditions of background light interference, light intensity changes, hazy weather, and strong light ( 21 ). Cole stated that the distance required for people with protanomaly to first observe red traffic lights was different on sunny and cloudy days ( 22 ). It needs to be emphasized that different forms of acquired color vision defects result in significant differences in the visual recognition of traffic lights, in addition to the aforementioned factors ( 23 ).
It is still unknown how the forms of acquired color vision defects affect the accuracy of the visual recognition of traffic lights under complex environmental conditions. To this end, the current study proposed a static visual test of traffic lights under different environmental factors and driving simulation scenarios in relation to participants with color weakness. In the simulation scenarios, participants passed a signalized intersection at a default speed, while an eye tracker collected eye movement data. To conduct a comparative analysis, participants with normal color vision were also recruited.
Method
Participants
Through online recruitment, registered color-weak people were identified and classified according to China’s “Color Vision Examination Plates” ( 24 ). Consequently, the participants were grouped according to condition: protanomaly (10), deuteranomaly (10), dyserythrochloropsia (10), and normal vision (5).
All the participants were male, holding different occupations, and ages ranged from 20 to 40 years (average age of 29.4). They had normal- or corrected visual acuity. Each participant had a current Chinese driving license and at least 2 years’ driving experience. All participants were in good health and able to complete the test independently; they received financial remuneration following completion of the experiment.
Apparatus
Qingyan EyeControl Eye Movement Test System
The Qingyan EyeControl eye movement test system is composed of an eye tracker and a workstation equipped with eye movement analysis software. When the error range remains less than 0.5°, the sampling rate of the test system can be as high as 100 Hz, which can accurately record and analyze the gaze time and -trajectory of people processing real-time visual information. Moreover, the gaze- and first entry times of a designated area of interest can be recorded to create gaze heat maps and eye-tracking diagrams. Embedded out view, the test system collects the driver’s eye movement information with the eye tracker data in a simulated driving environment.
VBOX GPS Data Collector
A VB2SX5 model VBOX GPS data collector (VBOX) is a vehicle-mounted real-time recording instrument that can gather driving data. Using the VBOX Tools software, driving indicators for the test, such as driving time, real-time speed, and driving distance of the vehicle in the test, can be recorded. Combined with the eye tracker data, vehicle position can be determined at any time during driving.
Experimental Design
Static Visual Recognition Test of Color Vision
Protanomaly and deuteranomaly are the more common conditions in the color-weak population. Color weakness presenting with protanomaly and deuteranomaly simultaneously is defined as dyserythrochloropsia in the medical field; the color recognition ability of people with this condition is worse. In the experimental study, three types of color weakness, protanomaly, deuteranomaly, and dyserythrochloropsia were included. The influence of two external factors, light intensity and visual recognition distance, on the color accuracy of the visual recognition of traffic lights was investigated.
Determination of Light Intensity
The intensity of light in a day changes regularly with time and according to weather conditions. There are clear differences in the light intensity at different times of the day. The light intensity at noon is strongest, whereas in the early morning and dusk, light intensity is at its weakest. The light intensity from 10:00 to 14:00 is significantly stronger than that at other periods. Moreover, the intensity value between 10:00 and 14:00 is very close to that at noon ( 25 ). To replicate real-world conditions, the light intensities at 6:00, 8:00, 10:00, noon, 14:00, 16:00, 18:00, and 20:00 on a particular day were selected to represent the changes in the light intensity in a day.
Determination of Visual Recognition Distance
According to the requirements in “Urban Road Engineering Design Code” ( 26 ), the general stop-line distance from traffic lights on urban roads is between 16 m and 70 m, and the safety braking distance is 15 m, which is the minimum distance required to observe the traffic lights and conduct appropriate driving operations. In an actual driving process, a driver typically pays attention to traffic lights continuously within a distance of 85 to 31 m. Therefore, considering individual differences, eight distances were selected for visual recognition in the experiment: 30, 40, 50, 60, 70, 80, 90, and 100 m.
Design of Orthogonal Experiment
An orthogonal experiment, as an effective multifactor method, can reduce the experimental workload. Considering time factor, A, visual distance factor, B, and color-weak type factor, C, this equated to 8 levels, 8 levels, and 3 levels, respectively; the L64 (8^7) orthogonal table was used for virtual-level processing. Specifically, color-weak type factor, C, was defined by virtual level. Levels 1, 4, and 7 were virtualized as Level 1. Levels 2, 5, and 8 were virtualized as Level 2. Levels 3 and 6 were virtualized as Level 3. Thus, a total of 64 experimental scenarios were generated. The static visual recognition test of color vision proposed to examine the influence of the three factors on the visual recognition of traffic lights. The color error rates for the traffic lights recognized by the participants were selected as a result of the orthogonal experiment. A high visual recognition error rate indicates the factor has a large influence.
Realization of Test Scenarios
To simplify the static visual recognition test, a sample set of three-color traffic light photographs on a spot were collected and the field test was replaced by visual recognition of the traffic light photographs. One signalized intersection was selected in Hongqiao District, Tianjin. Photographs of red, yellow, and green traffic lights were taken on-site from the same shooting angle and direction. The clarity of the photographs and other factors were controlled to ensure that the photographs during the test were approximately consistent with the actual state. According to the level combination of the factors in the orthogonal table, a total of 192 photographs in 64 groups was taken. Figure 1, a and b, show the comparison of traffic lights at 8:00 from different visual distances (30 and 50 m). Figure 1, c and d, show the comparison of traffic light photographs with a 40 m visual recognition distance at different periods. The photographs selected for the visual recognition test clearly reflected the characteristics of traffic lights under different light intensities and at different visual recognition distances, which met the requirements of the test design.

Photographs of traffic lights under different conditions: (a) 30 m at 8:00, (b) 50 m at 8:00, (c) 40 m at 8:00, and (d) 40 m at 20:00.
Dynamic Visual Recognition Test of Color Vision
In the experiment, the entire process of a driver passing through the intersection was recorded. The camera was placed alongside the driving position of the car and the shot presents the first perspective of the test driver. An average seat height of 90 cm was used to ensure that the shooting view was consistent with the actual view of a driver. Furthermore, the vehicle moved to the lane center at a constant speed when the video was recorded, which simulated the driver’s actual view when driving a vehicle through the intersection. The total driving distance was 150 m from the start- to the stop line at the intersection of the test road. The first 50 m was the vehicle acceleration phase, and the vehicle reached the default speed of the test plan at 50 m. Videos of actual road traffic at a constant speed in the last 100 m were recorded. Thus, the video stopped shooting when it reached 150 m from the start line and the video taken from 50 to 150 m was used as the test video.
A sunny day was chosen and eight groups of test plans under different test conditions were shot. The dynamic on-site visibility test, including two time periods (day and night), two vehicle speeds (20 and 30 km/h) and two traffic light types (red light and green light), was developed using a mixed factorial design. The specific test conditions are listed in Table 1. During the shooting of the eight test plans, a VBOX instrument was used to simultaneously record the speed, location, time, and other information pertinent to each plan.
Test Conditions of Each Test Plan

The type of color vision was an external variable, whereas the time period, vehicle speed, and type of traffic light (i.e., the color phase displayed) were the internal variables. In the tests, each participant was required to watch eight driving test videos independently while data about their eye movements during the eight tests were collected.
Experimental Procedures
Static Visual Recognition Test of Color Vision
Grouped by Color-Weak Type
Thirty participants with color weakness were selected for the test and divided into three groups according to color-weak type: (1) Group A, 10 × protanomaly; (2) Group B, 10 × deuteranomaly; (3) Group C, 10 × dyserythrochloropsia. As this particular test was only concerned with differences between color-weak type and the visually recognized color of the traffic lights, people with normal color vision were not included.
Confirmation of Visual Recognition Time
According to “Technical Requirements and Test Methods for Passenger Car Braking Systems” ( 27 ), when driving at a speed of 30 km/h, reaction times from discovering an emergency until braking are usually between 0.75 and 1 s with a reaction distance of 8.3 m. In an ideal state, the braking distance from first stepping on the brake pedal to a complete stop would be 5.9 m with a braking time of 0.7 s ( 28 ). To replicate the real-world time for a driver to observe traffic lights, the participant image recognition time was set at 1 s in the static visual recognition test, and the image was passed after 1 s.
Implementation of Test
An orthogonal test was conducted from 9:00 to 11:30 on a morning in September 2019. Three groups of participants with protanomaly, deuteranomaly, and dyserythrochloropsia, were tested simultaneously. One hundred ninety-two photographs from the photograph library were randomly presented as slides. The order of the photographs for each group and other test conditions were exactly the same. In the experiment, the participant was required to identify 64 groups of traffic light photographs under different orthogonal test conditions sequentially. The longest time allowed for the participants to recognize a photograph was 1s. In addition, the participants were required to give one of three possible answers (“red,”“yellow,” or “green”) in response to the question ‘what is the color of the traffic light at this time?’.
Dynamic Visual Recognition Test of Color Vision
Selection of the Test Road
The video of the driving simulation was taken at the intersection of Dingzigu No.3 Road, Hongqiao District, Tianjin. As shown in Figure 2, a and b, traffic and the number of pedestrians on the road were both moderate. The traffic lights were clearly identifiable from the lights of bypasses, the landscape, and buildings for people with normal color vision, which satisfied the road conditions required for this test.

Part of the test road: (a) during the day and (b) at night.
Grouping of Participants
The participants were divided into four groups according to color vision type: (a) Group A, 10 people with protanomaly; (b) Group B, 10 people with deuteranomaly; (c) Group C, 10 people with dyserythrochloropsia; (d) Group D, a control group of 5 people. Before the test, each driver was informed of the test purpose to reduce any external factors interfering with the test results.
Determination of the Test Indicators
The basic forms of eye movement—gazing, blinking, and saccade—reflect driver behavior during the driving process. Gaze and scanning were found to be the major eye movements ( 29 ).
Percentage on Areas of Interest (AOIs)
To characterize the driver’s visual attentiveness from the gaze point, the gaze area distribution characteristics of the drivers were examined ( 30 ). From the tracking of the pupil position by the eye movement instrument, an eye movement heat map and motion trajectory map were drawn up. Thus, a participant’s visual attention was shown by an overlapped area, which can be used to determine key visual areas. The gaze area of the participant in the video was divided into five AOIs, as shown in Figure 3. The percentage of the AOIs indicated the frequency of the driver’s gaze at a certain range, which also indicated the target attention of the driver. Thus, a high frequency of gaze points appearing in a specific area means a high percentage of AOIs.

Division of driver gaze area.
Distance From Stop Line When Traffic Lights are First Observed
When the traffic lights are first observed, the distance between the vehicle and stop line can be used to judge whether the driver is at a safe distance from the stop line. The earlier the driver observes the traffic lights, the more time they have for driving judgment and operation.
Heat Map and Eye-Trajectory Diagram
A heat map, as an indicator that visually characterizes eye movement data, can show the main focus areas and attention levels of a driver. A deeper red in the heat map indicates a higher attention level ( 31 ). The eye-trajectory diagram visually illustrates participant attention changes according to the images. A number represents the sequence of gaze and the size of the circular spot represents the degree of gaze. The diagram can visually present differences in eye movement between participants with color-weak and normal vision.
Implementation of Test
Before the test, participants sat in front of a monitor with an eye tracker. The seat positions could be adjusted so that the distance between the eyes and tracker were maintained at 60 cm. The elevation angle of the eye tracker could also be adjusted to ensure the eye position was maximally close to the screen center. During the test, a research assistant was responsible for presenting the real scenario video of a car driving on the road. Each participant had their eye movement data collected for all eight types of road environment at one sitting. Figure 4 shows a simulation test of a participant driver. After the test, the data were exported to analyze the eye movements of the participants.

Participants’ simulated test scenario: (a) video simulation of a daytime driving scene and (b) of a nighttime driving scene.
Results and Discussion
Visual Recognition Error Rate
The results of the visual recognition of the 30 participants of three-color traffic lights were analyzed to obtain the error rates for 64 groups of test schemes, as shown in Table 2. The different trends for the visual recognition error rates of the participants are shown in Figure 5.
Visual Recognition Results of the Orthogonal Test

Note: In the time series, 1,2,3,4,5,6,7,8 represent 6:00, 8:00, 10:00, noon, 14:00, 16:00, 18:00, and 20:00, in the Visual recognition distance series, 1,2,3,4,5,6,7,8 represent 30, 40, 50, 60, 70, 80, 90, and 100 m, in the Types of color weakness

Visual recognition error rate fluctuation at different levels of various factors.
The visual recognition error rate fluctuated significantly when various factors (i.e., time, distance, color-weak type) were selected in the experiment. Considering the time factor, A, the visual recognition error rate peaked at noon; this was mainly affected by the light intensity. Therefore, the visual recognition error rates of the participants were found to increase with an increase in light intensity. As for the visual recognition distance factor, B, the visual recognition error rate illustrated an uptrend as distance increased. In addition, participants with deuteranomaly and dyserythrochloropsia demonstrated the best and worst results, respectively, when color-weak type, C, was the focus.
The range analysis for the test results was 18.14%, 13.41%, and 12.92% for factors C, A, and B, respectively. These indicated that color-weak type was the factor with the strongest influence on error rate of the three-color traffic lights in the visual recognition test. In contrast, light intensity and visual recognition distance had similar influences on the visual recognition error rate. It should be emphasized that the interaction between the three factors had a superimposing effect on the visual recognition error rate, that is, when two or three influencing factors tend to increase the visual recognition error rate, they have mutually reinforcing effects. For example, the most unfavorable conditions within each of the three factors were believed to have the highest error rate. Specifically, the A4B8C3 scheme (i.e., traffic light recognition of participants with dyserythrochloropsia from 100 m away at noon) had the highest visual recognition error rate: over 50%. Therefore, it would be inadvisable for people with this particular color vision defect to drive under such conditions. In contrast, the A8B1C2 scheme (i.e., traffic light recognition of those with deuteranomaly from 30 m away at 20:00) demonstrated the lowest visual recognition error rate at only 6.67%, which was close to people with normal color vision.
Statistics on Proportion of AOIs
Data analysis in this study was based on the average proportion of AOIs of the participants with each color vision type. These results are shown in Figure 6.

Average proportion of areas of interest (AOIs) for participants according to color vision type.
Based on the test results from the eight schemes, the attention proportion of all participants with normal vision in AOI 5 was over 50%, which indicated that the area to the front of the road is always an important area for driving: the drivers’ attention is focused straight ahead to take in the road information ahead of time. The average gaze ratio of participants with deuteranomaly in this area was 49.49%, which was close to that of participants with normal vision. However, the average proportions of attention of participants with protanomaly and dyserythrochloropsia focusing directly ahead were 15.38% and 8.94%, respectively. This was significantly different to participants with normal vision, which indicated that the participants with protanomaly and dyserythrochloropsia tended to ignore the road conditions in front, which increases traffic risk. During the driving process, the risk of traffic accidents increases if drivers’ sight is directed away from the road ahead ( 32 ). Studies have shown that when distracted driving occurs, drivers tend not to look directly ahead on the road, rendering collision events more likely ( 33 ).
It can be seen from Figure 7a that the proportion of the gaze toward the road ahead of the participants reduced when the vehicle speed increased from 20 to 30 km/h. Among the participants, the proportion of the gaze to the front of the road of participants with normal vision and those with deuteranomaly decreased slightly by 3.44% and 6.09%, respectively. On the contrary, the gaze proportions toward the road ahead of participants with protanomaly and dyserythrochloropsia decreased significantly, by approximately 69.61% and 58.32%, respectively. The attention of participants with both types of color weakness was sensitive to vehicle speed. Differences between the test environment during the day and night also affected the gaze proportions of participants on the road ahead. As shown in Figure 7b, when driving at night, the gaze proportions of all the color vision types on the road directly ahead were lower than in the daytime. Moreover, gaze proportions to the left and above (AOI 1 and 2 respectively in Figure 3) the road were also found to increase owing to the distraction from street lights, buildings, and other environmental lights on both sides of the road at night. The results showed the risk potential of traffic accidents when driving at night; thus, the necessity to drive at lower speeds at night.

Gaze proportions of participants of different color vision type toward the road ahead: (a) speed at 20 km/h and 30 km/h, (b) during the day and at night.
Distance to Stop Line When Traffic Lights are First Observed
Figure 8 presents the eye trajectory of the participant in the simulated driving test. This graph can be obtained on the Qingyan test platform. Through observing the point track changes, the sequential points can be utilized to determine the time when the participant observes the traffic lights for the first time. Figure 9a shows the average time it took for the participants, according to the four color vision types, to observe the traffic lights for the first time. In relation to the time the traffic lights were first observed and the positioning record of the VBOX instrument, the average distance to the stop line can be obtained simultaneously. As shown in Figure 9b, whether the distance to the stop line is safe can also be judged.

Eye-trajectory diagram of participant.

Average time to observe traffic lights for first time and distance to stop line: (a) Average time and (b) average distance to stop line when observing traffic lights for first time.
The average distance of the participants with color weakness to the stop line when observing the traffic lights for the first time was different from that of participants with normal vision. Specifically, the average distances to the stop line for participants with protanomaly and dyserythrochloropsia were 54.83% and 44.87% lower, respectively, when compared with those of participants with normal vision. The average distance of participants with deuteranomaly from the stop line was 85.59% that of the participants with normal vision.
When the vehicle speed increased from 20 to 30 km/h, the distance to the stop line when observing the traffic lights for the first time reduced for all participants, as shown in Figure 10a. The distance to the stop line for participants with normal vision reduced by 13.27%, whereas the distances for participants with deuteranomaly, protanomaly, and dyserythrochloropsia reduced by 26.38%, 21.27%, and 26.43%, respectively. This indicated that drivers with color weakness were more sensitive to speed change. Moreover, the average distance of the participants of each color vision type from the stop line when they observed the traffic lights for the first time at night was also different. As shown in Figure 10b, all categories of participants were closer to the stop line at night than during the day. However, the average distance of participants with deuteranomaly from the stop line was close to that of participants with normal vision. In comparison, the average distances of participants with protanomaly and dyserythrochloropsia from the stop line were significantly different from those with normal vision in both daylight and at night.
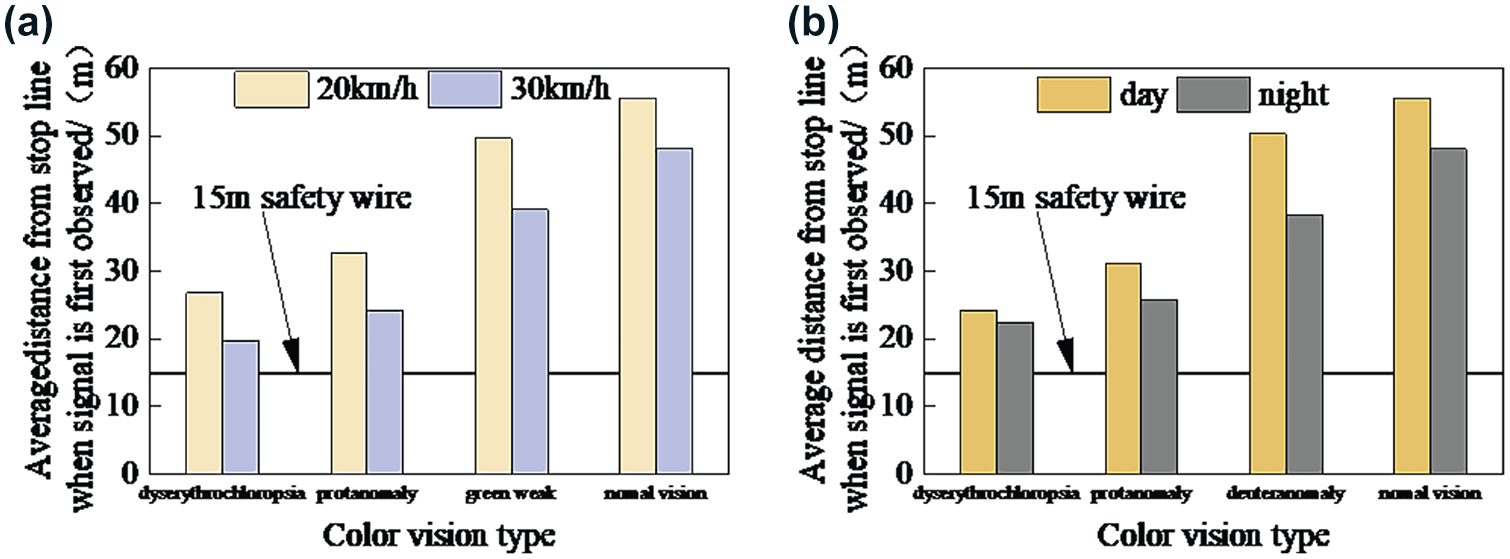
Average distance of each participant to stop line when observing traffic lights for first time: (a) speed at 20 km/h and 30 km/h, (b) at night and during the day during the day and at night.
Regardless of the visual recognition accuracy of the traffic lights, the average distance of each participant color vision type from the stop line when they first observed the traffic lights was greater than 15 m, which is a safe distance. However, in Schemes 7 and 8, at night, when the vehicle speed increased to 30 km/h, the average distance for participants with dyserythrochloropsia was close to the safe distance. Therefore, it would be advisable for drivers with this condition to control their vehicle speed to reduce traffic safety risks.
Heat Map and Eye Track Analysis
Figure 11 shows the eye movement heat maps and eye movement trajectory diagrams of the participants according to each color vision type in Scheme 6. The eye movement characteristics of the different types of participants during the day and at night are presented in Figure 12. The test results indicated that the deuteranomalous eye movement characteristic index was close to that of participants with normal vision. Specifically, apart from the stable trajectory, the scanning path of the deuteranomalous eye movement had several intersections and the fixation points were more concentrated. In addition, the number of eye movement observation points, point distribution, and saccade range between participants with normal vision and those with protanomaly did not change significantly from day to night. The eye movement results for the participants with protanomaly and dyserythrochloropsia were found to be significantly different from participants with normal vision. The heat map and eye-tracking points illustrated a highly scattered distribution and wide sweep range.

Eye movement characteristics of participants with different color vision types: (a) protanomaly heat map, (b) protanomaly eye trajectory, (c) deuteranomaly heat map, (d) deuteranomaly eye trajectory, (e) dyserythrochloropsia heat map (f) dyserythrochloropsia eye trajectory, (g) normal vision heat map, and (h) normal vision eye trajectory.
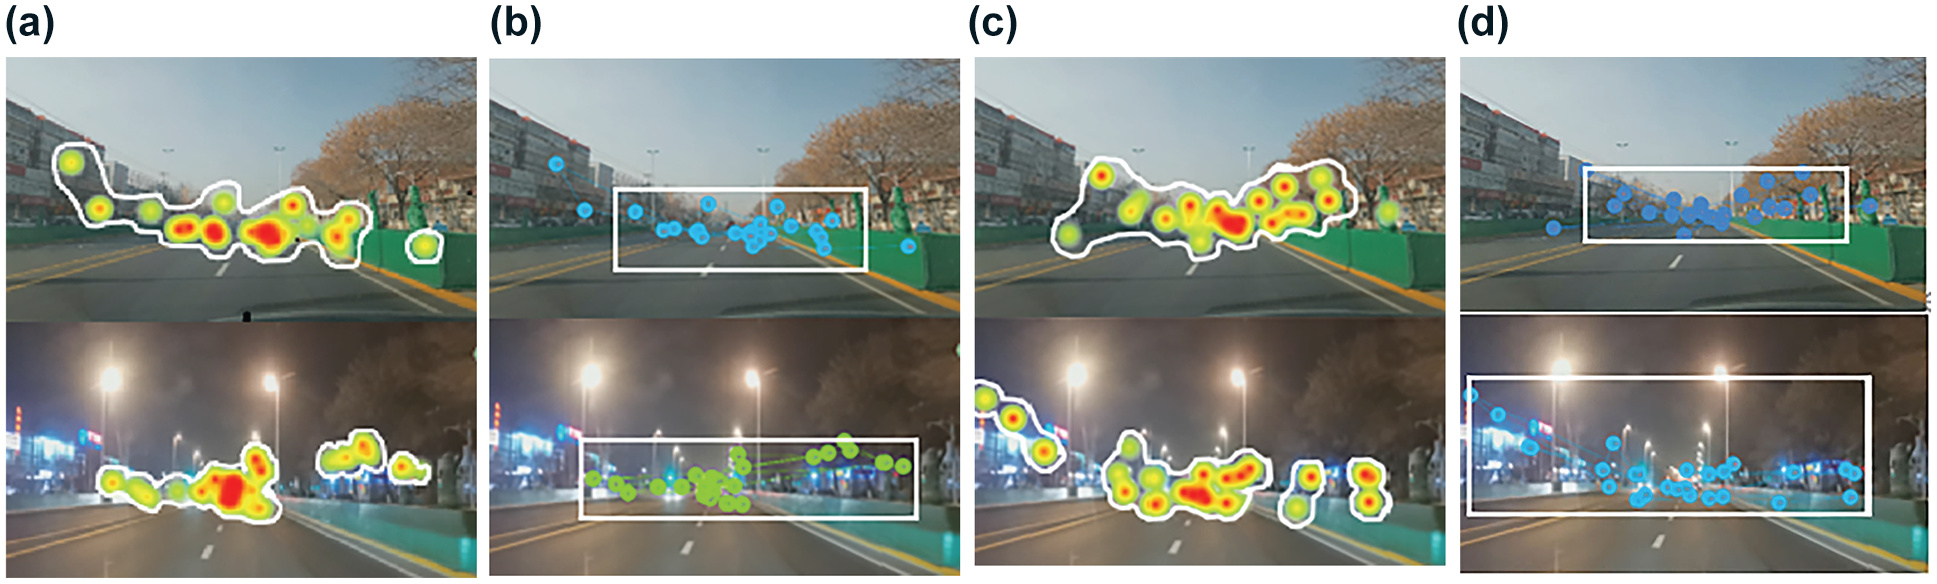
Eye movement characteristics of protanomaly and dyserythrochloropsia during the day and at night: (a) protanomaly heat map, (b) protanomaly eye trajectory, (c) dyserythrochloropsia heat map, and (d) dyserythrochloropsia eye trajectory.
It should be noted that the number of eye-tracking points of the two types of participants at night was significantly lower than during the day, and the number of points on the left-hand side of the road significantly increased. This indicated that participants with protanomaly and dyserythrochloropsia were more likely to be distracted when driving at night. It is necessary for these groups to be aware of the high risks involved in night driving.
Conclusion
Contributing to existing color visual recognition research, this paper explored different influencing factors affecting color-weak drivers and the dynamic visual recognition of color between drivers with acquired color vision defects and with normal vision. The test results showed that the type of color weakness was the main factor that affected visual recognition accuracy; light intensity and visual recognition distance were secondary factors. Through the eye movement test, the indicators of participants with deuteranomaly were found to be relatively optimistic and close to those of participants with normal vision. On the contrary, the eye movement indicators of the participants with protanomaly and dyserythrochloropsia were significantly different from those of participants with normal vision, which indicated that they were more prone to distraction during driving. In addition, the distance to the stop line when the two types of color-weak drivers first observed the traffic lights was approximately 54.83% and 44.87% that of participants with normal vision. Consequently, the reaction times were reduced by nearly half, which will increase the driving risks for the color-weak group. Therefore, the driving safety of the color-weak group should be addressed.
With reference to the dynamic visual recognition test results of color-weak participants, the colors of the traffic lights could be adjusted to a color that promotes recognition in drivers with color weakness on the basis of not interfering with the normal driver's recognition of the color of the traffic lights. For example, UK railway lamp signals select more identifiable colors through setting blood red for red, the amber is yellow, and the green is a bluish color ( 34 ). At night, color-weak drivers were easily distracted by lights in the environment, which interfered with their identification of traffic lights. Therefore, either the brightness of the traffic lights should be intensified, or the brightness of street lights, for example should be reduced to ensure the traffic lights stand out. Further consideration of the site selection of background lights, such as street lights, building lights, and so forth, is required in relation to the distance from the traffic lights; this would potentially minimize the overlapping area of background lights and traffic lights. Moreover, to facilitate driver recognition of traffic lights at a wide intersection, the traffic lights could be placed on both sides of the road near the stop line, or in the center of the road to reduce the visual distance.
This study has provided a reference for vehicle control regulations, traffic light location optimization, and safety policy for color-weak people, which is valuable for its potential to improve traffic safety. The research could be expanded in several ways in the future. It would be reasonable to conduct in-depth research on the classification standards and test methods in relation to color-weak people, as well as on the quantitative relationship between specific parameters such as hue, saturation and brightness values, and visual error recognition rates of color-weak people.
Footnotes
Author Contributions
The authors confirm contribution to the paper as follows: study conception and design: Q. Wang, T. Luo; data collection: Q. Wang, T. Luo, H. Wang; analysis and interpretation of results: Q. Wang, L. Shi, H. Wang; draft manuscript preparation: Q. Wang, H. Wang, T. Luo, X. Fan. All authors reviewed the results and approved the final version of the manuscript.
Declaration of Conflicting Interests
The authors declared no potential conflicts of interest with respect to the research, authorship, and/or publication of this article.
Funding
The authors received no financial support for the research, authorship, and/or publication of this article.
