



Abstract
This study investigated the use of class C fly ash (FA) as a precursor for alkali-activated mortar (AAM) for 3D-printed concrete (3DPC). AAMs with different water-to-FA (W/FA), alkaline activator-to-FA (Alk/FA), and sodium silicate-to-sodium hydroxide (SS/SH) ratios were examined to develop mixtures that can be tailored for different structural applications of 3DPC. The fresh properties, including extrudability and buildability, were evaluated through the open time (OT) and immediate deformation tests, respectively. Different cycle times (CTs) were applied to achieve a strain limit state necessary to maintain the printed shape. The strength of AAMs in different directions at different CTs was examined. Scanning electron microscopy (SEM) was carried out on AAM specimens having different CTs for a better understanding of the bond area. OTs ranging from 2.5 min to 31 min and axial strains ranging from 0.17% to 11.2% were achieved depending on the proportions of the AAMs and CT, which offers flexibility in optimizing the speed of printing and strength of concrete for different projects. The 3DPC specimens displayed anisotropic behavior compared with full-height specimens, where the compressive strength of full-height specimens was higher by 0.2% to 18% and 0.9% to 28% than 3DPC specimens when tested parallel and normal to the printing directions, respectively. SEM images and line scan indicated an approximately even intensity of the element concentration at the interfacial zones of AAMs having short CTs, which explained the relatively high compressive strength of those specimens. For AAMs having long CTs, there was a significant change in the intensity of the element concentration at the interfacial bond zone, and voids were observed resulting in low compressive strength of those specimens.
3D-printing is an emerging technology that is adopted for constructing concrete structures in layers using computer-aided design software and digital model data (1, 2). Adopting 3D-printed concrete (3DPC) has many advantages compared with cast-in-place or precast construction, including the ability to print intricate shape structures as well as reducing the construction time, workmanship, formwork costs, and construction material waste, which leads to cost savings (3–6).
The majority of literature used ordinary Portland cement (OPC)-based 3DPC (5, 7–16). Recently, alkali-activated mortar (AAM) was proposed for 3DPC. AAM is prepared by activating synthesized material such as metakaolin (17, 18) or industrial byproduct materials such as fly ash (FA) using alkaline solutions. The fresh and hardened properties of AAM can be tailored for a wide range of applications (17, 19–23) and therefore AAM has the potential to outperform OPC-based 3DPC. Developing AAM using FA also offers an eco-friendly alternative concrete material. The ASTM 618-15 ( 24 ) classifies FA into two classes: class F and class C. Class F is commonly used as a precursor for AAM; recent studies, however, have successfully used class C FA as a precursor for AAM. Whereas the former is cured at elevated temperatures, the latter can be cured at ambient or elevated temperatures when producing structural concrete (23, 25–27).
As 3D-printing is a relatively new technology, there is no consensus on the concrete terminology and testing methods. Fresh properties including extrudability and buildability of mixtures used for 3DPC have been examined (7, 8, 28 , 29 ). Extrudability, a measure for printability, is defined as the time for concrete to be easily transported from a pump to the extrusion nozzle without blockage in the hosepipe and without any signs of filament tearing, discontinuity, or disturbance (5, 10, 29–32). Another measure for fresh properties of 3DPC is the open time (OT), which is a time interval “operation window” where the mixture can be extruded ( 32 ). Although printed concrete requires adequate OT, it needs high early strength and rapid setting time to be buildable. Buildability refers to the ability of the material to resist deformation and collapse under its own weight, that is, shape stability, and the weight of the top layers (2, 33). Thus, it is important to balance and optimize these properties to ensure success in 3D-printing a structure.
OTs ranging from 10 min to 225 min were reported for a combination of class F FA and slag-based AAM mixtures depending on the alkaline activator characteristics and slag content (3, 8, 29, 34). Decreasing the ratio of sodium silicate activator from 10% to 8% per total mass of the precursor increased the OT from 60 min to 155 min as a result of the lower rate of particle dissolution ( 34 ). Changing from Na-based to K-based activators increased the OT from 15 min to 29 min because of the relatively slow rate of geopolymerization reaction of the Na-based activators compared with the K-based activator ( 3 ). Moreover, increasing the slag content from 5% to15% of the FA mass resulted in a non-printable mixture, as the slag increased the yield stresses from 0.86 to 1.04 KPa ( 29 ).
There is no standard acceptance criterion testing to evaluate the buildability of a concrete mixture. Different tests have been proposed (5, 17, 30, 35). The maximum number of layers printed with a 20 mm nozzle diameter without collapse was proposed as an acceptance criterion for the buildability of 3DPC ( 5 ). Another proposed criterion was to have no significant deformation in the bottom layer ( 35 ) of a 3DPC with five subsequent layers using a 20 mm diameter nozzle with a height ratio between the first and fifth layers of 1.0, or limiting the measured axial strains and height-to-width ratio of each layer having a thickness of 8 mm with a target of 20 layers ( 30 ). A shape retention using a mini-slump cone where the ability of a 3DPC layer to carry the subsequent layers while retaining its own shape was also proposed. The shape retention was carried out using a cone filled with a mixture that was lifted after 1 min; after that, a load of 600 g was applied on the top surface of the mixture for 1 min allowing the mixture to deform before the average spread diameter was measured ( 17 ). It was concluded that by increasing the workability, buildability was harder to achieve because of the occurrence of higher deformation (5, 35).
The cycle time (CT), also called gap time ( 36 ), delay time ( 12 ), and paste age ( 37 ), defined as the time between placing two subsequent layers, is another factor that influences the buildability. CT ranging from 7.0 s to 6.0 h was used for AAM-based 3DPC (38–40). As the CT increased, the buildability improved as a result of decreasing the axial strain in the bottom layers. Increasing the CT, however, leads to more construction time and reduces the strength of 3DPC specimens ( 37 ) as a result of the reduction in the interfacial bond strength between the different 3DPC layers. The geopolymerization process resulted in rapid hardening of the AAM, and subsequently the AAM layer’s surface became dry with time, causing less interfacial bond strength between the AAM layers (39, 40).
Hardened properties, including compressive and bond strengths, of mixtures used for 3DPC were examined (8, 9, 38, 41). The interfacial bond strength in 3DPC should be adequate to achieve the required compressive strength and stability of a structure (2, 8, 9, 31, 40). 3DPC displayed anisotropic strength behavior, that is, the strength values are directionally dependent (38, 40). However, there is no consensus on which direction displayed higher strength, that is, the direction parallel or perpendicular to the printed layers. The average compressive strength of AAM-based 3DPC specimens tested parallel to the layer direction was up to 9.5% higher than those tested perpendicular to the layer direction ( 38 ), whereas another study found that the compressive strength perpendicular to the layers was up to 7.5% higher than those tested in the parallel direction. This inconsistency occurred for two different reasons. Natural variations occurred in measuring the compressive strengths in each direction for the different specimens. Furthermore, the weakness along the interlayer joints caused slippage and separation, therefore causing lower compressive strengths ( 40 ). Another parameter that affected the performance of the interlayer joints is the shape of the nozzle cross-section. Specimens placed using nozzles having rectangular cross-section displayed isotropic compressive strength, whereas those placed using nozzles having circular cross-section displayed anisotropic strength with inconsistence in strength in the perpendicular and parallel directions ( 8 ).
Different applications of 3DPC require different OTs. For example, printing some structures will require fast setting time and therefore short OT such that the printed layers have adequate stiffness to carry the subsequent layers, whereas printing other structures such as large structures with long nozzle traveling-time will require mixtures with long OTs to assure an acceptable bond between the printed layers. OPC-based 3DPC could not provide such flexibility without adding expensive admixtures to adjust the OT or CT (5, 10, 31). Unlike OPC-based mixtures, the OT and strength of AAM can be tailored for different applications by changing the alkaline activators ratio as they are one of the main ingredients in AAM (3, 8).
Both OPC-based (5, 7–16) and a combination of class F FA and slag-based (3, 8, 15, 29, 34, 40, 42, 43) concrete mixtures were developed for 3DPC. The results from some of these studies were contradictory. Furthermore, there are no studies on using class C FA-based AAM for 3DPC applications. Class C FA-based AAMs can offer some advantages for 3D-printing. For example, 3D mixtures available in the literature do not display OT less than 10 min, thus using class C FA-based AAM has the potential to address this issue producing short OT (i.e., less than 10 min), which is important for different 3D-printing applications. Thus, this study was conducted to investigate the feasibility of using class C FA to simulate 3D-printing. The performance of nine class C FA-based AAMs in simulating 3D-printing was investigated. The compressive strengths of the developed mixtures were determined in two directions, that is, parallel and perpendicular to the direction of layers. The OTs of the developed mixtures were also determined by using the flow table test. A new test setup was developed to evaluate the buildability of the mixtures by measuring the immediate axial deformation.
Experimental Program
Materials Properties
Fly Ash
This study employed class C FA, per ASTM C618-15 ( 24 ), as the AAM precursor (Table 1). River sand with a fineness module of 2.25 and a maximum particle size of 1.18 mm was used as the fine aggregate.
Chemical Composition of the Fly Ash Using X-ray Fluorescence

Loss on ignition.
Alkali Activators
A mixture of sodium hydroxide (SH) and sodium silicate (SS) solutions was used as an alkali activator. A 10M SH solution was prepared and cooled down to room temperature before use ( 44 ). A SS in solution form with 44.1% and 55.9% solids and water contents by weight, respectively, was prepared and used. The SiO2/Na2O of the SS’s solids was 2.0 ( 45 ).
Mix Design and Mixing Procedure
Nine AAMs were prepared to have water-to-FA (W/FA), alkali activators-to-FA (Alk/FA), and SS/SH ratios ranging from 0.34 to 0.42, 0.250 to 0.300, and 0.50 to 2.0 (Table 2), respectively. The water used to calculate the W/FA included both water in the alkaline activators and the extra water added during the mixing. The range of W/FA was selected to present a range of relatively stiff and flowable AAMs for different applications, and the Alk/FA and SS/SH ranges were selected as they displayed acceptable setting times and compressive strengths for AAM (44–46).
Mix Design of AAMs (kg/m3)

Note: AAM = alkali-activated mortar; Alk = alkali activators; FA = fly ash; SH = sodium hydroxide; SS = sodium silicate; W = water.
The mixing procedure followed Gomaa et al. (26, 27, 47 ). FA and sand were mixed together for 1 min, and water was added over 1 min. The alkaline activators had been mixed together before adding them gradually to the mixture over 2 min. Finally, all the components were mixed together for another minute. The mixing speed was fixed at 136 rpm.
Extrudability and Buildability of AAM
As there are no standard tests for 3DPC, a modified mini-slump test, and non-standard deformation test was proposed to determine the OT and deformation as measures for extrudability and buildability, respectively. It is worth noting that OT and deformation tests were carried out on different specimens and both tests were performed at different interval times.
Open Time
The OT for each mixture was measured by conducting independent mini-slump tests at different time intervals after mixing, until the mixture lost its workability. An AAM was mixed and left at rest in the mixing bowl for a given time; then, the AAM was placed in the standard ASTM C1437 ( 48 ) brass cone without compaction to simulate 3DPC. The cone was lifted vertically leaving the mixture on a flow table. The flow table was dropped 25 times in 15 s per ASTM C1437 ( 49 ). The process was repeated for the same mixture at increasing times until the mixture completely lost its workability, that is, zero spread diameter after dropping the flow table 25 times. That time was recorded as the OT for that mixture. To accommodate AAMs with short OTs, three flow tables operated by different users were used (Figure 1, a–c). The test was repeated four times for each mix design. The mixture that remained in the mixing bowl was remixed, to mimic 3DPC, before placing it on a flow table.

Three flow tables to measure the spread diameter at different times for AAM1 at (a) zero, (b) one and a half and (c) two and half minutes after mixing.
Immediate Axial Deformation Testing
As there is no ASTM standard test for measuring the immediate deformation for 3DPC, a testing method was developed (Figure 2). The test measures the immediate axial deformation of a 700 g AAM subjected to incremental axial loads representing the applied weight of the added AAM layers during 3D-printing. The incremental load was applied at different CTs representing adding more printed layers.
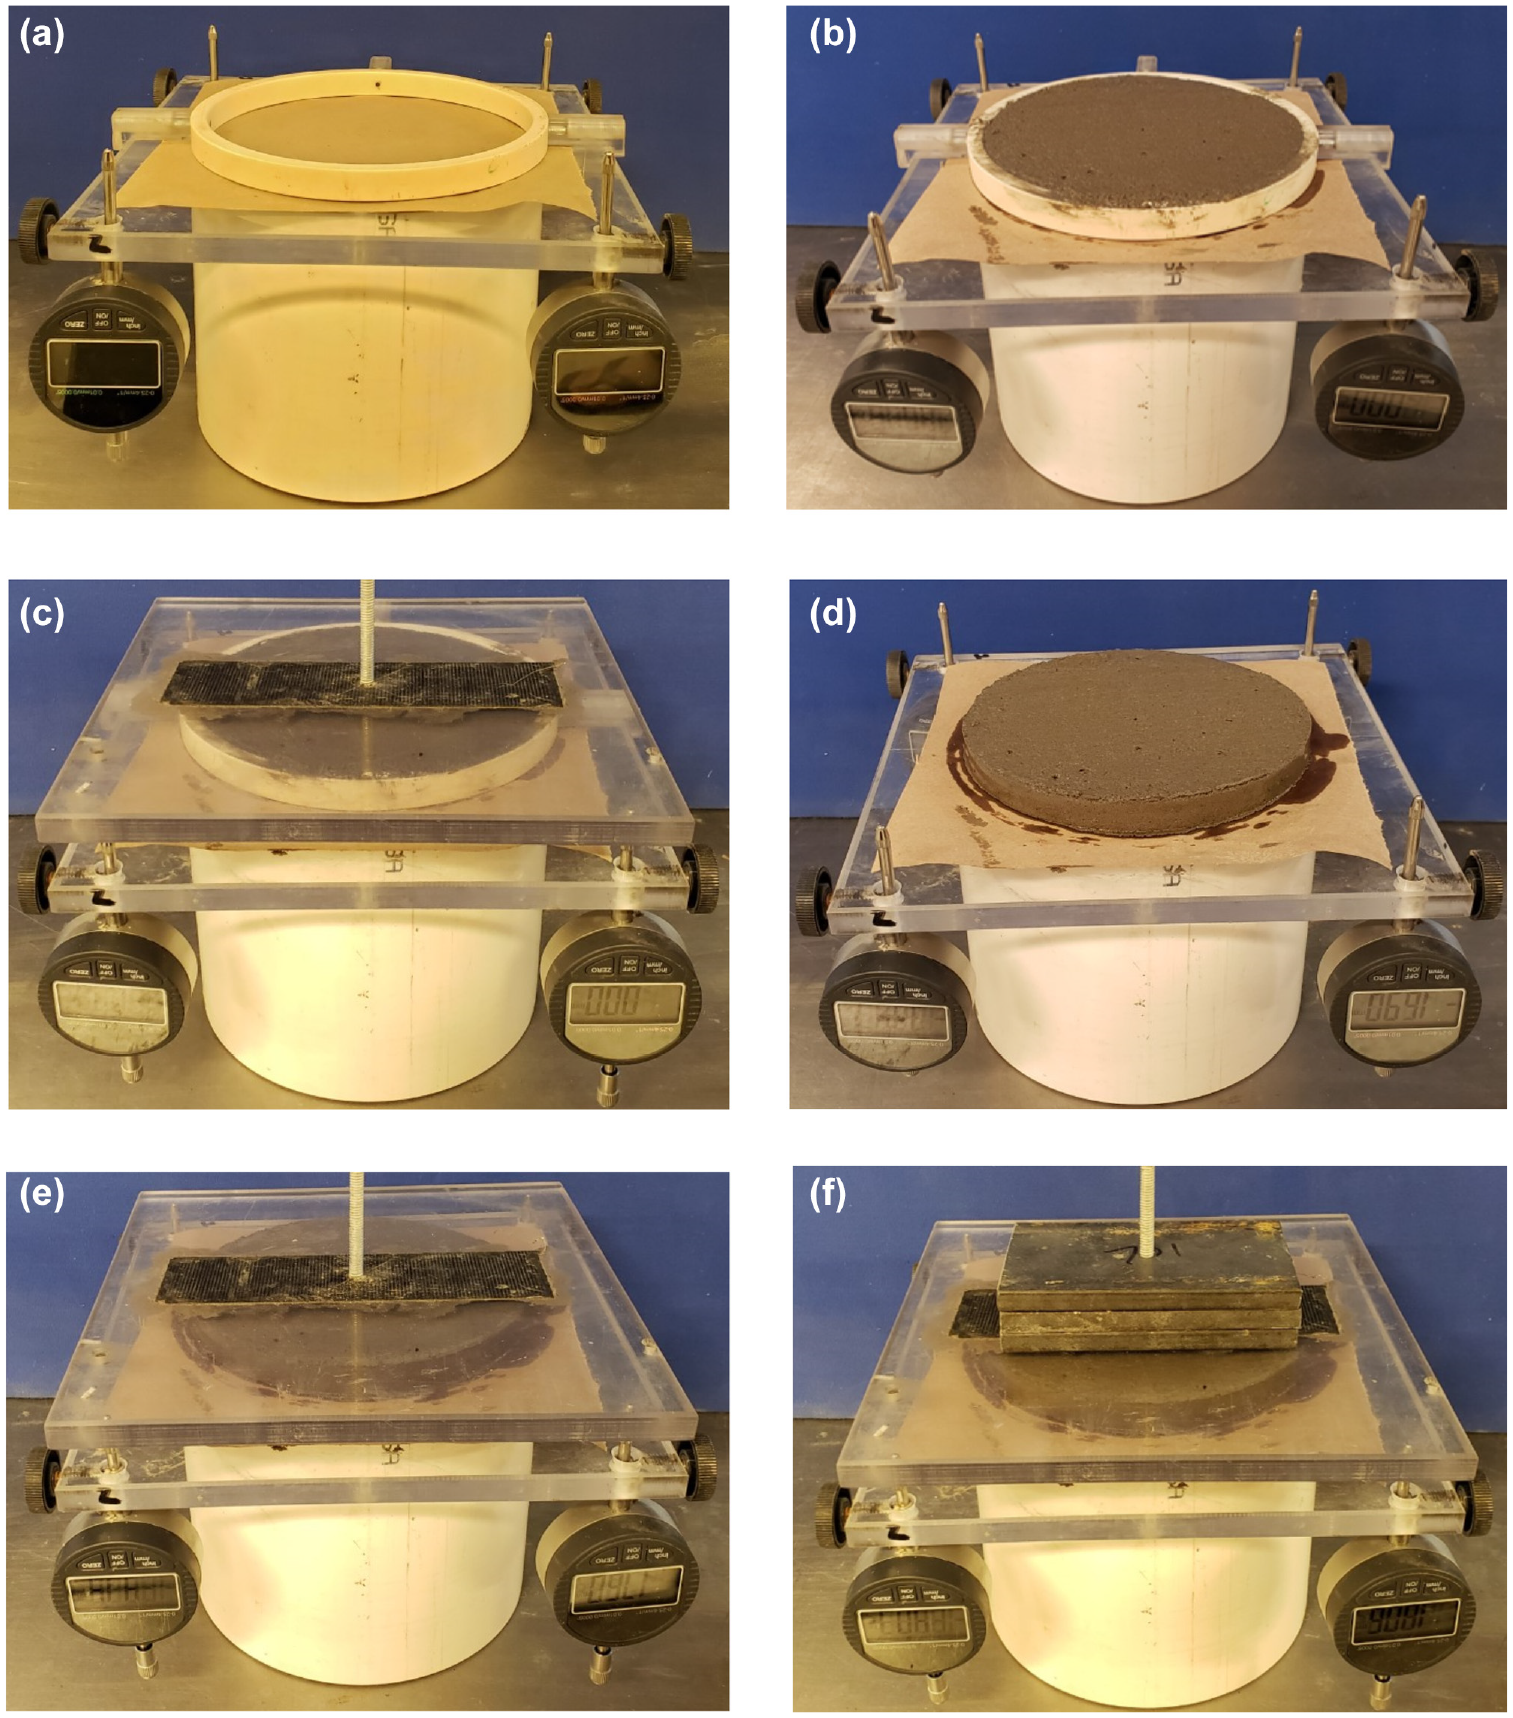
Immediate deformation measurement setup.
Four dial gages were attached to each corner of a 230 mm square Plexiglass plate which was resting on an upright cylinder (Figure 2). A piece of non-absorbent butchers’ paper was placed on the Plexiglass plate to increase surface friction (Figure 2a). A 150 mm diameter 15 mm-high plastic ring beam having three legs was placed and centered on a Plexiglass plate (Figure 2a). The legs were used to ensure the fixation of the ring into the Plexiglass, preventing its horizontal movement (Figure 2a). The ring was filled with 700 g fresh AAM, which was placed continuously starting from the middle, and then the surface was flushed (Figure 2b). Therefore, it simulates the load applied to a layer of printed mortar. A vertical thin metal rod was continually centered on top of a Plexiglass plate that was placed atop the AAM, and the dial gages measuring the spacing between the two Plexiglass plates were zeroed (Figure 2c). The top Plexiglass plate and the plastic ring beam were removed (Figure 2d). The top Plexiglass was placed again atop the AAM at the required CT, and the immediate axial deformation was measured (Figure 2e). The weight of the Plexiglass plate with the rod was 700 g, which represented a weight equivalent to that of the used AAM (Figure 2e).
In total, 700 g, equivalent to the weight of an AAM layer, was added in increments atop the Plexiglass plate at the required CT (Figure 2f). Each weight had a hole in its center where it was installed on the rod atop the Plexiglass plate. The weights were added until the dial gage readings remained constant. CTs of 1.0, 2.5, and 5.0 min were selected for all AAMs. For AAMs having a longer OT exceeding 10 min, CTs of 30 and 60 min were used. The wide-range spectrum of the investigated CTs is of significant interest for different structural applications. The average deformation obtained using the four dial gages was determined and converted to immediate axial strains. The entire procedure was repeated for each mixture. The test was carried out under a constant temperature of 23 ± 2°C and relative humidity of 60%.
Compressive Strength and Microstructural Analysis
Effect of the Loading Direction on the Compressive Strength
Each mixture was used to cast three 50 mm cubes in brass molds. As no actual 3D-printing was carried out in this study, two types of specimens were cast: a full-height specimen that was cast in a single concrete placement (Figure 3a) and a layered specimen in which four 12.5 mm-thick layers with different CTs were placed (Figure 3b). The layered specimens were an attempt to simulate the deposition process of additive manufacturing of concrete (3DPC) (Figure 3). The full-height specimens were used as reference specimens for comparison purposes. It is worth noting that although ASTM C109-16 ( 50 ) requires the specimens to be compacted, neither of the specimens were compacted to simulate 3DPC.

(a) Full-height specimen and (b) four layers of 3DPC specimens tested in Z and X directions.
After placing the mixture in the molds, the molds were covered with plastic bags and stored in the laboratory at the ambient temperature of 23 ± 2°C for 12 h and then cured at 50°C in an oven for another 12 h (51, 52). The compressive strength of the 3DPC specimens tested in both parallel (X) and perpendicular (Z) directions to the AAM layers was determined (Figure 3). The reported results were the average of three specimens tested in each direction. The compressive strength was carried out for specimens with CTs of 1.0, 2.5, and 5.0 min for all AAMs. Besides, CTs of 30 min and 60 min were carried out for mixtures AAM5 and AAM8. Moreover, although it is not practical for 3DPC, a CT of 24 h was carried out for AAM1 as an extreme case to investigate the effect of a very long CT on the strength of the tested specimens.
Microstructural Analysis
Scanning electron microscopy (SEM) and energy-dispersive X-ray spectroscopy were used to visualize and collect the elemental composition at the interface between two subsequent layers. FEI Helios Naolab 600 DualBeam was used for the SEM scope. The images were acquired using the secondary electron detector. Tested specimens, 10 × 10 × 50 mm, were cut from different AAM specimens in a wet condition (Figure 4). The tested surface of each specimen was polished using 360, 800, and 1200 grit sandpapers, respectively. The specimens were dried by placing them in a 40°C oven for 48 h; then, the tested specimens were coated with gold before the SEM testing per ASTM C1723-16 ( 53 ).

Specimen preparation for SEM testing: (a) AAM specimen after cutting the tested specimen and (b) tested specimen.
Results and Discussion
In this section, the effect of the W/FA, Alk/FA, and SS/SH on the OT, deformability, and anisotropic compressive strength of AAM are discussed.
Open Time
The results indicated a wide spectrum of OTs ranging from 2.5 min to 31 min, which allows engineers to tailor and adopt an appropriate AAM mixture depending on the target printed application. AAMs having shorter OTs (i.e., up to 7.0 min) could be used to print a small structure whereas AAMs having longer OTs (i.e., above 20 min) could be used to print a large structure.
Figure 5a shows the effect of W/FA, Alk/FA, and SS/SH on the OT. The OT increased with increasing W/FA as W/FA had no direct role in the geopolymerization process ( 54 ); however, increasing W/FA decreased the concentration of the chemicals (i.e., SS and SH), leading to slower chemical reaction and therefore increasing the OT ( 44 ). For example, when the W/FA was increased from 0.34 to 0.40, the OT increased from 2.5 min to 7.0 min, but as the W/FA was increased to 0.42, the OT increased significantly to 31 min. AAM is sensitive to the W/FA where a small change in the added extra water can significantly change the viscosity of AAM, thus resulting in substantial changes in the workability and setting time, that is, OT (47, 55).
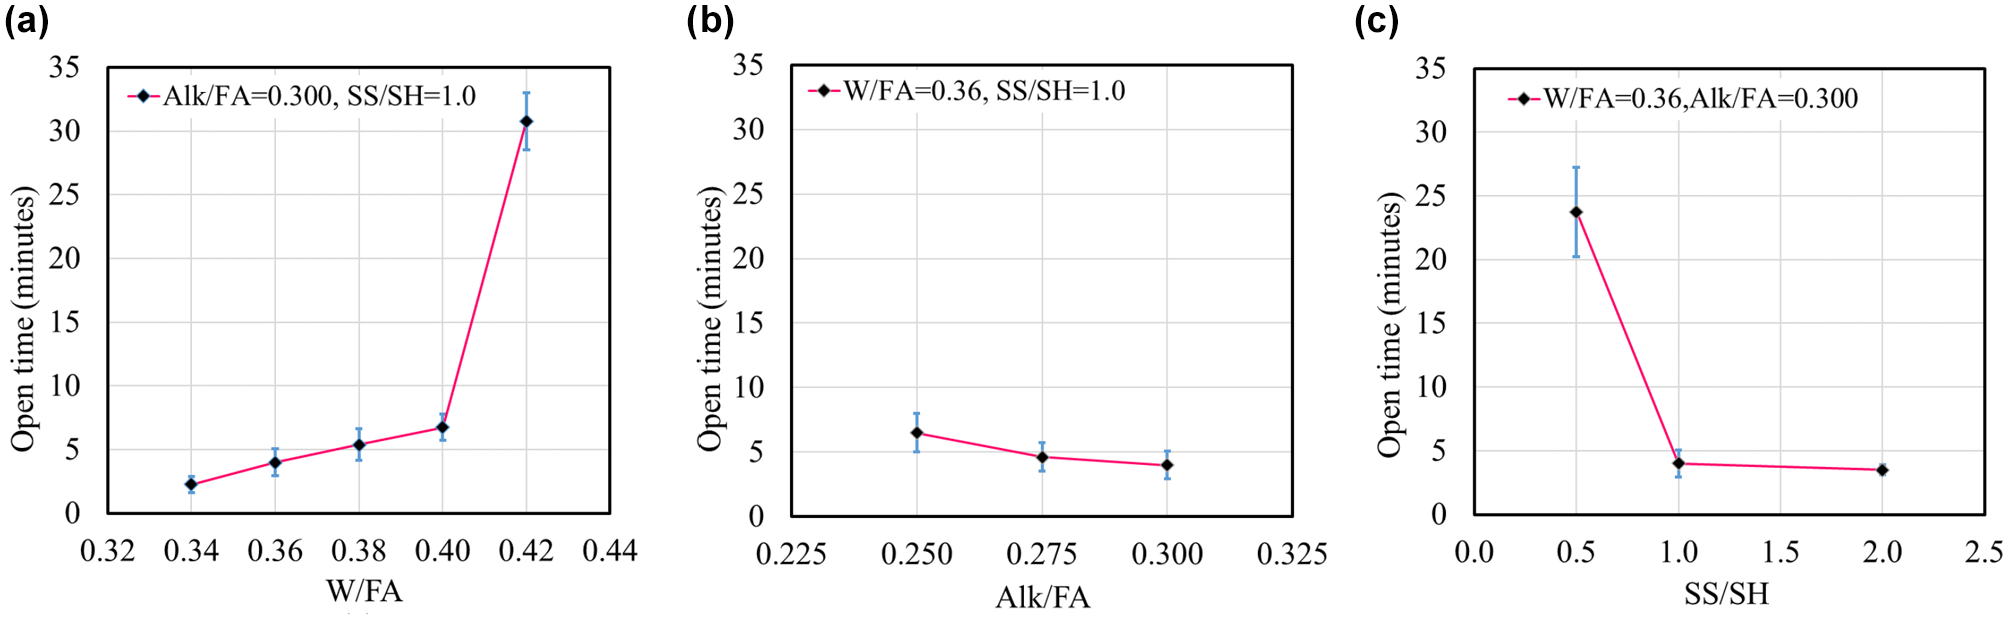
Effect of (a) W/FA, (b) Alk/FA and (c) SS/SH on the OT.
Figure 5b shows the effect of Alk/FA on the OT of mixtures having W/FA of 0.36 and SS/SH of 1.0. The OT decreased with increasing Alk/FA. For example, increasing the Alk/FA from 0.250 to 0.300 decreased the OT from 6.5 min to 4.0 min. Alk/FA has a significant role in the geopolymerization reaction, and it takes part in the dissolution of aluminosilicate precursor; low Alk/FA may not be sufficient to dissolve the FA at a fast rate, causing long OT. High Alk/FA increases the soluble silica (SiO2) and alkali (Na2O) content in a mixture which increases the dissolution rate of FA and accelerates the geopolymerization reaction, resulting in lower workability of the AAM and subsequently short OT (44, 56, 57 ).
Figure 5c shows the effect of SS/SH on the OT of mixtures having W/FA of 0.36 and Alk/FA of 0.30. As the SS/SH was increased, the OT decreased. For example, increasing the SS/SH from 0.5 to 2.0 decreased the OT from 24 min to 3.5 min. Increasing the SS content in the AAM increased the SiO2/Na2O, which accelerates the dissolution reaction and geopolymerization process, decreases the setting time, decreases the workability (55–58) and decreases the OT. Furthermore, SS is more viscous than SH, which results in lower workability (58, 59) and shorter OT.
Immediate Axial Deformations
Effect of CT
Figure 6 shows the effect of W/FA, Alk/FA, and SS/SH on the immediate axial strains of AAM with increasing the applied loads at different CTs. As the CT increased, the immediate axial strain decreased. The immediate axial strains ranged from 11.2% to 0.17% for CTs ranging from 1.0 min to 60 min. The reductions in the axial strains ranged from 1.23% to 11.2%, 0.63% to 6.20%, and 0.24% to 1.37% for CTs of 1.0 min, 2.5 min, and 5.0 min, respectively. The number of stacked loads, which represents the number of stacked AAM layers, ranged from 5 to 9 based on the AAMs where the AAMs that had relatively low W/FA, high Alk/FA, high SS/SH, and long CTs required a smaller number of stacked loads to reach an approximate constant immediate axial strain and vice versa. For AAM5 and AAM8 which had longer OTs, CTs of 30 min and 60 min were used. Observations similar to those observed for short CTs were recorded where with increasing the CT from 30 min to 60 min, the immediate axial strains decreased as a result of the increase in concrete modulus. At the CT of 30 min and 60 min, the immediate axial strains ranged from 0.65% to 1.02% and from 0.53% to 0.78%, respectively. Moreover, the number of stacked loads ranged from 3 to 5 for both AAMs.
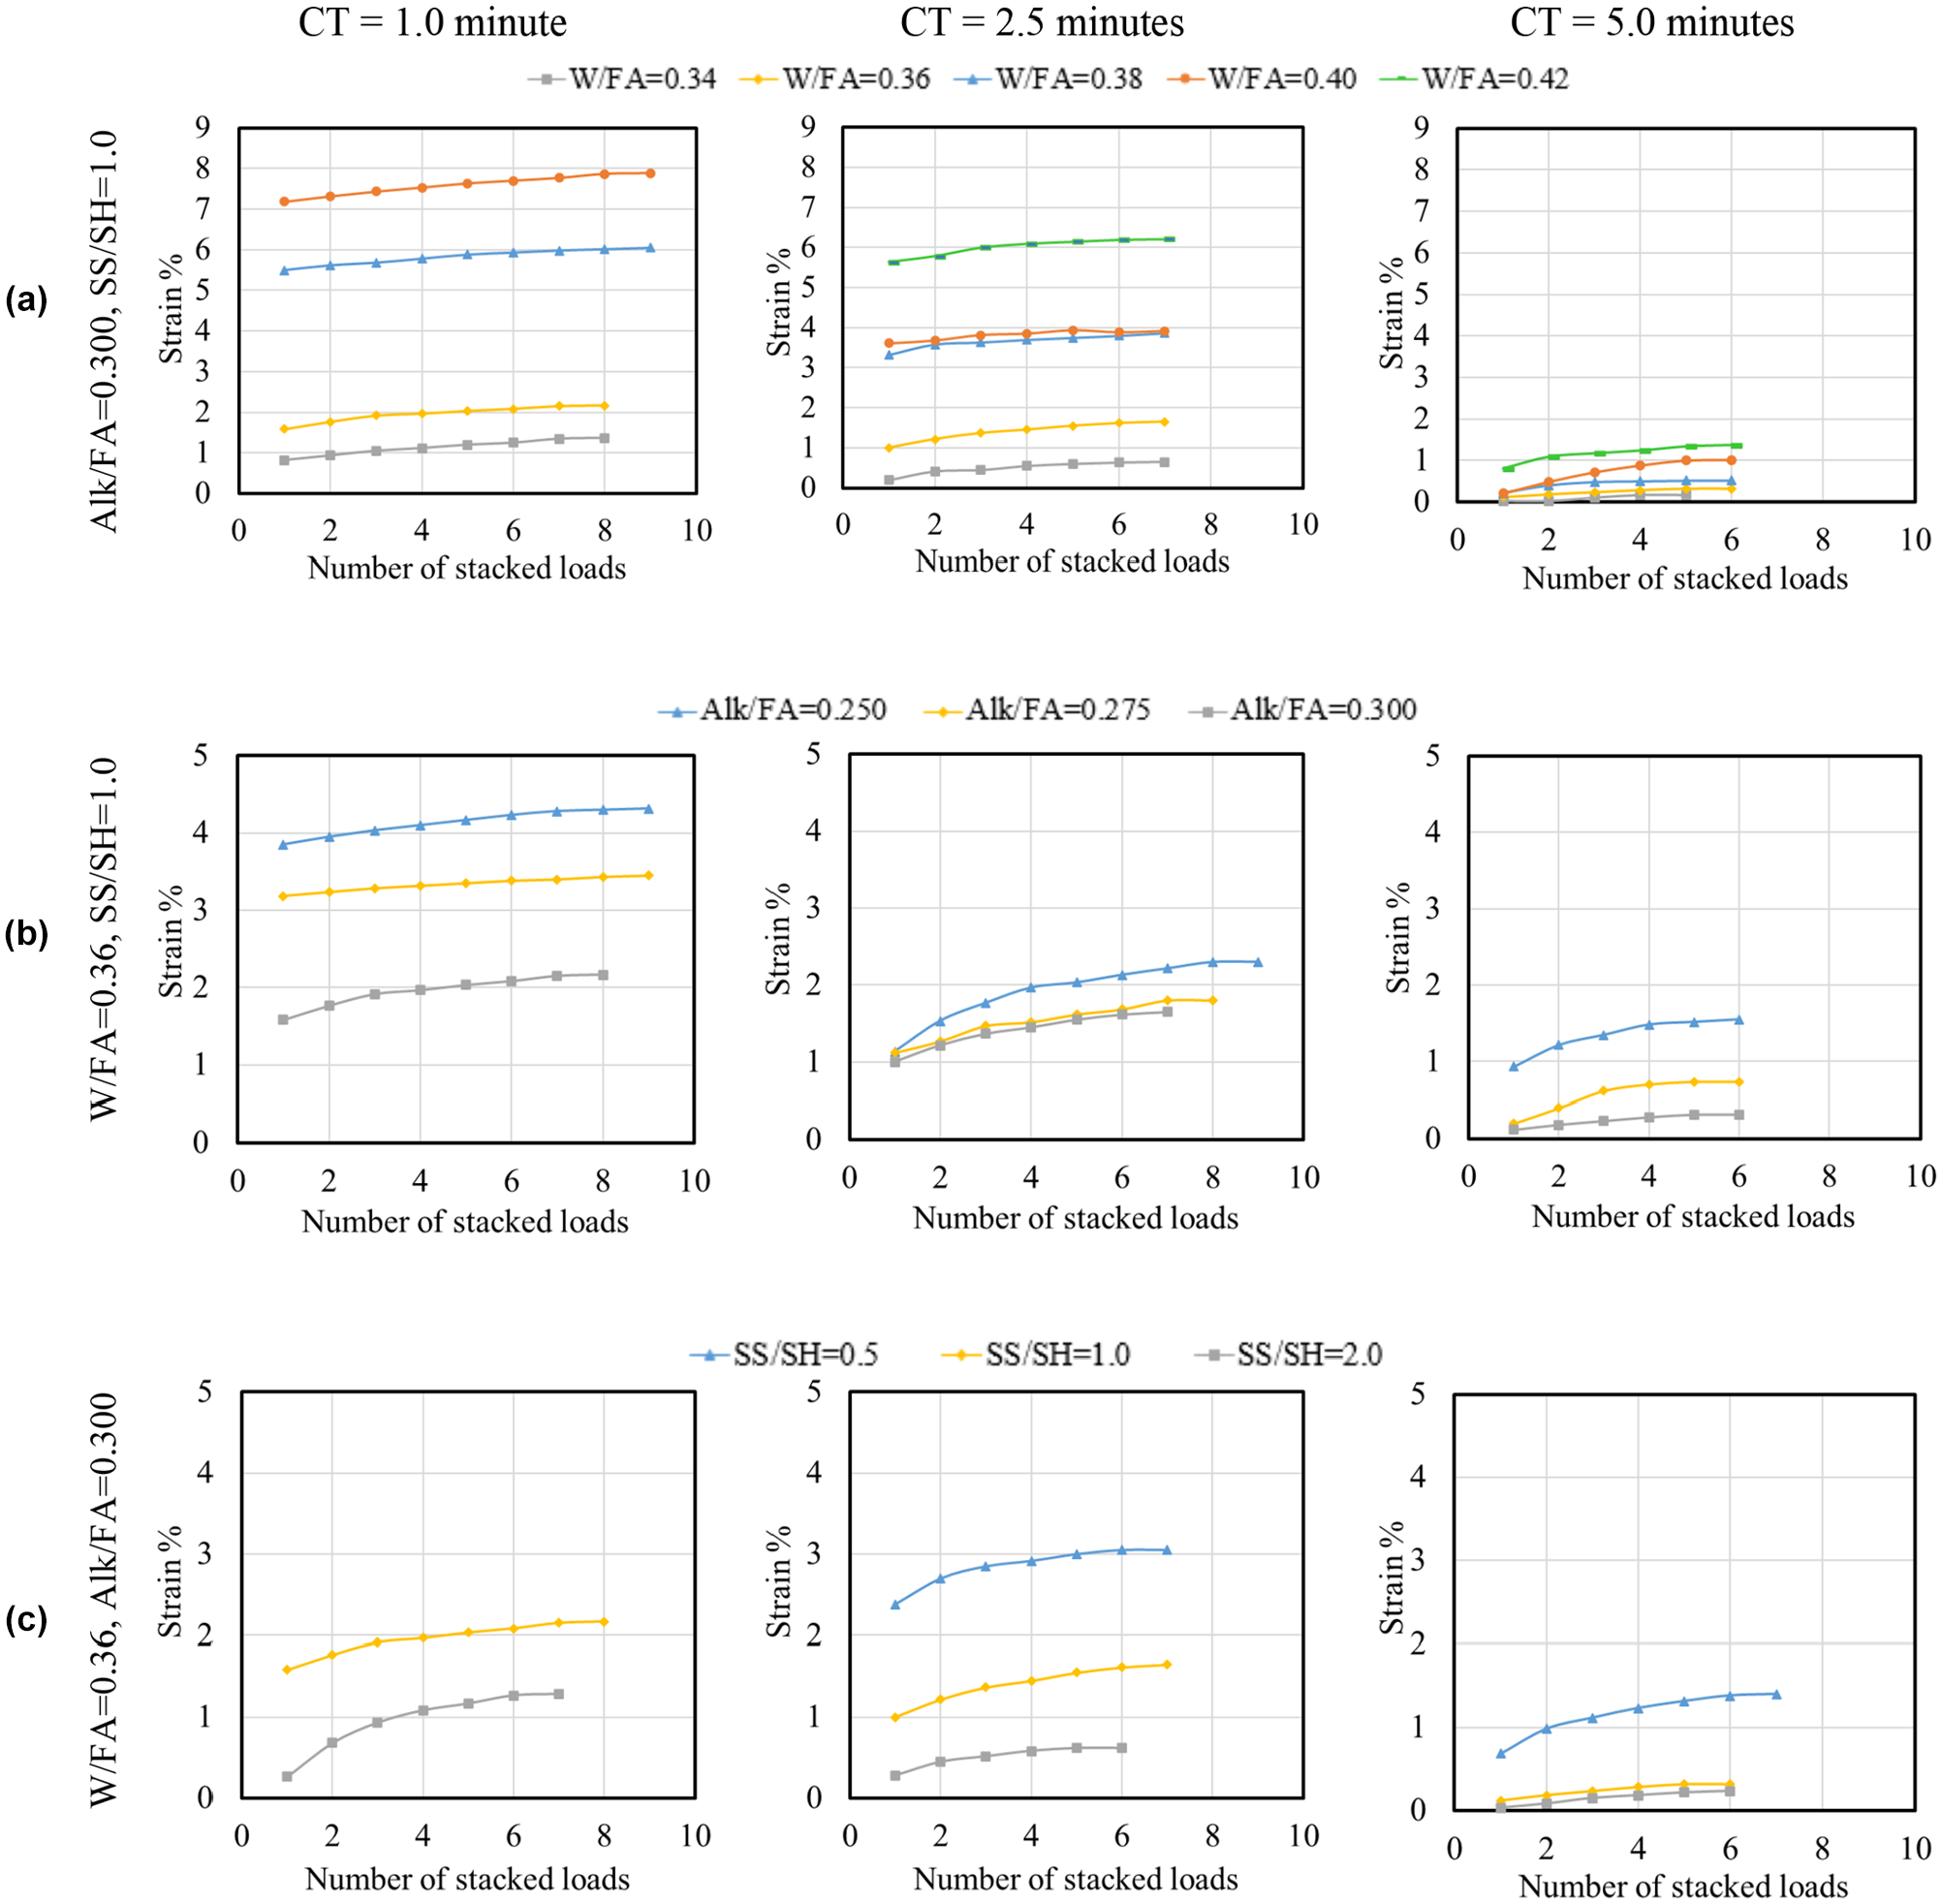
Effect of (a) W/FA, (b) Alk/FA and (c) SS/SH on the axial strains (Note the difference in the scale of the vertical axis).
With increased CT, the rate of evaporating of the free water increased, which increased the AAM hardening rate and improved the overall AAM stiffness, which in turn caused the material to change from being in the fluid state to a plastic state. Therefore, it can hold itself and other subsequent layers (9, 28). When the CTs ranged from 0 to 80 min, the immediate axial strains ranged from 76% to 0.0% (28, 30, 31 , 60 ).
Effects of W/FA, Alk/FA, and SS/SH
Figure 6a shows the effect of W/FA, with Alk/FA of 0.300 and SS/SH of 1.0, on the axial strains with increasing loads at CTs of 1.0 min, 2.5 min, and 5.0 min. The axial strain increased with increasing the W/FA and the number of stacked loads. For a CT of 1.0 min, and W/FA ranging from 0.34 to 0.40, the axial strains ranged from 1.37% to 7.88% and the number of stacked loads reached nine layers. This trend was the same for CTs of 2.5 min and 5.0 min, for W/FA ranging from 0.34 to 0.42, and for axial strains ranging from 0.65% to 6.22% and from 0.17% to 1.37% with the number of stacked loads reaching seven and six for CTs of 2.5 min and 5.0 min, respectively. With increasing the W/FA, the strain increased because AAMs had higher free water content which increased the deformability ( 54 ). It is worth noting that the AAM with W/FA of 0.42 was not included in Figure 6a as it had high strains reaching approximately 11.2% only after the first load.
Figure 6b shows the effect of Alk/FA ranging from 0.250 to 0.300, with W/FA of 0.36 and SS/SH of 1.0 on the axial strain with increasing the number of stacked loads at CTs of 1.0 min, 2.5 min, and 5.0 min. For a CT of 1.0 min, the strain ranged from 2.17% to 4.32% and the number of stacked loads reached nine. This trend remained the same for CTs of 2.5 and 5.0 min, with the number of stacked loads reaching six and the axial strains ranged from 1.65% to 2.30%, and 0.33% to 1.55%, respectively. The axial strains decreased with increasing Alk/FA. Increasing the Alk/FA accelerates the geopolymerization process, which results in short setting time (i.e., workability) ( 44 ). This decreases the deformation, which both enhances and improves the buildability.
Figure 6c shows the effect of SS/SH ranging from 0.5 to 2.0, with W/FA of 0.36 and Alk/FA of 1.0, on the axial strains with increasing the stacked loads at CTs of 1.0, 2.5, and 5.0 min. The axial strains decreased with increasing SS/SH. For a CT of 1.0 min, the axial strain ranged from 1.28% to 2.17% and the number of stacked loads reached up to nine. This trend was the same for CT values of 2.5 min and 5.0 min with the number of stacked loads reaching to six and the axial strain ranging from 0.62% to 3.05% and 0.23% to 1.40%, respectively. With increasing the SS/SH, the setting time decreased and the AAM rapidly lost its workability ( 61 ), which resulted in less deformation and good buildability. The AAM with a SS/SH of 0.5 was not included in Figure 6c as its high strain reached 10.1% under the first stacked load.
Compressive Strength
Effect of the 3DPC on the Compressive Strength
Figure 7 shows the compressive strengths of the full-height and 3DPC specimens having different CTs. The compressive strengths of the full-height specimens were always higher than those of the 3DPC specimens. The compressive strengths of full-height specimens were 0.2% to 28% higher than those of the 3DPC specimens based on the testing direction, that is, the X and Z directions. These results were similar to what was reported for OPC-based 3DPC specimens with reductions in the compressive strengths ranging from 5.0% to 30% ( 13 ) compared with full-height specimens
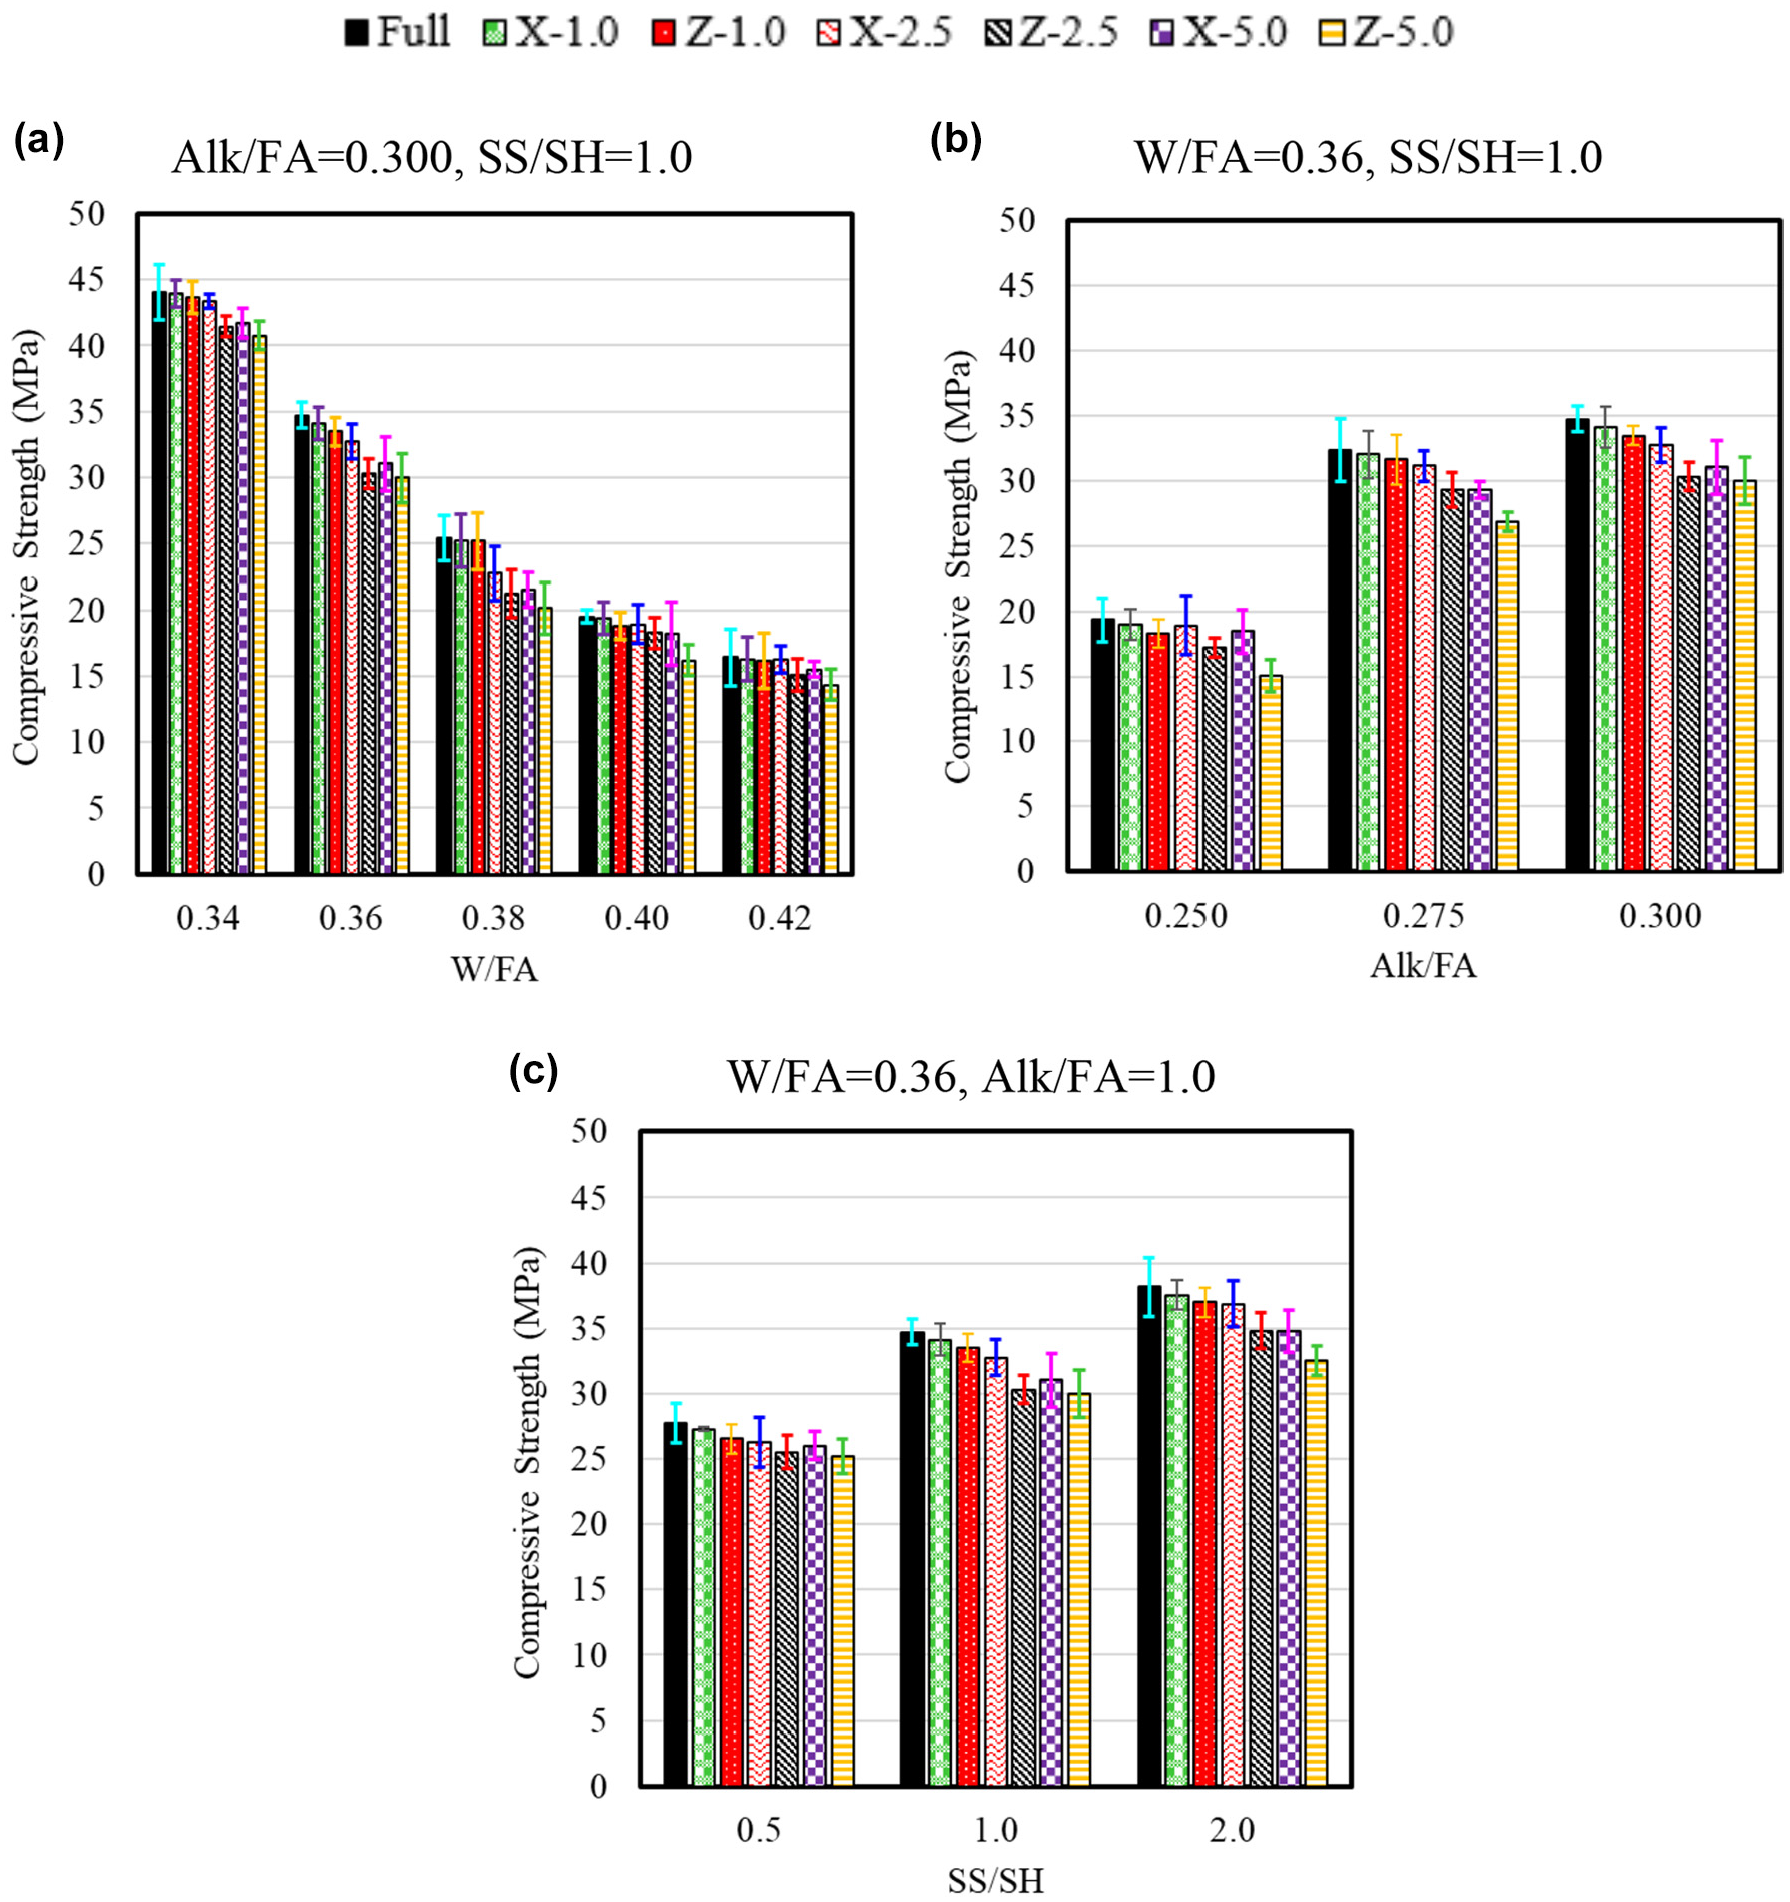
Effect of (a) W/FA, (b) Alk/FA and (c) SS/SH on the compressive strength of full-height and 3DPC specimens having different CT.
The decrease in the compressive strengths of the 3DPC specimens compared with those of the full-height specimens occurred because of the relatively insufficient interaction and interlinkage between the subsequent layers ( 36 ) leading to the layers’ slippage/separation. The weak interfacial bond occurred because of the lack of compaction of the layers which trapped air voids at the interfacial joint (13, 16). There was also a moisture loss from the top surface of each layer, as some moisture on the top layer’s surface is required to maintain adequate workability to develop the interfacial bond, resulting in lower compressive strength ( 9 ).
Effect of the Loading Direction on the Compressive Strength
Figure 7 shows the compressive strength results of the full-height and 3DPC specimens tested in X and Z directions for different ratios of W/FA, Alk/FA, and SS/SH. The 3DPC specimens displayed an anisotropic phenomenon where the compressive strengths in the X-direction were always higher than those of the Z-direction by 0.03% to 3.5%, 3.6% to 10%, 2.2% to 23%, 4.6% to 10%, and 7.1% to 14% for CTs of 1.0, 2.5, 5.0, 30, and 60 min, respectively (Figure 7). A higher compressive strength in the X-direction could be caused by the nature of the tested specimens. When placing the concrete in the molds, the sides and bottom faces of the test specimens were perfectly even inside the molds, whereas the top surfaces were manually leveled. This variation in the surface quality affected the results of the 3DPC specimens tested in the Z-direction, where they were exposed to stress concentrations on the upper surface, which was not perfectly flat and had some imperfections compared with those 3DPC specimens tested in X-direction, which was exposed to stress on the sides of the AAM specimen that were perfectly flat.
Effect of the CT on the Compressive Strength
Figure 7 shows the compressive strength results of the full-height and 3DPC specimens having different CTs. When the CT increased, the compressive strength of the 3DPC decreased. For a CT of 1.0 min, the compressive strengths for 3DPC specimens tested in both directions were slightly smaller than those of the full-height specimens, ranging from 0.2% to 5.3%, whereas for CTs of 2.5 min and 5.0 min the reduction ranged from 1.3% to 17% and 4.7% to 21%, respectively. The compressive strength test of 3DPC specimens at long CTs of 30 min and 60 min was carried out for AAM5 and AAM8 as they had relatively long OT, and the reduction ranged from 6.6% to 20% and from 7.3% to 22%, respectively. A CT of 24 h was carried out on AAM1 to investigate the significant effect of CT, with reduction of the compressive strength reaching 51%.
The failure pattern of all specimens tested in both directions, for all CTs, was similar, and failure occurred as a result of the shear effect from the two loading ends (Figure 8) except for the 3DPC specimen having a CT of 24 h tested in X-direction (Figure 8d), where separation occurred between layers 1 and 2. This similarity in the failure pattern can explain the relatively low reductions in the strengths of the 3DPC specimens compared with those of the full-height specimens. The reduction in the compressive strength of the 3DPC specimens occurred because of the loss of moisture at the surface layer which increased with increasing the CT. Losing moisture led to reductions in the interfacial bond between subsequent layers. Furthermore, with increasing CT, more FA particle nucleation occurred, which increased the hardening rate of the surface of the layer and improved the material’s stiffness. This increase in stiffness caused less disruption on the interfacial material as the CT increased, and subsequently caused lower interfacial bond strength between subsequent layers ( 36 ).

Failure patterns in compression test for 3DPC specimens tested in (a) Z-direction, (b) X-direction with CT of 5.0 min, (c) Z-direction and (d) X-direction with CT of 24 h.
Effect of the W/FA, Alk/FA, and SS/SH on the Compressive Strength of Full-Height Specimens
Figure 7a shows the effect of W/FA on the compressive strength of the tested specimens with Alk/FA and SS/SH of 0.300 and 1.0, respectively. Increasing the W/FA decreased the compressive strengths of the tested specimens. When the W/FA increased from 0.34 to 0.42, the compressive strengths of the tested specimens decreased from 44.1 to 16.4 MPa. Increasing the W/FA increased the formation of voids as the water had no role in the geopolymerization reaction, resulting in higher porosity and lower compressive strength ( 54 ).
Figure 7b shows the effect of Alk/FA on the compressive strengths of the tested specimens with W/FA and SS/SH of 0.36 and 1.0, respectively. Increasing the Alk/FA from 0.250 to 0.300 increased the compressive strength of the tested specimens from 19.4 to 34.7 MPa. This trend was caused by increasing the alkali activators, which increased the solubility of the silica, alumina, and the Na2O and SiO2 content which resulted in a higher rate of geopolymerization (i.e., better reactivity), resulting in denser microstructure and subsequently higher compressive strength (25, 44, 46, 54, 62–64).
Figure 7c shows the effect of SS/SH on the compressive strength of the tested specimens with W/FA and Alk/FA of 0.36 and 0.300, respectively. With increasing SS/SH the compressive strengths of the tested specimens increased. Increasing SS/SH from 0.5 to 2.0 increased the compressive strength from 27.7 to 38.2 MPa. Increasing SS/SH increased the soluble silica (SiO2) which increased the SiO2/Al2O3 ratio, resulting in more Si-O-Si bond and higher compressive strength (3, 44, 54 , 65 ).
Microstructural Analysis of the Interfacial Bond Area
The SEM images and line scan of the 3DPC specimens of AAM1 having CTs of 2.5 min and 24 h are shown in Figures 9 and 10, respectively. Those two specimens with those CTs were selected to explain the relatively strong and weak interfacial bond strength between the AAM layers (Figure 7). The SEM images show the top and bottom layers as well as the interfacial bond zone between them. Along the elemental line the following notations are used: (1) Areas that had a high intensity of Si were detected as sand particles (Noted as “S”). (2) Areas that had a high intensity of Si, Al, and Na were detected as the aluminosilicate gel (N-A-S-H) (Noted as “N”). (3) Areas that had a high intensity of Si, Al, Na, and Ca were detected as aluminosilicate gel with calcium (C-N-A-S-H) (Noted as “C”). (4) Black areas were detected as voids (Figure 10a and b).
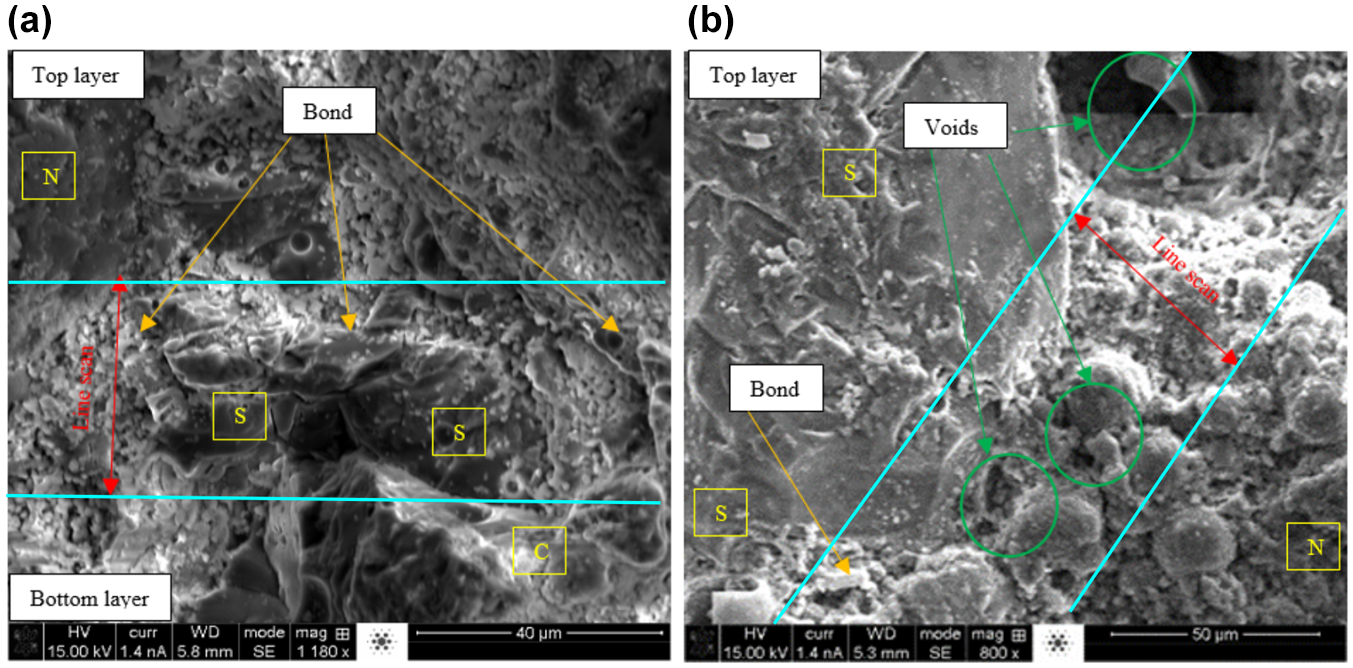
SEM images of AAM1 with CTs of (a) 2.5 min and (b) 24 h of the 3DPC.
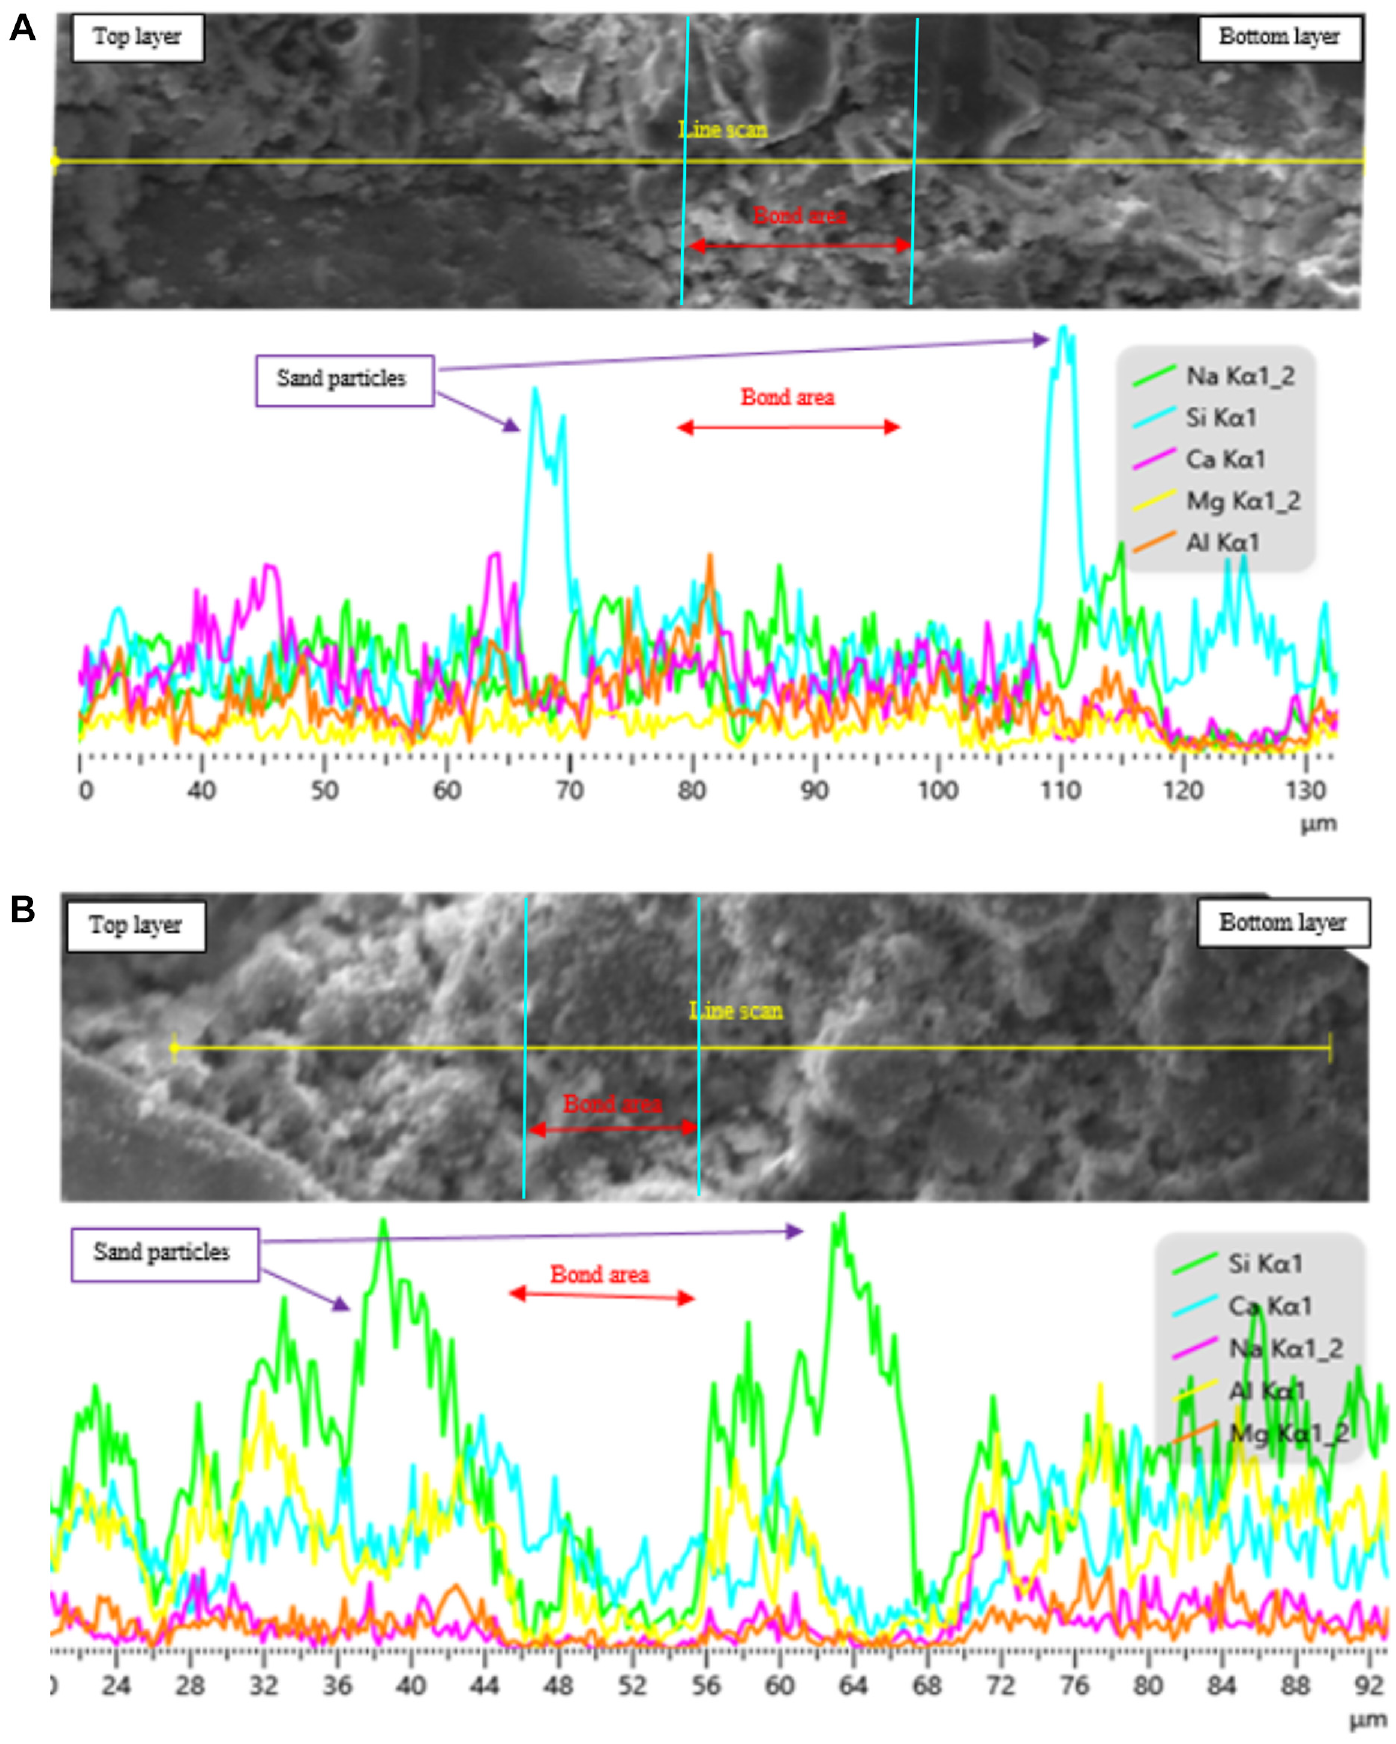
Elemental line scan of AAM1 with CT of (a) 2.5 min and (b) 24 h of the 3DPC.
For the specimen having a CT of 2.5 min, the different elements were distributed approximately evenly in the top layer, bottom layer, and bond area (Figure 10a). The bond area was not obvious in the SEM image (Figure 9a), and it was homogeneously blended with the top and bottom layers (Figure 10a). (Note: the interfacial bond area of this specimen was determined and marked before SEM testing as shown in Figure 4.) Moreover, there were no voids existing in the interfacial bond area. Therefore, relatively high compressive strengths were obtained for 3DPC specimens having short CTs (Figure 7).
For the specimen having a CT of 24 h, the different elements were distributed approximately evenly in the top and bottom layers (Figure 10b). Although the SEM did not show a clear separation line between the top and bottom layers at the interfacial bond area (Figure 9a), there was a drop in the intensity of the different elements at the interfacial bond area between the top and bottom layers (Figure 10b). That drop was caused by the relatively long CT (i.e., 24 h) that negatively affected the interconnection between the top and bottom layers negatively. Moreover, there were voids (i.e., entrapped air voids) between the top and bottom layers at the interfacial bond area (Figure 10b). This explains the roughly 50% decrease in the compressive strength of the 3DPC specimen with a CT of 24 h compared with a full-height specimen.
Providing a Wide Range of AAMs for Different Applications
Based on all 3DPC properties that were studied, AAM-based 3DPC offers a wide range of selections of OTs, deformations, and CTs without adding any admixtures such as accelerators, retarders, or superplasticizer. For example, the OT was extended from 3.5 to 24 min by decreasing the SS/SH from 2.0 to 0.5 with W/FA and Alk/FA of 0.36 and 0.300, respectively. Furthermore, OTs ranging from 2.5 to 5.5 min were obtained by either increasing W/FA from 0.34 to 0.38 with Alk/FA and SS/SH of 0.300 and 1.0, respectively, or decreasing Alk/FA from 0.300 to 0.275 with W/FA and SS/SH of 0.36 and 1.0, respectively. Longer OTs were achieved by increasing the W/FA to 0.40 and 0.42 with Alk/FA and SS/SH of 0.300 and 1.0, respectively; however, the compressive strengths of those mixtures were less than 20 MPa and therefore not a candidate for structural applications.
In relation to the acceptable deformations, specified strain limits can be satisfied using different combinations of mixture design and CT. For example, a strain limit state of 2.00% can be satisfied using the following combinations: (1) for AAM1 and AAM2, the maximum strain was approximately 2.00% with all CTs; (2) all AAMs displayed a maximum strain less than 2.00% when the CT exceeded 5.0 min; (3) with decreasing the Alk/FA to 0.275 or 0.250 (i.e., AAM6 and AAM7, respectively), W/FA of 0.36, and SS/SH of 1.0, the maximum limited strain of 2.00% was obtained with CTs of 2.5 min and 5.0 min, respectively; (4) by increasing the SS/SH to 2.0 (i.e., AAM9), the maximum limited strain of 2.00% was obtained for all CTs; (5) with decreasing the SS/SH to 0.5 with W/FA of 0.36 and Alk/FA of 0.300 (i.e., AAM8), with CTs of 30 min and 60 min, a maximum strain of 1.00% was obtained. Thus, these different options provide flexibility to industry to adopt the AAM mixture that best fits a particular structure rather than using a single mixture for every job.
All AAMs had compressive strengths, ranging from 20.4 to 44.0 MPa, which are adequate for structural applications with all CTs except AAM4, AAM5, and AAM7. The compressive strengths for those mixtures were low for both full-height and 3DPC specimens (i.e., ranging from 14.4 to 19.5 MPa) which will not fit structural applications. Table 3 summarizes the mix designs, OTs, and CTs of the different AAMs that displayed an acceptable deformation and compressive strength for structural applications.
Results of the Accepted AAMs

Note: AAM = alkali-activated mortar; Alk = alkali activators; CT = cycle time; FA = fly ash; OT = open time; SH = sodium hydroxide; SS = sodium silicate; W = water; f’c = compressive strength.
It is worth noting that there could be potential differences between the performance of 3DPC specimens cast with different extrusion processes, such as extrusion methods, the size and shape of the extrusion nozzle, the rotational velocity of the extruder, and printing pressure (7, 32). For example, it was found that the compressive strength of the full-height specimen was about 15% lower than the 3DPC specimens as a result of the deposition process (i.e., pressure in the printing system) (7, 41). Therefore, as there is no actual 3D-printing used in this study, the AAM mixtures that were successful in this study need to be further investigated using a 3D-printing process.
Findings and Conclusions
This study investigated the use of class C FA for different application options of 3DPC. The fresh properties, including extrudability and buildability in relation to OT and deformation, as well as the hardened properties including the compressive strength of different alkali-activated concrete having different W/FA, Alk/FA, and SS/SH were investigated. In addition, the effects of the CT on the deformation and compressive strength of 3DPC specimens tested in two orthogonal directions were investigated. Based on the results, the following conclusions were made:
A 3DPC-based class C FA was successfully developed with a wide range of options to meet the construction industry requirements allowing for flexibility in printing different shapes, sizes, and strengths. The results will allow the industry to select the most appropriate mixture that meets the required construction and structural performance.
Mixtures having a wide range of OT were achieved by controlling the W/FA, Alk/FA, and SS/SH. OTs ranging from 2.5 to 31 min were achieved.
Increasing the CT decreased the immediate axial strains, as the AAM gained enough strength to resist the deformation. Immediate axial strains less than 2.00% were found for mixtures with CTs ranging from 1.0 to 60 min. However, a shorter CT can be used for flexible strain limits cases.
Increasing W/FA resulted in higher deformation, whereas increasing the Alk/FA and SS/SH resulted in lower deformation. The immediate axial strains ranged from 0.17% to 11.2% with different W/FA, Alk/FA, and SS/SH ratios.
The compressive strengths of full-height specimens in both orthogonal directions were higher by 0.2% to 28% than those of the 3DPC specimens. Furthermore, the compressive strength was dependent on the test direction (i.e., normal or parallel to the layer’s deposition). The compressive strength of 3DPC specimens tested parallel to layer deposition was 0.03% to 23% higher than those tested normal to the layer deposition.
By applying a longer CT, the compressive strength of 3DPC specimens was decreased in both orthogonal directions as a result of the reduction in the lower interfacial bond strength between layers. The reduction in the compressive strength reached 51% with a CT of 24 h compared with 1.0 min.
The SEM images and the line scan analyses showed an even distribution in the intensity of the different elements at the interfacial zone between adjacent layers of 3DPC specimens having a CT of 2.5 min, which explains its relatively high compressive strength. However, a drop in the intensity of the different elements and voids at the interfacial bond area of the 3DPC specimens having long CTs were observed, which explains their relatively low compressive strengths.
This study focused on investigating the applicability class C FA-based AAM in simulating 3D-printing. Future work is still required to investigate the rheological properties of class C FA-based AAM and measure the shear deformation. Further, characterization of the interfacial bond strength between the different layers is still required as well.
Footnotes
Author Contributions
The authors confirm contribution to the paper as follows: study conception and design: F. Abudawaba, E. Gomaa, A. Gheni, and M. ElGawady; data collection: F. Abudawaba; analysis and interpretation of results: F. Abudawaba, E. Gomaa, A. Gheni, and M. ElGawady; draft manuscript preparation: F. Abudawaba, E. Gomaa, A. Gheni, and M. ElGawady. All authors reviewed the results and approved the final version of the manuscript.
Declaration of Conflicting Interests
The author(s) declared no potential conflicts of interest with respect to the research, authorship, and/or publication of this article.
Funding
The work in this research project was partially funded by the Missouri Department of Natural Resources (MoDNR).
