



Abstract
While non-essential travel was canceled during the coronavirus infectious disease (COVID-19) pandemic, grocery shopping was essential. The objectives of this study were to: 1) examine how grocery store visits changed during the early outbreak of COVID-19, and 2) estimate a model to predict the change of grocery store visits in the future, within the same phase of the pandemic. The study period (February 15–May 31, 2020) covered the outbreak and phase-one re-opening. Six counties/states in the United States were examined. Grocery store visits (in-store or curbside pickup) increased over 20% when the national emergency was declared on March 13 and then decreased below the baseline within a week. Grocery store visits on weekends were affected more significantly than those on workdays before late April. Grocery store visits in some states (including California, Louisiana, New York, and Texas) started returning to normal by the end of May, but that was not the case for some of the counties (including those with the cities of Los Angeles and New Orleans). With data from Google Mobility Reports, this study used a long short-term memory network to predict the change of grocery store visits from the baseline in the future. The networks trained with the national data or the county data performed well in predicting the general trend of each county. The results from this study could help understand mobility patterns of grocery store visits during the pandemic and predict the process of returning to normal.
In addition to its health impacts, the 2020 global coronavirus infectious disease (COVID-19) pandemic brought historically unprecedented social and economic disruption not seen outside of the World Wars. Because of its high rate of transmission, a limited ability to diagnose it, and no recognized ways to effectively treat the virus, public officials had few options to limit its impact, other than to slow its spread. To accomplish this, governments around the world sought to limit direct person-to-person contact by restricting or banning public activities that involved large gatherings of people and personal interaction. While specifics of these governmental directives varied throughout the United States (U.S.), they ranged from voluntary stay-at-home requests to virtual citywide lockdowns.
Among the outcomes of the governmental restrictions and closures was an enormous decrease in discretionary travel. With nearly all schools, shopping malls, movie theaters, amusement parks, bars, and restaurants required to cease or greatly limit their operations, travel became limited, almost exclusively, to essential activities. While the definition of what is or is not deemed “essential” is somewhat ill-defined, it effectively encompassed activities regarded to be critical and/or necessary for life- and health-sustaining purposes. In most places, this meant shopping for food, accessing medical care, and going to work in similarly defined essential and critical workplaces, such as hospitals, grocery stores, manufacturing facilities, and utility plants.
From a transportation and travel standpoint, the pandemic and the governmental restrictions that accompanied it also created a once-in-a-lifetime, virtual laboratory to observe and assess a range of activities, characteristics, and outcomes of less—rather than more—traffic. Recently completed and ongoing studies are examining how people adhered to the governmental directives to limit travel and interaction, how people changed their modal preferences for public transportation and common carriers like buses, subways, ferries, and airplanes, and how diminished traffic has affected vehicular and pedestrian safety, air quality, and fuel consumption, among many others ( 1 – 3 ). These studies will confirm existing assumptions and, in other instances, bring new understanding to how, when, where, and why people travel.
This paper summarizes another aspect of travel during the COVID-19 onset and lockdown phase in the U.S. Specifically, it describes how grocery store visits (include in-store shopping and curbside pickup) were affected and changed during the pandemic and how, in turn, this understanding can be used to estimate store visits more broadly during more conventional and routine periods. The primary objectives of the research were to first assess how grocery store visits changed during the early outbreak of COVID-19 by examining when and how frequently they took place, then use these patterns to predict grocery store visits in the future. In the study, data from six counties was collected from the initial outbreak of the virus through phase one of the re-opening process. Among the areas of interest were how grocery store visits varied between weekday and weekend periods, and how these observations varied across the locations in the study. The need to assess grocery store visit activity is important for several reasons. Perhaps most importantly is to assess how such activity changes affect grocery supply chains and how store restocking patterns should be adjusted to meet demand. This knowledge can be used for response and planning in similar future events, as well as for other types of disasters and emergencies which may affect travel and access to life-sustaining food and medicine.
The paper includes six sections that highlight and summarize the primary components of this research. The first is a brief review of relevant literature—included to provide context to the study from the perspective of prior research related to grocery store visit patterns in general and travel patterns during the pandemic, as well as a discussion of prior major events and how they too affected modes and patterns of transportation. This is followed by a description of the goals and objectives of the study and a summary of the research design and methodology used to carry out the research. Then, the data collection and analyses are discussed. In particular, the Google Community Mobility system and its statistics were used for this study. This is followed by a presentation and discussion of the analytical testing of the data. Finally, the paper concludes with a discussion of what these data and results may be suggesting, especially in terms of future application of these findings and, potentially, policy guidance—both existing and future—to guide public information and directives in response to emergency conditions.
Literature Review
This section first introduces studies about grocery store visit frequency and regularity in the pre-COVID condition. The second subsection presents studies about human mobility patterns during the early outbreak of COVID-19 in the U.S.
Grocery Store Visits
Marketing research has examined the frequency and regularity (i.e., random or regular) of household grocery store visits. Kahn and Schmittlein found three peaks in days between store visits: 2–4 days, 7 days, and 14 days ( 4 ). In addition, they found those who made more frequent trips spent less each trip, while those who made less frequent trips spent more each trip ( 4 ). Observing trips made in 103 weeks, Kim and Park found 70% of the 1,443 survey respondents visited grocery stores randomly and the rest of them (30%) visited grocery stores regularly ( 5 ). The time interval for regular grocery store visits was mainly a week ( 5 ). Yoo et al. gave a clearer description of trip frequency and regularity ( 6 ). Among six categories of trip patterns, “weekly big trip + a few small trips” (35%) and “biweekly big trips + a few small trips” (22%) were the most popular trip patterns among the 823 survey respondents ( 6 ). Factors affecting household grocery store visit frequency included their demographics, house contexts, store contexts (such as job density, average property value, number of restaurants around), and some other factors (like attitude toward food and factors influencing household food inventories) ( 5 – 8 ). A household is more likely to visit grocery store more frequently if they have a greater household size, are older in age, or have greater access to stores. A household is less likely to do so if they have greater number of workers, earn higher income, own more vehicles, are African Americans, or live in an area with lower residential density.
The aggregate behavior had regularities at large time scales (in months), despite the heterogeneity in household store visit patterns ( 9 ). Aggregate trip patterns changed when the context changed. Store events introduced stochastic impacts at small time scales ( 9 ). Major social events posed significant impacts on shopping-related attitudes and behaviors, such as shopping adaptations during an economic crisis ( 10 ). Emerging technologies also affected in-store shopping travel behavior, such as the rise of online grocery shopping and delivery/pickup service ( 11 , 12 ). About 10% of U.S. customers did online grocery shopping regularly and more than 50% had online grocery shopping experience in 2018 ( 13 ). The percentage perhaps increased during COVID-19 since ordering groceries online and using curbside pickup were encouraged ( 14 ).
Before COVID-19, about 41 million Americans grocery shopped on Saturdays, which made Saturday the most popular day for grocery shopping in the U.S. ( 13 ). For the rest of the week, about 29–30 million people shopped for groceries from Monday to Thursday, while about 33 million people shopped on Friday or Sunday in the U.S. ( 13 ).
Human Mobility Patterns during the Early Outbreak
Researchers have started observing human mobility patterns during disasters by using different data sources, such as social media data, cellphone data, taxi trip data, and data collected from application programming interfaces ( 15 – 20 ). Human mobility patterns during the early outbreak of COVID-19 have also been analyzed because of the significant impacts on travel in the U.S.
Traffic volume, in aggregate, dropped significantly. Parr et al. observed a decrease of 47.5% in Florida based on traffic count data collected from 262 sites between March 1 and March 22, 2020, and the corresponding dates from 2019 ( 1 ). The traffic reduction rate followed a similar trend to the cumulative confirmed COVID-19 cases. The traffic reductions were also related to the state emergency declaration, school closings, theme park operation suspensions, and bar/restaurant closings.
Based on data collected from mobile devices, researchers also found that the national emergency declaration and stay-at-home orders encouraged social distancing in the U.S. but violation behavior also existed in some states/counties ( 21 ). About 5% of the trip reduction (expressed by the average of daily trips per person and daily average person-miles traveled) was related to the stay-at-home orders ( 22 ). The impact of stay-at-home orders reached a ceiling and stopped contributing to the decrease of trip rates or travel miles ( 23 ).
Data Description
This section first introduces the data sources, study areas, and periods. The mobility trend of grocery store visits on the national, state, and county level is then analyzed.
Data Sources
The mobility trend of grocery store visits was extracted from “COVID-19 Community Mobility Reports” provided by Google ( 24 ). The report aggregated data from Google products like Google Maps to the county level by day. The dataset covered mobility changes in the U.S. starting from February 15, 2020. The dataset disaggregated human mobility by location categories. This study used the category “grocery & pharmacy,” which includes places like “grocery markets, food warehouses, farmers’ markets, specialty food shops, drug stores, and pharmacies” ( 24 ). Both in-store grocery shopping trips and grocery pickup trips should be covered by this dataset. The baseline for mobility change comparison was the median value from the 5-week period preceding February 15, 2020 (January 3–February 6). The baseline was not a single value but seven individual values for each day of the week and place category. Therefore, it was not appropriate to interpret the mobility variations by saying that high peaks represented more visitors or low valleys represented few visitors. It was more appropriate to interpret the mobility variations by day of the week. This dataset can help find when human mobility returns to normal (i.e., less deviation from the baseline) by location category.
COVID-19 confirmed cases at the county level were available since March 22, 2020, from the COVID-19 Data Repository by the Center for Systems Science and Engineering at Johns Hopkins University ( 25 ). More spatially aggregated data was available before March 22. This repository drew from official data sources around the world (e.g., World Health Organization, state departments of health), making it a convenient single data source. The data was updated once per day. For this manuscript, data files were obtained for March 22, 2020, to May 31, 2020, and the cases for the study counties were extracted.
Study Areas and Periods
Six counties in the metropolitan areas of the U.S. were studied. Table 1 shows social, economic, and demographic characteristics of each county. Readers may be more familiar with city names, where those counties were seated—Los Angeles, Washington, D.C., Miami, New Orleans, Manhattan, and Houston—and these city names are used for ease of discussion. A few noticeable differences among these areas are: 1) Washington, D.C. and Manhattan are more transit-dependent, while the other four counties are car-dependent; 2) Miami and Houston have lower health insurance coverage rates than the others, which may influence health protection measures adopted by the public; 3) Miami has a greater percentage of households with one or more people aged 65 years and over, which could affect shopping behavior; 4) Washington, D.C., and Manhattan have much higher household income than the others, which could influence household grocery expenditure, store visiting, and online shopping behavior; 5) New Orleans has more households without a computer or a broadband Internet subscription, which influences the feasibility of online shopping; 6) convenience stores are popular in D.C. and Houston ( 5 , 7 , 8 ). However, convenience stores seem to be omitted from the Google Mobility Reports (visits to these stores could be explored in the future with other data). The percentage of confirmed cases and deaths in each county are also shown in the table.
Study Area Descriptions

Note
Figure 1 shows the mobility trend of grocery store visits in the U.S. and in each of the six counties/states between February 15, 2020, and May 31, 2020. Weekends were shaded with grey blocks. The timeline of major events (including national emergency, state of emergency, lockdown, and the phase one opening) and the number of daily confirmed cases in each county (shown by the grey solid line with “*” markers) were overlaid in the plots.
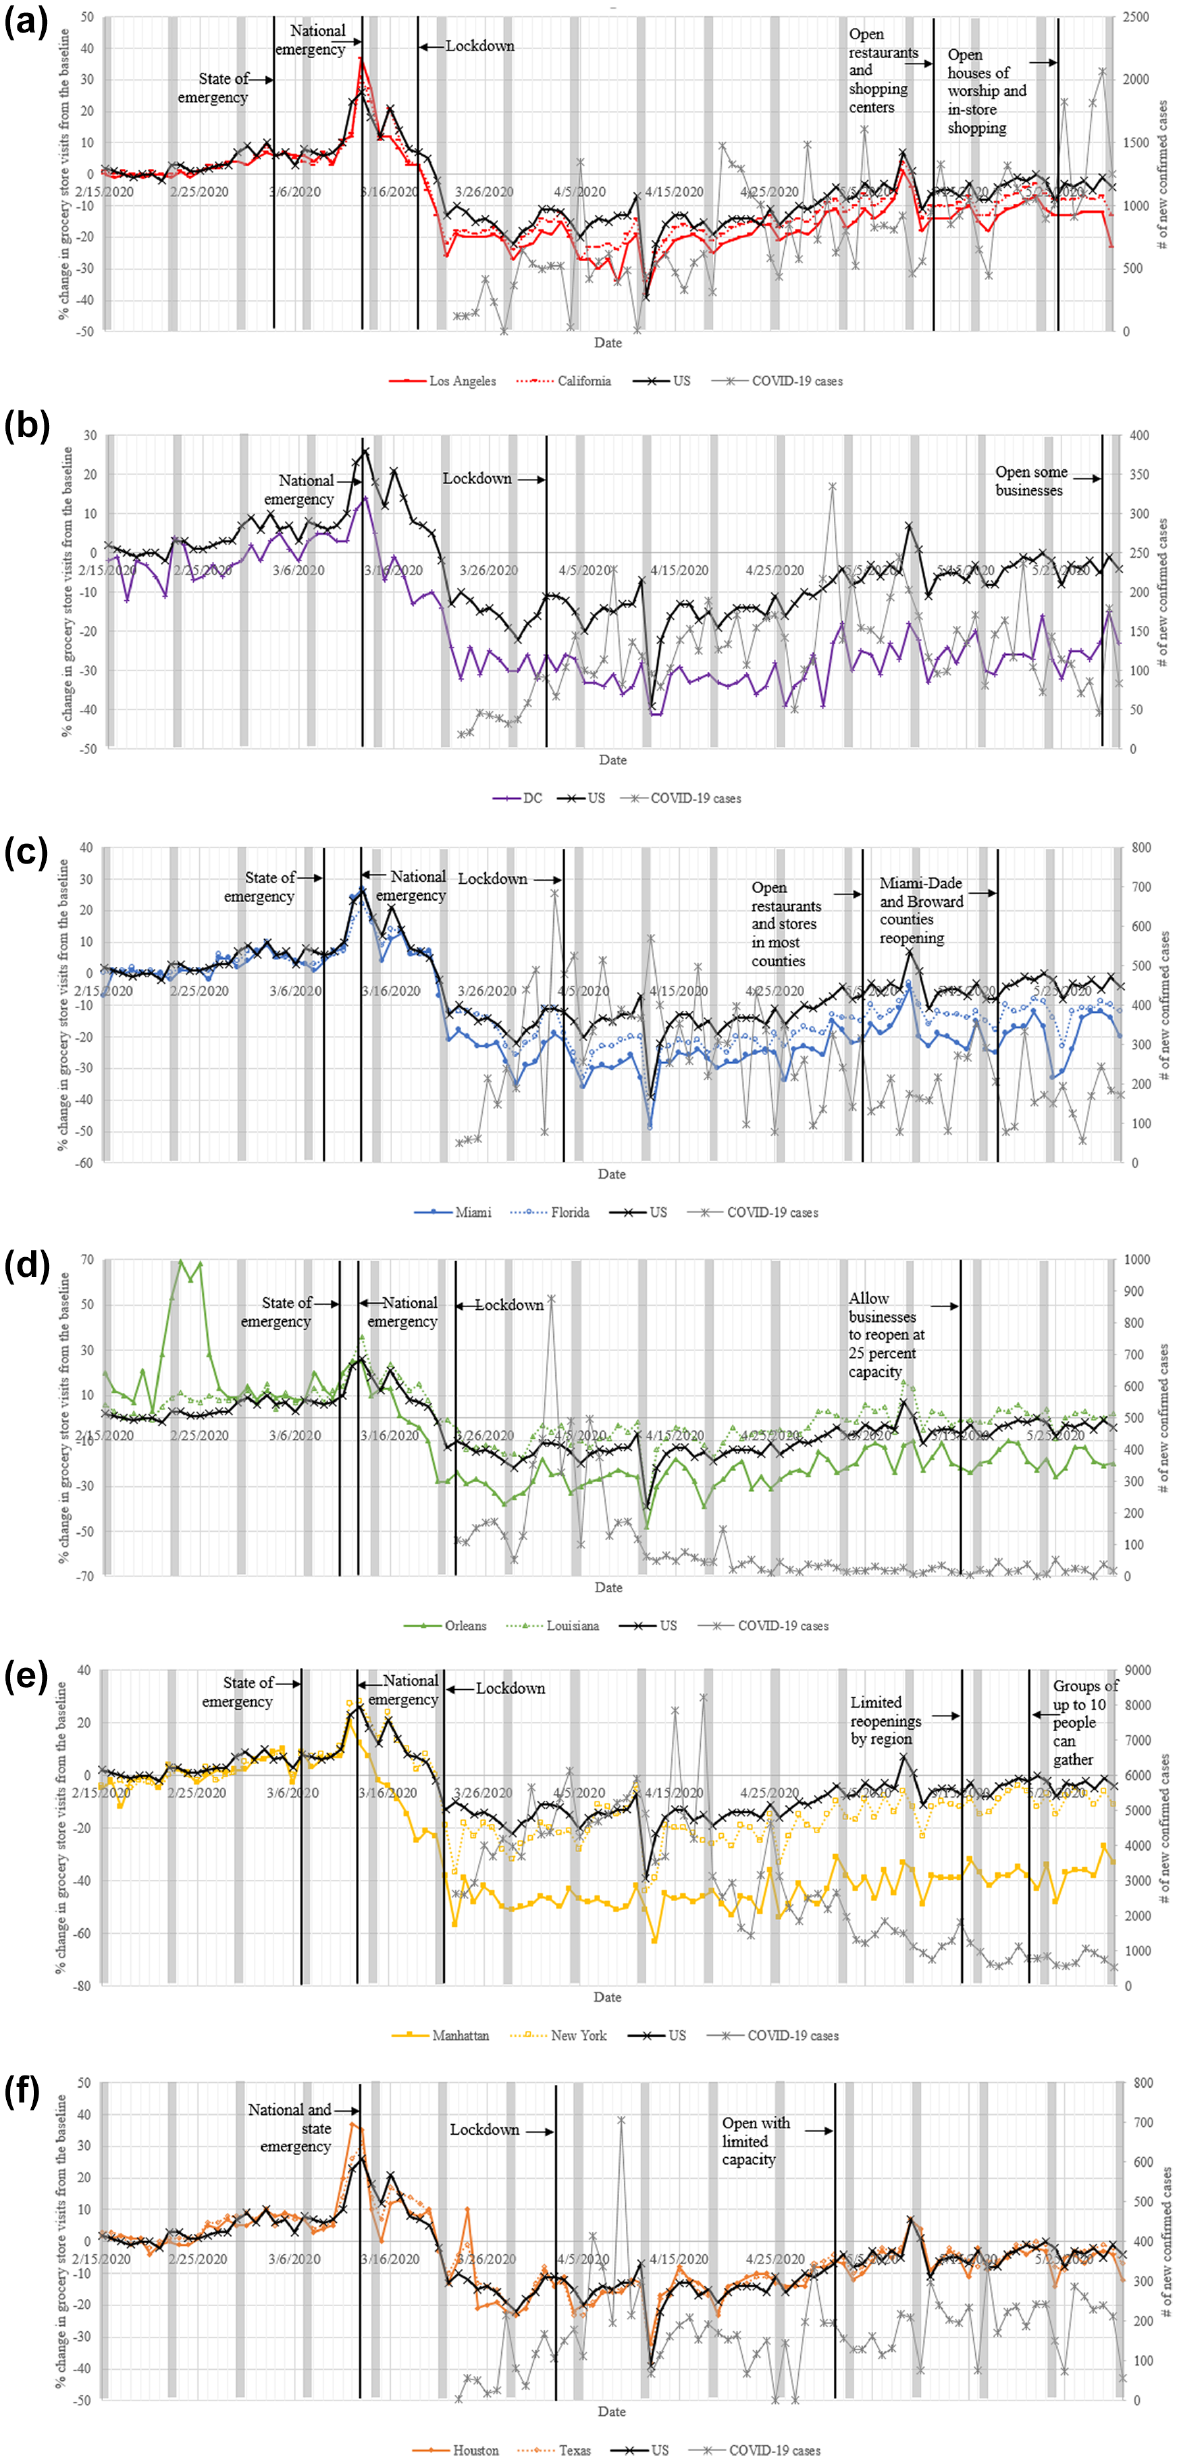
Percentage change of grocery store visits from baseline: (a) Los Angeles, California, (b) District of Columbia (D.C.), (c) Miami, Florida, (d) New Orleans, Louisiana, (e) Manhattan, New York, and (f) Houston, Texas.
Characteristics of the national trendline (shown by the black solid line with “X” markers) included:
There was a significant rise in grocery store visits around March 13 when the national emergency was declared ( 28 ). Stocking up on essential food items perhaps led to the trip surge ( 29 ).
Since late March (after many states implemented lockdowns), grocery store visits were less frequent than the normal condition (e.g., February 2020). However, households spent more on groceries in the U.S. as of April 11 ( 30 ). Three possible explanations were that: 1) households spent more during each store visit when their trip frequency dropped, which matched findings in past studies; 2) online grocery shopping and delivery service became more popular during the pandemic but it cost more than in-store shopping or grocery pickup service; and 3) stay-at-home orders and the closure of restaurants induced higher grocery consumption ( 4 ).
Days of the week were not affected equally despite the overall declining status. From mid-March to mid-April, larger trip reductions occurred on weekends than on the workdays of the same week. This finding indicated that households may have tended to keep their workday grocery store visit behavior while canceling their weekend grocery store visits. The situation changed since late April, after which households appeared to start to resume their Saturday grocery store visits.
Grocery store visits in the U.S. seemed to start to return to pre-state-of-emergency behavior from early May until the end of this paper’s study period. The change rate from the baseline was within 10% in May, as some states began re-opening.
Each county/state also had their own characteristics, which are discussed below. In each plot, the solid line with a solid mark represented the grocery shopping mobility trend in a county. The dotted line with a hollow mark represented the mobility trend in a corresponding state.
California had the earliest lockdown (i.e., stay-at-home order) among the six states. The grocery store visit trend in the state was similar to the national trend, but the reduction rate was slightly greater than the nation. Los Angeles had a greater reduction rate in grocery store visits than the state. Grocery store visits increased by about 5% the week of the declaration of state emergency (on March 4) in the county and the state. The declaration of national emergency (on March 13) coincided with a greater increase (more than 30% on that day) in grocery store visits in the county and the state. Trip change rates dropped below zero after the state locked down on March 19, indicating fewer trips than normal in the county and the state. The re-opening of restaurants (on May 12) and in-store shopping (on May 15) seemed to have little impact on grocery store visits, since trip change rates were generally the same as the previous weeks in the county and the state. Grocery store visits in the state seemed to start returning to the normal condition by the end of May with less than 10% change. However, this was not the case for Los Angeles since the trip reduction rate was still over 10% by then.
Washington, D.C., experienced a much greater decline in grocery store visits than the nation. Grocery store visits first increased 14% on the day of national emergency declaration (March 13) and dropped quickly and significantly after that. The lockdown had little impact on grocery store visits in Washington, D.C., since trip change rates in that week were generally the same as those in the previous week. Grocery store visits did not return to normal conditions by the end of May in Washington, D.C., since the reduction rate was still over 20%.
Florida had the latest lockdown among the six study states. The grocery store visit trend in Florida was similar to the national trend, but the trip reduction rate was greater than the national trend. The trip reduction rate of Miami was even greater than the state. The impact from the state emergency declaration (on March 9) was less than that from the national emergency declaration. Grocery shopping trips started to drop long before the state was locked down on April 3. Re-opening of restaurants and stores (on May 4) in the state appeared to have encouraged people to visit grocery stores, since trip change rates increased compared with the previous week. However, grocery shopping activities in Miami or Florida did not return to the normal condition by the end of May, since the trip reduction rate was still around 20%.
Louisiana had a fast-growing number of confirmed COVID-19 cases in the early stage, possibly associated with a major gathering event (i.e., Mardi Gras on February 25) in New Orleans. The grocery store visit trend in Louisiana was similar to the national trend, but the trip decline rate was lighter than the national trend. In New Orleans, grocery store visits first increased sharply (50%–70%) on and before February 25, likely because of Mardi Gras. Grocery store visits also increased about 30% the week of the declarations of state emergency (March 11) and national emergency (March 13). The grocery store visits in New Orleans started to drop a few days before the state was locked down on March 23. The trip decline rate in New Orleans was much larger than the state or the nation. The phase one re-opening (on May 15) had limited impacts on grocery store visits in New Orleans or the state, since trip change rates of that week were nearly the same as the previous week. Grocery store visits in the state seemed to return to the normal condition starting in late April with less than 10% changes from the baseline. However, grocery store visits in New Orleans did not return to the normal condition until the last day of May, before which a 10% reduction existed.
New York had the greatest number of confirmed cases of COVID-19 in the U.S. in this paper’s study period. The grocery store visit trend in the state was similar to the national trend, but the trip reduction rate was slightly greater than the national trend. Grocery store visit changes in the state started by increasing after the state emergency declaration (March 7), peaked around the national emergency declaration (March 13), and remained above normal until the state lockdown (March 23). In Manhattan, the change of grocery store visits reached the peak 1 day before the national emergency declaration and dropped below zero two days thereafter. The trip reduction in Manhattan appeared much earlier than the state lockdown, but the lockdown seemed to drop trips even further. Around that time, truck drivers refused to carry deliveries into Manhattan because they were afraid of contagion and the requirement for self-quarantine for 14 days ( 31 ).
As shown in Figure 1e, in Manhattan, the reduction rate exceeded or was around 40% in most of the study timeframe. The phase one re-opening (May 15 and May 22) did not affect grocery store visits significantly, since trip change rates remained similar to the previous weeks. Grocery store visits in the state seemed to start to return to the normal condition by the end of May with less than 10% changes on most of the days. However, for Manhattan, the trip reduction rate was still over 20%.
Texas had a late lockdown and early re-opening. The grocery store visit trends in Houston and the state were similar and close to the national trend. The state and national emergency declaration on March 13 induced significant increases (over 20%) in grocery store visits. The change in trips dropped below zero from late March, before the lockdown order was issued on April 2. Grocery store visits were relatively more active after re-opening on May 1. Grocery store visits in Houston or Texas started returning to normal after the re-opening. Figure 1f shows the reduction in grocery store visits from the baseline was within 10% after the re-opening.
Pearson correlation tests were performed to further explore the temporal autocorrelation of the grocery store visit data. One assumption in a Pearson correlation test is that both variables are normally distributed. The results from the Shapiro-Wilk normality tests showed that the null hypothesis “the data are normally distributed” cannot be rejected at the 95% confidence level. As shown in Table 2, the Pearson correlation coefficients between the trip change rate from the baseline of day (
Temporal Autocorrelation Tests

Methodology
Recurrent neural networks (RNNs) are able to address the issue of sequence dependence in the data. The long short-term memory (LSTM) network is a type of RNN ( 32 ). A common LSTM unit is composed of a cell, an input gate, an output gate, and a forget gate. The cell remembers values over arbitrary time intervals and the three gates control the cell state by regulating the flow of information into and out of the cell. The structure of the LSTM network also makes it capable of handling ÿ£¢long-term dependencies in time series prediction problems, which are challenging to the standard RNNs ( 33 ).
The time series prediction problem in this study was to predict the change of grocery store visits from the baseline in the future. The problem was re-framed as a supervised learning problem: predicting the grocery store visit change on day
The three hyperparameters can be tuned iteratively. Each configuration (i.e., a set of the three hyperparameters) needs multiple runs to reduce the impacts from the random initial conditions. The average root mean squared error (RMSE) between the predicted values and the actual values from the multiple runs can be calculated to evaluate the performance of a trained LSTM network. The smaller the RMSE, the better the trained LSTM network performs. The following subsection explains the process in detail based on the grocery store visit trend data.
Training the LSTM Network
This section took the grocery store visit data on the national level as an example to explain how the LSTM network was trained and validated. The mobility data of the first 70 days (February 22–May 1) were used as the training data to develop the LSTM network. The rest of the national data (28 days, May 2–May 29) were used as the testing data to see whether the trained LSTM network had an overfitting issue. Data from February 15–February 21 were explanatory variables because time lags of 7 days were used. Data from May 30 and 31 were dropped from the modeling because weekly data were required.
Figure 2a shows the value of RMSE in 50 trial runs when a training LSTM network was applied to both the training (shown by blue solid lines) and testing (orange dashed lines) datasets after each training epoch. Generally, a larger number of runs are needed to observe how a configuration may perform on average. For example, Hochreiter and Schmidhuber made 10 or 20 trial runs in demonstrating the effectiveness of LSTM network in solving problems ( 32 ). This study made 50 trial runs each time to obtain reliable average values with the consideration of controlling the processing time. The value of RMSE clearly decreased over the training epochs for all of the trial runs. This meant the model was learning the problem and gaining predictive power. Generally, more training epochs result in a more skillful model. However, the model overfits the training dataset at the cost of worse performance on the testing dataset when there are too many epochs. The sign of overfitting is an increasing trend of RMSE on the testing dataset. The researchers paid attention to the overfitting issue and found the best hyperparameter configuration (giving smaller RMSE) by doing the following tests iteratively.

Results of diagnostic tests in training: (a) root mean squared error (RMSE) on the training and testing sets in 50 experimental runs, (b) box plot of RMSE in testing epochs, (c) box plot of RMSE in testing batch size, and (d) box plot of RMSE in testing neurons.
First, epochs ranging between 200 and 4,000 were tested to find the best configuration. Figure 2b shows the boxplot of RMSE values from 50 trial runs in testing the number of epochs. The horizontal lines of each box stand for the 75% quantile, mean, and 25% quantile. The two horizontal lines outside a box stand for the maximum and minimum values. Outliers were plotted as dots. Figure 2b shows that the mean RMSE first decreased and then increased as the number of epochs increased. There was also a significant increase in the case of 4,000 epochs, which made testing a larger number of epochs less necessary. The number of epochs with the smallest mean RMSE entered the next hyperparameter tuning step.
Second, batch sizes ranging between 1 and 14 were tested to find the best configuration. In Keras, the batch size needs to be a factor of the size of the testing (which was 28 in this study) and the training (which was 70 in this study) dataset. Therefore, 1, 2, 7, and 14 were tested in this study. Figure 2c shows the boxplot of RMSE values from 50 trial runs in testing batch size. The batch size with the smallest mean RMSE entered the next tuning iteration.
Third, neurons ranging between 1 and 5 were tested to find the best configuration. Figure 2d shows the boxplot of RMSE values from 50 trial runs in testing the number of neurons. The mean RMSE also decreased first and then increased as the number of neurons increased, which made testing more than 5 neurons less necessary. The number of neurons with the smallest mean RMSE entered the next hyperparameter tuning step.
After several iterations, the mean RMSE did not improve significantly. This study found 1,000 epochs, 2 neurons, and 7 batches yielded the smallest mean RMSE (which was 4.26) for the national data analyzed.
Performance of Trained LSTM Networks
The LSTM network trained with the national data and another trained with county data were then applied on each county to see how they performed. Figure 3 shows the plots of predicted results against actual values for visualization. The value of RMSE was also reported. Predictions for February 15–21 and May 30–31 were not available because they were either explanatory variables or dropped.

Results of predictions: (a) predict Los Angeles (all days: RMSE_National = 5.85; RMSE_County = 4.47. Seven days after issuing a re-opening order: RMSE_National = 3.85; RMSE_County = 1.88); (b) predict Washington, D.C. (all days: RMSE_National = 5.40; RMSE_County = 5.04); (c) predict Miami (all days: RMSE_National = 5.41; RMSE_County = 4.88. Seven days after issuing a re-opening order: RMSE_National = 6.04; RMSE_County = 6.70); (d) predict New Orleans (all days: RMSE_National = 11.65; RMSE_County = 7.18. Seven days after issuing a re-opening order: RMSE_National = 6.11; RMSE_County = 6.24); (e) predict Manhattan (all days: RMSE_National = 6.43; RMSE_County = 6.17. Seven days after issuing a re-opening order: RMSE_National = 2.73; RMSE_County = 7.76); and (f) predict Houston (all days: RMSE_National = 7.09; RMSE_County = 5.60. Seven days after issuing a re-opening order: RMSE_National = 2.42; RMSE_County = 2.70).
The network trained with national data had different performance when it was applied to different counties. The RMSE ranged from 5.4 (for Washington, D.C.) to 11.7 (for New Orleans). In the case of New Orleans, Figure 3d shows that the predicted values had larger deviations from the actual values around Mardi Gras on February 25. The impact from Mardi Gras plus that from the declaration of national emergency lasted through March. The LSTM network predicted mobility on successive days based on mobility data on previous days, which led to greater deviations from actual values in the case of New Orleans.
The network trained with county data also had different performance when it was applied to the corresponding county, but the value of RMSE was smaller. The RMSE ranged from 4.5 (for Los Angeles) to 7.2 (for New Orleans). The prediction for New Orleans still had larger deviations from the actual values than the other cases because of Mardi Gras effects.
The performance of the network trained with the national data and the county data was then compared using the error of predicting grocery store visit changes in the 7 days on and after the day each state issued its first re-opening order. This test was not conducted for Washington, D.C., since the re-opening order was issued on May 29. The network trained with the national data did not necessarily perform worse than the one trained with county data. This was especially true in the case of Manhattan. The underlying reason requires future exploration.
Overall, the trained networks (either trained with the national data or the county data) performed well (RMSE ranging between 4.5 and 11.7 based on all days) in predicting the general trend of each county. First, the spike of grocery store visits resulting from the impact of national emergency declaration showed in each of the plots around March 13. Second, the magnitude of the predicted trip reduction rate generally fit the actual magnitude well in each county.
Conclusions
This study analyzed and estimated grocery store visit changes in six locations across the U.S. during the early outbreak of COVID-19. Each of the counties and states had their own responses to slow the spread of COVID-19. The mobility trend of grocery store visits in the study counties/states also illustrated several unique characteristics.
The first major finding was that the declaration of national emergency on March 13 had the greatest impact on grocery store visits over any of the other events in the analysis. Grocery store visits increased over 20% from the baseline in all the study areas. An increase of over 10% lasted for 7 days at the national level. Government agencies need to pay attention to this phenomenon in future epidemic/pandemic events—if not all major mass emergencies. First, the rapid surge of stockpiling groceries led to shortages and increasing prices of some products, and caused some disruptions to the grocery supply chain ( 29 ). Stores and suppliers should review inventory records and plan for similar demands if subsequent lockdowns occur and for future epidemics/pandemics. Second, the surge of store visits increased customer volumes in stores, which also increased the potential for virus exposure. To manage customer volumes, stores could implement special shopping hours for vulnerable populations, limit the number of shoppers in the store at a time, and otherwise encourage social distancing (e.g., marking waiting spaces for checkout). Additional cleaning and mask requirements could also decrease virus transmission.
The second major finding was that grocery store visits started to drop after the declaration of national emergency and became less frequent than the baseline (i.e., negative changes from the baseline) within about a week. Negative changes from the baseline occurred long before a state/district ordered lockdowns in Washington, D.C., Florida, and Texas. This suggested that people likely monitored the nationwide evolution/spread of COVID-19 and reduced their grocery store visits even though a state/district had not declared a lockdown. In addition, places that had more confirmed cases saw the trips decline sooner. For example, grocery shopping trips in Manhattan declined from the baseline within 2 days of the declaration of national emergency. The popularity and quality of online grocery shopping and delivery service in a local area might also play a role in the trip reduction magnitude and speed. When considering the decreased store visits, managers may consider staffing needs, some of which may shift from traditional roles to preparing orders for curbside pickup and/or delivery. With the 1-day lag having the strongest correlation (see Table 2), flexible staffing could be arranged based on the previous day. If more advanced plans are needed, even a 7-day lag has a strong correlation that could be used to inform staffing plans.
The third major finding was that a county might have different experiences from the state as a whole. For example, New Orleans was the hot spot of confirmed cases in Louisiana at the early stage. The trip reduction rate was still over 10% by the end of May in New Orleans, while the state had minor changes from the baseline. Such spatial differences should be considered when managing supply deliveries.
The fourth major finding was that days of the week were not affected equally on the national level, and the impacts changed as time passed. Larger reductions on weekends than on the workdays of the same week appeared from mid-March to mid-April. Households perhaps wanted to shop for groceries on relatively unpopular days to avoid crowds and such flexibility may have been introduced by changes in work requirements/locations during lockdowns. Smaller reductions on Saturdays than their previous days of the week appeared since late April, which is earlier than the re-opening dates of all the states in this study. Households perhaps started to resume their Saturday grocery store visits because of behavior inertia or pandemic fatigue.
The fifth major finding was that the nationwide grocery store visits declined in the study period, but other studies found Americans spent more on groceries ( 30 ). The implication for grocery industries is that people adopted different grocery purchasing frequencies and methods (such as online shopping with the same-/next-day delivery, curbside pickup, and in-store pickup). Developing user-friendly online shopping platforms, improving delivery systems, or collaborating with independent delivery companies could help the local stores meet their customers’ demands and preferences.
For future studies, the LSTM network can be trained with additional data to further improve its prediction precision. For example, the impact of events (e.g., stimulus check receipt, vaccination, and return to work orders) can be quantified and used as explanatory variables in modeling, since the impact from the national emergency declaration seemed greater than that from state emergency declarations. Another example is to incorporate the variations of other trips so that trip chaining effects can be captured. In addition, several speculations/deductions made in the study need to be validated through responses collected from household surveys. More broadly, many fundamental travel processes are likely to permanently change with the recognition of technology and the ability to work, shop, meet, and interact from home rather than needing to travel. Other pandemic phases (e.g., after different percentages of people are vaccinated) may also present different mobility pattern changes. Therefore, it is also worthwhile to study mobility changes in other activity categories or other time periods, investigate the impact of technology, and determine whether they returned to the old normal.
Footnotes
Author Contributions
The authors confirm contributions to the paper as follows: study conception and design: R. Bian, P. Murray-Tuite; data collection: W. Bian; analysis and interpretation of results: W. Bian; draft manuscript preparation: W. Bian, P. Murray-Tuite, B. Wolshon. All authors reviewed the results and approved the final version of the manuscript.
Declaration of Conflicting Interests
The author(s) declared no potential conflicts of interest with respect to the research, authorship, and/or publication of this article.
Funding
The author(s) disclosed receipt of the following financial support for the research, authorship, and/or publication of this article: Partial support for this study was provided by the Louisiana Transportation Research Center (LTRC) and National Science Foundation Award CMMI-1822436, for which the authors are grateful. B. Wolshon would also like to acknowledge the support of the United States Department of Transportation (U.S. DOT) through their continued sponsorship of the Gulf Coast Center for Evacuation and Transportation Resiliency at Louisiana State University (LSU), a collaborative University Transportation Center (UTC) and a member of the Maritime Transportation Research and Education Center (MarTREC) at the University of Arkansas, and the Center for Cooperative Mobility for Competitive Megaregions at the University of Texas.

Any opinions, findings, and conclusions expressed are those of the authors and do not necessarily reflect the views of the sponsors.