



Abstract
Data quality is the foundation of data-driven applications in transportation. Data problems such as missing and invalid data could sharply reduce the performance of the methods used in these applications. Although there exist plenty of studies related to data quality issues, they only focus on missing or invalid data caused by infrastructure failures (e.g., loop detector malfunction). In general, there is a lack of attention to data quality issues from insufficient data management. This paper proposes a tensor decomposition based framework to tackle a specific missing data problem which occurs when the machine-station dictionary of an automated fare collection system database is incomplete. In such cases, there is a large amount of loss of origin/destination information as the affected machines are not linked to any station. Consequently, all associated transactions may miss the origin/destination information. The proposed framework recovers the dictionary by capturing features of the passenger flow passing through the unlinked fare machine. Evaluation results show that the proposed approach could recover the missing data with high accuracy even when several fare machines are not linked to a station. The framework could also support other beneficial applications.
Keywords
Transaction records collected by automated fare collection (AFC) systems (i.e., AFC data) provide the basis for a wide range of applications and detailed analyses of metro systems. AFC systems are open (only tap-in) or closed (transaction records for both entry and exit). With closed AFC systems, the spatio-temporal origin/destination (OD) information (i.e., tap-in/out time and station of every single trip performed by the metro passengers) is known ( 1 ). This spatio-temporal OD information drives applications from planning to operations and monitoring, such as travel demand/passenger flow prediction ( 2 , 3 ), optimal promotion design ( 4 ), and individual mobility analysis ( 5 ).
Data quality is an important requirement for AFC data to be useful. However, most studies using AFC data rarely mention whether the data quality could be ensured. Nassir et al. ( 6 ) report that in South Queensland, Australia, 64% of the stops/stations in the AFC dataset cannot be identified because of mismatching with General Transit Feed Specification (GTFS) data. The literature also reports data quality issues with other transportation data in addition to AFC data. Smith et al. ( 7 ), for example, point out that missing and erroneous data are the two main problems in traffic data. Xu et al. ( 8 ) report that around 50% of the traffic data in Alberta, Canada, was missing during a seven-year time period. Liu et al. ( 9 ) report that transportation data collected based on cellular networks suffer both missing and invalid data problems from communication failures. Several other studies also report data quality issues with WiFi-related datasets ( 10 – 12 ).
Problems of missing and invalid data are prone to happen for the following reasons:
Human factors. AFC transaction records may be missing if passengers fail to tap in/out properly.
Infrastructure failure. For example, AFC records are triggered when a passenger taps-in/taps-out through an entrance/exit fare machine. The malfunctioning of fare machines may lead to issues of missing data (fare machines fail to record or upload transactions) and invalid data (erroneous transactions).
Inadequate data management. Daily data management for transportation systems is a complex practice. Missing and invalid data may happen in the process of database merging, maintenance, or system update.
The problem of missing or invalid data caused by infrastructure failure in transportation systems is well studied. Plenty of methods have been developed to deal with this problem. For example, Henrickson et al. ( 13 ) proposed a framework to deal with the problem of missing data caused by loop detector failures. Their approach is capable of recovering network-wide traffic data with large blocks of missing values. Liu et al. ( 9 ) presented a framework to solve the invalid data problem caused by mismatching of AFC and automatic vehicle location system times.
However, limited attention has been paid to the problem of data quality caused by inadequate data management, which could raise serious issues if not addressed well. Similar to infrastructure failure and human factors, inadequate data management can also lead to serious data quality issues. For example, for AFC systems, the data collected by each fare machine is independent. The malfunctioning of one fare machine does not influence the transaction records of other machines. Therefore, the problem scale is limited locally. However, an error in data management, such as a hardware or software error, could probably cause a serious chain reaction (e.g., data shifting or mismatching) that would affect a large part of the dataset. It could also lead to indirect costs for operators related to refunds and complaints, and so forth. Inadequate data management could be minimized by transit agencies leveraging advanced technologies and algorithms for monitoring, identifying, and correcting such problems.
This paper aims to tackle a missing data problem caused by inadequate data management, which, to the best of the authors’ knowledge, has not been studied in the literature. It happens because of machine-station mapping information loss during the process of AFC data management. The missing station information may be caused by errors and problems related to the fare machine-station mapping dictionary. Consequently, the information about the station to which a fare machine belongs is missing. A tensor decomposition based framework is proposed to infer the stations to which the unlinked fare machines belong. Tensor based methods take advantage of multidimensional inherent correlations in the data and have been widely used to detect and impute missing data. The hypothesis is that the empty tensor cell values (e.g., the station a fare machine belongs to) should be close to those that share similar patterns for other attributes (e.g., passenger flows). In this approach, tensors are constructed using passenger flows and travel times from the AFC data since fare machines at the same station are expected to share more similar feature patterns (e.g., flows and travel times) compared with those from other stations. Different tensor decomposition algorithms are used to generate feature vectors for fare machines considering different tensor features for flow volumes and travel times. Neural networks (NNs) are used to infer the stations of the unlinked fare machines using as inputs the tensor decomposed feature vectors. An adaptive synthetic (ADASYN) sampling algorithm ( 14 ) is applied to address the data imbalance problem in NN training. A rule-based ensemble learning method is developed to identify the stations of missing fare machines by combining classification results from NN models. A case study validates the performance of the proposed approach.
The remainder of the paper is organized as follows: the station inference approach is proposed in the Methodology section, including tensor construction, tensor decomposition, and station inference. The case study using empirical AFC data from an urban railway system validates both the accuracy and the robustness of the proposed approach. The final section summarizes the main findings and discusses future research directions.
Methodology
The paper aims to infer the station to which a fare machine (in closed AFC systems, with tap-in and tap-out transaction records) belongs when this information is missing. In metro systems, each fare machine has a unique machine identity (ID). The entrance and exit fare machine IDs are recorded in the database along with the transaction times and other relevant information. The AFC database links the fare machine to the associated station using a machine-station dictionary. This is a lookup table that maps each fare machine ID to a unique station. This dictionary may suffer from missing data because of data management issues. For example, a fare machine may not be linked to a station. These fare machines are referred to here as unlinked fare machines. Such errors could be undetected for a period of time. Consequently, the transaction records associated with such unlinked fare machines are not available, as illustrated in Figure 1.
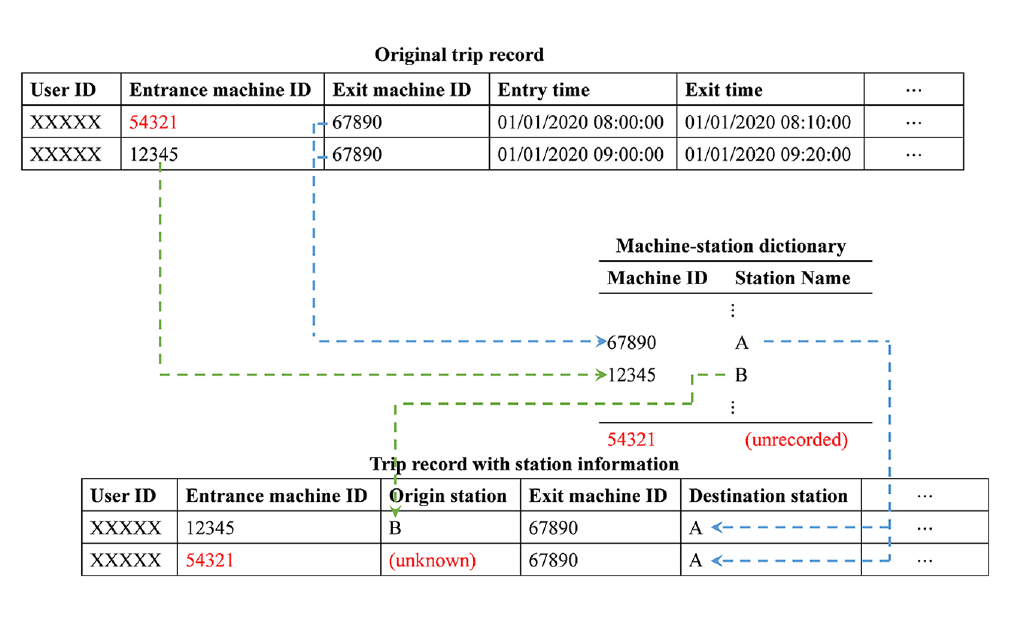
Example of station information in the automated fare collection (AFC) data.
In many organizations, including transport agencies, data ownership may still be fragmented among different departments in the organization. For the example in Figure 1, the raw AFC data and the fare machine and station dictionary are managed by different stakeholders. Delayed updating and coordination could cause the unlinked fare machine problem studied in this paper. For example, fare machines are replaced because of malfunctioning. The updating (adding/deleting) of the dictionary is usually done manually and therefore is prone to human errors. Also, the merging of the updated dictionary to the AFC system is done periodically, resulting in outdated data in the AFC dataset. That means that the OD transactions recorded by the newly installed fare machines may have no corresponding station information, thus they are unlinked according to the proposed definition. From the authors’ analysis of a metro system in China, almost 20% of the AFC records do not have the station information.
The key to address the above problem is to infer the stations of the unlinked fare machines to complete the missing part of the machine-station dictionary. This problem is a classification task, that is, to classify the unlinked fare machines to their corresponding stations based on useful features of the linked fare machines. NNs have been used successfully as classifiers in transportation missing data problems. For example, a deep learning based approach is proposed by Duan et al. ( 15 ) to address the problem of traffic data missing because of loop detector or communication failure. Tan et al. ( 16 ) utilized a tensor decomposition approach to capture the multi-mode (e.g., time, location) correlations in traffic data and recover missing traffic data by reconstructing the traffic flow tensor. The results show that the proposed algorithm performs well, even when the missing ratio is high. Similar to those applications, tensors have the potential to represent the spatio-temporal information in AFC data and generate useful input to the NN model. Tensors are a good way to capture the dependency along different dimensions of the data.
For convenience, the concept of fare machine-related passenger flow (MRF) is defined here. For an entrance fare machine, MRF refers to the passenger flow tapping in at an entrance fare machine of the origin station and tapping out at a destination station (using any machine). For an exit fare machine, MRF represents the passenger flow tapping in at an origin station (using any machine) and tapping out at the exit fare machine. MRF can be characterized using different features, such as flow volume and travel time. Indicators extracted from the MRF features can be used to infer the station of a fare machine. The hypothesis is that the MRF features share more similar patterns if the fare machines are located at the same station than at different stations.
Flow volume and travel time are selected to characterize the MRFs of fare machines. These two features reflect system dynamics from both the demand (mobility patterns) and supply (network and operations) points of view as well as their interactions. They provide complementary knowledge, and therefore give a more comprehensive view of the MRF patterns. Depending on whether the fare machine is an entry or exit one, the meaning of entrance and exit MRF is different and needs to be defined separately. For example, if fare machine #001 is an entrance machine, its MRF is the flow entering through #001 and exiting at any station (i.e., destination station) of the network. On the contrary, the MRF of an exit fare machine represents the flow entering at any station (i.e., origin station) of the system and exiting through the fare machine #001. Formally:
For entrance fare machines, MRF flow volume measures the number of passengers passing through a fare machine at an origin station and going to a destination station. For exit fare machines, it represents the number of passengers entering the metro system at an origin station and tapping out through an exit fare machine. MRF flow volume reflects the mobility behavior of passengers.
MRF travel time indicates the average travel time from a fare machine to a destination station for entrance fare machines and from an origin station to a fare machine for exit fare machines. It reflects the supply characteristics of the metro system (e.g., geographical relationship between stations, scheduling, etc.), but also the demand characteristics of certain stations as it includes time waiting to board a train under capacity constraints.
Tensor Construction
For data representation, tensors are used to characterize the MRF flow volume and travel time. A tensor is a high-order generalization of a matrix. The multi-way property of a tensor fits the nature of MRF features. For example, MRF flow volume can be characterized by “machine mode” (M), “time mode” (T), “day mode” (D), and “station mode” (S). For entrance fare machines, “machine mode” denotes the related fare machine ID, “time mode” represents the time interval of a day (e.g., 6:00–7:00 a.m.), “day mode” denotes the date, and “station mode” denotes a destination station ID. For exit fare machines, the definitions of tensor modes are the same as entrance fare machines, except for the “station mode.” The “station mode” of an exit fare machine is the origin station ID. In this way, two four-way tensors are used to represent the MRF flow volume of entrance and exit fare machines, respectively. For example, an entry: 50 at (A, 8:00–9:00 AM, January 1, B) of entrance machine tensor represents “the passenger flow volume passing through entrance machine A in the interval 8:00 to 9:00 a.m. on January 1 and exiting at station B is 50 passengers.”
The methodology for inferring the stations of the fare machines is the same for entrance and exit fare machines. Entrance fare machines are used to illustrate the proposed framework. Unless stated, the “fare machines” and “MRF tensors” refer to entrance fare machines and entrance MRF tensors, respectively.
To construct the MRF flow volume tensor, the mode variables above are transformed into numerical indices:
Machine mode: the fare machines are labeled from 1 to M. Then the machine IDs belong to a set
Time mode: the hourly interval is used to represent the tap-in time
Day mode: day mode represents the date, thus
Station mode: the stations are labeled from 1 to S
The MRF flow volume is represented by a size

Structure of the fare machine-related passenger flow (MRF) flow volume tensor.
Similarly, the MRF travel time tensor is denoted as
The properties of MRF flow volume and travel time tensors are different, though they share the same structure. The difference stems from the tensor cells that have no AFC observation. For the MRF flow volume tensor, the value of such cells is zero since the MRF flow volume for the corresponding
Tensor Decomposition
Tensor decomposition is used to extract fare machine features from the MRF flow volume and travel time tensors. Given the different properties of these two tensors, different tensor decomposition methods are developed to extract the MRF flow volume and travel time features, respectively.
Tensor Decomposition of MRF Flow Volume
For MRF flow volume tensor

where
The CP decomposition of

where R represents the total number of components.

CANDECOMP/PARAFAC (CP) decomposition of the fare machine-related passenger flow (MRF) flow volume tensor.
Computing the CP decomposition of

where
The feature matrix
Tensor Decomposition of MRF Travel Time
CP decomposition cannot be applied directly to extract travel time features. This is because the travel time tensor has non-numerical (i.e., NaN) entries, which makes the operation

The weight tensor

In the initialization phase, NaN cells are filled with random values. As these values are multiplied by zero during the optimization, they do not influence the results of the optimization objective (optimal solution). After optimization,
Station Inference
Given the MRF features extracted from the MRF flow volume and travel time tensors (i.e., MRF flow volume
NN Classifier
Two alternative strategies have been used in the literature to deal with multi-class classification problems, One-versus-Rest (OvR) and One-versus-One (OvO) ( 20 ). OvR splits the multi-class classification problem into multiple binary classifications. In the context of the station inference problem, this requires that NNs are developed for each station separately, and each NN is trained to output the probability of whether or not the input fare machine belongs to this station. OvO builds one overall NN model with multiple outputs. For a specific input fare machine feature vector, the model outputs the probabilities that this input fare machine belongs to the candidate stations.
This study uses the OvR strategy. The main reason is that the number of fare machines (i.e., the number of training samples) in a metro system is inadequate to train an OvO NN model. For example, assume a metro system has 1,000 entrance fare machines and 100 stations. If the OvO NN model is utilized and the last hidden layer of the NN has 30 neurons, then the number of parameters between the last hidden and output layers will be
Based on the above discussion, for each station, two station-related feedforward NNs (station-FNNs) are built to deal with the MRF flow volume and travel time features, respectively. Each station-FNN is used to infer whether a specific (unlinked) fare machine belongs to a candidate station. The classification process for these two MRF features are the same, thus the classification based on the MRF flow volume is used to illustrate the approach.
The machines linked to a known station are used as the training sample. For each station-FNN, the classification training target is set as one if the corresponding fare machine of a training sample belongs to this station, otherwise to zero. Once the NN is trained, it can be used to classify the unlinked fare machines, based on their MRF flow volume characteristics. Figure 4 shows the station inference process.

Station inference process: (a) training and (b) testing.
Data Imbalance in NN Training
For the problem investigated in the paper, the training dataset is highly imbalanced. Urban rail systems have many stations. Therefore, in the NN training dataset for each station, the number of negative samples (i.e., samples with target 0) is much larger than that of positive samples (i.e., samples with target 1), leading to learning bias. To address the data imbalance problem, the ADASYN method is used to generate positive samples in the training dataset. ADASYN is an over-sampling strategy based on the idea of adaptively generating samples for the minority class according to the distribution of the surrounding majority samples: more synthetic samples are generated for the original samples that are hard to learn (i.e., more majority samples surrounded), compared with those that are easy to learn (i.e., fewer majority samples surrounded) ( 14 ). For each station-FNN, a training set is generated utilizing ADASYN to ensure that the ratio of positive and negative samples is approximately one-to-one. The station-FNNs are trained using the over-sampled training datasets.
Rule-Based Ensemble Learning
After training, the station-FNNs take as inputs the MRF decomposed feature vectors (either flow volume or travel time) and output the probabilities that the input fare machine belongs to different candidate stations. An efficient way to boost the model performance is to strategically combine the decisions from multiple information sources (i.e., MRF volume and travel time). This paper proposes two alternative rule-based ensemble strategies—average and max—to combine the results from the MRF flow volume and travel time models.
Let m be a fare machine, and
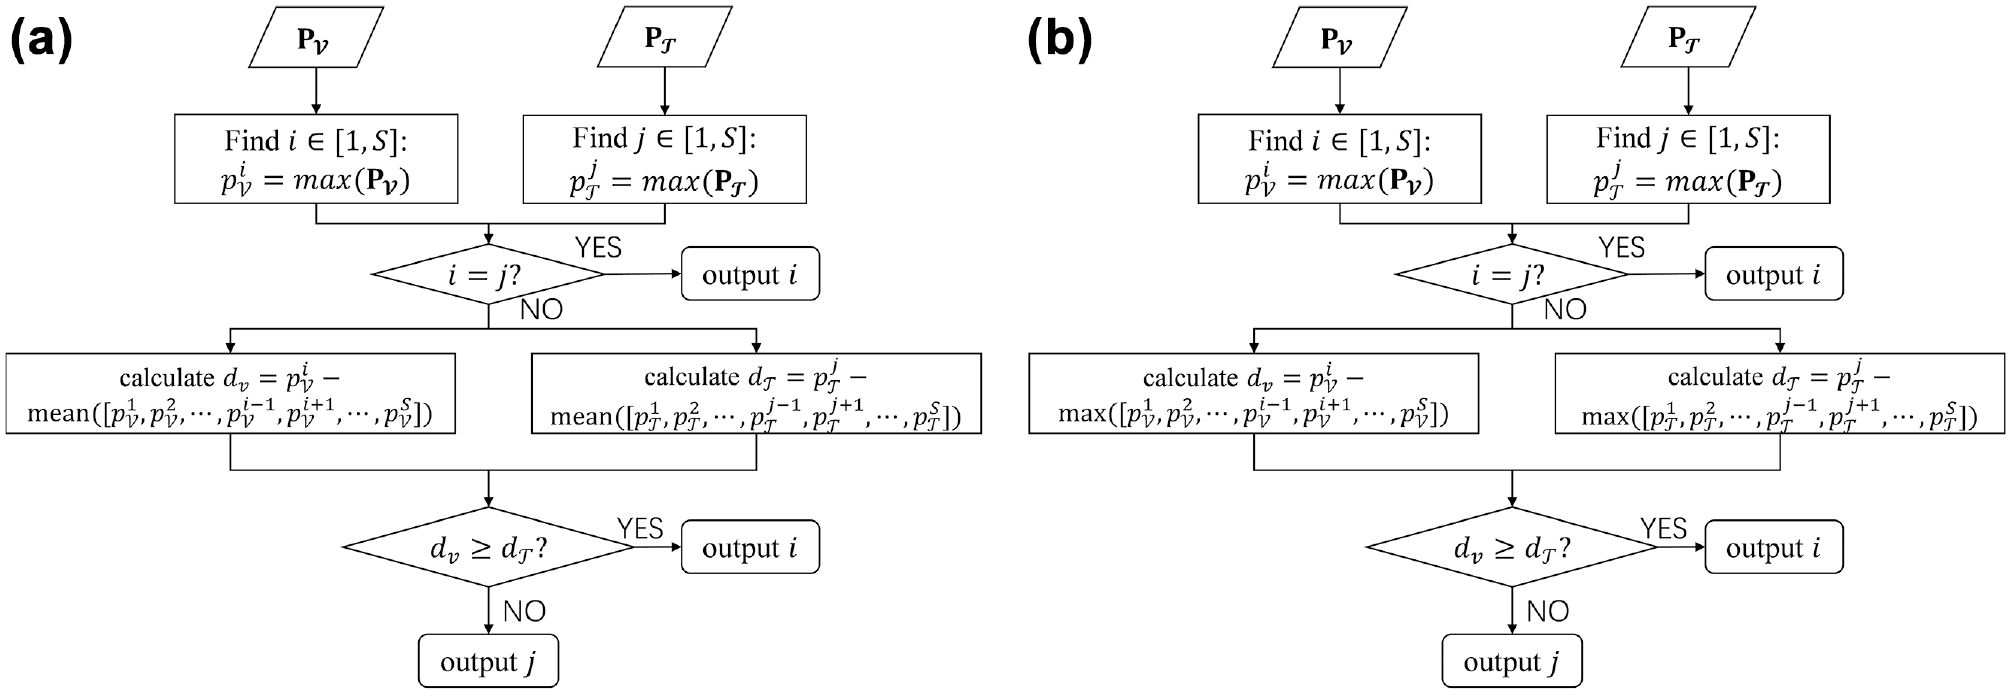
Rule-based ensemble strategies: (a) average and (b) max.
The key idea of the ensemble strategies is to favor the inference result from a model that provides the largest probability deviation between the inferred station and the rest of the other candidate stations for a fare machine. For the average strategy, the deviation between the maximum output probability and the mean of the rest output probabilities is used to measure the NN model classification performance. For the max strategy, the NN model classification performance is measured by the difference between the largest and the second-largest output probabilities.
Application
AFC data from a major urban railway system were utilized to evaluate the proposed approach. The data cover seven days from January 15 to January 21, 2018. The agency provided the complete information of machine-station mapping for the studied period. For the purpose of this case study, certain machines were considered unlinked. Since the ground truth is known, the proposed method can be easily evaluated. Figure 6 shows the number of fare machines in each station. The number of machines range from around 10 to 40 for both entrance and exit.
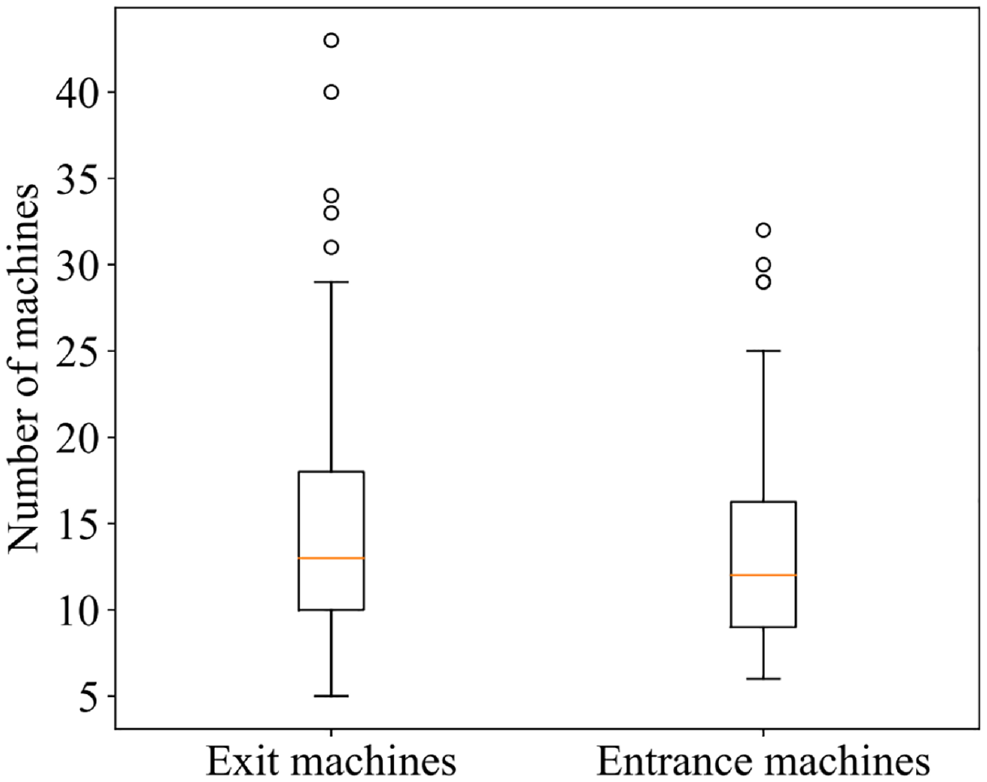
Number of fare machines in each station.
Experimental Setup
The researchers randomly selected 1,000 entrance fare machines and 1,000 exit fare machines and collected the corresponding AFC transaction records to construct the experimental dataset. The entrance and exit fare machines are randomly divided into 10-folds. The performance of the proposed methodology is validated under nine different scenarios, with unlinked machine ratios ranging from 0.1 (i.e., 10% of the machines are not linked) to 0.9. In each scenario, one-fold of the entrance and exit fare machines was added as unlinked fare machines (missing). The proposed algorithm was run 20 times per scenario to avoid random errors. The settings of model parameters are listed in Table 1.
Model Parameter Settings for Performance Evaluation

Note: ALS = alternating least squares algorithm ( 18 ).
The performance of the approach is evaluated using the Accuracy metric:

where
Besides accuracy, the robustness of the model is evaluated by the distribution of the probability of assigning an unlinked machine to the station to which it actually belongs across all unlinked fare machines.
Performance Evaluation
Figure 7 compares the station inference performance for four strategies. The MRF Volume only strategy makes inference decisions based on the outputs of the MRF flow volume model, while Travel time only uses outputs from the MRF travel time model. Average and Max strategies use both the outputs of MRF flow volume and travel time models but differ in the ensemble strategy (as discussed in Figure 5).
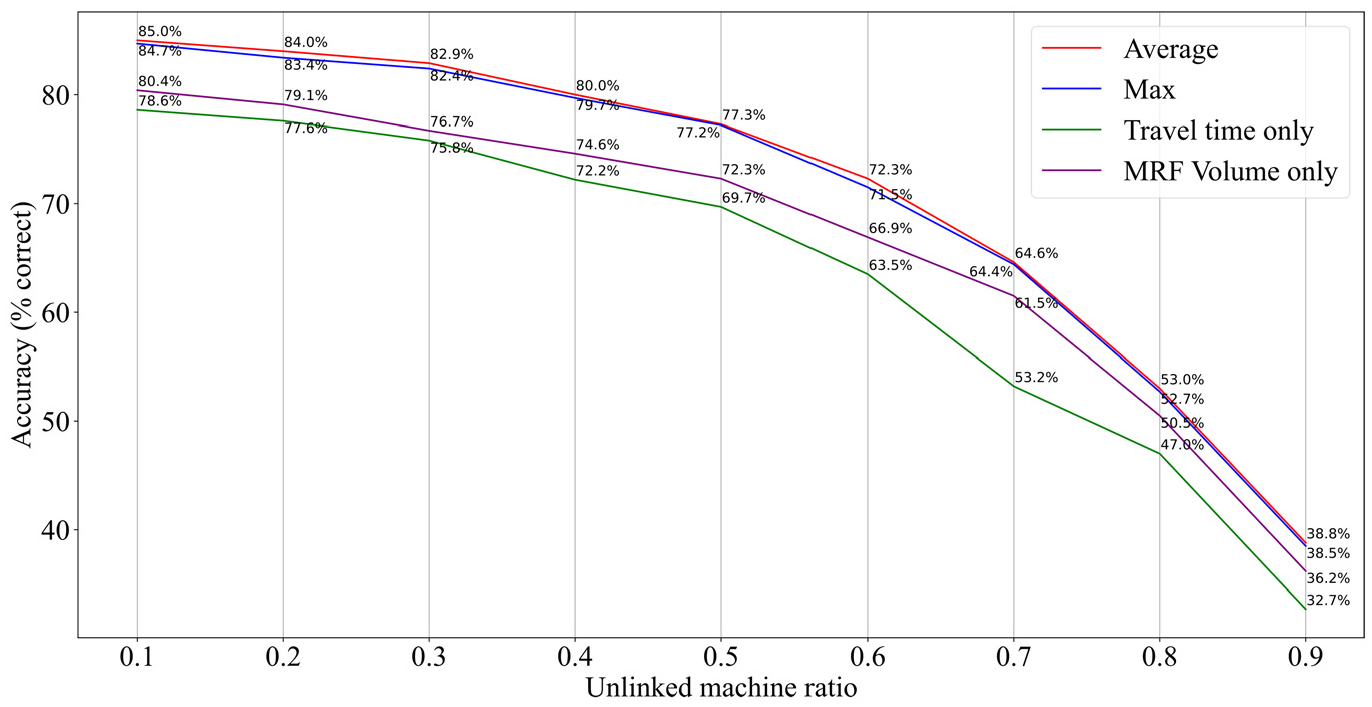
Station inference accuracy with missing ratios ranging from 0.1 to 0.9.
The results demonstrate that all four strategies achieve relatively high accuracy when the unlinked fare machine ratio is low, for example, more than 80% accuracy with 10% of the fare machines unlinked. The inference performance degrades as the unlinked machine ratio increases. However, the models can still achieve good results even if the unlinked machine ratio is extremely high (e.g., around 50% accuracy with 80% of the machines unlinked). The MRF flow volume model consistently outperforms the corresponding travel time model. The possible reasons could be the following: (a) the MRF flow volume is directly obtained from the data, while part of the MRF travel time information is derived using the CP-WOPT algorithm when the tensor cell has no value (no passengers traveling on a particular OD at a particular time); (b) the travel times from two adjacent stations to other stations may be similar (e.g., under crowding); and (c) the range of travel times is often smaller than that of flow volume, which may influence their strength to form strong features for the NN model.
Compared with the models using a single source of information (i.e., MRF Volume only and Travel time only), the ensemble learning based strategies exhibit consistently and significantly better performance under all scenarios by taking advantage of the complementary information captured by the MRF flow volume and travel time tensors. No significant difference is found between the Average and Max strategies.
Table 2 compares the inference accuracy using different number of days with AFC observations. The accuracy is calculated with the Average method (Equation 6). When the time span of the used AFC data is short (e.g., one day), adding more data significantly improves the inference performance as more diverse patterns are captured. However, the impact of the number of observations on the inference results becomes marginal when the data time span is over seven days. The reason could be that, for each fare machine, the records from a week of days (cyclic travel patterns by week) is enough to characterize its MRF feature. Adding more observations may only provide limited additional information, thus there is only marginal improvement to the inference accuracy.
Inference Results with Different Number of Observations

To evaluate the robustness of the proposed framework, the output probabilities of each unlinked machine belonging to the actual station are compared. Figure 8 shows the distribution of the predicted probabilities. The higher the probability, the more robust the model performance is. For example, suppose a fare machine belongs to station A in reality, and the station NN model predicts that the probabilities of the fare machine belonging to the candidate stations A, B, and C are 0.7, 0.2, and 0.1, respectively. Then, the probability of belonging to the correct station is 0.7, which implies high confidence in the inference.
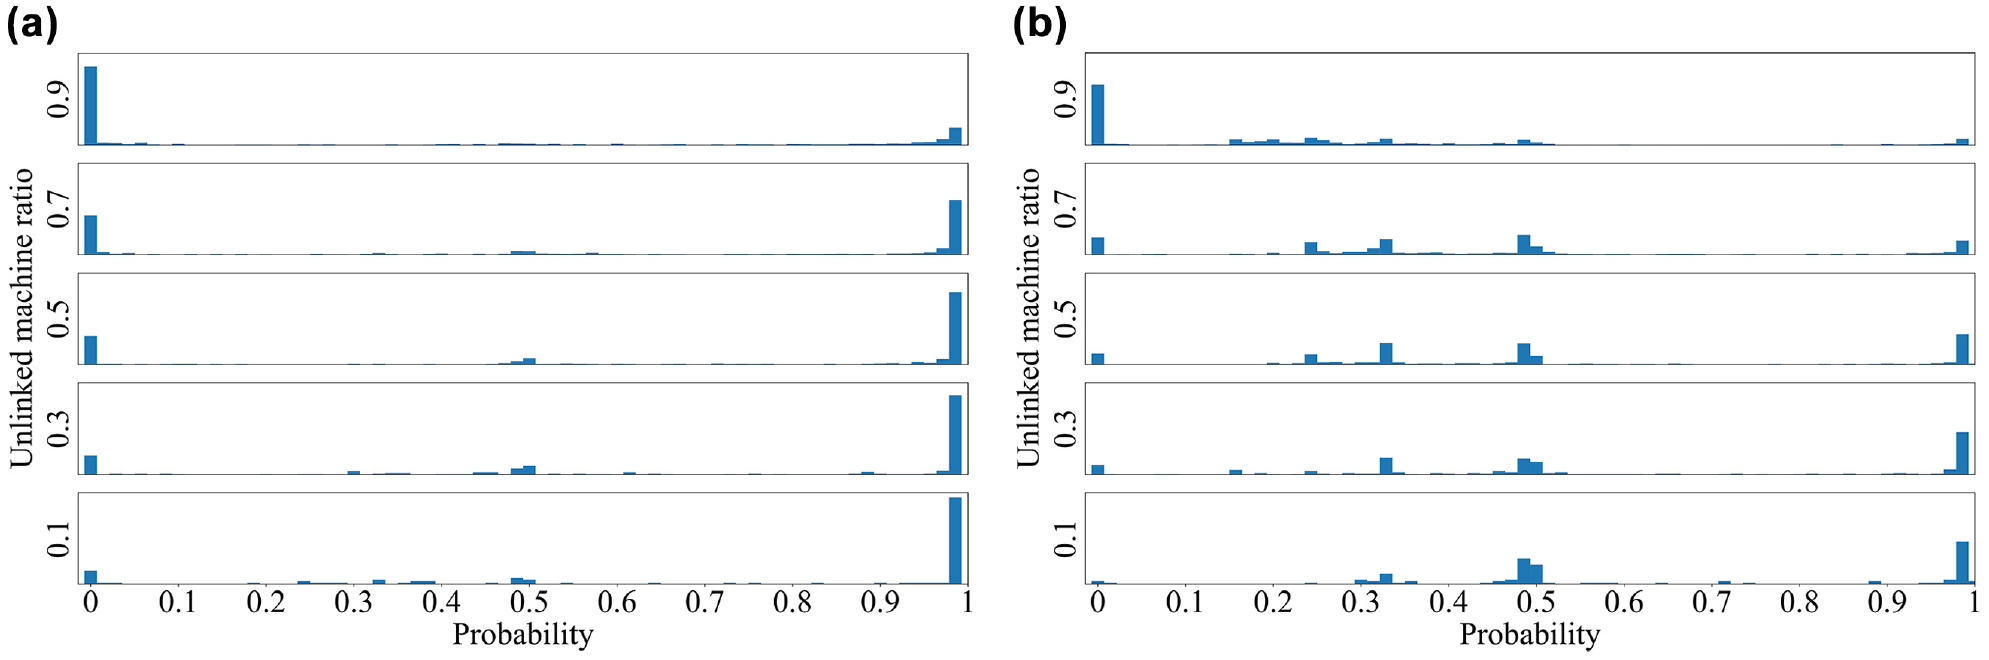
Distribution of the predicted probabilities of the actual station using (a) fare machine-related passenger flow (MRF) flow volumes and (b) MRF travel times.
The results show that both models achieve probabilities larger than 0.5 when less than 50% of the fare machines are unlinked. Note that a probability larger than 0.5 means a robust inference performance, in which case the proposed model will always correctly assign the fare machine to the actual station. The model performance degrades when the unlinked ratio exceeds 50%. Interestingly, in the cases where the probabilities are higher than 0.5, most of these probabilities from using the MRF flow volume are around 1, while the probabilities predicted by the model using the MRF travel time are more distributed. However, contrary results are obtained when dealing with fare machines with low probabilities (i.e., <0.5). This complementary performance explains why the performance of the ensemble models (Average/Max), which combine each information, is higher than the performance of the individual models (see Figure 7).
Incorporating Additional Information
In many cases, the total number of fare machines at stations is known in advance (e.g., station 1 has 20 fare machines). The information of number of machines at each station helps with the inference as it narrows the feasible set of candidate fare machines. For example, assume we know that station A has 10 entrance fare machines, and the mapping table also has 10 fare machines recorded belonging to station A, which means that no missing data happens for the entrance machines of station A. Under such a case, the inference algorithm will certainly not assign extra missing entrance fare machines to station A, thus improving the inference accuracy. Figure 9 compares the station inference accuracy of the Average model when this information is used with the corresponding performance when this information is ignored.
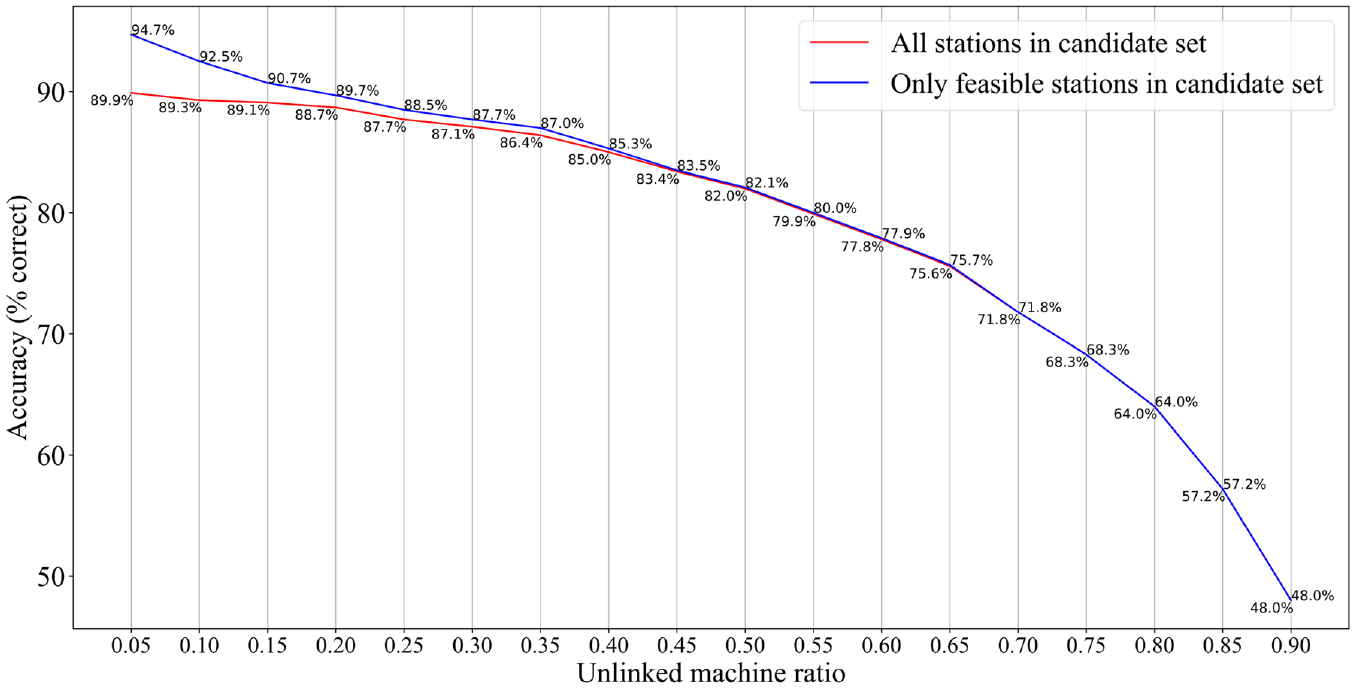
Comparison of the station inference accuracy of the model with and without station feasibility information.
The results show that the machine count information is useful and improves the model inference performance when the ratio of unlinked fare machines is low. For example, the model with fare machine count information increases the inference accuracy by 5% when 5% of the fare machines are unlinked. The value of the fare machine counts information decreases, though, as the unlinked ratio increases, since fewer stations can be excluded from the feasible set.
Discussion
The paper proposes a general approach for extracting MRF features and using them to infer the stations of unlinked fare machines. Other applications could be facilitated by the proposed method.
Station Heterogeneity
Different stations tend to have different inference performance. Many factors affect model performance, such as machine count, demand pattern, station layout, and so forth. Figure 10 explores the relationship between predicted probability and the number of machines of the station for different ratios of unlinked machines. The predicted probability of a station refers to the average predicted probability of all fare machines at this station. The probabilities in Figure 10, a and b, are obtained from the MRF travel time and flow volume models, respectively. For the MRF travel time model (Figure 10a), most stations having lower predicted probabilities tend to have fewer fare machines. This is mainly because the stations with few machines have fewer positive training samples, thus the corresponding NNs cannot be well trained, especially if the related MRF travel time features are similar to other stations. However, certain stations perform consistently well, even in the cases with large unlinked machine ratios. For example, the model has an average of 90% probability for some stations (circled in Figure 10a) even when 70% of the fare machines are unlinked at those stations. This may indicate that the passenger flow patterns for these stations are very distinct, thus few training samples are needed to capture the MRF feature differences from other stations. For the MRF flow volume model (Figure 10b), almost all stations have promising performance when the unlinked machine ratio is low. However, as the unlinked machine ratio increases, few stations could maintain their performance. Stations with fewer machines exhibit a sharper performance degradation compared with those with more machines.
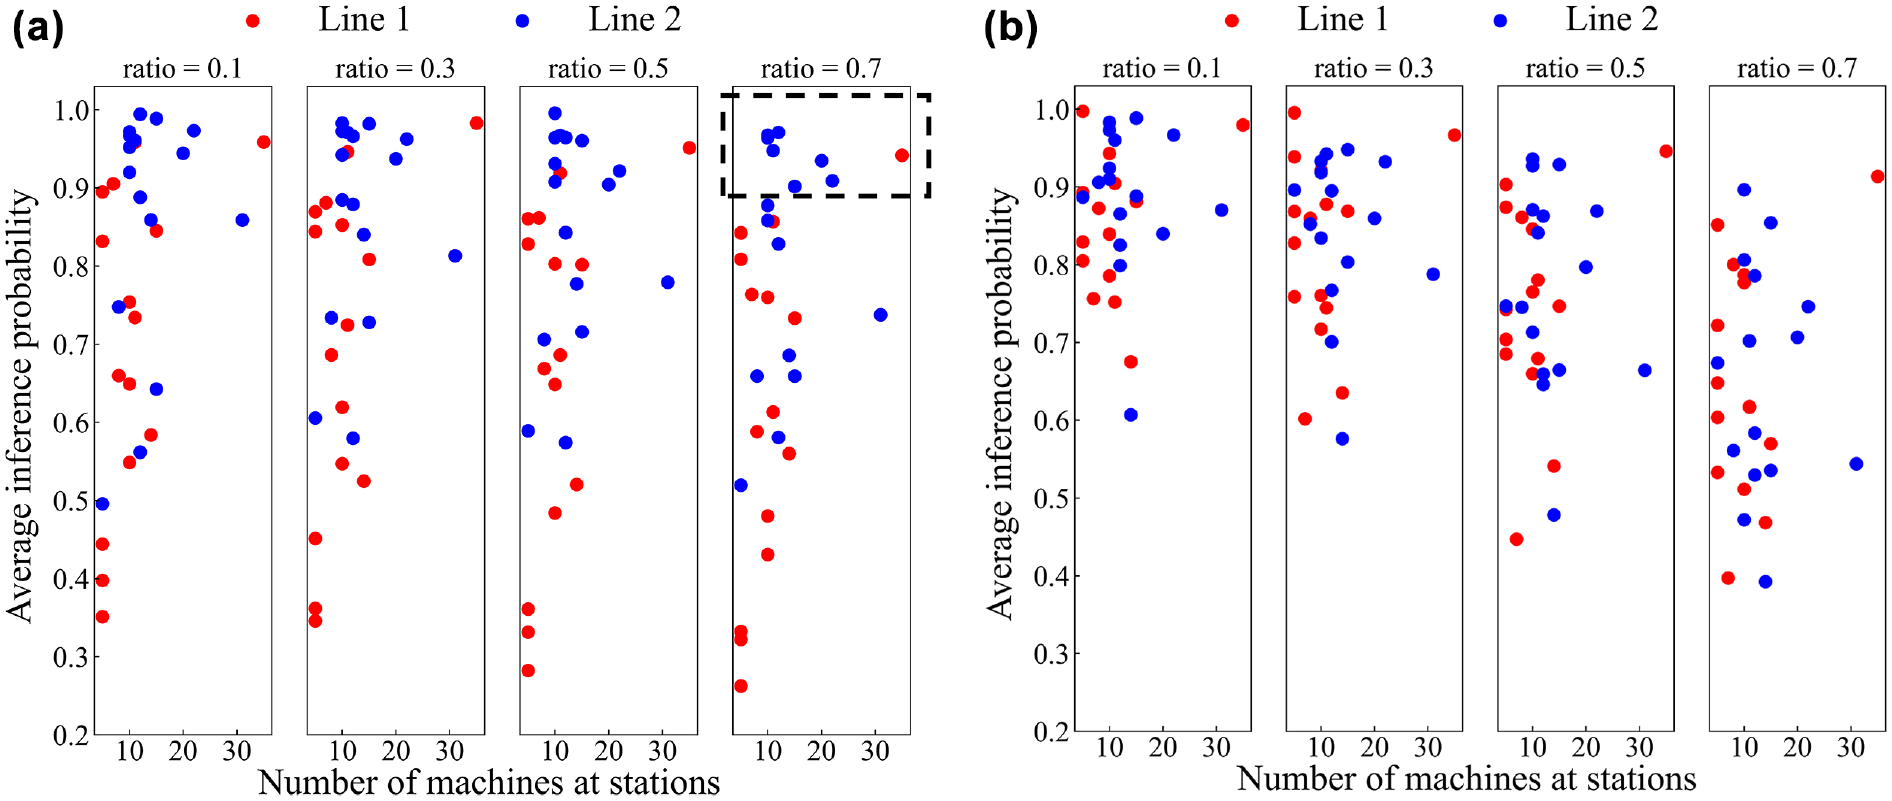
Inference probability as a function of the number of fare machines at the station from (a) fare machine-related passenger flow (MRF) travel time model, and (b) MRF flow volume model for each station on Lines 1 and 2 (unlinked machine ratios of 0.1, 0.3, 0.5, and 0.7).
Latent Feature Analysis
The feature vectors extracted from the MRF flow volume and travel time tensors are useful proxies of the relationship between fare machines. To explore these relationships further, the MRF volume vector and travel time vector of each machine are concatenated and principal component analysis (PCA) is utilized to reduce the dimension of each concatenated feature vector to 2. The reduced vectors corresponding to the fare machines at one of the busy stations in the system (Station A) and four other stations are compared. These four stations are selected based on their geographical distance from station A. Table 3 summarizes the geo-relationships between the four stations and station A.
Geo-relationship with Station A

Figure 11 compares the two PCA components of the machines. The results show that when the distance between two stations is relatively large (>5 mi), their MRF features exhibit significant differences. Even at a very short distance (less than 1 mi), most of the fare machines at different stations (e.g., stations A and E in Figure 11d) have different MRF features. This indicates that the extracted features from the tensor decomposition can support other applications as well, such as checking the validity of the machine-station dictionary. For example, if a fare machine belongs to station B but is wrongly assigned to station A (annotated point in Figure 11a), the MRF features can easily detect such mistakes and flag the entry for potential errors. Moreover, the output could also indicate the probability that a specific fare machine is correctly linked to a station in the machine-station dictionary. This could potentially reduce the cost of manually checking machines by focusing on those with a high risk of being assigned to the wrong station. In data maintenance, the fare machine allocation (missing dictionary data) and dictionary validation (quality of the dictionary) are important tasks. The fare machine problem may happen occasionally, but it can have a substantial impact. Its solution could recover a large amount of OD information. The dictionary validation, on the other hand, is a daily process required to ensure the data quality of the AFC dataset.
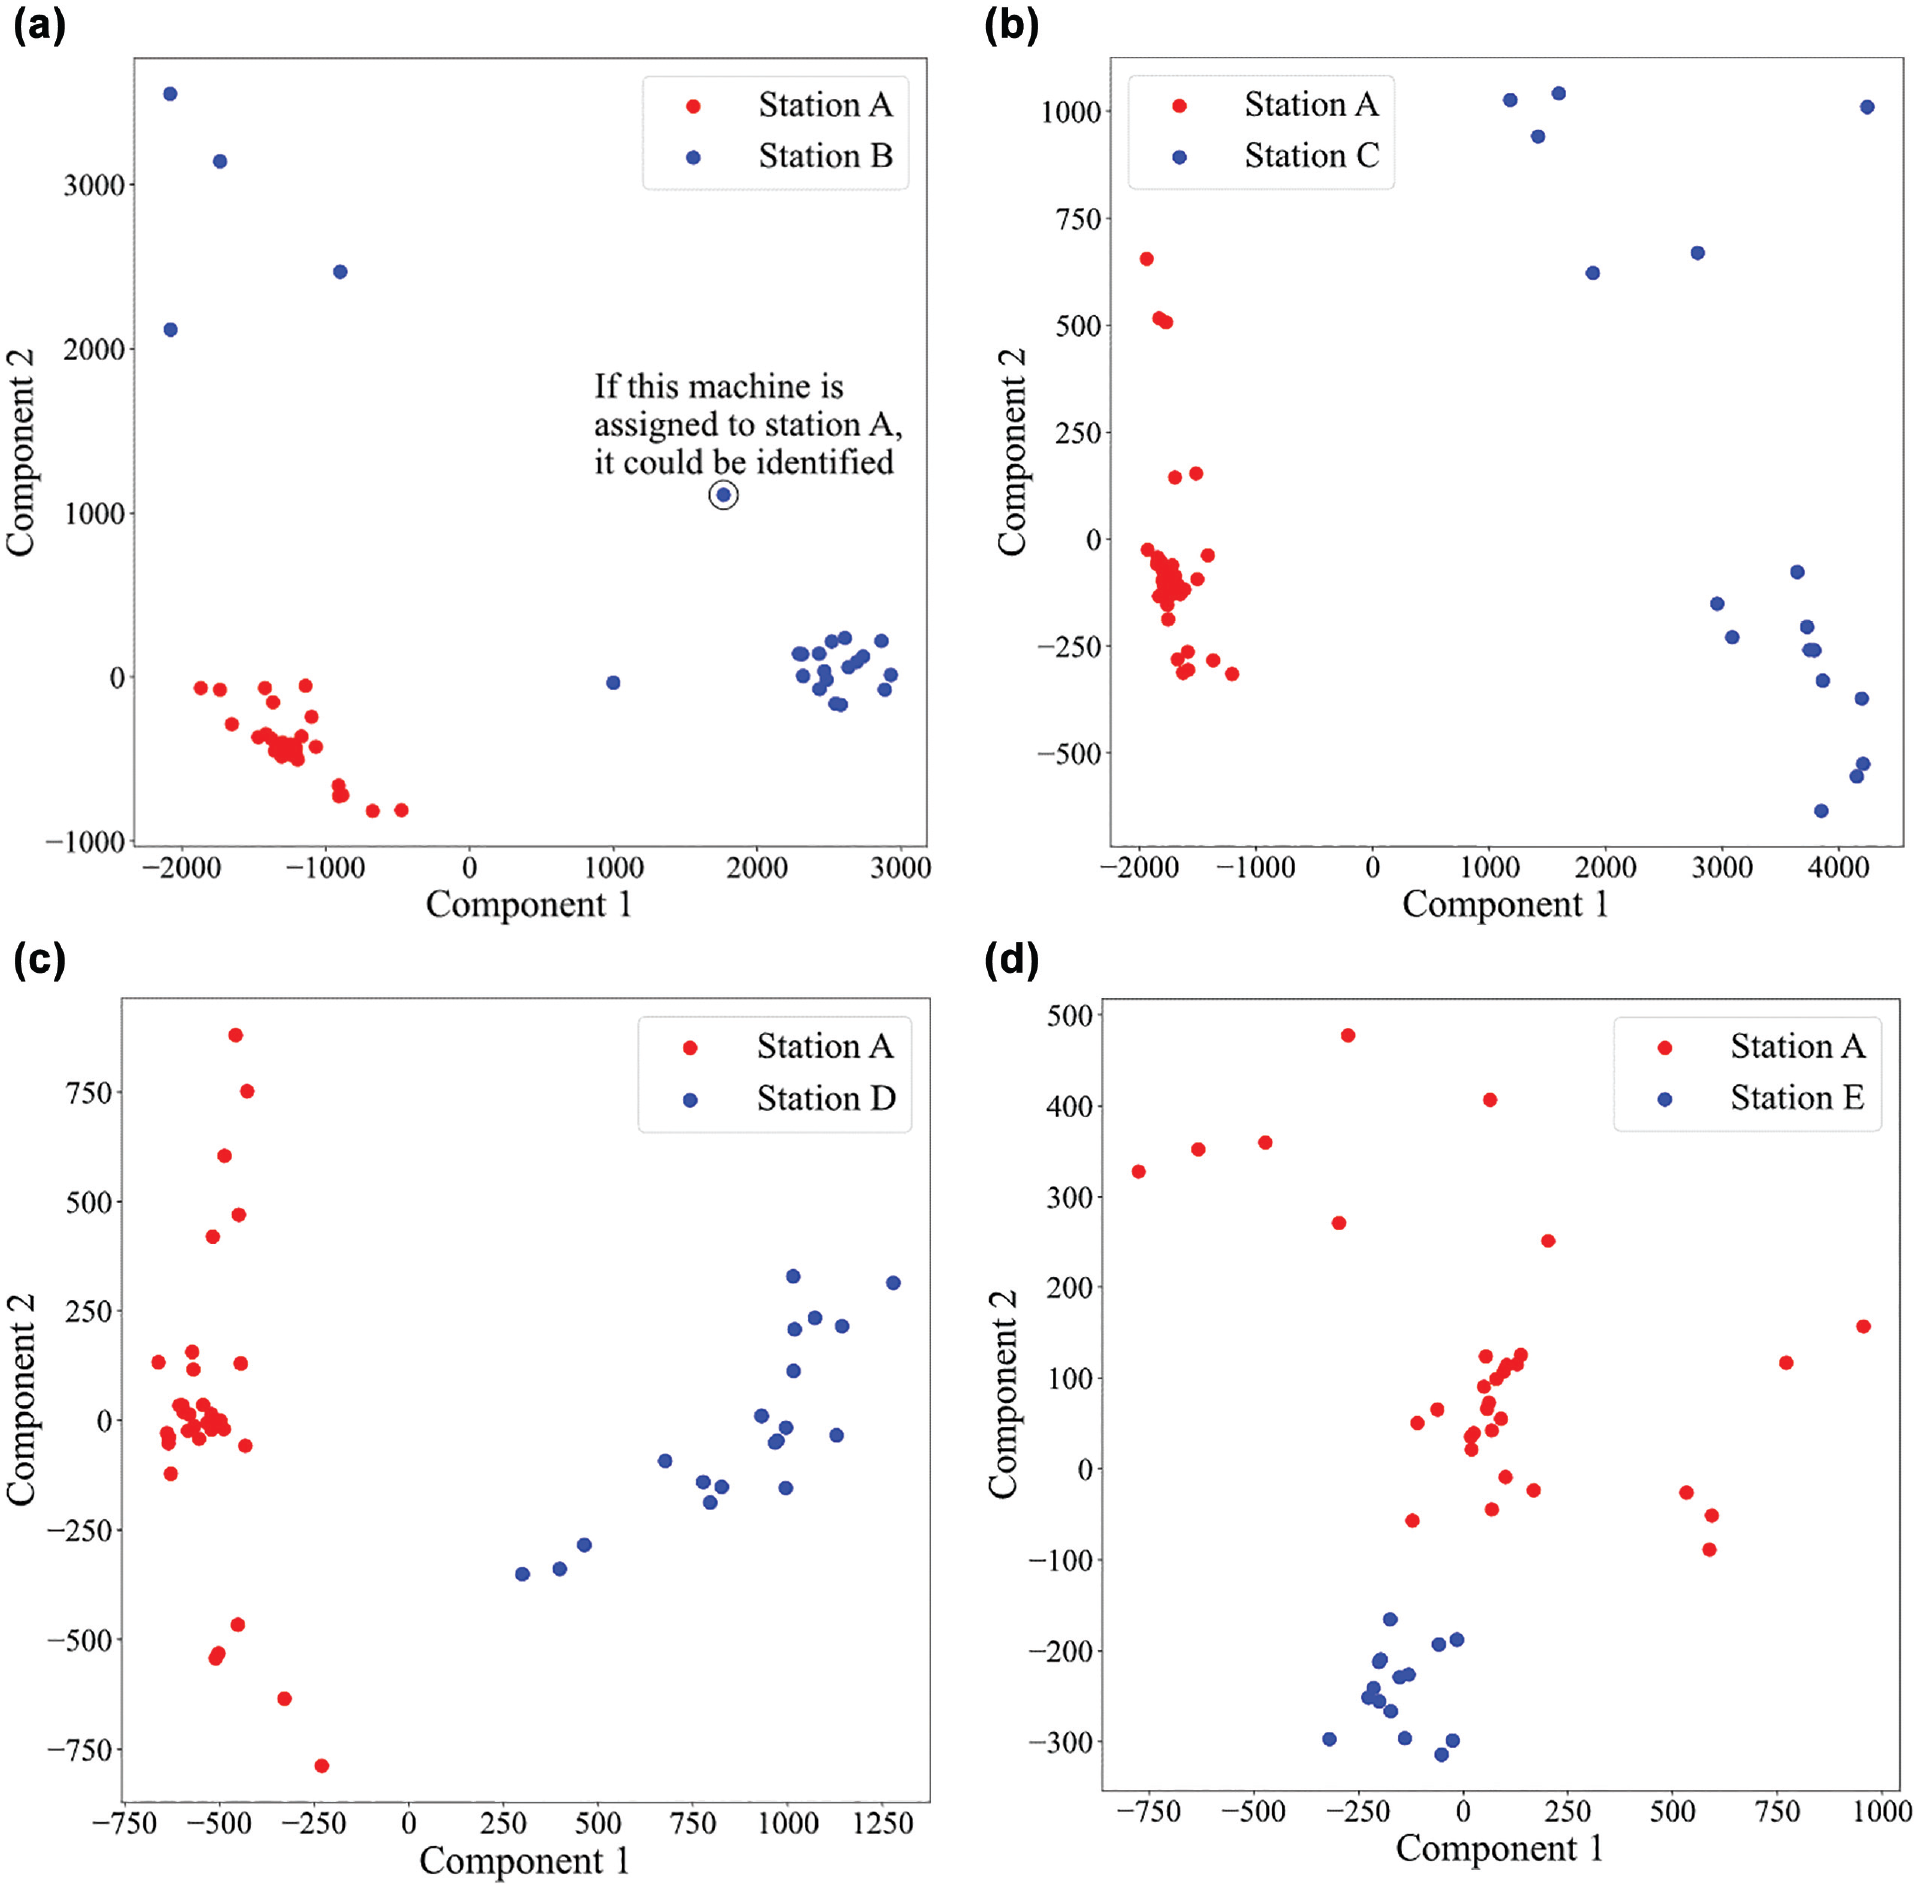
Comparison of fare machine-related passenger flow (MRF) features of stations A and B (a), A and C (b), A and D (c), and A and E (d).
Conclusion
Data quality is a significant issue with AFC data. Existing studies mainly focus on data quality issues related to infrastructure failure . However, studies related to missing and invalid data caused by data management problems are limited. The paper proposes a tensor decomposition and NN based approach to infer the stations of unlinked fare machines in the context of machine-station dictionary missing values and errors.
The empirical case study validates the accuracy and robustness of the proposed approach, even when 80% of the fare machines are not linked to their station. The analysis shows that the flow volume and travel time tensors can capture complementary information of fare machine features depending on the missing percentage of fare machines. Combining both can significantly improve the station inference performance. The performance can be further improved by filtering out infeasible candidate stations. The model tends to perform better for stations with a relatively higher number of fare machines. The proposed approach is also useful for other applications, including data quality validation and abnormality detection.
By recovering the missing associations between fare machines and stations, the missing OD station information can also be imputed, including transactions with both OD stations missing. The proposed approach is also useful for other applications, such as data quality validation and abnormality detection. Limitations of the approach that can be addressed in future research include: (i) adding additional information or constraints (e.g., the number of machines at a station) to improve the inference performance, particularly for stations with a few fare machines (i.e., <10); (ii) developing a method to optimally and simultaneously select parameters for MRF tensor decomposition and station inference NN models rather than setting though an intuitive sense; (iii) evaluating the effectiveness of the MRF features on different types of days (e.g., weekday/weekend), to construct MRF tensors with better feature quality.
Footnotes
Acknowledgements
The authors would like to thank the metro company (anonymous given confidential agreement) for their data support for this research.
Author Contributions
The authors confirm contribution to the paper as follows: study conception and design: P. Zhang, Z. Ma, H. N. Koutsopoulos; data collection: P. Zhang, Z. Ma; analysis and interpretation of results: P. Zhang, Z. Ma, H. N. Koutsopoulos; draft manuscript preparation: P. Zhang, Z. Ma, X. Weng, H. N. Koutsopoulos. All authors reviewed the results and approved the final version of the manuscript.
Declaration of Conflicting Interests
The author(s) declared no potential conflicts of interest with respect to the research, authorship, and/or publication of this article.
Funding
The author(s) received no financial support for the research, authorship, and/or publication of this article.
