



Abstract
The intended purpose of an intelligent transportation systems (ITS) project is to automate operations through device-to-device connectivity. These devices generally represent stakeholder’s endpoints and expose interfaces to automated operations. Current trends in communication allow more applications and devices to perform functions traditionally allocated to the transportation ITS infrastructure. This connected environment of industrial internet of things presents design challenges because of the diversity of stakeholders, interfaces, and the messages among them. This may require new ways in which ITS planning can handle the scale and complexity of these highly connected systems. This work focuses on the modeling of the architecture of a freight-focused ITS application, including maritime ports. The proposed model integrates stakeholders, behaviors, and messages using the Systems Modeling Language (SysML). The key contribution of this work is to demonstrate the creation of an executable SysML model for an ITS application without sacrificing the typical Systems Engineering Management Plan artifacts (e.g., requirements traceability matrices and interface control documents). At the same time, the proposed model provides a re-usable pattern to support parametric analysis of candidate architectures with respect to any measure of effectiveness. This allows establishing a single source of architecture definition and having multiple architecture specializations depending on the measure of effectiveness being evaluated. Recommendations for implementation and integration with existing ITS tools are provided.
Keywords
The global progress in deploying freight-focused intelligent transportation systems (ITS) varies among countries and even regions within the same country. Innovation in freight ITS is driven by the immediate needs of the particular region and the level of technological maturity of its stakeholders. Maritime port operations are adopting enabling technologies to optimize their processes, reduce port congestion, reduce cargo re-handling, and provide the port community with increased operational integration. The traditional stakeholder roles in the freight context are:
Goods generators
Freight forwarders
Trucking companies
Truck drivers
Maritime port authorities
Government agencies
The intended purpose of an ITS project is to automate operations through device-to-device connectivity. These devices generally represent stakeholders’ endpoints and expose interfaces to automated operations. As Srour and Newton explain, the development of a National Freight Data Program and the increased use of ITS technologies can directly populate the necessary data in the freight database for increased information exchange ( 1 ). This interoperability can be cataloged as an industrial internet of things (IIoT) deployment. In commercial vehicle operations, there are multiple processes performed by non-traditional ITS stakeholders that can benefit from IIoT deployments. Such processes include, but are not limited to:
Commercial vehicle operations (mixed fleet low tech/high tech)
Toll gates and payment systems
Weight control stations
Roadside inspections
National freight registries
Port appointment systems
The operational steps that occur in the domain of these processes can affect the performance of maritime ports by introducing uncertainty in the commercial vehicle’s arrival time. Conversely, the maritime ports can introduce uncertainty in commercial vehicle performance through terminal operation delays. Enhanced communications emerging from IIoT deployments can potentially enable system-wide capabilities. Examples of these deployments include electronic locks or e-seals, and vehicle tracking applications, among others.
The traditional Systems Engineering Management Plan (SEMP) for ITS includes provisions for requirements, concept definition, interfaces, and architecture evaluation ( 2 ). However, an IIoT environment presents design challenges because of the diversity of stakeholders, interfaces, and the messages among them. This may require new ways in which ITS planning can handle the scale and complexity of these highly connected systems. Model-based systems engineering (MBSE) is the response of several industries such as automotive and defense to the challenges of increasing system complexity ( 3 , 4 ). Freight-focused ITS deployments can take advantage of the methodologies and principles applied in MBSE to address the particular challenges in the transportation domain.
This work focuses on the modeling of the architecture of a freight-focused ITS application, including maritime ports. The proposed model integrates stakeholders, behaviors, and messages using the Systems Modeling Language (SysML). The key contribution of this work is to demonstrate the creation of an executable SysML model for an ITS application without sacrificing the typical SEMP artifacts (e.g., requirements traceability matrices and interface control documents). At the same time, the proposed model provides a re-usable pattern to support parametric analysis of candidate architectures with respect to any measure of effectiveness. This allows establishing a single source of architecture definition and having multiple architecture specializations depending on the measure of effectiveness being evaluated.
Literature Review
ITS and Systems Modeling Language (SysML) Background
In the early 2000s, U.S. government agencies were being mandated through acts of congress to adopt systems engineering techniques in the execution of their projects ( 5 ). This mandate was based on the awareness that the processes and techniques to solve complex engineering problems developed in the systems engineering field can reduce project risks while achieving stakeholder requirements.
In response, the U.S. Department of Transportation extended the National ITS Architecture into a reference framework and has developed widely used domain-specific tools such as Turbo Architecture and, more recently, the Systems Engineering Tool for Intelligent Transportation (SET-IT) to support the development and implementation of regional ITS frameworks throughout the U.S. ( 6 ).
Between the release of versions 5.0 and 6.0 of the National ITS Architecture, the Systems Modeling Language (SysML) was being developed. Created in 2003 as a dialect of the Unified Modeling Language (UML) to support systems engineering applications, the intent of SysML was to provide a standardized language that could capture requirements, structures, and behaviors of systems in a graphical representation ( 7 ).
The use of models created in SysML has some advantages over traditional paper-based models in that they are extensible, customizable, and executable by the users. A modeled system, capturing the properties and behaviors of the physical systems, becomes its digital thread and can be tested through simulation of the system’s interfaces, interactions, and internal functions to support design decisions and guide system deployment. This makes the systems engineering process open to agile techniques by enabling early system validation via model execution.
IIoT technology provides a digital thread integrating the data flow between actors that traditionally operated in siloed environments ( 8 ). These enabling technologies and their data flows can be paired with MBSE to enhance the accuracy of the system’s representation at the architectural development stage and provide traceability to the system’s requirements.
ITS share a similar focus on breaking down barriers between siloed actors by connecting objects that can sense, exchange data, and supply information to the users.
The evolution of SysML as a generally accepted modeling language has opened avenues to develop advanced analysis tools. For ITS practitioners, general-purpose language such as SysML can take advantage of these developments, since there is more availability of execution and interoperability tools.
Architecture Capability Evaluation
A system architecture is the collection of hardware, software, people, materials, and processes that together accomplish the system’s mission. Any actor (hardware, software, people) of the system is thought of as a service-providing object with a defined set of states ( 9 ). The architecture capability evaluation is built on two concepts. The first is that there is an activity that can be performed to change the state of the actor, and the second is that there is a capability or the “ability to achieve a desired effect” ( 10 ). For ITS projects, communication is pervasive, and their capability can be hindered by the degree of communication flow between any two entities. To expand this concept using communication theory, Shannon presented a simple abstract communication model from which it can be reasoned that for a capability to be fully enabled, three requirements need to be satisfied—one functional and two related to the interface ( 11 ). Firstly, the sender and receiver must have devices, sensors, or computers to capture, transmit, and receive data inputs to satisfy a functional requirement of technology availability. Secondly, a channel or medium must exist to carry the information between the sending and receiving systems to satisfy an interface requirement of entity connectivity. Thirdly, the information must be in a compatible format that the receiver can interpret to satisfy a second interface requirement of data compatibility. A fourth requirement is added from utility theory, in that the data must have a value to the receiver. Information is considered valuable only when there is a utility to it, and this value is derived from the benefit gained by allowing for a change in behavior by the actor based on the received data.
In systems engineering terms, this means that the arguments of the input functions at the interface can be used by the receiving subsystem to execute a state-changing behavior. For example, a truck can broadcast its detailed position minute-by-minute, the maritime port can receive that information and re-schedule operations. However, if the port cannot act based on the input, the overall system capability may not be achieved. This obvious check can be easily overlooked in ITS deployment projects with diverse actors and jurisdictions where capability implementations are phased in over time.
The mathematical foundations that express these concepts can be found in the systems theory literature, such as Salado et al., who presented a mathematical foundation that describes the relationship between stakeholder needs, stakeholder requirements, and the solution space using set theory ( 12 ). They describe two relationships—a compliance relationship and a satisfaction relationship. A compliance relationship exists between the set of system configurations and the set of system requirements to determine whether a system configuration fulfills a single requirement. A satisfaction relationship exists between the set of system configurations, and the set of stakeholders needs to determine the ability of a system configuration to satisfy a single need of the stakeholder. Selva et al. presented mathematical alternatives to the traditional approach of system architecture decision-making of complete factor enumeration of all the available configuration alternatives ( 13 ).
Herrala supplied two valuation methods for the value of information ( 14 ). The first is to assess what the user gained when compared with the user not having access to the data, and the second is the use of the analytical hierarchy process (AHP) to evaluate what information is the most significant to the collective users or each other user. Peng and Beimborn offer a method to screen and select potential ITS projects among several options based on the various sources of benefits ( 15 ). The method presented in this paper focuses on the capability of a system configuration to understand how much of this benefit can truly be realized.
Methodology
Architecture Capability Evaluation
The architecture evaluation is performed by introducing the concept of a capacity score between two actors to provide a quantitative measure of the potential capabilities achieved by the system. It is the sum of the parametric evaluations of each of the above requirements. Each term is adjusted with a weighting factor (w1–4) to reflect a shift in prioritizing one term over the others, with equal weighting as the default. Since the sum of the weighting factors must equal unity, summing each term yields and capability score (CS) between 0% and 100%. The higher the score, the more likely the system can achieve its desired effect. This is shown in Equation 1:

The technology availability term (TA) is based on the participation or adoption rate of each entity and is the product of the participation rate of entity A (PRA) and the participation rate of entity B (PRB). It is the likelihood that entity A and entity B have both adopted technology to enable information exchange. For example, consider the percentage of commercial vehicles (entity A) equipped with data loggers while entity B is the percentage of inspection teams equipped with roadside monitoring equipment. This is shown in Equation 2:

Technology availability is based on the satisfaction of a functional requirement by a specific entity. In the application context, it may not be feasible for all entities to comply with technology requirements. For example, some percentage of trucks may not be able to equip on-board devices because of technological limitations brought on by the age of the vehicle or a financial burden placed on the driver based on the equipment’s requirements. Conversely, not all roadside inspectors may be equipped with a data capture device.
The entity communication term (EC) represents the likelihood that there exists a communication channel between entity A and entity B. Poor cellular network connectivity, the signal range of the devices, or the utilization of two different communication protocols in the sending and receiving systems can prevent the system from being fully enabled, as the data will not flow between entities. It is the product of PRA and PRB, as with the technology availability term; however, an added percentage is included as a communication factor (CF). This CF is the percentage of entity pairings that can establish connectivity between themselves. Extending the example of commercial vehicle data logging and the roadside inspectors, the CF is the percentage of data logging devices and roadside monitoring equipment that operate with the same communication protocol or can operate in close enough proximity to allow the data exchange to occur. This is shown in Equation 3:

The data compatibility term (DC) is the likelihood that the data received by entity B can be interpreted. It is the product of PRB and a data compatibility factor (DCF) represented by a percentage of receiving devices with the data interpreter matching the sent data. Further extending this example, the DCF is the percentage of roadside monitoring equipment that operates with the proper data format. Another example is toll tags, where some are useless within a jurisdiction outside of their regional area; not because the transponder is not in place or that electronic toll collection is not in place, it is simply that the data can be sent but not read. The incompatibility of the received data prevents further interoperability. This is an interface requirement that must be satisfied by the receiving entity participating in the data exchange. This is shown in Equation 4:

Lastly, the data utilization term (DU) is the likelihood that the data provide actionable information. It is the product of PRB and a data utilization factor (DUF) represented as a percentage of the extent that entity B can perform an activity on receipt of the information. Unlike the other terms, which are physical, DUF is difficult to quantify and is subjective to the individual actor. Returning to the roadside monitoring equipment, the scenario could be that the data from passing trucks are gathered and interpreted. However, the equipment cannot alert inspection agents of those trucks that are in violation. This term also highlights the inability or unwillingness of actors to act on the received information showing points of potential loss of functionality or data hoarding, which also prevents fully enabled capabilities. This is shown in Equation 5:

The CS provides insight into the system’s architecture by identifying limiting technology or design solutions that can be overlooked. Limitations in technology and communication channels between systems will drive ITS projects toward infrastructure decisions that can supply discrete rather than continuous event data.
The method described above focuses on calculating the CS between two entities involved in information exchange. Extending to a third entity (A → B → C) is simply the product of each CS between the actor pairs: CTotal = CSA–B x CSB–C. The total CS of CSA–B x CSB–C may not be equal to the CS should entity A pair with entity C directly for information exchange, nor is it expected that the score from entity A to entity B would be equivalent to the score from entity B to entity A. The various factors in communication channels, data formatting, and participation rates vary depending on the direction of data flow.
It is acknowledged that the weighting factors can skew the CS to the advantage or detriment of an ITS project, depending on the user’s whim. Considering this, a second equation has been introduced—that of expected benefit. Most ITS projects calculate a benefit gained by implementing the project (e.g., increased road safety, reducing travel time, and optimizing marine port operations) for a certain expenditure of capital. The benefit side of the analysis usually considers only the participation rate, while assuming that the communication, format, and utility factors are fully implemented. However, when considering that one or more of these terms can be less than 100%, the maximum benefit (BM) will not be realized. Instead, an expected benefit (BE) should be calculated as BM multiplied by the minimum value of the four terms defined above, considering each actor pairing. In Equation 6, the x denotes the actor pairings (e.g., A–B, B–C):

This parametric analysis establishes one of many measures of effectiveness (MOE) that can be incorporated into a more complex multi-criteria decision-making tool for architecture evaluation.
Systems Modeling Methodology
For presentation purposes, the modeling goals are to obtain requirement traceability and system configurations, generate interface control documents, and perform a parametric analysis. The modeling language that defines the elements and their relationships and the syntax and semantics of the model is SysML ( 16 ). In contrast, the methodology that defines the usage of the elements and the steps of analyzing and designing the system adapts the System Modeling Toolbox (SysMod) methodology ( 17 ). The modeling tool selected is Magic Draw ( 18 ).
Context Modeling and Interfaces
The application context contains the system under consideration, the environment, and all other systems and actors. A block is a graphical representation of any entity within the system, the block definition diagram (BDD) captures the structural relationships between them.
Traditional and non-traditional actors of the truck-to-port system context are presented in the BDD in Figure 1. A generalization relationship, such as between the block “TTPS Base Context” and the block “Application Context” conveys inheritance, while a composite association (solid diamond) conveys structural decomposition (whole to part relation).

Block definition diagram of the truck-to-port system model.
The model’s flexibility introduces variants and creates a multi-dimensional model that will grow in complexity as the number of elements increases. Through the application context block, configurable instances of the system can be created, and parametric analysis of the system’s capability and expected benefit can be performed.
The structure of the blocks shown in the BDD can be further decomposed in an internal block diagram (IBD). The IBD presents the interconnections between part properties within a block or between other blocks in the system. The behavior within the blocks and their interfaces are exposed by ports, and information flows across the connection are defined through flow specifications. An IBD (Figure 2) of the internal structure of a portion of the truck-to-port system model shows the interconnections, ports, behaviors, and information flows between the actors.
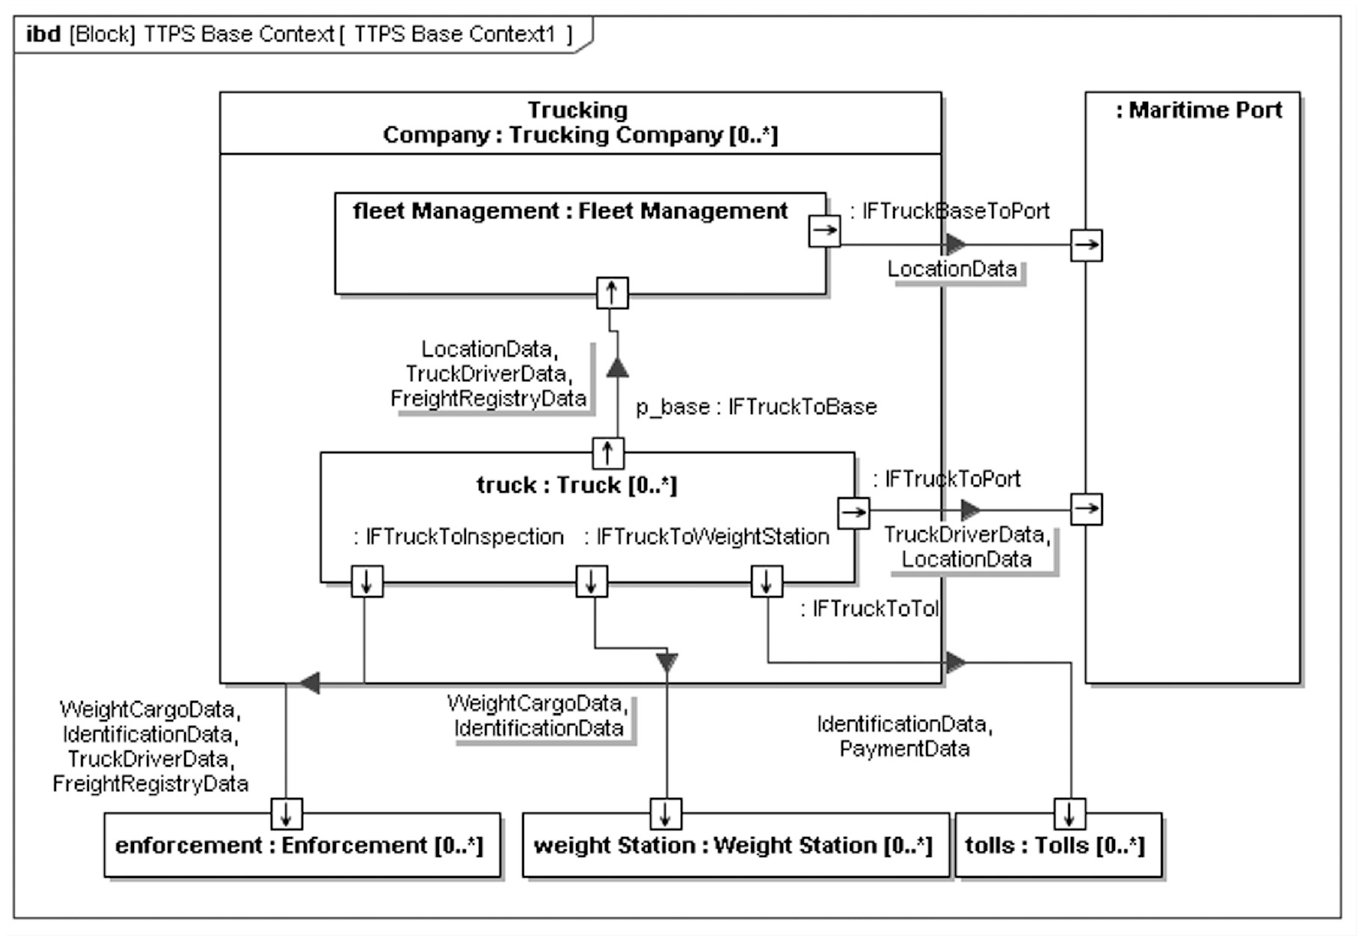
Internal block diagram of the truck-to-port system model.
One of the artifacts generated by systems engineers is the interface control document (ICD). Its purpose is to summarize the interfaces between systems or subsystems and capture the ports at the sending and receiving ends of the connection, and the information flows. MBSE provides the ability to change views from a graphical representation of the IBD to the tabular format of an ICD (Figure 3).

Extract of the truck-to-port system interface control document.
Parametric Modeling
Communications capabilities can be customized by configuring the application context to reflect the presence or absence of services. A parametric analysis was conducted to determine the CS as defined in Equation 1. The CS calculation procedure is presented in the BDD (Figure 4). The equations and the performance metrics are part of the TTPS Capability Analysis block. Since the analysis is calculated between pairs of actors, a particular type of entity called TTPS Entity is created. The TTPS Entity imposes a set of parameters needed for the calculations, such as participation rate (PR). For that reason, all the parts of the application contexts are specialized subtypes of the TTPS Entity. In this way, the existence of parameters is guaranteed through inheritance. A maritime port and a truck are types of TTPS Entity, and as such, either one can occupy placeholders for entity A or entity B in the parametric analysis in Figure 4. This will allow for re-usability of the analysis with any number of instances of members (TTPS Entity) present in any configuration of the application context. This pattern of definition, re-use, and instantiation is the basis for the parametric analysis adopted.
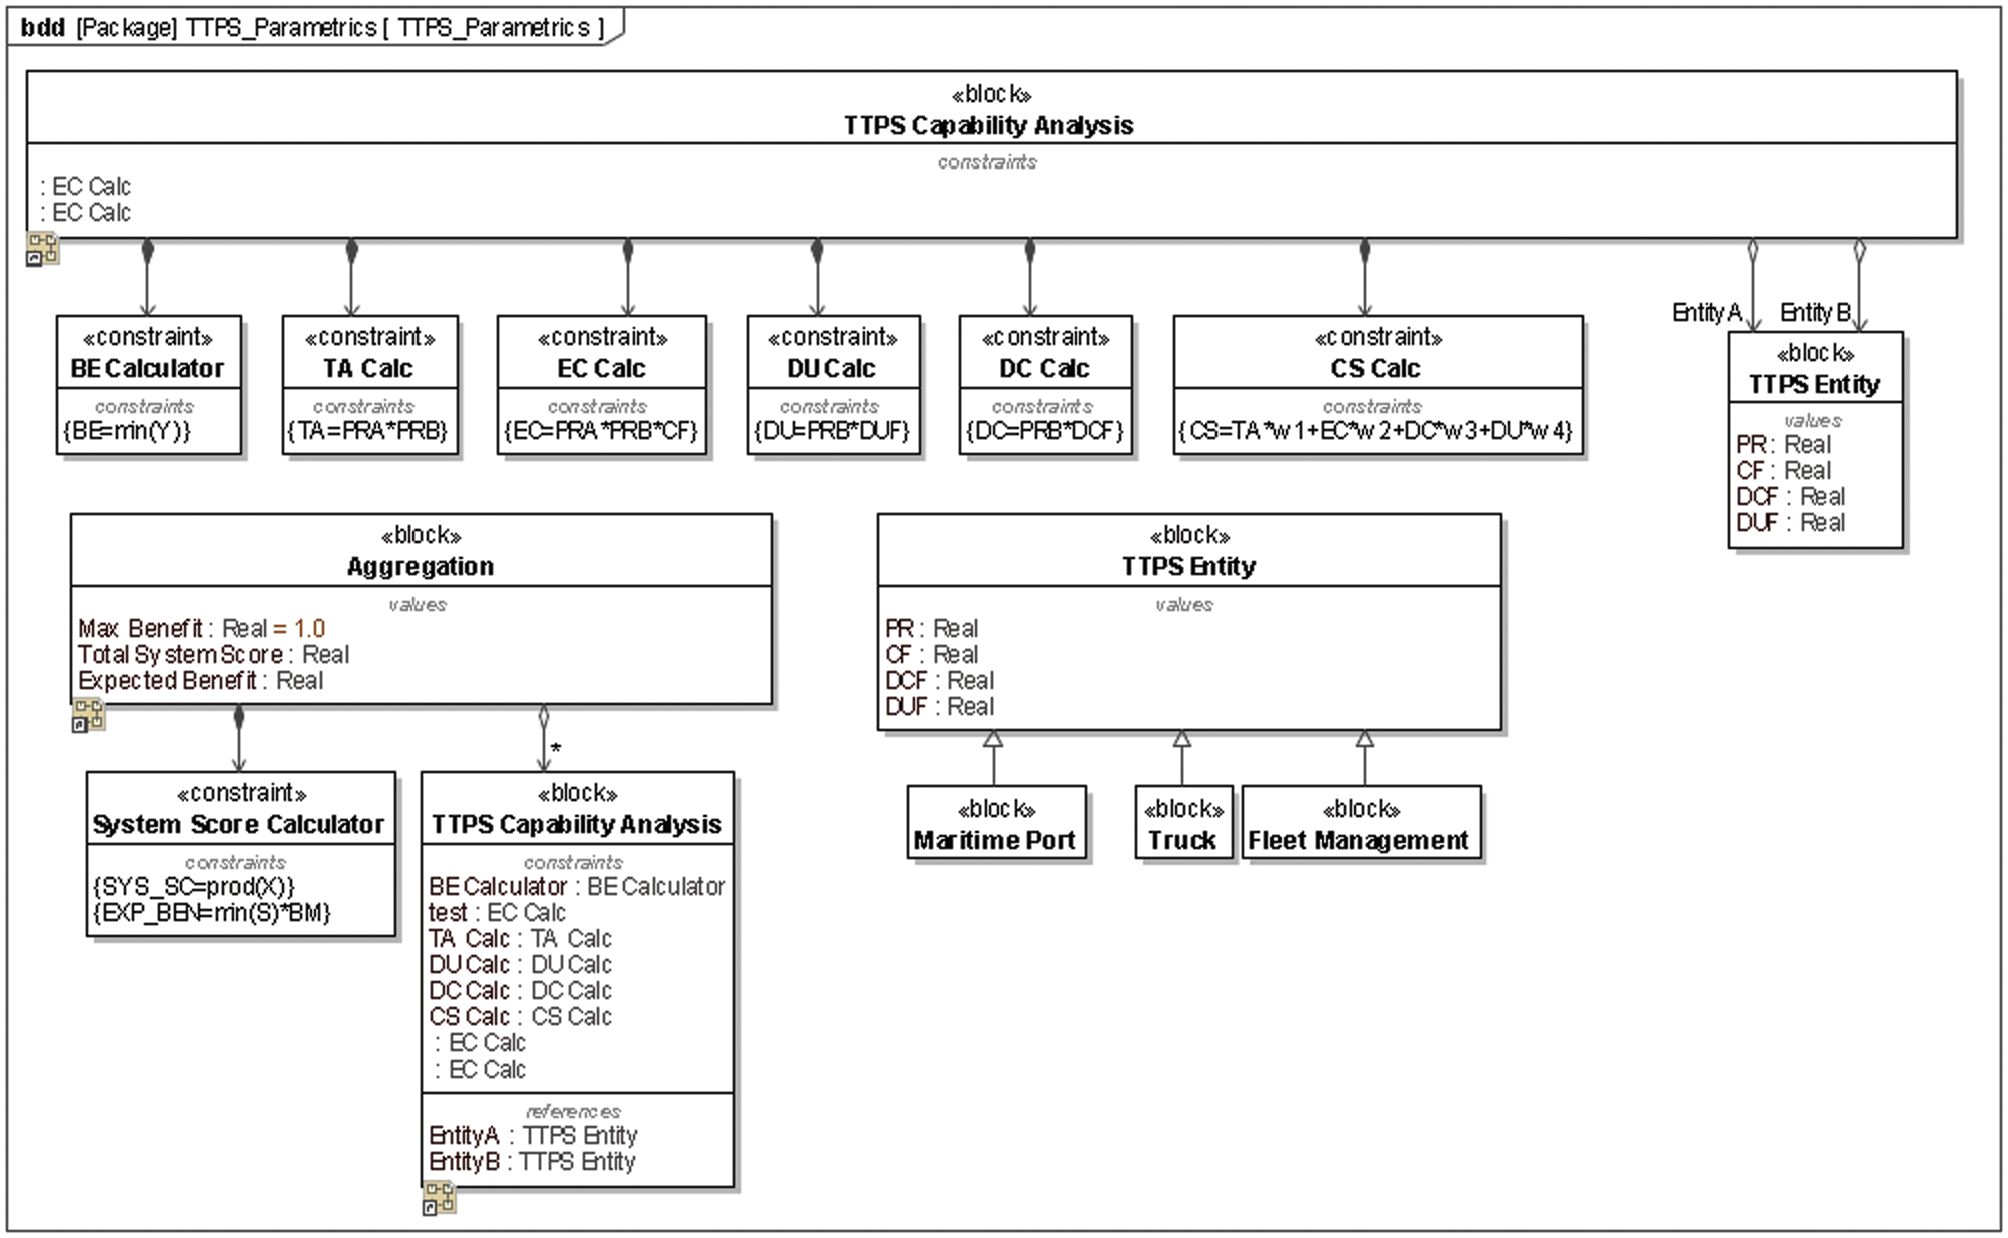
Parametric analysis diagram.
The details of a parametric diagram (Figure 5) correspond to a system of interconnected constraints and parameters.
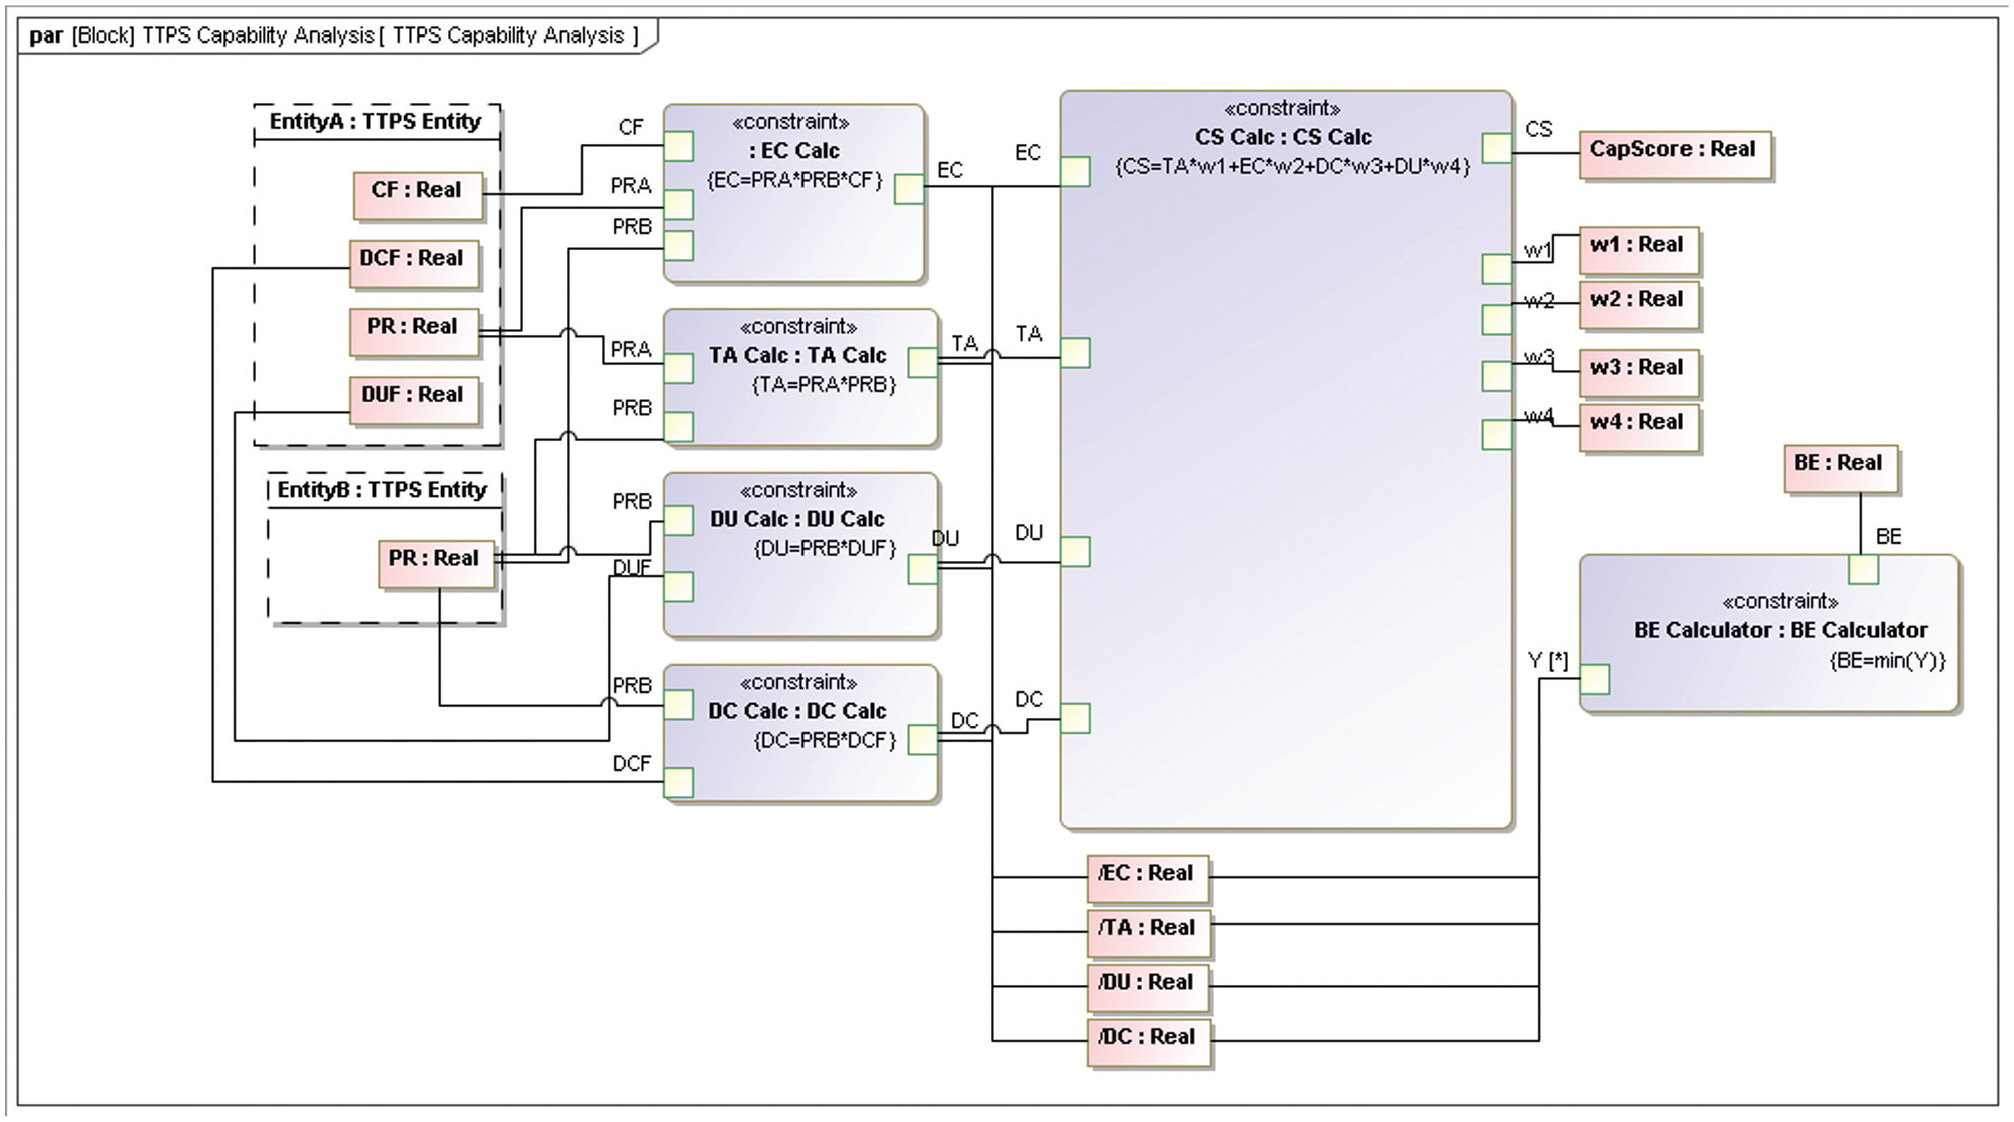
Details of a parametric diagram.
Architecture Instances
Instance specifications of each component are created to hold the values of the specific system configurations. These instance specifications are presented in views (Figure 6) to comply with traditional reporting format and deliverable artifacts.

Details of a parametric diagram.
Additional Remarks on Systems Modeling
The requirements are satisfied by a given architecture. Each architecture has a specific set of parameters that makes it a unique instance. Each of these architecture instances is evaluated with respect to a measure of effectiveness using a parametric model. If a model user needs to evaluate several architectures with respect to the same measure of effectiveness, the presented pattern can be used, as shown in Figure 6. In the example, several instances were used to obtain architecture capability measures. To generate additional measures of effectiveness, a new parametric model with specific calculations is needed.
The new parametric model will take a system architecture as input, thus promoting re-usability.
The advantage of a SysML model is that the elements are defined as objects that can be extended with additional attributes. The diagrams such as BDD and IBD can help to represent the objects with respect to a viewpoint. Thus, there may be several BDDs and IBDs in a model. Depending on the model viewpoint being studied, only the relevant elements are presented in each diagram. Other documentation, such as ICDs, is generated automatically. Architecture elements such as the truck and fleet manager can be customized to fit a particular analysis. For example, for container and bulk cargo, it is only necessary to customize the attributes of the cargo information.
Case Study
The proposed model constitutes a pattern that a central authority can apply to an ITS deployment whose mission is to integrate maritime ports, freight actors, and electronic toll collection systems. The model was motivated by the diversity of actors and capabilities present in several countries around the world. For demonstration purposes, the model was applied to the U.S. context. However, some parameters can be modified to fit other regions, thus making the model transferable. A spreadsheet summary (Figure 7) shows that the system developed from the Architecture Reference for Cooperative and Intelligent Transport (ARC-IT) architecture is limited by the participation rate in GPS tracking software by the fleet manager, which was approximately 65% in 2019 ( 19 ). For the alternative architecture, a scenario-based approach was used. The participation rates of all the actors can be increased to 100%. The DCF was set at a lower bound of 50% as the baseline scenario for the alternative architecture. This denotes that only half the data being transmitted can be interpreted, and, with the increased data, the maritime port can make additional business decisions 50% of the time compared with not having the data. These values were increased to reflect improved conditions of data utility (DU) and CF for the alternative scenarios.
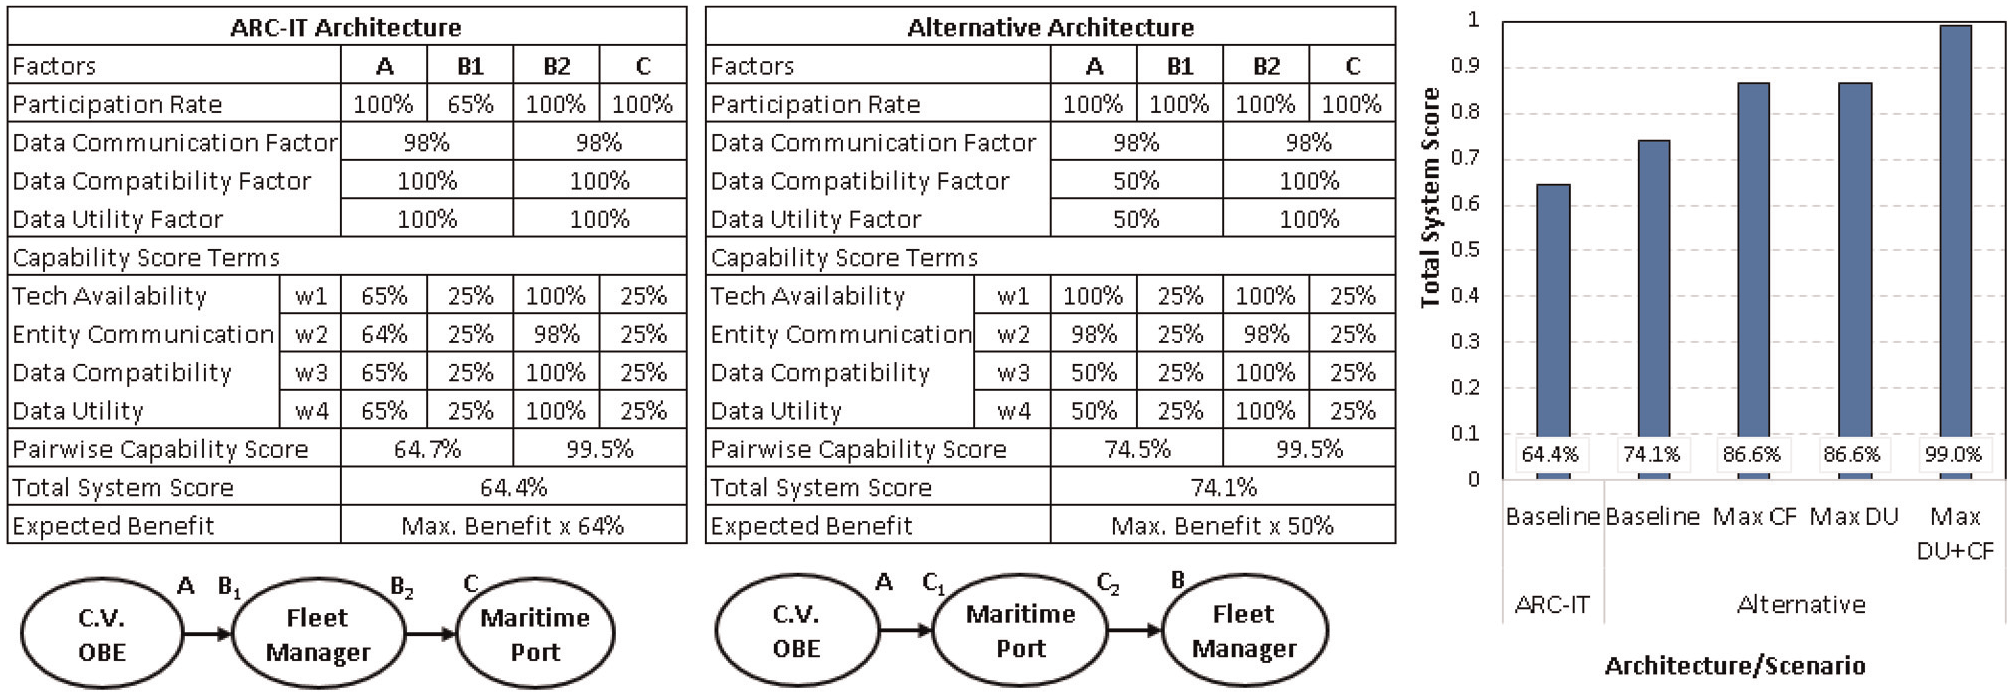
Summary of parametric analysis.
The ARC-IT for Freight Drayage Optimization depicts the information flow from the commercial vehicle on-board equipment to the fleet and freight management center to the intermodal terminal and back.
Communication channels between the commercial vehicle’s on-board equipment and the fleet and freight management center are typically across 3G/4G cellular networks, while the communication channel between the fleet management center and the intermodal terminal is through internet-based applications. In the U.S., each system is in an advanced stage of development where interface issues associated with communication channels have been resolved with few instances of dead spots in the nation’s cellular coverage. Data interpretation issues have also been resolved with third-party fleet tracking software and applications that provide both ends of the data exchange. The flow of information from the commercial vehicle’s on-board equipment transmits data to the fleet manager, who adjusts the truck’s appointment time at the port.
Results and Discussion
The system’s CS increases from 64.4% to 74.1%. The score shows that this system has a greater chance of achieving the full benefit envisioned by the ITS project. However, the expected benefit with these two assumptions is 50% lower the expected benefit of implementing the system when compared with the original. When the compatibility factor is increased, the efficiency gains are restricted by the data utility. Data is being transmitted and interpreted, but the participating systems cannot change their states based on the received data. A similar analysis can be done when participating systems install advanced decision systems (e.g., maximize DU) and do not have the required data feeds. In equality of conditions, the alternative architecture was that participants could communicate to one another, showing more potential benefits as it is only restricted by network connectivity. This is the case of an articulated IIOT development to enhance system-wide efficiencies.
Based on these numbers, the trade-off is a more capable system versus a more significant benefit given to the current state. The architect must consider if these operating states are fixed or if the conditions will change over time and how. For example, the port appointment system may gain the capability to interpret and act on different third-party data signals increasing DC and DUFs, increasing CS and the expected benefit. Alternatively, the fleet managers may adopt more fleet tracking technology, increasing their participation rate values, which also increases the CS and expected benefit. The model can capture an instance, but the architect must understand the significance of the two values in their context.
Conclusion
This work presented an application of MBSE in the context of freight-focused ITS. The model was developed in SysML. The proposed model demonstrates a parametric analysis of an ITS deployment considering the technological maturity and connectivity in the deployment context (e.g., country, region). The analysis presented was based on a single measure of effectiveness evaluated across two instances of the proposed architecture. However, a generalizable pattern can be extracted and replicated to analyze the same architecture using additional measures of effectiveness. This can be achieved by creating a new analysis context block with a specialized set of equations (i.e., constraints) that evaluate the same architecture (i.e., blocks, parameters, behaviors, messages) with respect to other metrics (see Figure 4).
The model serves as a single source of truth with different views to satisfy the interest of diverse ITS stakeholders. To fulfill stakeholders’ views, the presented SysML model produced typical SEMP deliverables (e.g., requirements traceability matrices and interface control documents). Another advantage of the proposed model is its scalability. As more actors, messages, or behaviors are added to the application context, the reporting and the interactions are updated automatically or with minor adjustments.
The limitation of the approach and model presented is the learning curve associated with applying MBSE methodologies and languages into current ITS practice. The existing ITS tools offer a form of MBSE with domain-specific tools with a high level of maturity in relation to adoption and the number of applications covered. However, execution and extensibility features are not easily attainable.
In both traditional and MBSE approaches, the goal is to undertake a substantial amount of work at the design stage to create a reasonable representation of the intended system to identify, monitor, and correct possible implementation risks. The initial work required to build a model in SysML is partially overcome by the high degree of specialization of the existing tools such as SET-IT. A middle-ground approach could be to translate SET-IT structures into SysML-equivalent representation so that the general practice can take advantage of both tools.
For practitioners, ITS models can be directly authored in any SysML-compatible tool and make it available to all the interested stakeholders in the region. At the same time, ITS stakeholders can take advantage of all the automation and analysis tools available for SysML models. Because SysML is used in several industries (e.g., aerospace, defense), any improvements or best practices obtained in a specific discipline can be swiftly adopted in ITS applications.
IIoT applications are characterized by an increased number of actors (e.g., applications, sensors) and exchanged messages. This work introduced the evaluation of traditional and non-traditional communication channels to carry the information as an early-stage enabler for ITS projects. Additionally, the paper reminded systems architects that ITS require communication cooperation. As more devices become directly connected, the reliance on external infrastructure or non-traditional actors to supply the channel to carry the information becomes less important. However, as more devices become directly connected, assurances of data compatibility between multiple actors and technologies become of significant importance to the system’s design. Lastly, this paper puts forward that the information exchanged between actors must enable a state change. Information exchanged with no value has no benefit in the deployment of a system. This is relevant to keep ITS stakeholders such as transportation agencies, policymakers, and service providers focused on achieving strategic goals with all the actors, sensors, and applications that may become available in an IIoT environment.
Footnotes
Acknowledgements
This publication was supported in part by the Master’s thesis work of Paul Crawford in the Systems Engineering program at the Florida Institute of Technology. Thesis title: “A Parametric Evaluation of IoT Applications to Freight Transportation Using Model-Based Systems Engineering” (Melbourne, Florida, January 2020).
Author Contributions
The authors confirm contribution to the paper as follows: study conception and design: P. Crawford, A. Fabregas, R. Mesa, M. Calatayud; data collection: P. Crawford, A. Fabregas; analysis and interpretation of results: P. Crawford, A. Fabregas, R. Mesa; draft manuscript preparation: P. Crawford, A. Fabregas. All authors reviewed the results and approved the final version of the manuscript.
Declaration of Conflicting Interests
The author(s) declared no potential conflicts of interest with respect to the research, authorship, and/or publication of this article.
Funding
The author(s) disclosed receipt of the following financial support for the research, authorship, and/or publication of this article: This publication resulted (in part) from research supported by the Inter-American Development Bank (grant number C-RG-E1614-P001).

The content of this paper is solely the responsibility of the authors and does not necessarily represent the official views of the Inter-American Development Bank.