



Abstract
Efficient dynamic ride-matching (DRM) in large-scale transportation systems is a key driver in transport simulations to yield answers to challenging problems. Although the DRM problem is simple to solve, it quickly becomes a computationally challenging problem in large-scale transportation system simulations. Therefore, this study thoroughly examines the DRM problem dynamics and proposes an optimization-based solution framework to solve the problem efficiently. To benefit from parallel computing and reduce computational times, the problem’s network is divided into clusters utilizing a commonly used unsupervised machine learning algorithm along with a linear programming model. Then, these sub-problems are solved using another linear program to finalize the ride-matching. At the clustering level, the framework allows users adjusting cluster sizes to balance the trade-off between the computational time savings and the solution quality deviation. A case study in the Chicago Metropolitan Area, U.S., illustrates that the framework can reduce the average computational time by 58% at the cost of increasing the average pick up time by 26% compared with a system optimum, that is, non-clustered, approach. Another case study in a relatively small city, Bloomington, Illinois, U.S., shows that the framework provides quite similar results to the system-optimum approach in approximately 62% less computational time.
Keywords
Dynamic ride-matching (DRM) in large-scale transportation systems has been studied and incorporated in many transportation simulation models ( 1 – 3 ). As stated in Özkan and Ward, the closest driver is a commonly practiced policy that is simple and straightforward to implement ( 4 ). In this policy, the closest driver to each given rider is fetched from a sorted adjacency matrix, and these closest drivers meet the travel demand of the riders. Although this policy is favorable, as it is not computationally complex and requires relatively low memory as well, as it somewhat resembles real life by depicting the greedy approach in decision-making, it is not system optimum. In an optimal environment, a match between a vehicle and a request would occur in a way that either the total pick up time is minimized or the total number of matches is maximized. In the minimization approach, some riders may wait longer to be picked up, compared with the time with the closest driver policy, to conserve less total pick up time.
A DRM framework including an optimization model that provides a system-optimum ride-matching by minimizing the total pick up time was proposed in Sarma et al. ( 3 ). The model proposed is a type of the classic transportation problem and simple to solve. Yet, in large-scale problems, let alone solving the problem, even building the model is computationally time-consuming. In large-scale transportation system simulations, such as Polaris (developed by the Argonne National Laboratory to quantify the mobility and energy impacts of new transport technologies on a regional basis), computational time is a major driver toward conducting quick and reliable analyses for real-life problems ( 1 ). From the perspective of a fleet operator, computational time is a key aspect for real-time operation, since users wish their request to be assigned timely. Therefore, in this study a DRM framework is developed that partitions the transportation network into clusters to efficiently solve the problem in small pieces by utilizing a modified version of the optimization model in Sarma et al. ( 3 ). A linear programming (LP) model and an integer linear programming (ILP) model are created to solve the DRM problem. The framework quickly matches vehicles and requests with minimal interruption in the general computational flow of the aforementioned simulation model.
In this study, a ride-matching framework is constructed that separates the network into clusters of vehicles and requests using an unsupervised machine learning method, and it utilizes an LP to form sub-networks that can be quickly solved using an ILP. With the aid of parallel computing, the framework minimizes the computational time while keeping the solution quality at acceptable levels. This approach is compared with the closest driver policy and the framework in Sarma et al. from computational time and quality perspectives ( 3 ).
The contributions of this study are as follows. A modeling framework is provided that divides a transportation network into smaller pieces and solves the DRM problem. Based on the subject problem, it is possible to determine the size of problem pieces to balance the trade-off between the computational efficiency and the solution quality. A case study is conducted on the Chicago Metropolitan Area, U.S., to illustrate the pick up time savings and the computational efficiency of the presented framework.
Literature Review
Ride-matching has been widely studied under different problem settings. Studies similar to the current study are Sarma et al., Al-Kanj et al., Jin and Hu, and Xu et al. (3, 5–7). A similar work that solved the problem without partitioning the network was presented in Sarma et al. ( 3 ). This study developed a solution framework by considering their optimization model. An approximate dynamic programming to maximize the revenue gained by the matching of vehicles and requests was proposed in Al-Kanj et al. ( 5 ). The study considered a network with 32,874 trip requests and optimized for up to 650 trips by dividing the total requests into 15 min time intervals. Trajectory matching for a ride-sharing problem was used in Jun and Hu ( 6 ). Although they focused on a different problem, their concern was also about large-scale networks. The Markov decision process to solve a similar large-scale DRM problem was used in Xu et al. ( 7 ). Although “thousands” of trips was mentioned a few times, the authors did not provide the exact number of trips considered in their “real-world experiment.” The problem addressed in this study is similar to present day door-to-door services through a smartphone application in which users make requests for immediate pick up, though ride-sharing is not allowed. The literature also broadly focuses on vehicle routing, and pick up and drop off time windows. In the DRM problem, vehicle routing and time windows are not considered, since future demands are unknown. Such features can improve operational efficiency but would considerably increase the complexity and the time-to-solution. Rather, the problem tackled in this study is less complex, but it considers very large instances.
Methodology
This section describes the problem, presents the model structure and formulations, and proposes an alternative solution approach to benchmark the original model.
Problem Description
The DRM problem can be described as follows. In a given transportation network and a pre-determined planning horizon, a set of riders request vehicles. The sets of vehicles and ride requests are denoted by

Sets, Parameters, and Variables Used in the Dynamic Ride-Matching (DRM) Model

subject to,



In the DRM model, Objective function 1 maximizes the total time savings between the maximum allowed pick up time and the vehicle-to-requester travel time. Constraint set 2 ensures that each vehicle is assigned up to one request. Constraint set 3 assures that each request is assigned up to one vehicle. In these two constraint sets, equality signs especially are not used, because they may result in an infeasible solution when
Although the ILP, which can also be interpreted as an LP because of the total unimodularity property, can be quickly solved for reasonable instance sizes, for example
Model Structure and Formulation
The DRM model can be improved by reducing the number of decision variables while creating subsets for vehicle and request pairs that satisfy
While partitioning, three approaches to follow are reviewed: (1) Create clusters such that the total number of links in between the clusters is minimized, a.k.a., min-cut clustering ( 8 , 9 ); (2) Create clusters with uniform computational difficulties; (3) Create clusters such that contiguity and even distribution are conserved as much as possible.
In (1), since the information loss is minimal, such an objective would minimize the deviation from the globally optimal solution, which can be obtained by solving the DRM model. Yet, this approach is not computationally promising because solving the min-cut clustering ILP can be as difficult as solving the DRM problem.
In (2), the uniformity can be satisfied by ensuring equally distributed vehicles and requests to clusters, which requires solving another LP. The resulting partition could be computationally useful, in the sense that clusters can be distributed to several machines or paralleled, and the computation in each cluster could be completed with similar time requirements. The type of LP models for such partitioning or so called districting is reviewed in Validi et al. ( 10 ). In both of the partitioning approaches, a difficult LP/ILP awaits to be solved and a complete graph needs to be inputted into the models.
Acknowledging the difficulties in the first two approaches, in (3), attention is turned to clustering algorithms requiring low memory and less information that quickly partitions a graph into the desired number of clusters. Surely, most of these algorithms do not comply with the aforementioned objectives in (1) and (2), yet the concern of this study is centered around the computational efficiency. Therefore, a commonly used unsupervised machine learning algorithm is adopted: the k-means clustering algorithm. The algorithm takes coordinates of points in the graph and the number of clusters desired as input, and produces clusters as an output using Euclidean distances as a measure. It starts with selecting k centroids; then, it assigns the points to the closest centroids. The advantage of this algorithm is that, once it is run, the output centroids can be used to estimate the clustering in the following time intervals because the distribution of vehicles and requests in the network does not tremendously vary over time. For example, assume the network is partitioned in the first planning horizon. These centroids can be used to form new clusters in the next few, for example 30 min, planning horizons by assigning closest coordinates to these centroids. This convention was followed in the numerical results, and formed the centroids every 30 min. It should also be noted that such an approach may not be well-suited to networks with a high order of spatial dynamics.
To partition the graph, zonal-level data is considered that provide the zone information of given vehicles and requests. Zones (a.k.a. traffic analysis zones) represent geographical and sociological distinctions and are used commonly in transportation network planning. For instance, Chicago Metropolitan Area is studied in 1,960 zones. In general, zone boundaries are defined by the Metropolitan Area Organization(s). Partitioning the network into zones is common in transportation modeling especially because of the computational burden as the number of zones is usually smaller than the number of links or nodes. The zonal-level variables are employed in this model for these reasons.
Vehicles and requests are differentiated by creating separate clusters for each. The goal in this operation is to create problem instances for the DRM model with a uniformly distributed (as much as possible) number of vehicles and requests. This is a similar goal and approach to balancing riders and drivers in dynamic ridesharing problems ( 11 ). This will increase the likelihood of finding a match between vehicles and riders within each problem instance. Therefore, clusters will be used to form small problem instances, which are referred to as DRM networks, using an LP model named the network formation (NF) model. In Table 2, the notations for the NF model are provided.
Sets, Parameters, and Variables Used in the Network Formation (NF) Model

The cardinalities of
Based on the definitions, the NF model that forms the DRM networks is constructed as follows:

subject to,

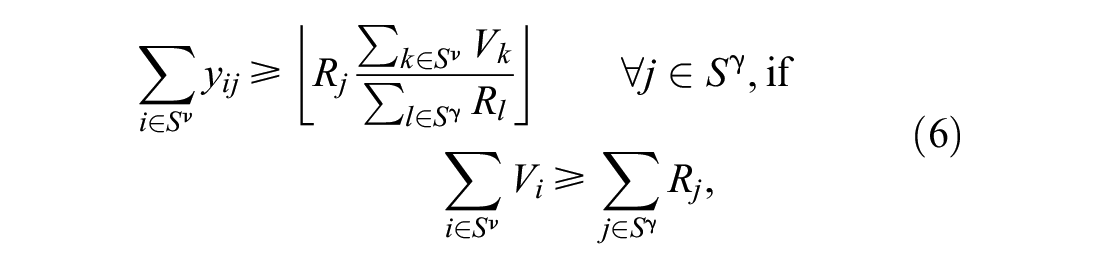

Objective function 4 minimizes the total travel time from vehicle clusters to rider clusters of all vehicles matching the requests. Constraint set 5 enforces that all vehicles in the vehicle clusters match requests at some request clusters, that is, all vehicles are utilized in a DRM network. Constraint sets 6 and 7 conditionally become active and are designed to create fair DRM networks with equal (as much as possible) numbered vehicles and requests. In Constraint set 6, all vehicles are assigned to requests proportional to the requests in a given cluster. Constraint set 7 does not allow assigning more vehicles than the number of requests to clusters. The NF model is designed in such a way that constraints will not produce an infeasible solution.
The NF model does not directly output the DRM networks, but using
To deal with this issue, the
In the DRM model,

Sets, Parameters, and Variables Used in the Updated Dynamic Ride-Matching (DRM) Model

subject to,





In the updated DRM model, Objective function 8–Constraint set 12,
After solving the updated DRM model, some vehicles or requests may remain unmatched because of the

Numerical Results
This section evaluates the performance of the proposed approach. First, Polaris—the simulation framework in which the simulations were carried out—is briefly introduced, and later two case studies are presented.
Polaris Agent-Based Modeling
Polaris is an agent-based modeling framework that can reproduce both supply and demand aspects of urban mobility in metropolitan areas ( 1 ). To validate the framework and compare its performance with other approaches in the literature, numerical analyses are conducted in this simulation environment.
The demand aspect is captured by modeling each person as an independent agent that makes multiple decisions based on select attributes, available modes, cost of decisions, and travel times. These decisions include strategic decisions, such as determining work location and vehicle ownership ( 13 ). The activity-based model follows the so called “ADAPTS” framework with operational decisions implemented through different choice models, including activity generation, as well as mode and destination choices ( 14 – 16 ).
The supply aspect is captured by traffic, transit, and transportation network company (TNC) simulation models. The traffic simulation models feature an implementation of the Link Transmission Model ( 17 ). Routes are determined based on an information-mixing dynamic traffic assignment strategy ( 18 ). Transit simulations include details, such as boarding, alighting, and transfers considering different public transportation modes. The multi-modal router provides routes specific to each individual containing the specific line, time, and location of boarding and alighting ( 19 ).
Polaris simulates fleet operators providing door-to-door transportation services ( 20 ). The operation is presented by a fleet operator that controls a set of vehicles. Requests are mediated by the operator which assigns requests to available vehicles. Trips for these type of services are generated as an outcome of the traveler mode and destination choice models based on the paradigm of activity-based model. Each of these models are calibrated based on household survey data. The outputs of these models are then validated by comparing with data available from local agencies, such as ridership data from Chicago Transit Authority and Chicago Transportation Network Providers data ( 21 ). More about validation can be found in Auld et al. ( 22 ).
Finally, all computations were carried out on an Intel® Xeon® Gold 6138 CPU@2.0 GHz workstation with 128GB of RAM and 40 cores, and problem instances were solved using the Dynamic Linked Library interface to the solver IBM ILOG® CPLEX® 12.10 ( 23 ).
Case Study in Chicago Metropolitan Area
Chicago Metropolitan Area has a population of over 10 million people with more than 30 million trips occurring daily. The network contains around 55,000 unidirectional links and almost 20,000 nodes.
The High Technology–Mobility Scenario (B) presented in Serma et al. is simulated, in which households are likely to forfeit their private car ownership and rely on door-to-door mobility services ( 13 ). Each household may relinquish their private vehicles based on demographic characteristics following Menon et al. ( 24 ). (Refer to Gurumurthy et al. for specific details of this scenario [20]). Only 40% of households own a car as opposed to 98% in the baseline model calibrated for the year of 2018. In addition, the fares for door-to-door services were substantially reduced assuming a great portion of vehicles are autonomous. Yet, the framework is also applicable to other scenarios where vehicles are not autonomous. Experiments were conducted in this scenario to objectively compare the framework with other policies.
This scenario was simulated for three different ride-matching strategies: (1) the centralized framework in Sarma et al., (2) the approach proposed here, and (3) a sequential assignment to the closest vehicle (assuming inter-zonal travel times) as in Gurumurthy et al. (
3
,
20
). In both of the optimization-based methodologies (i.e., this study and Sarma et al.), it is assumed that
Figure 1 shows an example snapshot of the problem layout for 1 min. time interval in the Chicago case. In all three sub-figures, rectangles denote zones. In Figure 1a, the distributions of vehicles and requests can be observed. In Figure 1, b and c , different colors represent clusters of requests and vehicles, respectively. It can also be noticed that the majority of vehicles and requests are centered around the downtown area at this time interval.

An example Chicago Metropolitan area: (a) requests and vehicle distributions, (b) request clusters, and (c) vehicle clusters for an arbitrary 1 min time interval.
Table 4 summarizes key statistics, such as the total number of requests, average pick up times, and central processing unit (CPU) times, for each strategy. The computational time is reported only for the optimization-based strategies, because the closest vehicle policy yields the solutions in substantially low (in the order of 1 s at the peak traffic) CPU time. Further, the optimization-based strategies require finding
Summary of Solution Statistics for the Chicago Metropolitan Area Case

Note: NA = not available.
Figure 2 shows the key comparison metrics of the simulation results. Figure 2a depicts the number of matched requests for each strategy, and Figure 2b illustrates the average pick up times during the time interval (i.e., 1 min). In both graphs, the closest vehicle strategy, the framework in Sarma et al., and the proposed framework are represented by blue, red, and green lines, respectively ( 3 ). The three strategies are able to serve a similar number of requests throughout the 24 h period although presenting a distinct pattern. The strategy underperforms at the onset of morning peak which happened in conjunction of two events: (i) an imbalance between request pick up locations and drop off locations that led idle vehicles to be located far away from pick up locations, and (ii) a relatively low number of idle vehicles for the prevailing demand, since overall demand peaked in the morning. Specifically, in this scenario, vehicles are initially evenly spread through the network, while the number of requests at the morning peak is distinct from that distribution. Clearly, the framework in Sarma et al. that considers all vehicles in a single problem handled this imbalance better ( 3 ). Possibly, a different initial distribution scheme or enabling repositioning as in de Souza et al. could mitigate this issue ( 26 ). The next case study will show that the impact of such imbalance is lower on a relatively smaller problem size.

Chicago Metropolitan area simulation results for (a) the number of matched requests and (b) the average pick up time.
Finally, CPU times over the 24 h period are presented in Figure 3. The total CPU time for the presented framework is driven by the clustering settings of requests, the time to solve the NF model, and the time to solve the DRM networks. Since all of the DRM networks are independent, the time to solve the sub-problems is represented by the maximum time across all of them in a multi-threaded implementation. It was observed that the CPU times remained below 20 s throughout all the simulation period, while the baseline implementation yielded higher than 80 s of CPU time in the morning peak. The distribution of the solution time confirms that the clustering approach evenly distributes the vehicles and requests, and it creates sub-problems with comparable difficulties.

Central processing unit (CPU) time results comparing this study with the literature for the Chicago Metropolitan area case.
Case Study in Bloomington, Illinois, U.S
Similar experiments were performed for the case of Bloomington, IL, which is another study area of the Polaris simulation tool. This network contains 7,000 links, 2,540 nodes, and a significantly low population at around 150,000. In this case, the propensity for TNC trips was increased by altering the alternative specific constant in the mode choice model. Around 20% of 650,000 simulated trips were performed using the TNC mode with nearly 5,000 vehicles. Although Bloomington is a much smaller area than Chicago, its simulation is useful to show another representative case. Therefore, a user of this framework can predict the final performance by positioning the studied network in between these two cases.
The key solution statistics are presented in Table 5 which follows the same pattern as Chicago. However, the proposed strategy achieves a closer performance compared with the method of Sarma et al., while keeping significantly lower computational times throughout the simulation ( 3 ).
Summary of Solution Statistics for the Bloomington, IL, Case

Note: NA = not available.
Figure 4a depicts the number of matched requests along a 24 h time period. In this case, the number of matched requests over time is similar for all evaluated strategies. Figure 4b illustrates the average pick up time for all three methodologies. The optimization-based strategies outperform the closest vehicle assignment by a significant margin in relation to the pick up time. The relative performance difference between this study and Sarma et al. is similar to the Chicago case ( 3 ).
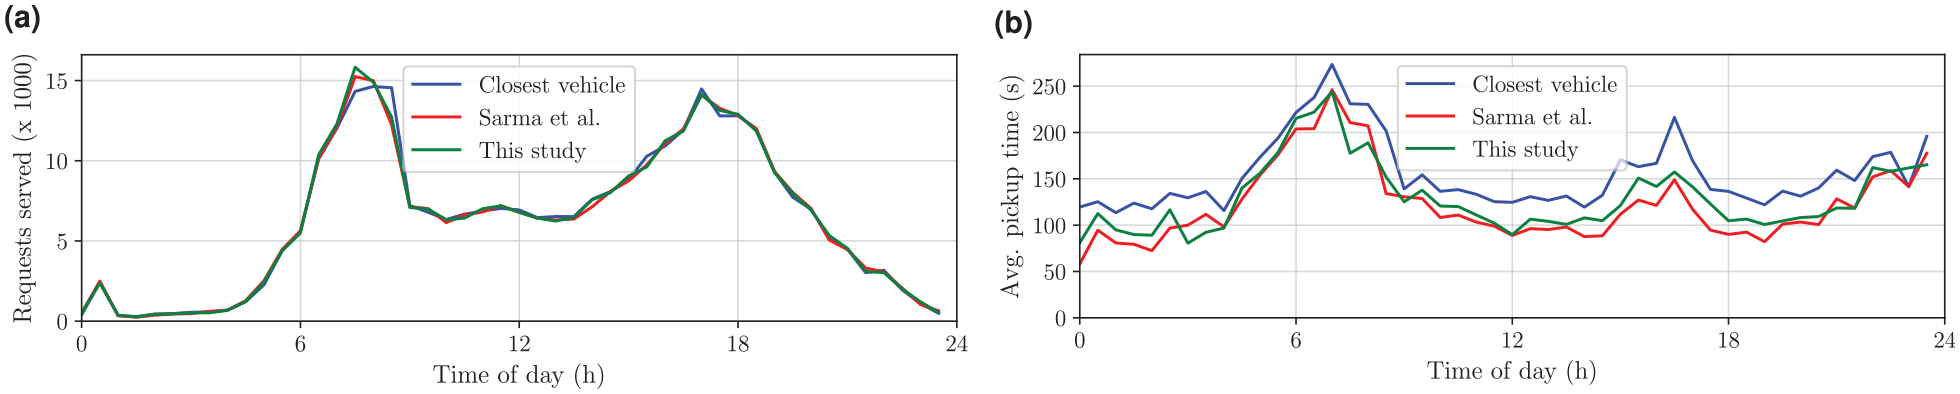
Bloomington, IL, simulation results for (a) the number of matched requests and (b) the average pick up time.
The CPU time comparison is provided in Figure 5. The method of Sarma et al. shows a small average, but reaches almost to 35 s in the morning peak ( 3 ). The proposed approach yields considerably lower computational times around the peak traffic, while the difference is smaller in the off-peak.

Central processing unit (CPU) time results comparing this study with the literature for Bloomington, IL, case.
Conclusion
This study defined the DRM problem and reviewed its relationship to relevant problems studied in the literature. A framework was developed to solve the DRM problem in small pieces. In this framework, clusters of vehicles and requests were created. DRM networks were formed using a linear program that aims to minimize the travel time between clusters while satisfying an even distribution of vehicles and requests to these networks. Once the problem is partitioned, a multi-threaded approach was used to solve the sub-problems.
The framework made it possible to solve the problem in a large-scale transportation simulation on an average of 7.8 s as opposed to 18.4 s without the partitioning approach. Although the framework provided considerable computational time savings, the solution quality, in relation to the total pick up time, diminished by an average of 26%. In both study cases, the major CPU time improvements occur at times when there are more requests than vehicles, and, therefore, the approach without partitioning yields higher computational time.
Our case study in the Bloomington, IL, area, which possesses a comparatively smaller transportation network, showed that the clustering approach performs quite well in small-scale problems. In this case, the presented framework provided 62% computational time savings at the cost of 5% higher pick up time compared with a system-optimum approach in the literature. Further, this study’s approach provided the highest number of matches between vehicles and requests.
The method is especially suitable for large networks where the computational times can be significantly high. It is acknowledged that the method may underperform at specific situations of operations under high demand with an unbalanced distribution of vehicles, in which the centralized method can handle the situation better at the expense of higher computational time. Therefore, a mix of strategies can be adopted to reduce the average pick up time—for example, using the centralized framework in peak times and the proposed approach in non-peak times. Nevertheless, it should be highlighted that the computational time can also be an operational bottleneck, and this framework is flexible on the number of sub-problems. A better solution quality can be obtained by fine-tuning the computational time requirements while adjusting cluster sizes. In the future, the authors will investigate improvement strategies, such as defining the number of clusters that account for the imbalance of vehicles in the network, and also employing a repositioning algorithm to mitigate this imbalance. Therefore, clusters with better distribution of idle vehicles and drivers can be obtained. It should also be noted that the proposed framework consistently outperforms the closest vehicle assignment.
Another limitation in the study stems from considering only one request for a match. In some simulations, ride-sharing (carpooling) is useful to assess different possible future transportation scenarios. Therefore, future studies will focus on improving the current framework and incorporating the ride-sharing feature.
Footnotes
Acknowledgements
This work was sponsored by the U.S. Department of Energy (DOE) Vehicle Technologies Office (VTO) under the Systems and Modeling for Accelerated Research in Transportation (SMART) Mobility Laboratory Consortium, an initiative of the Energy Efficient Mobility Systems (EEMS) Program. David Anderson, a DOE Office of Energy Efficiency and Renewable Energy (EERE) manager, played important roles in establishing the project concept, advancing implementation, and providing ongoing guidance.
The submitted manuscript has been created by UChicago Argonne, LLC, Operator of Argonne National Laboratory (``Argonne''). Argonne, a U.S. Department of Energy Office of Science laboratory, is operated under Contract No. DE-AC02-06CH11357. The U.S. Government retains for itself, and others acting on its behalf, a paid-up nonexclusive, irrevocable worldwide license in said article to reproduce, prepare derivative works, distribute copies to the public, and perform publicly and display publicly, by or on behalf of the Government. The Department of Energy will provide public access to these results of federally sponsored research in accordance with the DOE Public Access Plan.  .
.
Author Contributions
The authors confirm contribution to the paper as follows: study conception and design: T. Cokyasar, F. de Souza; data collection: F. de Souza; analysis and interpretation of results: T. Cokyasar, F. de Souza; draft manuscript preparation: T. Cokyasar, F. de Souza, J. Auld, O. Verbas. All authors reviewed the results and approved the final version of the manuscript.
Declaration of Conflicting Interests
The author(s) declared no potential conflicts of interest with respect to the research, authorship, and/or publication of this article.
Funding
The author(s) disclosed receipt of the following financial support for the research, authorship, and/or publication of this article: This material is based on work supported by the U.S. Department of Energy, Vehicle Technologies Office, under the Systems and Modeling for Accelerated Research in Transportation Mobility Laboratory Consortium, an initiative of the Energy Efficient Mobility Systems Program.