
Abstract
The International Civil Aviation Organization identifies departure and arrival punctuality as on-time key performance indicators. However, these metrics assume a flight’s delay is a result of either the origin or destination airport, providing limited information on where delay should be mitigated in the U.S. National Airspace System (NAS). This study evaluates the relationship between delay propagation magnitude, delay causal factor, airport size, and charged facility (airport or Air Route Traffic Control Center), to examine if certain delays take longer to dissipate. First, using flights from July 2018, results show that most delay propagation chains originate at large-hub airports. However, these delays were the quickest to recover. Second, this study presents a regression model, predicting total propagated delay using fixed effects based on the weather region where the original delay occurred. Each additional flight affected by downstream delay adds 18.7 min on average to total arrival delay in a propagation chain. Additionally, if weather was the original causal factor, total propagated delay increased by 11.6 min compared with non-weather delays. Lastly, this study compares delay propagation in July 2018 and July 2020. Results show uneven impacts of the coronavirus disease 2019 (COVID-19) across the large-hub airports. Some of the investigated airports did not witness large improvements in average delay per delayed flight, warranting further research in the future. While delay and delay propagation have not been completely eradicated in the NAS during the COVID-19 pandemic, findings suggest that both have significantly declined on average.
Keywords
The U.S. National Airspace System (NAS) has historically experienced flight delays that cost the economy billions of dollars annually ( 1 ). Delays result in increased costs to airlines, including the need for additional gates, fuel, and crew, as well as to passengers through increased travel time and reduced productivity. Peterson et al. ( 2 ) found that a reduction in flight delays of just 10% would increase the net U.S. welfare by $17.6 billion. In 2018, the Federal Aviation Administration (FAA) reported a total annual delay cost of $28 billion through direct and indirect costs to airlines and air travelers ( 3 ).
To assess the performance of air traffic management (ATM) systems, air navigation service providers use metrics defined in the International Civil Aviation Organization’s (ICAO) 19 key performance indicators (KPIs), including on-time performance, additional travel time, and capacity utilization ( 4 ). The two KPIs measuring on-time performance are gate departure punctuality (KPI01) and gate arrival punctuality (KPI14). Both are expressed in the percentage of scheduled flights that are on-time, defined as being less than 15 min late.
Solely focusing on punctuality, one cannot assess the true performance of an airport. As stated by the FAA and EUROCONTROL, flight on-time performance is the “end product” of complex interactions involving many resources and facilities ( 5 ). Therefore, it is important to differentiate between original and propagated delay, where propagated delay occurs when the following three conditions are met: (i) a flight arrives late, (ii) the subsequent flight leg departs late, and (iii) the flight arrives late to its next destination ( 6 ). Propagated delay should be accounted for in airport performance metrics as, according to the Bureau of Transportation Statistics ( 7 ), the number one cause for delays since 2004 is a delayed aircraft arrival on a previous flight leg causing the next flight to depart late.
The purposes of this study include to (i) measure delay propagation in the U.S.A. and identify both the causal facility (i.e., airport or enroute facility) and source behind original delay (e.g., weather or volume) using a robust methodology, (ii) compare the contribution of airports, classified by size, to the delay propagation phenomenon, and (iii) evaluate the change in delay propagation brought by the effects of the coronavirus disease 2019 (COVID-19) pandemic on the airline industry.
Literature Review
Given the high cost of delay to the air transportation industry, it is no surprise that historical delay patterns have been extensively studied and simulated to identify operational techniques that best mitigate delays. Examples include optimizing slot allocation ( 8 ), gate reassignment ( 9 ), scheduling of arrivals ( 10 ), and crew and flight resources for cargo operations ( 11 ). In contrast to delay studies, delay propagation studies consider the interconnectedness of the airspace system network holistically.
The literature contains a plethora of delay propagation studies using historical flight data. Baden et al. ( 12 ) analyzed flight delays in the NAS by summing ground and air delays using data from years 2000 and 2004. The authors found that, on average, one third of arrival delay experienced was caused by propagated delay and that the amount of propagated delay experienced on inclement weather days was twice that of propagated delay on days with good weather. Pyrgiotis at al. developed an Approximate Network Delay (AND) model to compute delay propagation at the 34 busiest U.S. airports and found that delay propagation tends to shift daily demand more into late evening hours of the day ( 13 ).
Campanelli et al. ( 14 ) compared delay propagation in the U.S. market with the European airline market through developing an agent-based model that simulates delay propagation in the network. The authors concluded that the first-come, first-served protocol adopted in the U.S. generates larger system delays than the Air Traffic Flow Management (ATFM) slot system used in Europe. More recently, Tan et al. ( 15 ) quantified flight delay in the Chinese airline market between 2015 and 2017 and found that 10 min of arrival delay that occur within a 1 h window before the departure of the next flight leads to an average of 7.49 min of departure delay on the next flight. The authors also compared delay propagation in the U.S. market and concluded that because of the reliance of Chinese airlines on longer ground and flight buffers and a point-to-point network, the Chinese market outperforms the U.S. market in controlling for delay propagation.
The delay propagation literature includes simplified or complex methodologies with assumptions. Earlier studies calculated an airport multiplier, which represents the factor by which an initial delay is increased or decreased at each airport downstream from the first delayed flight. Kondo ( 6 ) found that propagated delays are exponentially distributed during peak times. Additionally, Welman et al. ( 16 ) demonstrated that the variation in the propagation multipliers reflects the variation across different factors at the airports, including airlines’ scheduling, weather patterns, and so forth. The multiplier calculated in these studies did not trace the delay back to its original cause or incorporate the interconnectedness of the NAS system, which is useful for delay mitigation purposes. More recently, Lykou et al. ( 17 ) developed a similar performance metric that calculates the average delay risk at airports and connections across the 30 busiest U.S. airports using a risk-based management model. The study found that all of the 30 busiest U.S. airports had improved their on-time performance and delay risk in 2019 compared with 2018.
Arikan et al. ( 18 ) proposed a stochastic model to identify airports causing the greatest delay propagation in the U.S.A. between 2005 and 2007 and suggested that major U.S. airlines do not build enough block time buffers into their schedules. Kafle and Zou ( 19 ) classified delays into newly formed and propagated to investigate how ground and flight buffers help absorb delays by testing different scenarios. Kim and Park ( 20 ) further extended the analysis by looking into newly formed and propagated delays on an airport and route level to identify the airports/routes with the largest impact on actual flight delay in South Korea. The authors recommended replacing a distance-based ATM system with a time-based ATM system.
Several studies extended the analysis of delay propagation by linking to the causal factors behind propagated delay. Allan et al. ( 21 ) examined causal factors for delays at Newark International Airport and found that 41% of the total arrival delay that occurred between 1998 and 2001 took place on days with convective weather within or at a considerable distance from New York Terminal Area. Fleurquin et al. ( 22 ) reproduced delay propagation patterns in the air transportation network using an agent-based model to simulate the impact of aircraft rotation, flight connectivity, and airport congestion on the formation of congestion clusters. In the same context, Wong and Tsai ( 23 ) investigated contributing factors for delays for a Taiwanese domestic airline using Cox regression and found that block buffer time and weather were key contributing factors behind arrival delays. More recently, Shao and Xu ( 24 ) developed a delay propagation model comprised of a network of 13 airports in China using a colored-timed Petri net. The authors found that flight delays caused by inclement weather lead to widely spread flight delays which result in increased workload for air traffic controllers, leading to additional air traffic control issues.
While incorporating causal factors can identify the source of the propagated delay, it also provides insight into the facility responsible for the original delay. Overlooking the causal factor leads to assumptions about whether the departure or arrival airport is the causal facility. This is problematic for several reasons. Ground delay programs (GDPs) hold flights at the departure airport when there are delays at the arrival airport. Without knowing the cause, these original delays would be incorrectly attributed to the departure airport. Also, not including all types of causal facilities leads to enroute delays being incorrectly assigned to airports, typically the arrival airport. Overlooking enroute facilities as the delay sources can inflate the delays attributed to airports, specifically the destination airport. The distinction between this study and existing studies in the literature is the inclusion of all possible causal facilities and the causal factors.
The methodological assumptions found in the literature greatly affect the results. For example, consider a hypothetical flight that departed 20 min late, then incurred an additional 240 min of delay enroute when diverted because of inclement weather. This study’s methodology considers where the delay occurred (turnaround, taxi-out, enroute, taxi-in) and any delay programs in effect such as GDPs. Therefore, using this study’s methodology, the departure facility would be charged for the 20 min of delay if the delay is not caused by a delay program charged to the arrival. The arrival facility would not be charged for the enroute weather delay caused by the diversion.
The main contribution of this study is that it evaluates how airport size characteristics affect delay propagation and absorption using a robust methodology that overcomes the limitations of the existing literature. It accounts for the delay causes noted in aviation operational datasets, not relying solely on where the delay physically took place or automatically assuming the departure airport was at fault. It also incorporates derived schedule characteristics, such as ground and flight buffers, which help delay propagation chains dissipate. This study quantifies how characteristics of the airport, original delay causal factor, and flight schedule affect delay absorption through a fixed-effects model. Lastly, airlines made significant changes to their service offerings ( 25 ) and reduced schedules and capacity ( 26 , 27 ) in response to the sharp decline in passenger travel caused by COVID-19. The findings of this study on large airports are expanded to measure the effects of the COVID-19 pandemic on delay and delay propagation in the U.S.A.
Data
To evaluate the relationship between delay propagation and causal factors, this study combines flight information from different FAA data sources. This section describes in detail how the datasets were merged and what information each contains. Delay propagation was initially measured when the airline industry was in a steady state by examining flight data from July 2018, when it was not affected by COVID-19. To capture the effects of COVID-19, July 2018 is compared with data from July 2020. This comparison gives a unique opportunity to assess delay propagation in a low-demand situation.
Aviation System Performance Metrics
Aviation system performance metrics (ASPM) provides the scheduled and actual gate-Out, wheels-Off, wheels-On, and gate-In (“OOOI”) times for flights to and from ASPM airports and all flights operated by ASPM carriers. Each flight is identified by an aircraft tail number and domestic flights as well as international flights operated by an ASPM carrier are covered. Using detailed flight activity information for flights scheduled, delays at the departure and arrival gate are calculated.
While ASPM includes flights operated by all ASPM carriers, this study focuses on 21 ASPM carriers that include major, regional, and low-cost U.S. carriers. Data filtering removed flights that have: (i) negative scheduled turn time or (ii) “teleportation event” where a flight leaves an airport it never arrived at. The remaining 704,422 flight records were processed into flight sequences using flight tail numbers, resulting in 157,636 flight sequences for July 2018. This analysis defined the aircraft-operational day as the period in which an aircraft does not have any scheduled turn times exceeding 180 min. This prevents any delays on the first flight of a day being attributed to the delayed arrival of the last flight the night before.
Operations Network
ATM delays, such as ground and airborne delays, can be identified by merging Operations Network (OPSNET) with ASPM. OPSNET reports delays to Instrument Flight Rules (IFR) flights that are at least 15 min and caused by the following factors: (i) weather conditions, (ii) increased traffic volume, (iii) runway conditions, (iv) equipment outages or (v) other causes. A limitation of the OPSNET dataset is MULT delays, where the “multiple” flights affected by a single departure or Traffic Management Initiative (TMI) delay are combined into one delay record that notes the total number of flights affected and the average minutes of delay per delayed flight. Several assumptions were made to match the MULT delays to the flights affected, including: (i) the ASPM flight should occur within the time window of the OPSNET reported delay program; (ii) the original delay that happens to the flight is at least 15 min, and (iii) the number of flights matched to a MULT delay cannot exceed the total number of flights affected by the MULT delay. In total, 83.7% of the OPSNET delay records during the study period were matched to an ASPM flight.
Airline Service Quality Performance System
Airline Service Quality Performance System (ASQP)-reporting carriers are mandated by government to submit the on-time performance of their flights as well as any delay causes associated with it. The types of delays reported in ASQP are: (i) carrier delay, (ii) late aircraft delay, (iii) NAS delay, (iv) security delay, and (v) weather delay. ASQP also includes information on flight diversions and cancelled flights. Therefore, if a flight is diverted, ASQP merged with ASPM provides the entire path of the flight including the diversion airport as well as the duration (minutes) and causes of delay encountered on the ground and in the air. In some instances, delay accumulates over a series of downstream flights leaving no room for schedule recovery. As a result, ASQP-reported cancellations were included to trace down flights that were canceled as a result of built-up propagated delay in a flight sequence. In this study, 1.4% of flight records had a cancellation and 0.2% a diversion.
Methodology
This section covers the methodology in detail for calculating propagated and original delay and determining the causal facility responsible. This methodology builds off several studies ( 6 , 16 , 19 ) and adds the true delay cause and the facility to which that delay should be charged.
Original Delay and Causal Facility
Each flight leg is defined using a Gate-In to Gate-In approach as illustrated in Figure 1. Original delay refers to newly generated delay in the sequence, during: (i) turnaround, (ii) taxi-out, (iii) enroute, and (iv) taxi-in. Once original delay is calculated during each of the four stages of a flight, the information from OPSNET and ASQP is used to identify the causal facility behind the delay. Delays are classified as: GDP, ground stop, and airspace flow program. Departure delays reported in OPSNET are accounted to the departure airport while airborne holding delays are accounted to the arrival airport.
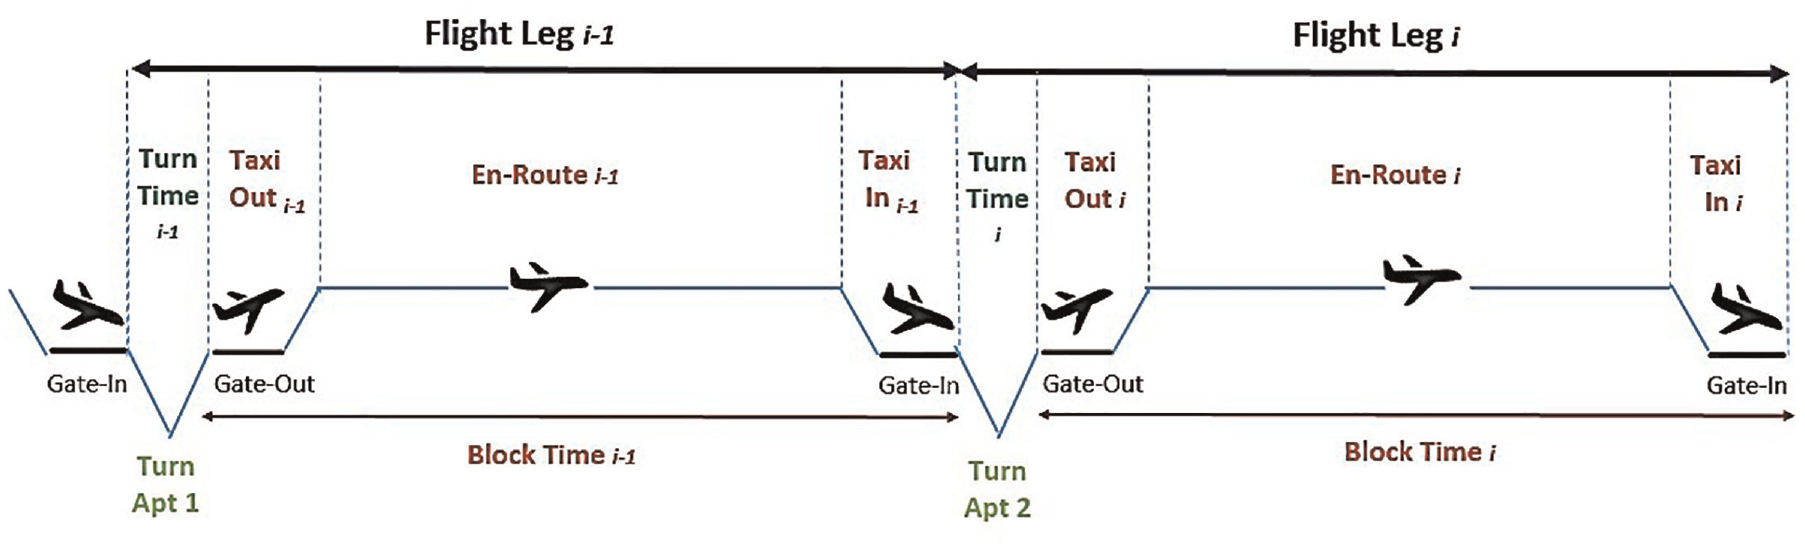
Detailed illustration of flight leg sequences.
Schedule Padding and Propagated Delay
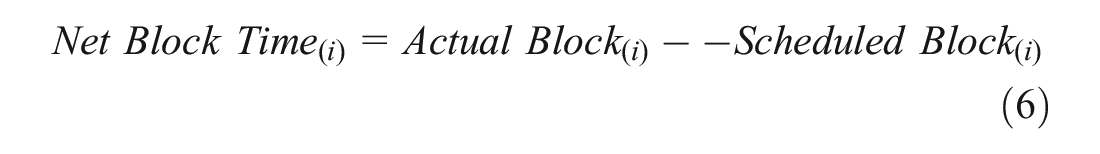
Within a flight chain, the net delay, measured as gate departure delay and gate arrival delay on flight leg(i–1), propagates to the downstream flight leg(i) within the same aircraft-operational day if it is not absorbed by padding either during the turnaround or the block phase. Net Turn Time and Net Block Time defined in Equations 5 and 6 may result in negative or positive values. Positive values are treated as delay and negative values represent schedule padding in which upstream delay may be absorbed.


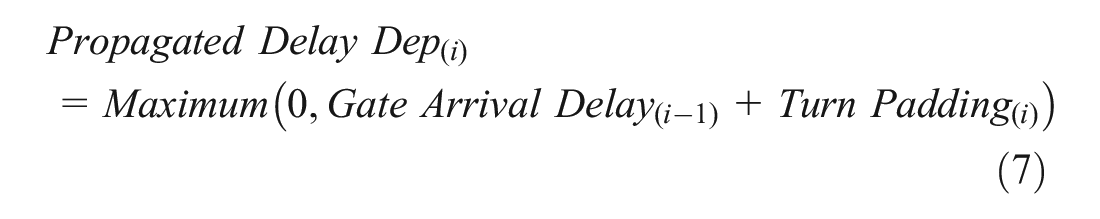
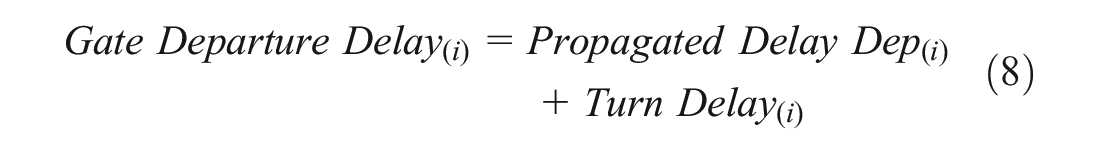
Delays encountered at the departure gate are the result of original delay in addition to propagated delay from upstream sources. For flight leg(i), propagated departure delay is the gate arrival delay from flight leg(i–1) that is not absorbed during the turnaround phase of flight leg(i). Equation 7 below calculates propagated delay at the departure gate. Since schedule padding during the turn or block phase results in a negative value, it is added into the equation below, resulting in a decrease in propagated delay. Gate Departure Delay defined in Equation 8 considers original delay at the turn, if any, and propagated delay that affects departure punctuality.
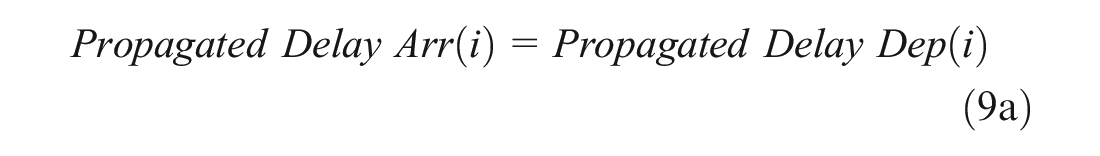
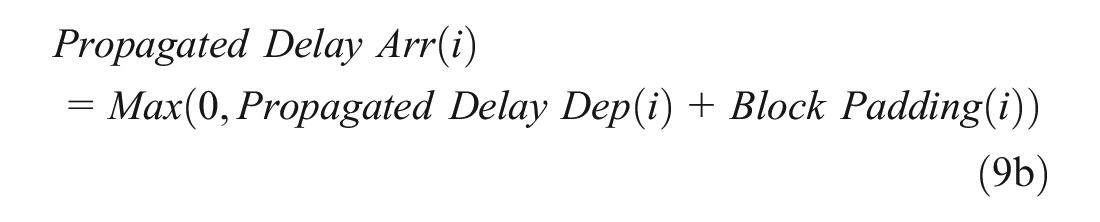
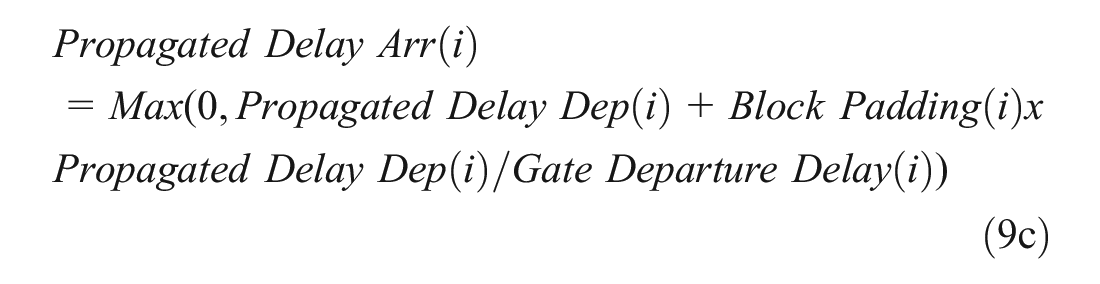
For arrival delay experienced on flight leg(i), the propagated delay is the gate arrival delay from flight leg(i–1) that is not absorbed during the turnaround phase and/or the block phase of flight leg(i). Equations 9a, 9b, 9c calculate propagated delay at the arrival gate while considering different scenarios that can occur depending on whether there is padding during the block phase on flight leg(i). The proportioning of schedule recovery is consistent with the methodologies in the literature ( 16 , 19 ). Equations 9c and 10a allocate block padding to propagated and new delay encountered at the turnaround, respectively. The block padding is applied based on the proportion of each of these delays to the total delay occurring at the departure.
Scenario 1: If there is no block padding:
Scenario 2: If block padding exists but no delay was encountered at the turnaround:
Scenario 3: If block padding exists and flight was encountered delay at the turnaround:
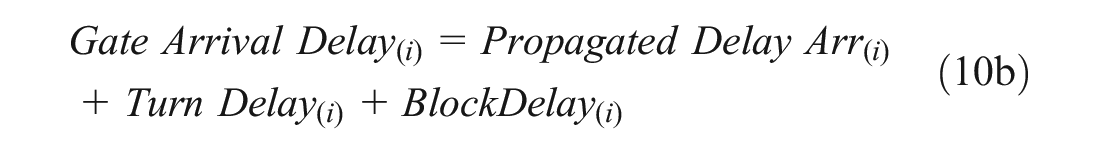
Each propagation chain is charged to the airport that initiated the delay as it can be assumed that original delays on downstream flights within the same propagation chain are caused by the initial delay. For example, if a flight experiences original delay that propagates downstream, a flight downstream may experience additional delay during the taxi-in phase at an arrival airport because of gate unavailability. In this case, the arrival airport will be counted as a new source of delay within the propagation chain and the airport of the first original delay will be the main causal facility behind propagated delay. If propagated delay exists, Gate Arrival Delay on flight leg(i) can be defined with regard to the share of delay that is propagated, using Equations 10a, 10b to calculate arrival delay.
If there is schedule padding at the block phase:
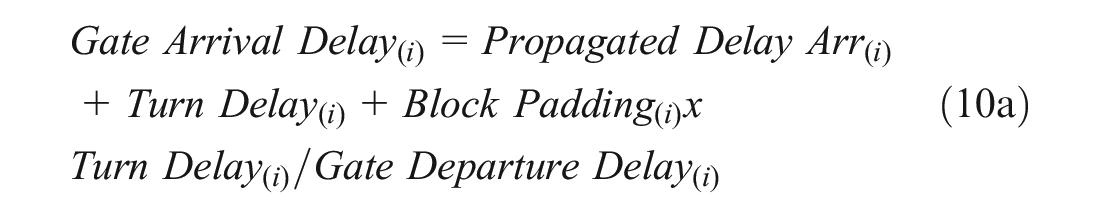
If there is original delay at the block phase:
Fixed-Effects Linear Regression
This study uses a fixed-effects regression to examine the relationship between airport size and propagated delay. Fixed effects control for the individual characteristics within a group (e.g., weather region, airline, etc.) that may cause a bias in the predictor or outcome variables. Assuming the predictor variables and each group’s error term are correlated, by incorporating fixed effects, the effect of the omitted time-invariant characteristics is controlled for to assess the net effect of the predictors on the dependent variable ( 28 ). The fixed-effects model for groups (i = 1,2,…,n) can be defined as follows:

where
The overall coefficient for each predictor variable β represents the average effect of that independent variable, that is, the common slope averaged across all groups. The need for fixed-effects models comes from the inability to control for all unobservable factors that are correlated with the regression variables, resulting in omitted variable bias. The Durbin-Wu-Hausman test validates the assumption behind fixed effects that the unique groups’ error term is correlated with the predictors in the model ( 29 ). If there is a correlation, the Hausman test rejects the null hypothesis of no correlation and fixed effects are valid.
Summary Results
This section presents descriptive statistics obtained from estimating original and propagated delay at each airport while factoring in the size of the airport, consistent with the FAA’s airport size classifications ( 30 ). Through evaluating flights that are at least 15 min late to depart or arrive at an airport, the next subsections look at (i) comparing airport original delay in minutes with propagated delay, (ii) presenting the causal facilities for delay propagation chains, and (iii) presenting the relationship between airport size and propagated delay.
Original and Propagated Delay
Figure 2 presents the average delay on late departing flights and the average share of delay that is attributed to propagated delay, where late is defined as 15 min or more. The share of propagated delay on a flight is the minutes of propagated delay from upstream flights divided by the gate delay on that flight. The overall share for an airport corresponds to the average share of propagated delay for all flights departing at that airport. The airports are the top 15 airports ranked by highest number of late departures during July 2018. For example, on average, a flight that departed late from Newark Liberty International Airport (EWR) experienced 78.8 min of delay at the departure gate and the share of propagated delay on flights departing late was 62.5%. This means that only 37.5% of delay was original departure delay caused by EWR. Among large-hub airports, EWR had the highest share of its gate departure delay caused by propagated delay, while Miami International Airport (MIA) had the lowest share of its departure delay attributed to propagated delay. While flights departing late from MIA experienced 68.8 min of delay on average, only 41.7% of its departure delay was caused by propagated delay. The latter indicates that MIA is a significant source of original delays causing late departures.
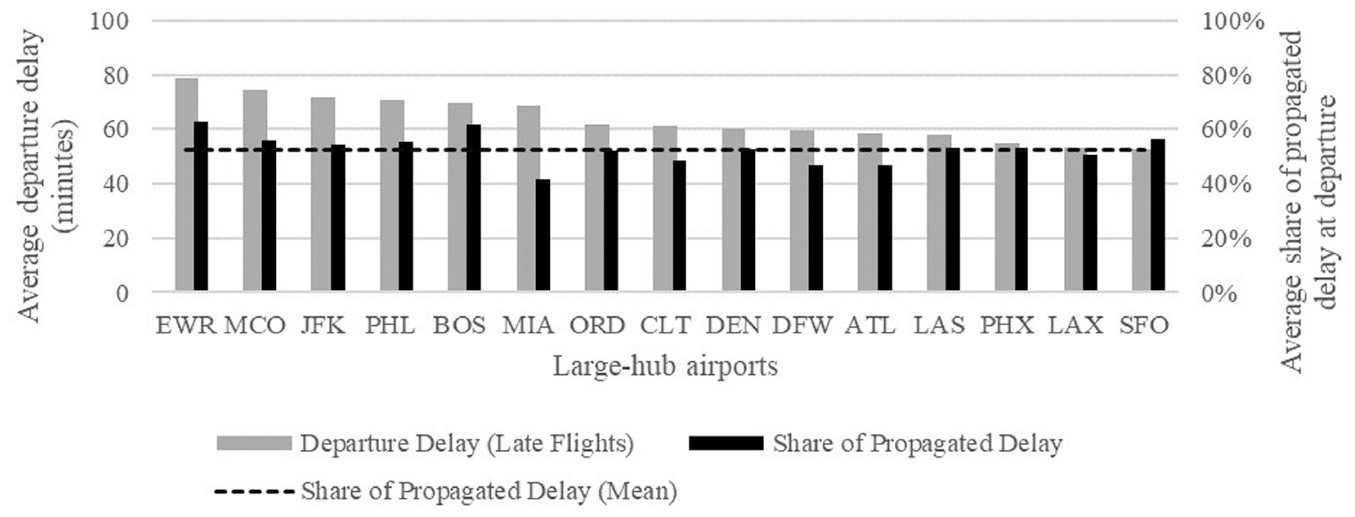
Average departure delay and share of propagated delay for late flights at large-hub airports.
The overall share of propagated delay for late departures is illustrated in Figure 2 by the dashed line. On average, for a flight departing late from a large-hub airport, 52.4% of that delay is caused by propagated delay compared with 58.2% if it was departing from a medium-hub airport and 64.4% if it was departing from a small-hub airport. This suggests that larger airports may experience greater original departure delay compared with smaller-sized airports. Also, the high percentage of propagated delay at small airports indicates that the ICAO on-time KPIs on average underestimate small airport performance. One extreme example in this study found that almost 73% of the small-hub Long Beach Airport’s departure delay was caused by upstream delay propagation.
Causal Facility
Figure 3 looks at the causal facility for flights arriving at least 15 min late at the top 10 U.S. airports grouped by size and ranked by the highest number of late arrivals. The causal facility illustrated can be: (i) the arrival facility itself if the flight is late predominantly because of original delay charged to the airport; (ii) propagated delay if the delay from upstream flights is the dominant cause behind the late arrival; and (iii) Air Route Traffic Control Center (ARTCC) as identified by OPSNET delay records. Other causal facilities, that is, the departure airport, are responsible for the remainder of late flights not shown in the figure.

Causal facility for late arrivals at: large-hub airports, medium-hub airports, and small-hub airports.
Late flights arriving at a large-hub airport are typically charged to the arrival facility itself; for example, 66.9% of the flights arriving late to Chicago O’Hare International Airport (ORD) are charged to ORD as the causal facility behind the delay while 27.3% are caused by propagated delay from upstream flights and 2.6% by an ARTCC. The remainder of the late flights report a different facility such as the departure airport. For flights arriving late to William Hobby Airport (HOU), only 40.3% are late because of delays that can be charged to HOU. For all airport sizes, the highest percentage of late arrivals are charged to the arrival facility (i.e., the arrival airport). However, large airports are more likely to be charged for arrival delays than medium- and small-hub airports. This supports the earlier findings that the current KPI metrics for small airports incorrectly attribute significant upstream delays to them, biasing the results to show lower on-time performance metrics for small airports. Additionally, results show higher percentages of late arrivals charged to ARTCC at smaller airports compared with large-hub airports.
Airport Size
Once the number of propagation chains originating at each airport is identified, it is important to determine the number of recovery stages associated with each propagation chain. Figure 4 shows the overall distribution of recovery stages for delay propagation chains that originate at different sized airports, where bars of the same color add up to 100%. For example, 53.3% of the delay propagation chains that originated at large-hub airports propagated to one flight downstream while 12.1% of originating delays at large-hub airports propagate to three flights downstream. Most of the propagation chains originating at large-hub airports affect a single flight downstream while delays originating at smaller airports (small- and non-hub airports) take longer to recover. This suggests that although large-hub airports can be charged for most of the propagated delay in the system, those propagation chains dissipate in fewer stages than those originating at small-hub airports.

Overall recovery stages, aggregated by airport size.
Impacts of COVID-19 on Delay Propagation
The COVID-19 pandemic had a great impact on the demand for air travel and the operations of the air transportation sector. The literature indicates that a country’s air passenger traffic is directly correlated with increased COVID-19 cases ( 31 ). Not surprisingly, increased health risks and government travel regulations led to a significant drop in air travel demand, where Hotle and Mumbower ( 25 ) found that “performed departures decreased by 71.5% in May 2020 compared to May 2019.” In the end, the predicted job loss in the aviation workforce is expected to be between 7% and 13% ( 27 ).
This reduction in airport flight throughput gives a unique opportunity to analyze the delay and delay propagation during a low-demand period, capturing the sensitivity of the performance metric to system congestion. It also allows evaluation of how much delay remains in the system, even when the throughput is much less than the capacity. While COVID-19 had negative impacts on demand, this led to positive implications on airport on-time performance overall.
The average departure delay per delayed flight (more than 15 min) in Figure 5 shows another interesting impact of the pandemic. In fact, three out of the 19 large-hub airports saw an increase in delay per delayed flight. For instance, flights delayed at least 15 min at Charlotte Douglas International Airport (CLT) saw an increase in average delay by 17.8 min. Figure 5 shows that COVID-19’s impact on performance was not necessarily uniform across airports.
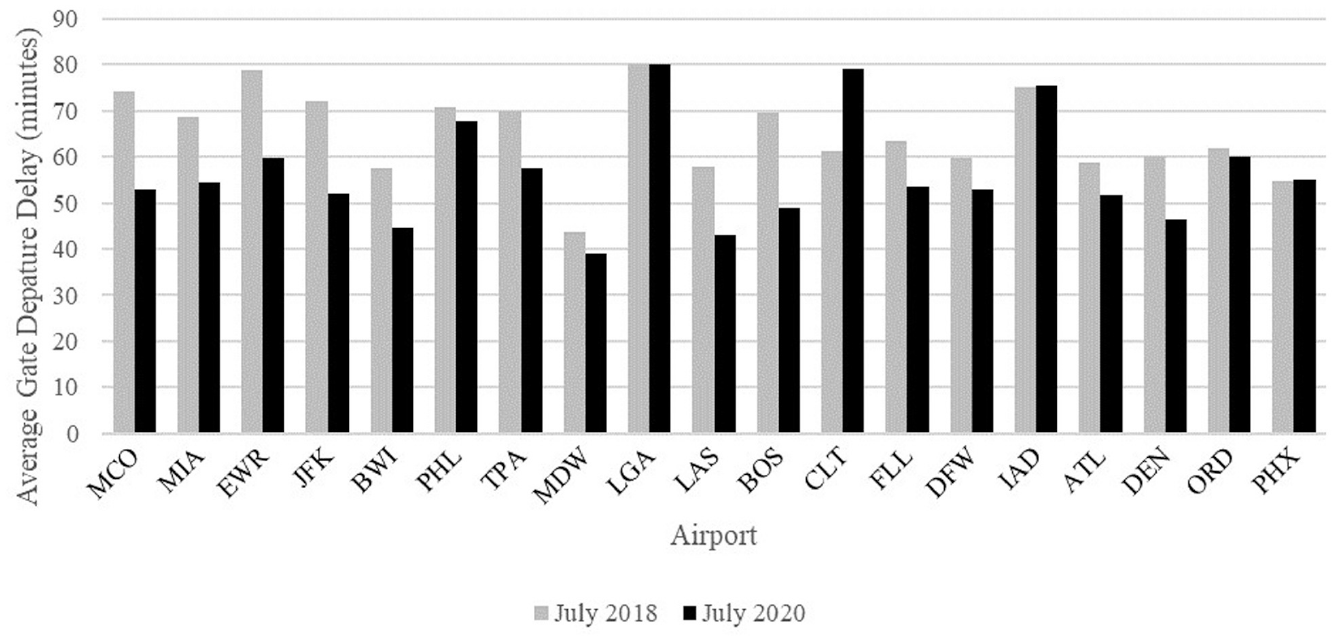
Average gate departure delay per delayed flight in July 2018 and July 2020.
Figure 6 shows that the share of delay caused by propagated delay dropped for 18 of the 19 large-hub airports because of the significant reduction in flight schedules caused by COVID-19, which led to unintended additional schedule padding. Figure 6 also shows the change between July 2018 and July 2020. For example, at Orlando International Airport (MCO), on average, 56% of the departure delay minutes were attributed to propagated delay compared with 34% during COVID-19, that is, a 22% difference, or 22 min for every 100 min of arrival delay is no longer caused by propagated delay. This means that the departure delays at these airports are less likely caused by a preceding late arrival aircraft and more likely by factors that occurred at the airport itself. Therefore, while delay and delay propagation have not been completely eradicated in the NAS during the COVID-19 pandemic, Figures 5 and 6 suggest both have significantly declined on average.
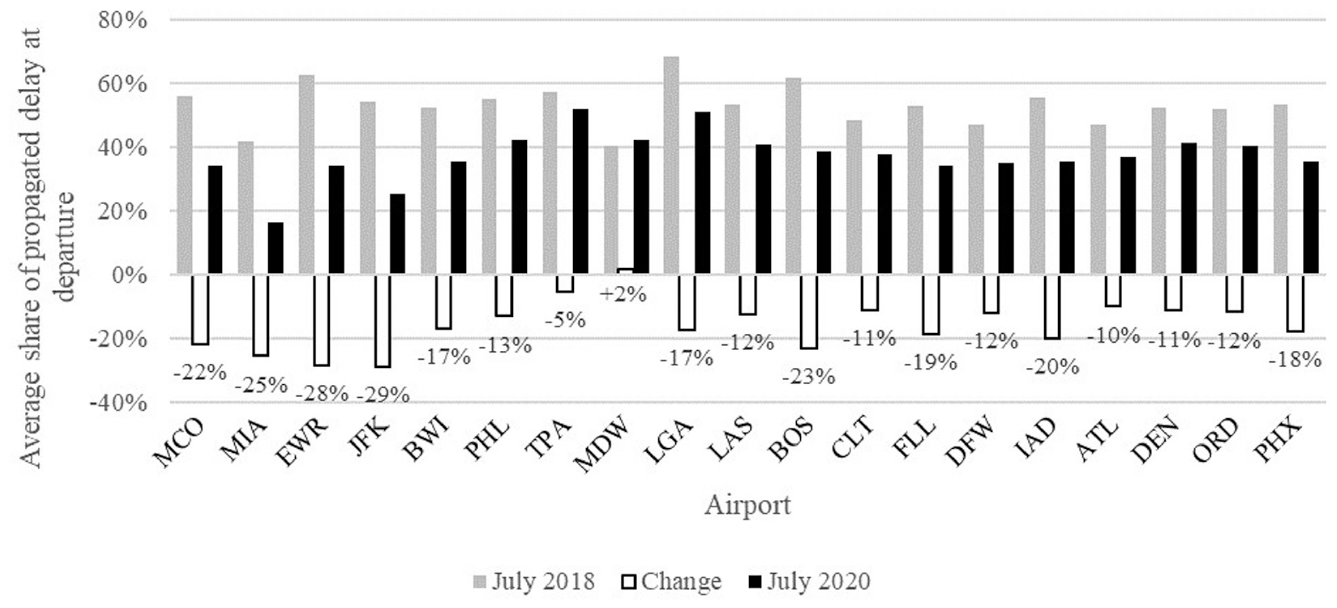
Delay propagation share: July 2018 versus July 2020.
Total Propagated Delay Fixed-Effects Model
This section presents a linear regression model, predicting total propagated delay using fixed effects based on weather region where the original delay occurred. It is based on the July 2018 data, representative of how delay propagates when the airline industry is in more of a steady state compared with the time when it was affected by COVID-19. Using unbalanced panel data of 47,260 propagation chains, each propagation chain is grouped by the originating weather regions ( 32 ). This grouping helps control for endogenous factors such as the effects of weather conditions on propagated delay by using the within-group variability to determine the effect of each predictor on total propagated delay using the fixed-effects model. Specifically, the model estimates the variable coefficients based on in-group variability in each weather region while controlling for unobserved factors (omitted variables) that are correlated with the variables included in the regression and eliminate omitted variable bias ( 33 , 34 ). Only time-varying variables are considered in the model since constant characteristics cannot explain in-group variability in total propagated delay ( 35 ).
Total propagated delay in each delay propagation chain is calculated as the sum of propagated arrival delay on downstream flights. To reduce the influence of outliers, similar to the study conducted by Kafle and Zou ( 19 ), observations with total propagated delay larger than the 75th percentile value plus 1.5 times the inter-quantile range are dropped from the dataset (9.6% of observations) resulting in an average total propagated delay of 36 min and a maximum of 174.3 min.
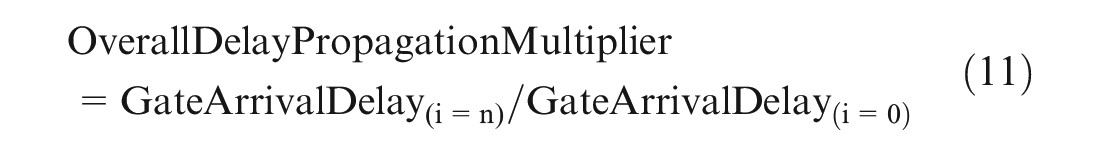
Table 1 shows the variables tested out in the model to estimate total propagated delay. Note that airport size refers to the airport where the propagation delay originated. It is possible that throughout the propagation chain, facilities experience additional original delays that can contribute to the propagated delay. The variable “Total sources” refers to this dynamic, the total number of sources of original delay within a propagation chain. The overall delay propagation multiplier follows the definition proposed by Kondo ( 6 ) and is calculated using Equation 11, where “n” indicates the last flight leg of a propagation chain:
Modeling Total Propagated Delay—Variable Definitions and Regression Estimates
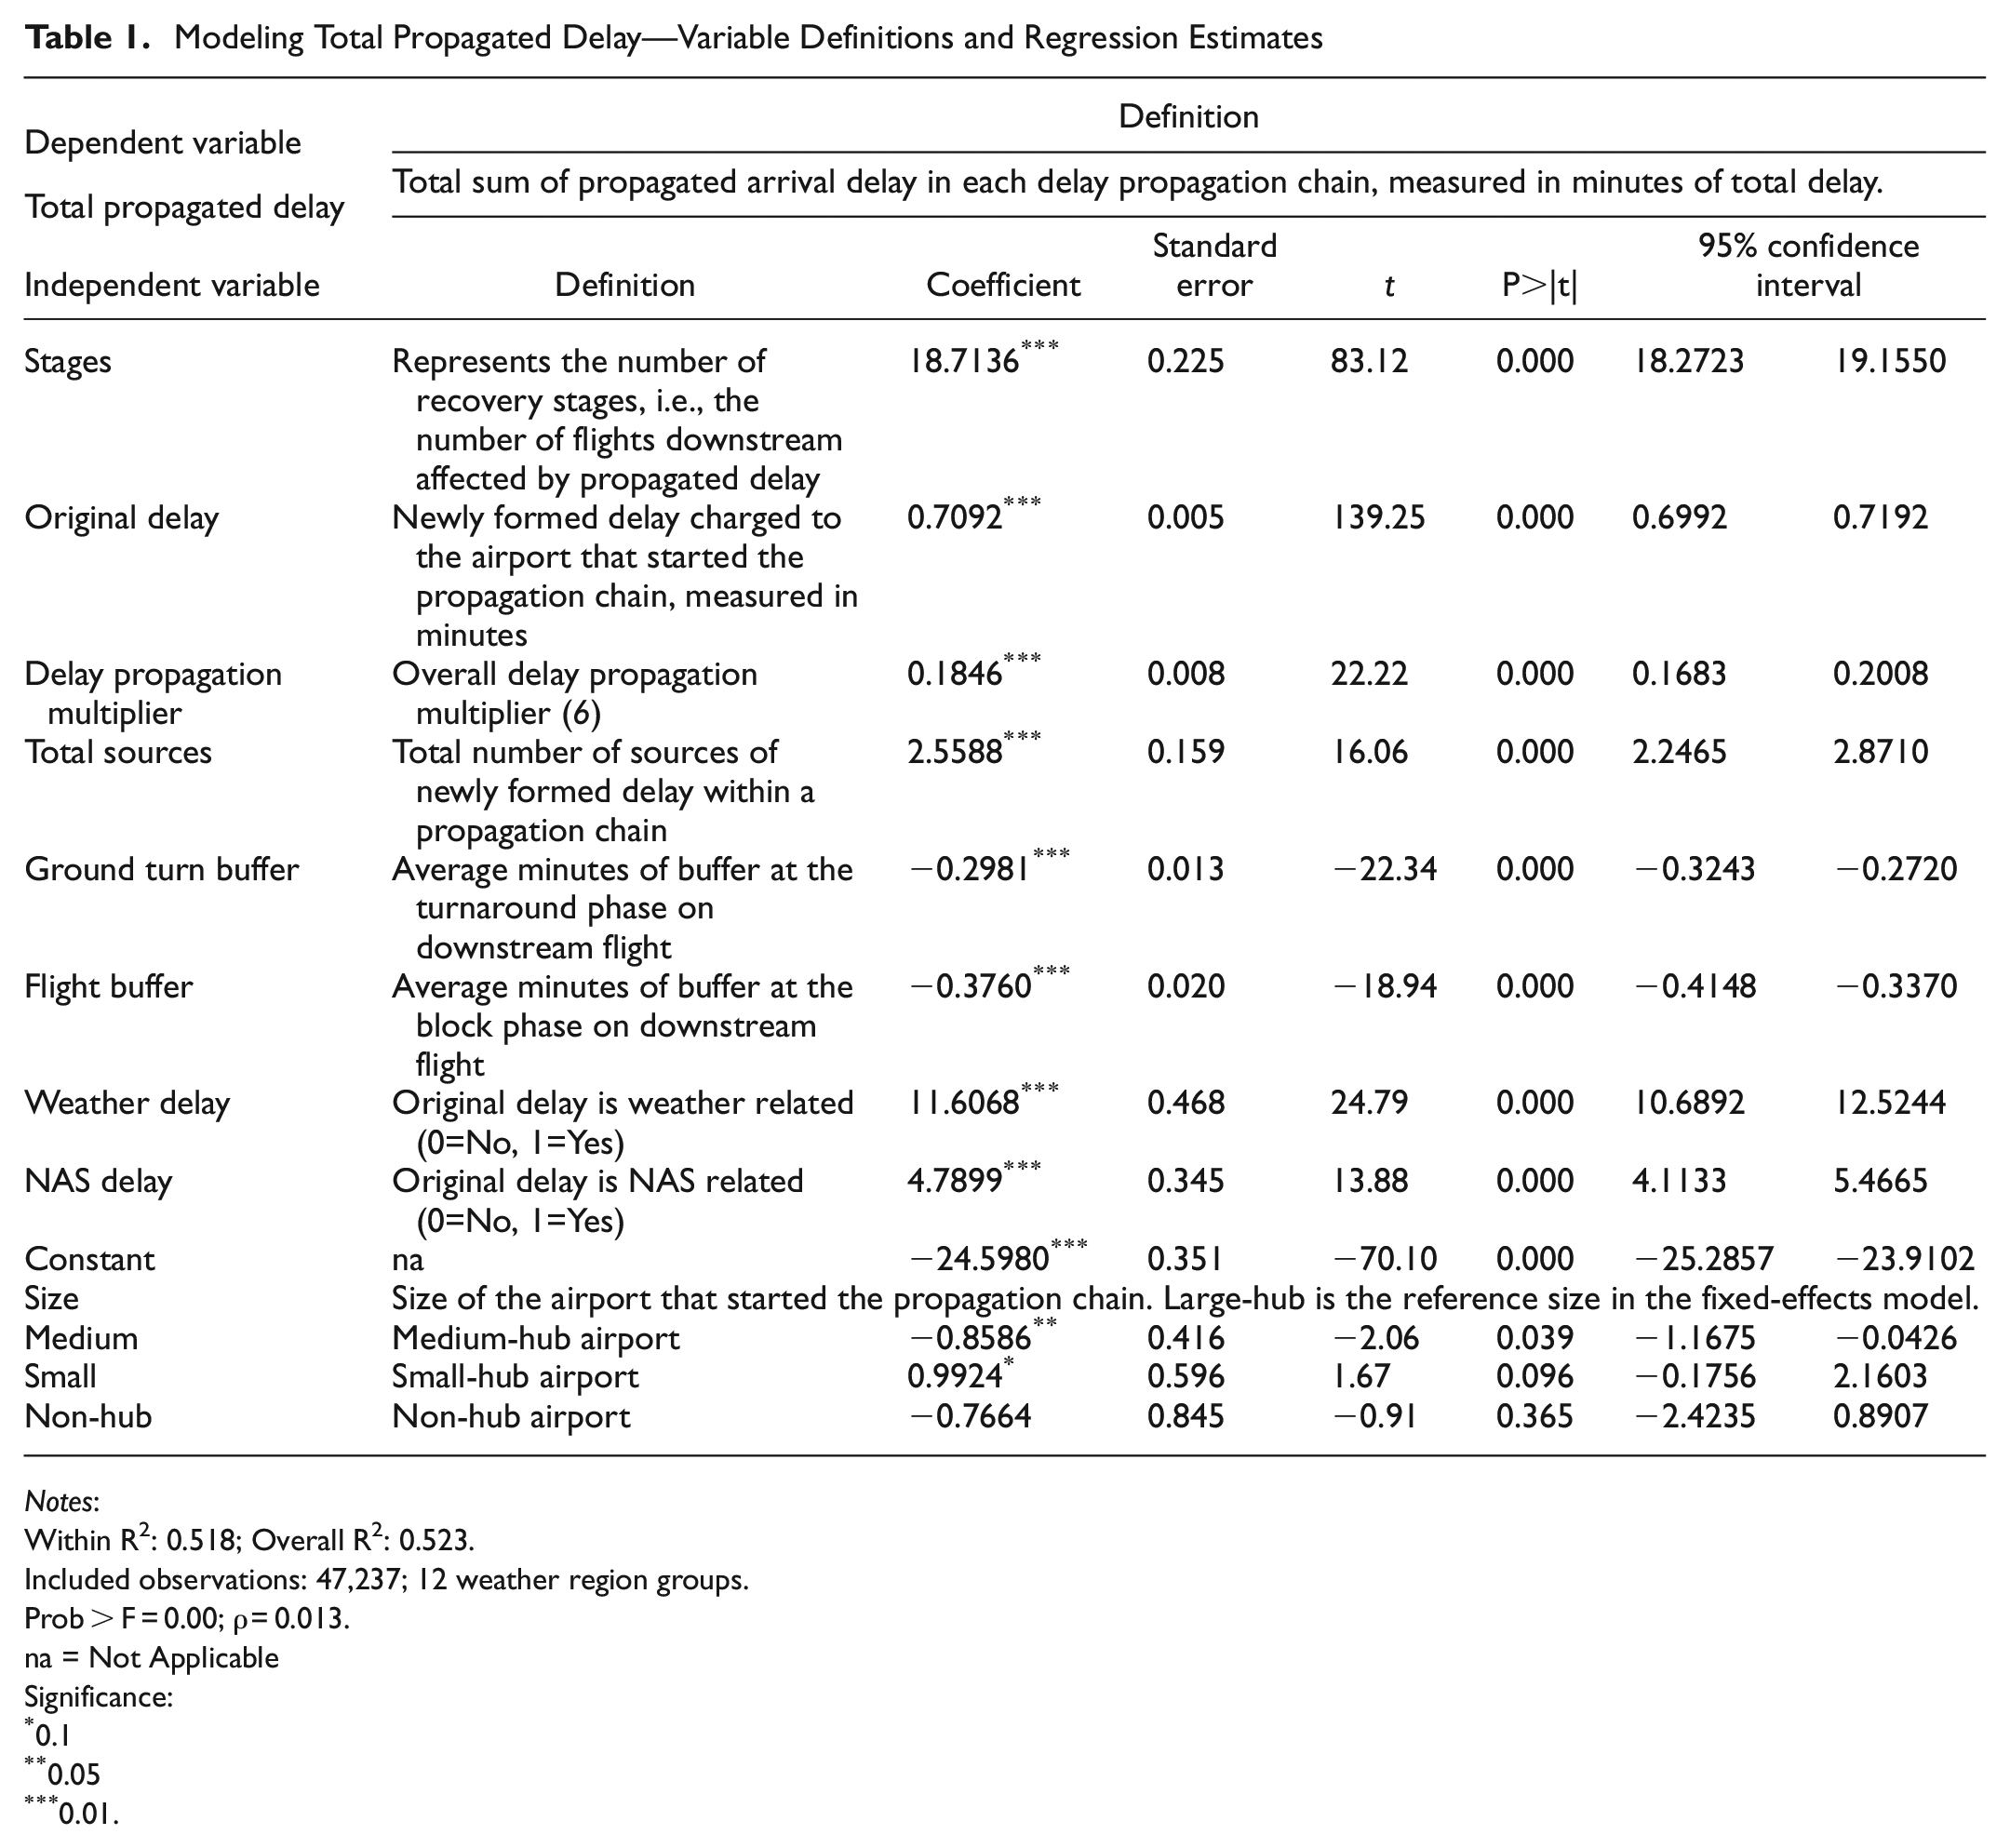
Notes:
Within R2: 0.518; Overall R2: 0.523.
Included observations: 47,237; 12 weather region groups.
Prob > F = 0.00;
na = Not Applicable
Significance:
0.1
0.05
0.01.
Furthermore, the Durbin-Wu-Hausman is a statistical hypothesis test used to differentiate between fixed-effects and random-effects models. It tests whether the null hypothesis holds true and the random-effects model is appropriate by calculating the systematic difference in coefficients between a fixed-effects and a random-effects model. The test reported a p-value of 0, and a chi-square of 225.5. Therefore, the null hypothesis can be rejected, indicating that the fixed-effects model is appropriate, and the individual-specific effects are correlated with the independent variables.
Table 1 also presents the estimation results from the fixed-effects linear regression. As shown, each additional flight affected by downstream delay adds 18.7 min on average to the total propagated arrival delay. The results also include the causal factors behind the original delay. Specifically, regression coefficients show that if weather was the cause of the original delay, total propagated delay increased by 11.6 min compared with non-weather delays. In contrast, if the NAS was the cause for the original delay, the total propagated delays increase by 4.8 min as compared with non-NAS delays. Note that other causal factors were tested in the model but were not statistically significant.
For each additional source of original delay within the propagation chain, results show an additional 2.56 min of total propagated delay and one additional minute of original delay results in an increase of 0.7 min of total propagated delay. This is consistent with the results found in Kafle and Zou ( 19 ) that the effect of original delay is greater than the effect of ground and flight buffer.
Coefficient estimates for the “Ground Turn Buffer” and “Flight Buffer” variables have a negative sign since the schedule buffer will help absorb propagated delay. Each minute of buffer during the turnaround phase decreases total propagated delay by 0.3 min while each minute of buffer during the block phase results in total propagated delay dropping by 0.38 min.
Lastly, the regression coefficients for airport size show that a propagation chain originating at a medium-hub airport will result in 0.85 min less in total propagated delay compared with propagation chains originating at large-hub airports. However, total propagated delay is expected to increase by 0.99 min if it originated at a small-hub airport compared with a large-hub airport. This is consistent with the results discussed earlier where propagation chains initiated at large-hub airports are mostly recovered within the first flight downstream and are absorbed in fewer stages. It is important to note that while airport size is a significant variable according to its p-value, it does not appear to be a main driver to delay propagation compared with the other factors tested in the model.
The correlation between the predictors was also calculated using Pearson’s correlation to identify the strength and significance of the linear relationship between them. Table 2 shows the correlation matrix for each variable tested in the model. Similarly, results show that it is not necessarily the size of the airport that affects delay propagation by magnitude, but other aspects, such as turnaround buffer, that are related to size that affect total delay propagation. For instance, Southwest Airlines is known for actively reducing its turnaround time, placing the airline at a competitive advantage but at a higher risk of experiencing delays ( 16 , 36 – 38 ).
Modeling Total Propagated Delay—Correlation Matrix
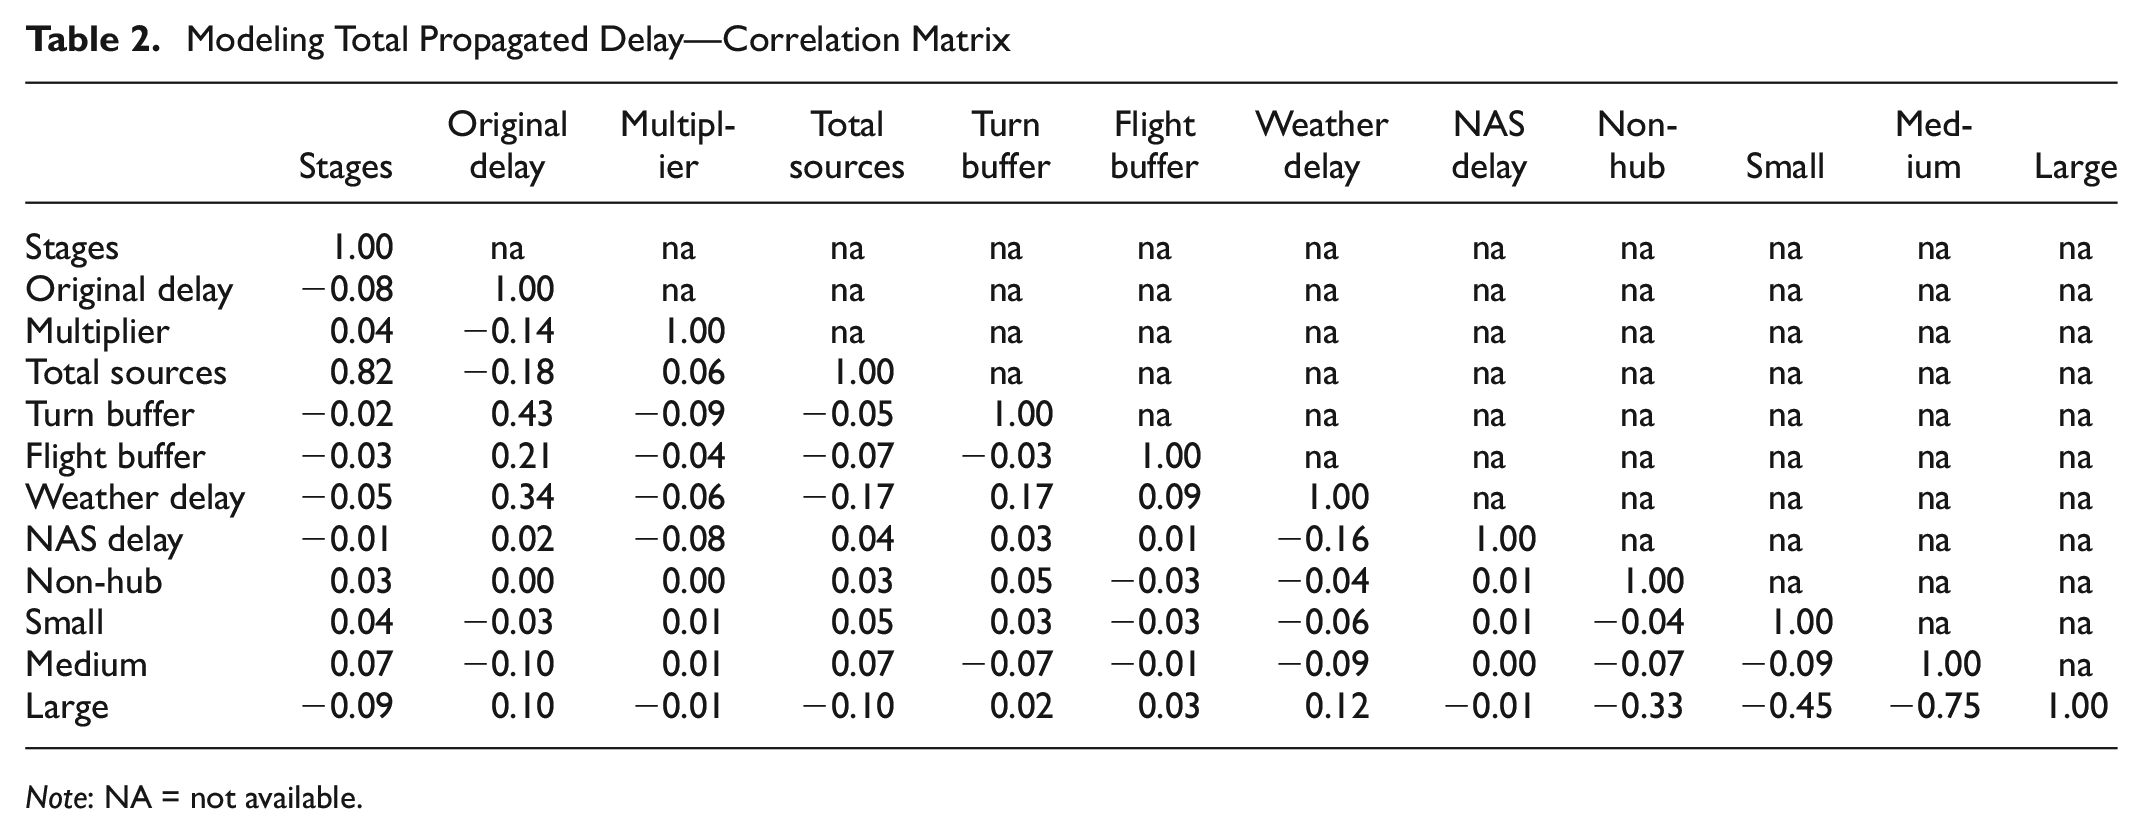
Note: NA = not available.
Conclusions
This study introduced a linear regression model, predicting total propagated delay using fixed effects based on weather region where the original delay occurred. Results show that the majority of delay propagation chains originate at large-hub airports and are mostly concentrated at airports in the Northeast and Southeast U.S. weather regions during July 2018. However, delays originating at large-hub airports were found to be the quickest to recover, as most propagation chains originating at large airports recovered within the first downstream flight.
While the size of the airport may not have the largest impact on the magnitude of delay propagation, other factors related to the airport size itself can be main drivers to the propagation phenomenon. It is suggested that airlines tend to incorporate greater schedule buffer at turnaround at large-hub airports, which results in higher delay recovery at those airports compared with smaller airports. For example, American Airlines schedules 69 min on average for the turnaround of a Boeing 738 at large-hub airports compared with 51 min for that same aircraft at small-hub airports. Furthermore, a larger share of upstream delay propagates to downstream flights when the original delay is caused by adverse weather conditions. Airport-related delays such as those reported as runway, volume, or security are more easily absorbed as they typically entail a single facility compared with a delay that affects an entire airport or carrier network.
The model and descriptive statistics estimated in this study have significant implications for future decision making and planning. First, they show that current procedures for identifying airport on-time performance through the ICAO KPIs do not robustly capture an airport’s effect on NAS delays, where an airport’s performance metrics are also based on other entities’ performance. Therefore, it is recommended that airport performance metrics use not only schedule information, but also causal information from carriers and ATM. Second, results show that not all original delays dissipate at the same rate, where it takes more flight legs to absorb a delay that originated at a small airport compared with larger airport sizes. This dynamic implies that original delays of the same magnitude do not have the same impact on the NAS.
Lastly, COVID-19 significantly reduced delay and delay propagation levels in the NAS. Overall, large airports saw a decrease in propagated delay. However, the metrics indicate that these COVID-19 impacts were not uniform across the airports. These metrics provide an indication and comparison of the resiliency of individual airports during shock events, which should be investigated further in future research on the effects of COVID-19 on the airline industry.
The authors confirm contribution to the paper as follows: study conception and design: S. Atallah, S. Hotle; data collection: S. Atallah, S. Hotle; analysis and interpretation of results: S. Atallah, S. Hotle. Author; draft manuscript preparation: S. Atallah, S. Hotle. All authors reviewed the results and approved the final version of the manuscript.
Footnotes
Acknowledgements
The authors would like to thank John Gulding for his input and support of this research.
Declaration of Conflicting Interests
The author(s) declared no potential conflicts of interest with respect to the research, authorship, and/or publication of this article.
Funding
The author(s) disclosed receipt of the following financial support for the research, authorship, and/or publication of this article: This work was funded by the Federal Aviation Administration through NEXTOR II.