



Abstract
Asphalt concrete (AC) overlays have been one of the most common treatments used by the Virginia Department of Transportation (VDOT) for maintaining/rehabilitating pavements. However, when the overlay is placed on existing composite pavements or cracked AC pavements, differential movements across any cracks or joints can result in physical tearing of the AC overlay. Thus, the long-term performance of many AC overlays will highly depend on their ability to resist cracking. The purpose of this study was to assess the viability of using high polymer-modified (HP) AC mixtures in Virginia as a crack mitigation technique or when deemed appropriate as a tool for increased resistance to rutting and cracking on higher volume facilities. Another objective was to assess the ability of various testing protocols to discern the performance of pavements through a comprehensive evaluation of three conventional polymer-modified (PMA) and five HP field-produced mixtures placed in Virginia. This included laboratory testing at multiple levels of complexity (basic, intermediate, and advanced) on collected asphalt binders, plant-produced asphalt mixtures, and field cores. The performance characteristics of PMA and HP mixes were evaluated in the laboratory in relation to durability and resistance to rutting and cracking. Based on the mixes tested, stone matrix asphalt (SMA) mixes showed better performance than dense-graded surface mixes (SM) regardless of the asphalt binder type. Moreover, HP mixes showed better performance than PMA mixes regardless of the mixture type. Overall, SMA-HP mixes showed the most promising performance among all evaluated mixes.
Keywords
Since the early 1900s, asphalt concrete (AC) mixtures have been used as driving surfaces for flexible pavements. The continuous increases in highway traffic volume, axle loads, and tire pressures have led to a greater demand for high-quality AC mixtures that can resist conflicting distresses such as permanent deformation (i.e., rutting and shoving) and cracking (e.g., fatigue, top-down, block, and reflective) while maintaining long-term durability via resistance to moisture damage and aging. To keep up with these demands, numerous technologies have been introduced over the past 50 years to modify the properties of asphalt binders to accommodate project-specific load and climatic conditions.
When pavement maintenance/rehabilitation becomes necessary, AC overlays have been one of the most common treatments used by the Virginia Department of Transportation (VDOT) for maintaining/rehabilitating aged pavements; they are flexible, composite, and rigid. However, when AC overlays are placed on an existing surface where cracks and joints are not properly repaired, differential movements across the underlying cracks or joints attributable to the combined effects of heavy wheel loads, loss of support, and temperature fluctuations result in physical tearing of the AC overlays. The penetration of water and foreign debris into these cracks accelerates the deterioration of the AC overlays and the underlying layers, causing premature failure in the structural and functional performance of a pavement. Thus, the long-term performance of many AC overlays will highly depend on their ability to resist cracking from all sources of distress. Reflective cracking is a serious challenge associated with pavement maintenance, and one way to delay reflective cracking is to increase the resistance of the overlays through enhancement of material properties ( 1 ).
Asphalt binder modification is not a new concept and has become progressively more common over the past several decades. Throughout the past 50 years, asphalt binders have been modified with various components such as polymers, ground tire rubber, chemicals (e.g., acid), and recycled engine oils to enhance the asphalt mixtures properties ( 2 ). Several state departments of transportation (DOTs) have recognized the benefits of polymer-modified AC mixtures in resisting multiple modes of load- and climate-induced distresses in flexible pavements ( 3 ). Styrene-butadiene-styrene (SBS) is a well-recognized polymer (elastomer) commonly used in asphalt mixtures because of its performance benefits and resiliency. The most commonly used SBS polymer-modified asphalt (PMA) binders (referred to here as “PMA binders”) have rarely been able to exceed a ∼3.5% SBS polymer rate because of practical issues such as mixing, storage, and workability. However, researchers at Kraton and Delft University developed a new SBS polymer structure that allowed its use in asphalt binders at much higher levels (∼7.5%) (referred to here as “high polymer [HP] binders”). These binders have shown much more elasticity, which may help mitigate some of the pavement failure modes that concern agencies ( 1 – 4 ).
In 2014, researchers at the Virginia Transportation Research Council (VTRC) initiated a study to evaluate and examine the difference in constructability, laboratory performance, and initial field performance of AC mixtures produced using HP binders compared with AC mixtures produced using conventional PMA binders ( 5 ). The work involved the construction of a trial project to compare an AC surface mix (SM) using an HP binder to one having a PMA binder (as a control). The two mixtures were used in a resurfacing pavement project placed on a milled surface in a subdivision in Northern Virginia (NOVA). The asphalt SM with the HP binder was found to be constructible without major changes in paving operations; in addition, the laboratory performance was equivalent or superior to that of the control mixture. The results were promising enough to support a wider field investigation into the use of HP binders in AC overlays as a reflective crack mitigation technique or when deemed appropriate as a tool for increased crack resistance on higher volume facilities ( 5 ). Since 2015, HP AC overlays have been placed at several sections in Virginia over jointed concrete pavements (JCP) and cracked asphalt pavements.
Background: State-of-the-Practice
In September 2019, an email-based survey of United States (U.S.) and Canadian provincial agencies was conducted to collect key information on current practices with regard to HP binders and HP AC mixtures. A total of 23 responses (22 U.S. agencies and one Canadian provincial agency) were received, with an overall response rate of 44% from the United States. This survey represented the first look at the use of HP binders and HP AC mixtures across North America ( 6 ).
Of the 22 U.S. agencies that responded to the survey, 11 indicated experience with HP binders and HP AC mixtures. This group is referred to as Group A, and included Alabama, Florida, Georgia, Iowa, Maryland, New Jersey, New York, Ohio, Vermont, Virginia, and Wisconsin. After an online search of specifications, special provisions, and field trial or pilot projects, the research team identified another 10 U.S. agencies having experience with HP binders and HP AC mixtures. This group is referred to as Group B, and included Alaska, Kentucky, Minnesota, Missouri, New Hampshire, Oklahoma, Oregon, Tennessee, Utah, and Washington. From Groups A and B, 21 agencies use or have constructed field trial and pilot projects using HP AC mixtures, as shown in Figure 1. The majority of these agencies are located in the eastern part of the United States.
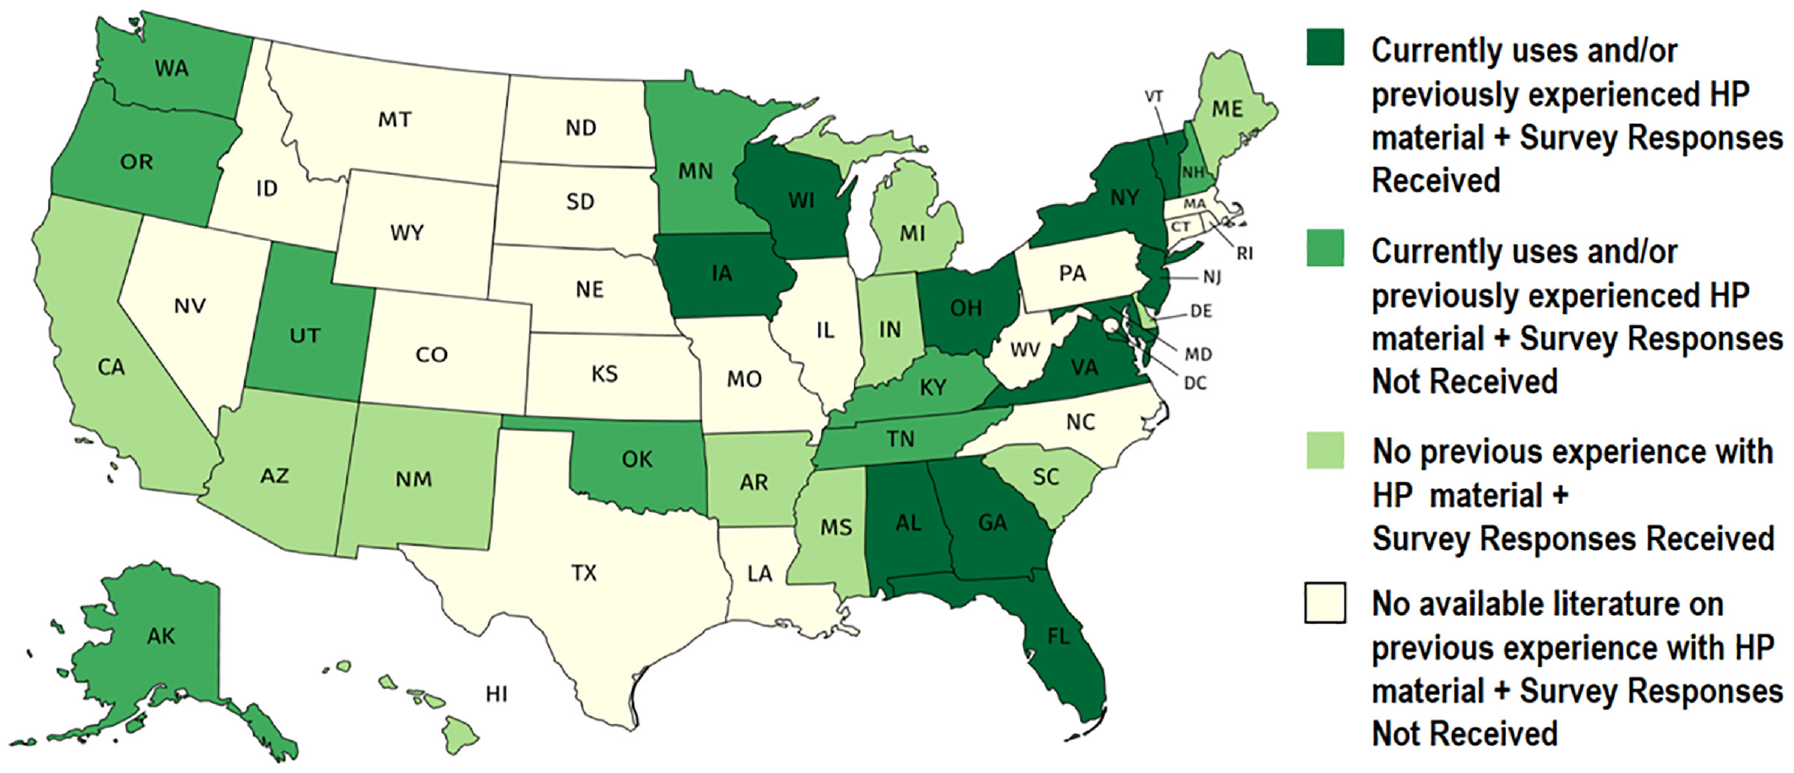
U.S. map indicating agencies’ experience status with HP AC mixtures ( 6 ).
The survey responses conveyed that the definition and acceptance of these binders are not related to the SBS polymer content but rather to specific binder rheology-related parameters and characteristics, a more performance-oriented viewpoint. Agency special provisions and specifications for properties of HP binders and AC mixtures were summarized and are available elsewhere ( 1 , 6 ). All of the special provisions and specifications rely on a very high elasticity and recovery of the produced asphalt binder to ensure a very good performance by corresponding pavements subjected to heavy, stress-concentrated, or slow-moving traffic loads. In Virginia, a neat asphalt binder with a high polymer modification (approximately 7.5% SBS polymer content by total weight of binder) has to comply with AASHTO M 322 for a PG76E-28(HP) with the exception that Multiple Stress and Creep Recovery (MSCR) must have a non-recoverable creep compliance at 3.2 kPa (Jnr3.2) maximum value of 0.1 kPa−1 when tested at 76°C according to AASHTO T 350. The minimum MSCR percentage recovery at 3.2 kPa and at 76°C has to be 90%. Moreover, the viscosity of HP asphalt binders has to be less than or equal to 3.0 Pa-s, but the engineer may increase this limit to 5.0 Pa-s if the binder supplier and contractor agree that the binder is suitably workable. HP designated mixtures must not contain more than 15% reclaimed asphalt pavement (RAP) material.
HP binders have been used in numerous applications including structural overlays (29%), functional overlays (21%), interlayers for reflective cracking mitigation (17%), bottom layers for bottom-up fatigue cracking mitigation (8%), and full-depth AC layers (8%). Multiple agencies included “Others” (17%) as part of their response: for example, Florida uses HP binders in open-graded friction course mixtures to improve their resistance to raveling; Iowa uses HP binders to produce high-performance thin-lift overlays; Maryland and Virginia use HP binders in dense-graded SMs and stone matrix asphalt (SMA) of composite pavements to mitigate reflective cracking. New Jersey uses HP binders in thin overlay mixtures, binder-rich intermediate courses, bottom-rich base courses, bridge deck waterproof surface courses, and a few of the high RAP mixtures to meet pre-established performance requirements for the produced mixtures as part of the balanced mix design (BMD) approach. New York uses HP binders to produce polymer-modified stress-absorbing membrane interlayers and waterproofing bridge deck hot-mix AC overlays; Ohio uses mostly HP AC mixtures on bridge decks and at intersections; and Wisconsin allowed the use of HP binders to produce an AC pavement interlayer that meets pre-established performance requirements. Three agencies showed interest in using HP AC mixtures to design thinner pavements (New Jersey and Virginia) or to conduct research (Georgia).
In general, the use of HP AC mixtures by these agencies showed great success in their intended use to prevent rutting and reflective cracking. Alaska (Group B) and the Newfoundland and Labrador Canadian provincial agencies introduced HP binders in AC mixtures as a novel approach to mitigating studded tire abrasion. No agencies reported any special practices or enforcements of specific safety, health, or environmental restrictions when HP binders were used in AC mixtures. Moreover, numerous factors that are likely to limit the use of HP AC pavements were identified. These factors included lack of project selection criteria (18%), lack of standard specifications (16%), lack of agency experience (16%), relatively higher price (11%), lack of engineering design procedures (7%), lack of local contractors (5%), previous unsuccessful experiences (5%), and industry reluctance to change (5%). Other additional factors (11%) were identified by several agencies and included details such as limited supply, shorter storage lifetime, lack of material expertise, and lack of cost-effectiveness information.
Objective and Scope
The purpose of this study was to assess the viability of using HP AC mixtures in Virginia as a reflective crack mitigation technique or when deemed appropriate as a tool for increased resistance to rutting and cracking on higher volume facilities. Another objective was to assess the ability of various testing protocols to discern the performance of asphalt pavements through a comprehensive evaluation of three PMA and five HP field-produced mixtures placed in Virginia. This included laboratory testing at multiple levels of complexity (basic, intermediate, and advanced) on collected asphalt binders, sampled plant-produced asphalt mixtures, and field cores collected during construction. It should be noted that throughout the evaluation of plant-produced asphalt mixtures, test specimens were compacted to the initial in-place air-void levels determined through evaluation of corresponding cores sampled from the field. This was done to ensure a more representative evaluation of the mixtures in the field as their performance characteristics remained highly dependent on the in-place density. Figure 2 illustrates a flowchart of the laboratory experimental program.
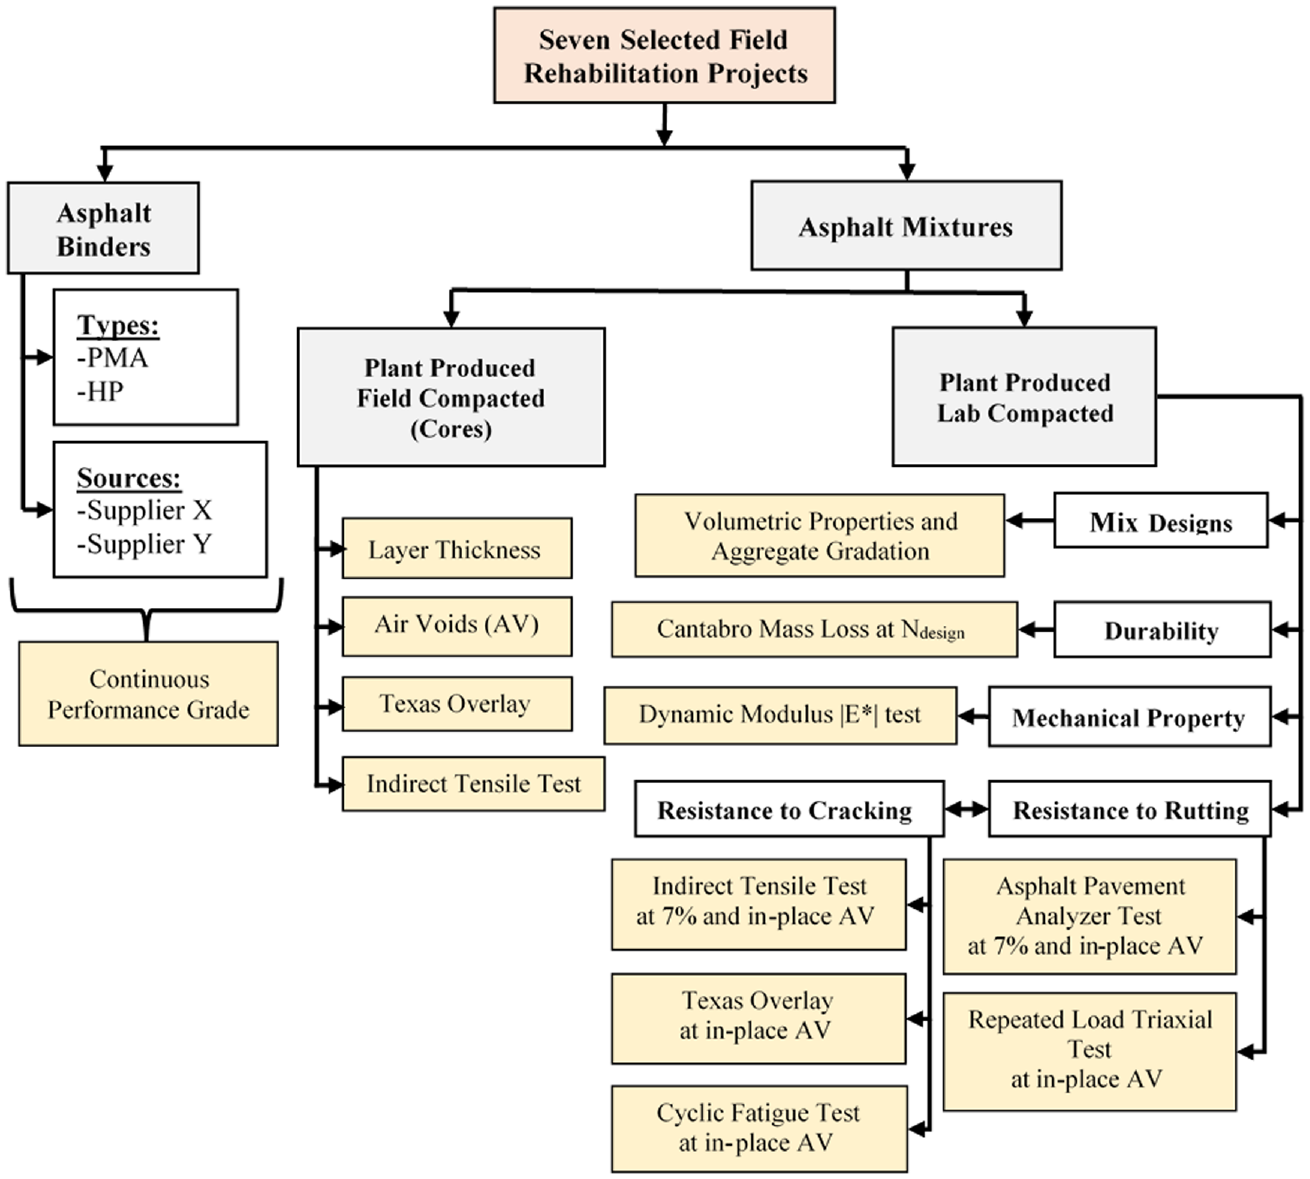
Flowchart of the experimental plan.
Field Cores
Field core samples were collected from each project during construction. Core locations were randomly stratified along the length and width of the section. The following properties were measured for each core: in-place layer thicknesses; and air voids, and the resistance to cracking by means of the Texas Overlay Test (OT) (Tex-248-F) ( 7 ) and Indirect Tensile Cracking Test (IDT-CT) (ASTM D8225-19) ( 8 ). Table 1 summarizes the in-place layer thicknesses and air-void levels. The major change noted among mixtures was that the in-place density of SMA mixtures was higher than that of SM regardless of the asphalt binder type (i.e., PMA versus HP).
Summary of In-Place Layer Thickness and Air Voids for Core Samples
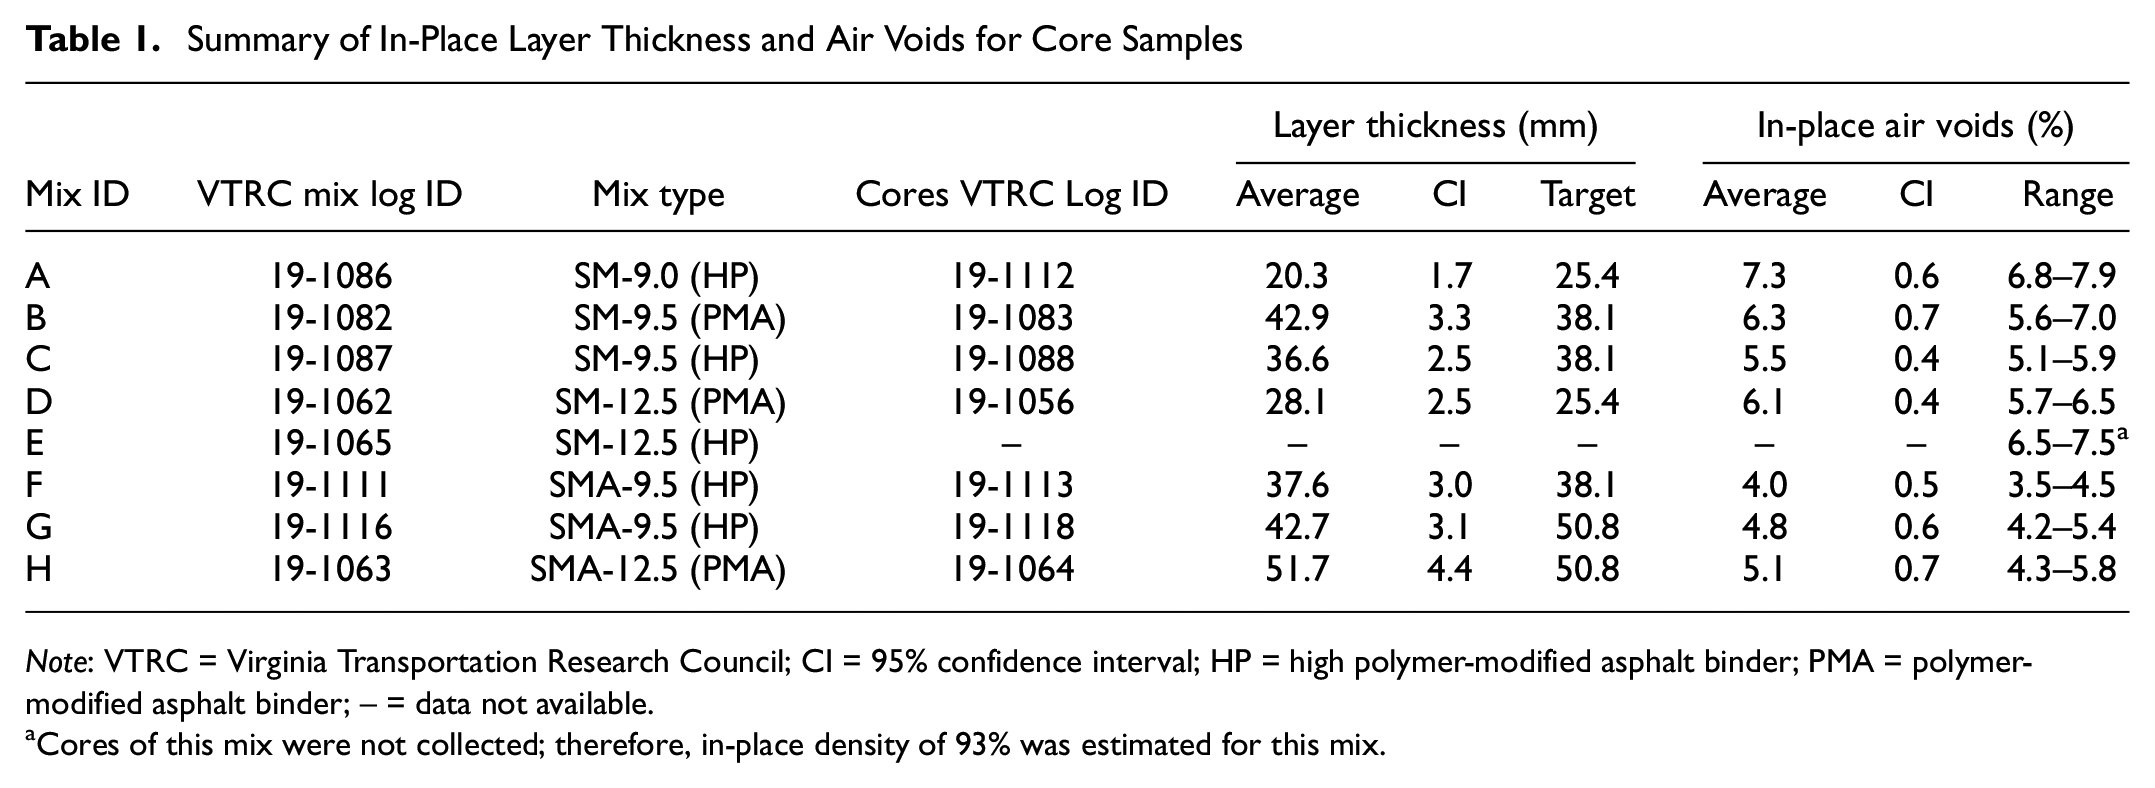
Note: VTRC = Virginia Transportation Research Council; CI = 95% confidence interval; HP = high polymer-modified asphalt binder; PMA = polymer-modified asphalt binder; – = data not available.
Cores of this mix were not collected; therefore, in-place density of 93% was estimated for this mix.
Asphalt Binder Testing
Asphalt binder grading was performed in accordance with AASHTO M 320 and AASHTO M 332. Table 2 summarizes the properties of the four evaluated asphalt binders.
Properties of Evaluated PMA and HP Asphalt Binders

Note: PMA = polymer-modified asphalt binders; HP = high polymer-modified asphalt binders; B = batch; min. = minimum; max. = maximum; – = data not available; temp. = temperature; spec. = specification.
The viscosity must be less than or equal to 3.0 Pa.s; however, the engineer may increase the viscosity limit to 5.0 Pa.s if the binder supplier and contractor agree that the binder is suitably workable.
Multiple Stress Creep Recovery (MSCR) test on RTFO residue should be performed at the PG grade based on the environmental high pavement temperature (i.e., 64°C for PMA and 76°C for HP).
Testing temperature is 10°C warmer than the actual low performance grade.
Testing was performed on original PMA and HP binders. All four binders met the corresponding VDOT specifications ( 9 ). It should be highlighted that typical HP binders show common viscosity values of 4 to 5 Pa.s in the laboratory at a testing temperature of 135°C using the rotational viscometer. These binders are still accepted in practice with no potential clogging issues when pumped (as reported by asphalt contractors) since they are mixed at a temperature much higher than 135°C (around 165°C). At that temperature, the viscosity of HP binders drops significantly to values much lower than 3 Pa.s. Although the viscosity Superpave criterion for asphalt binders was developed without the nature of such paving materials being taken into consideration, additional research is needed either to refine the testing temperature when the rotational viscosity test is conducted (i.e., 165°C instead of 135°C) or to adjust the accept/reject criterion (in this case 3 Pa.s) at 135°C for HP binders.
Asphalt Mixture Testing and Characterization
The properties of the overlying AC layer are important to the performance of the overall system. Throughout the evaluation of selected PMA and HP plant-produced AC mixtures, test specimens were compacted to the initial in-place air-void levels determined through evaluation of corresponding cores sampled from the field. This was done to ensure a more representative evaluation of the mixtures in the field as their performance characteristics remained highly dependent on the in-place density. To this extent, the performance characteristics of three PMA and five HP AC mixtures placed in Virginia during the 2018 and 2019 paving seasons (total of eight mixtures) were evaluated through a series of tests.
Volumetric Properties and Aggregate Gradations of Mixtures
Volumetric properties and aggregate gradations for the PMA and HP AC mixtures are shown in Tables 3 and 4, respectively. Mixture B and Mixture D were considered the “control” of Mixture C and Mixture E, respectively. The results in Tables 3 and 4 compared well with the quality control and acceptance data available from the producers and VDOT districts, although those data are not shown. The major change noted among mixtures was that the effective binder content of SMA mixtures was higher than that of SM regardless of the asphalt binder type (i.e., PMA versus HP), which could be attributed to the gap gradation of SMA mixes with the intent of having higher design binder contents.
Volumetric Properties for Evaluated PMA and HP AC Mixtures

Note: PMA = polymer-modified asphalt binder; HP = high polymer-modified asphalt binder; AC = asphalt concrete; SM = surface mix; SMA = stone matrix asphalt; RAP = reclaimed asphalt pavement; B = batch; Ndesign = number of Superpave design gyrations; NMAS = nominal maximum aggregate size; SG = specific gravity; VTM = voids in total mixture; VMA = voids in mineral aggregate; VFA = voids filled with asphalt; FA = fines to asphalt ratio.
Aggregate Gradations for Evaluated PMA and HP AC Mixtures

Note: PMA = polymer-modified asphalt binder; HP = high polymer-modified asphalt binder; AC = asphalt concrete; SM = surface mix; SMA = stone matrix asphalt; no. = number.
Cantabro Mass Loss
The Cantabro mass loss was determined to evaluate the durability of asphalt mixtures in accordance with AASHTO TP 108. This test has shown itself to be useful when evaluating open-graded friction course (OGFC) and dense-graded asphalt mixtures ( 10 ). The test was performed on specimens fabricated using a Superpave Gyratory Compactor (SGC) that were compacted from loose mixture collected at the plant during production. The loose mixtures were conditioned at the design compaction temperature before compaction to Ndesign gyrations. The Cantabro test specimens were 150 mm in diameter by 115 ± 5 mm in height. The test was performed by placing the specimen into an uncharged Los Angeles abrasion machine and rotating it for 300 rotations at a speed of approximately 30 rotations per minute. Three replicates were tested for each mixture, and an average mass loss was reported. Figure 3 shows the results of Cantabro mass loss for PMA and HP AC mixtures. The mean mass loss ranged between 1.6% and 9.8%, with an average coefficient of variation (COV) of 10%. As seen, HP AC mixtures exhibited lower mass loss than PMA AC mixtures. This observation can be attributed to the ductility induced with the use of high polymer content binders. Moreover, SMA mixes exhibited lower mass loss than SM regardless of the asphalt binder type (i.e., PMA versus HP) which could be attributed to the higher asphalt binder contents for SMA mixes compared with the contents of SM mixtures. Overall, SMA-HP mixtures had the lowest mass loss among all evaluated mixtures indicating a potential greater durability and resistance to abrasion when subjected to loading.
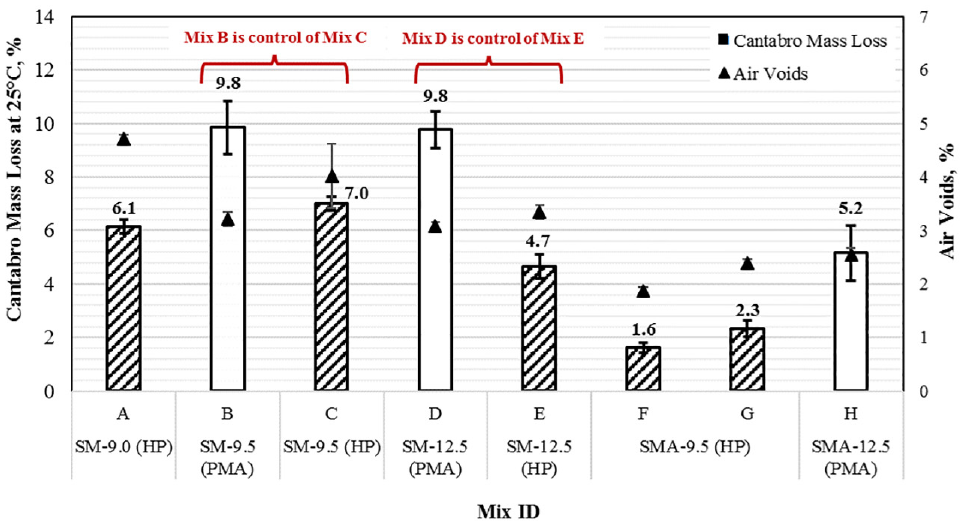
Performance test data for Cantabro mass loss of PMA and HP mixtures.
Mechanical Property: Dynamic Modulus |E*|
The dynamic modulus of specimens compacted from loose mixtures collected during production was determined using the Asphalt Mixture Performance Tester (AMPT) with a 25 to 100 kN loading capacity in accordance with AASHTO T 342. Tests were performed on specimens 100 mm in diameter by 150 mm in height cored from the center of specimens 150 mm in diameter by 175 mm in height compacted using an SGC to in-place air voids. Four testing temperatures (4.4°C, 21.1°C, 37.8°C, and 54.4°C) and six testing frequencies ranging from 0.1 to 25 Hz were used. Tests were conducted starting from the coldest temperature to the warmest temperature, and at each test temperature, the tests were performed starting from the highest to the lowest frequency. Load levels were selected in such a way that at each temperature–frequency combination, the applied strain was 75 to 125 microstrains. All tests were conducted in the uniaxial mode without confinement. Results at each temperature–frequency combination for each mixture type were reported for three replicate specimens.
The dynamic modulus (|E*|) and phase angle (δ) of the PMA and HP AC mixtures are presented in Figures 4 and 5, respectively. The data in these figures were constructed at a reference temperature of 21°C using the generalized logistic models (for both |E*| and δ data) and the polynomial shift factor. These models and the shift factor result in a better fit to the measured data compared with a conventional sigmoidal function used in the current mechanistic-empirical pavement design software ( 11 – 13 ). A higher |E*| value at higher temperatures (and lower frequencies) is often attributed to a potential higher rutting resistance of asphalt mixtures. The data in Figure 4 showed that SMA mixtures had a higher |E*| values at lower frequencies than SMs, regardless of the binder type, indicating a potential higher resistance to rutting and shoving. A higher |E*| value and lower δ at lower temperatures (and higher frequencies) is often associated with a potential higher cracking susceptibility of asphalt mixtures. All mixtures had similar |E*| values at higher frequencies. No clear trends were observed for the |E*| values among SM-PMA, SM-HP, SMA-PMA, and SMA-HP mixtures. This could be attributed to the interaction of multiple factors affecting the |E*| measurements, including nominal maximum aggregate size (NMAS) of the mixture, mineralogy and morphological characteristics of the aggregates, binder content, variability of the RAP material incorporated, and in-place air voids. It should be noted that all E* specimens were compacted to the in-place air-void range of corresponding field sections. Also, all HP and PMA mixtures included 15% RAP regardless of the type (SM versus SMA).

Dynamic modulus |E*| master curves for PMA and HP AC mixtures: (a) SM and (b) SMA.
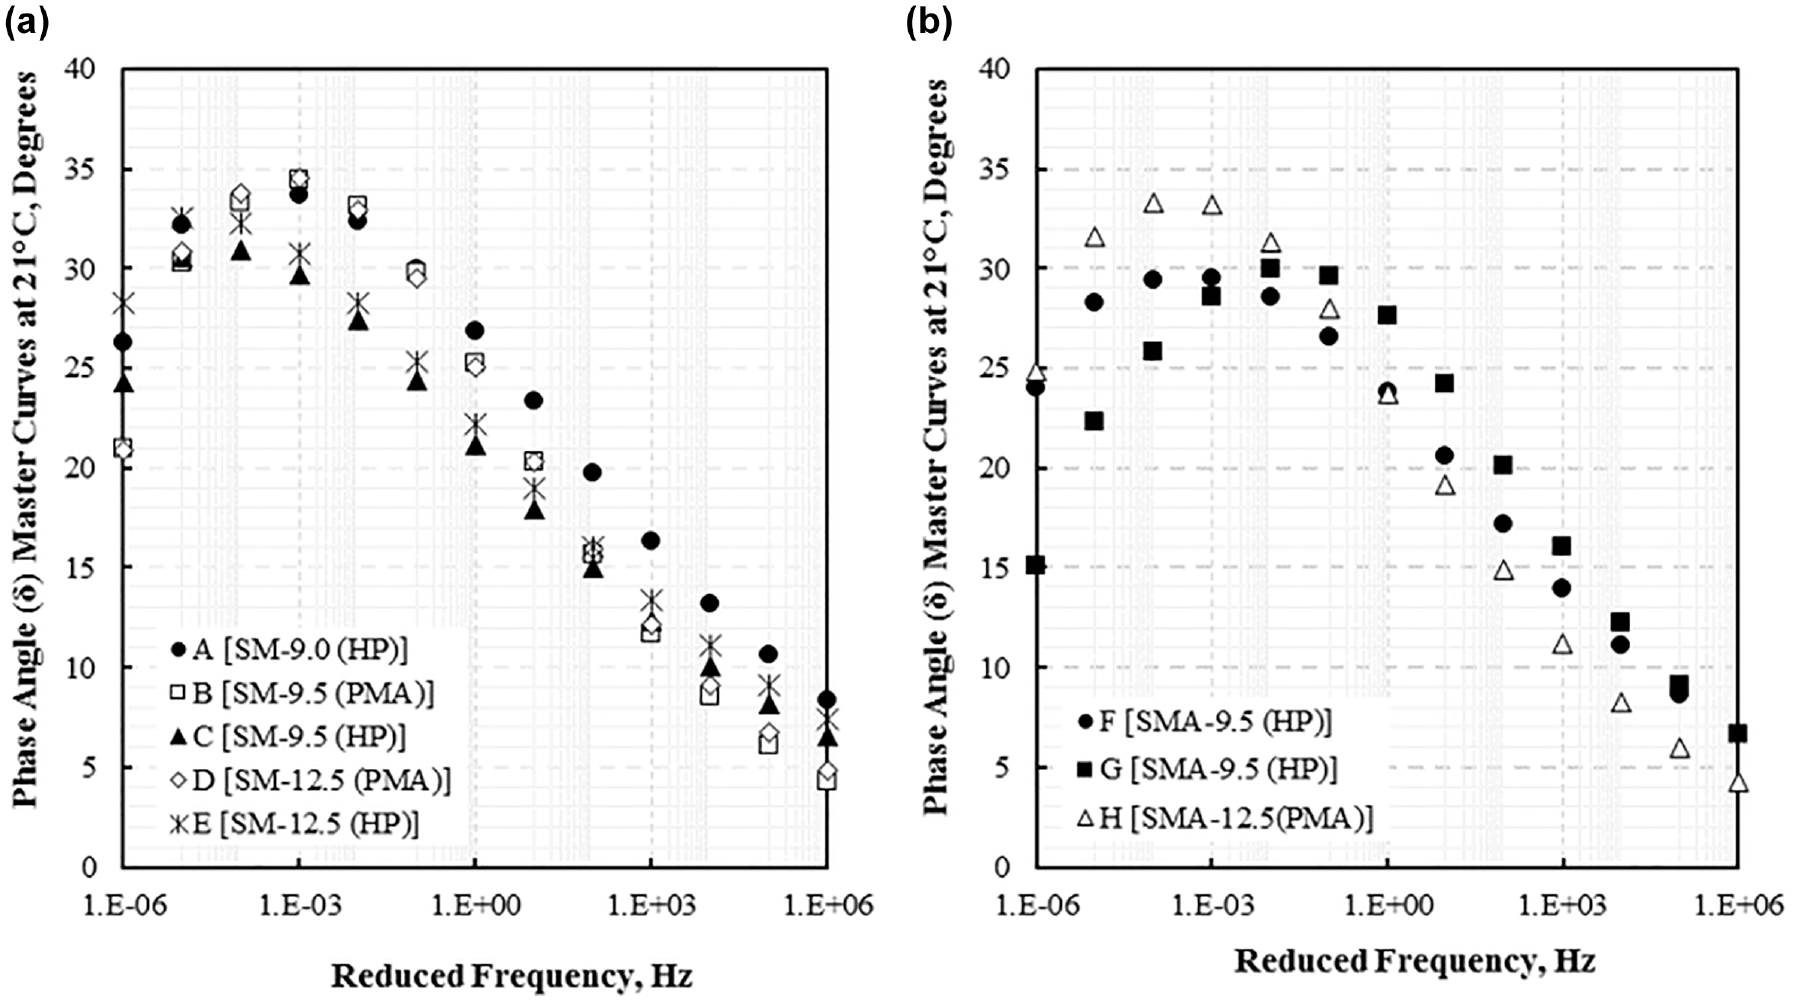
Phase angle (δ) master curves for PMA and HP AC mixtures: (a) SM and (b) SMA.
Figure 5 shows that the majority of HP mixtures had lower δ values than did the PMA mixtures, indicating the potential for higher cracking resistance among the six mixtures. Overall, SMA-HP mixtures had the highest |E*| at high temperature and the lowest δ values across the loading spectrum, indicating a promising performance of this type of mixture at low, intermediate, and high temperatures.
Rutting Performance
Two performance tests were considered to assess the resistance of PMA and HP AC mixtures to rutting. These tests belong to two levels of testing: intermediate and advanced. The intermediate level included the asphalt pavement analyzer (APA) rut test that needs longer times for specimens’ preparation and testing. The advanced level featured the repeated load triaxial (RLT) test that requires more specimen preparation and test/analysis time including cutting and/or coring to prepare the specimens as well as multiple days to be able to complete and analyze the test results.
APA Rut Test
The APA rut test was performed on specimens prepared from loose mixture collected during construction in accordance with AASHTO T 340. This test simulates rutting in the laboratory by applying a loaded wheel back and forth over a pressurized rubber tube located along the surface of the test specimen at a temperature of 64°C. After 8,000 cycles were applied, the deformation of the specimen was measured. The APA rut test was performed on specimens 150 mm in diameter by 75 ± 2 mm in height compacted using an SGC to in-place and 7 ± 0.5% air voids. Figure 6 shows the APA rut depths measured after application of 8,000 loading cycles at 64°C for all PMA and HP AC mixtures. Two sets of specimens were considered for the APA rut test; Set I included specimens compacted to the in-place air-void range (refer to Table 1) and Set II included specimens compacted to 7.0 ± 0.5% air-void level as per AASHTO T 340. The mean APA rut depths of Set I ranged between 1.2 and 4.7 mm, with an average COV of 9.2%. Meanwhile, relatively greater mean APA rut depths ranging between 2.6 and 6.0 mm, with an average COV of 16.7% were observed for Set II. The specimens of Set I were compacted to an air-void level relatively lower than the specimens of Set II, indicating a decrease in the APA rut depth with the decrease in specimen air-void level as expected. Overall, HP mixes exhibited less rutting than did PMA mixes regardless of the mix type (i.e., SM versus SMA), which can be attributed to the high polymer modification. Moreover, SMA-HP mixes exhibited the lowest rut depth among all evaluated mixtures, indicating a promising rutting performance of this mix type at high temperature and/or under heavy/slow traffic.

Performance test data for APA rut depth at 64°C and 8,000 loading cycles of PMA and HP mixtures.
Repeated Load Triaxial Test
The rutting characteristics of specimens prepared from loose mixture collected during construction were evaluated using the RLT test in accordance with NCHRP project 719 ( 14 ). The RLT test specimens were 100 mm in diameter by 150 mm in height and were cored from the center of an SGC specimen 150 mm in diameter by 175 mm in height. All test specimens were compacted to in-place air voids. The RLT test was conducted by applying a repeated deviator stress of 482 kPa, a static confining pressure of 69 kPa, and a contact stress of 24 kPa. The deviator stress was applied through a pulse load with repeated loading and unloading periods. Each loading cycle consisted of 0.1 s of loading followed by a rest period of 0.9 s. The axial deformation after each pulse was measured, and the axial resilient strain (εr) was calculated. In addition, the cumulative permanent strain (εp) was calculated. The RLT test was conducted at 54.4°C. The Franken model, expressed in Equation 1, was used to model numerically the permanent strain-loading cycle relationship. This well-suited mathematical model combines a power model, which characterizes the primary and secondary stages, and an exponential model, which fits the tertiary stage. The flow number (FN) is the number of cycles corresponding to the inflection point at which the second derivative of ε p is equal to zero.

where ε(N) = the permanent axial strain expressed in mm/mm, N = the number of loading cycles, and A, B, C, and D = regression constants.
Figure 7 shows the rutting relationship at 54.4°C for all PMA and HP AC mixtures. The rutting relationship was defined as the resulting cumulative permanent axial strain (ε p ) over the resilient strain (ε r ) function of the number of load repetitions (N). The rutting characteristic (i.e., ε p /ε r versus N) indicates the response of the asphalt mixture to repeated loading at high temperature. A lower characteristic indicates lower accumulated permanent strains with loading, thus indicating a better resistance to rutting. Further, a flatter curve indicates a lower susceptibility of the asphalt mixtures to rutting by repeated loading. It should be noted that the test has been proven to be sensitive to the air-void level of the asphalt mixtures where, in general, a better resistance to rutting is expected with the decrease in air-void level, to a certain minimum value. Table 5 summarizes the FN values, ε p , at the number of cycles corresponding to FN (εp at FN) and the FN index, defined as the ratio between εp at FN and FN expressed as a percentage ( 15 ).
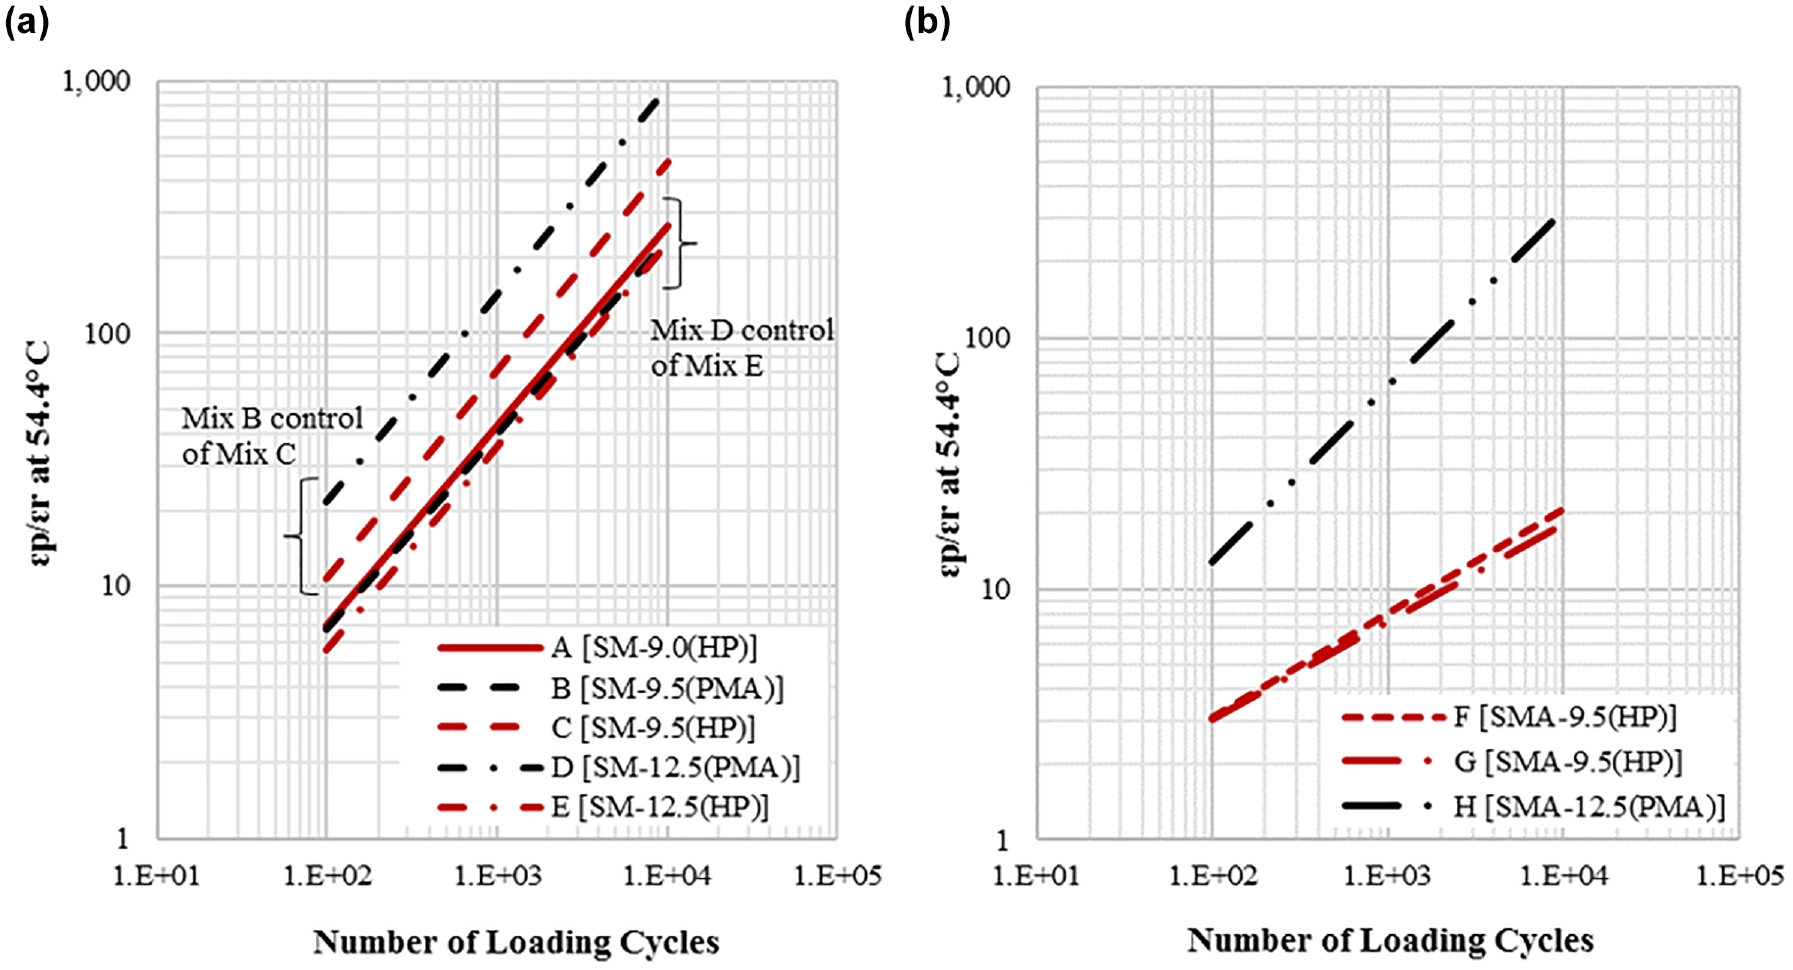
Rutting characteristic at 54.4°C for PMA and HP AC mixtures: (a) SM and (b) SMA.
Summary of Rutting Performance for Evaluated PMA and HP AC Mixtures

Note: PMA = polymer-modified asphalt binders; HP = high polymer-modified asphalt binders; AC = asphalt concrete; SM = surface mix; SMA = stone matrix asphalt; FN = flow number.
Based on the data presented in Figure 7, HP AC mixes exhibited lower rutting relationships when compared with their PMA control AC mixes regardless of the mix type (SM versus SMA), indicating a better rutting resistance, which can be attributed to the impact of high polymer modification. Moreover, SMA mixes showed lower and flatter rutting curves when compared with SM regardless of the asphalt binder type (PMA versus HP). Overall, SMA-HP mixes showed the lowest and flattest rutting curves among all evaluated mixes indicating a very promising rutting resistance during the life of the pavement.
A significant difference in the laboratory rutting resistance among asphalt mixtures will not necessarily translate into the same difference in rutting performance of the AC pavement in the field. Many factors may highly affect the rutting life of an AC pavement, such as stiffness, the developed compressive strain in each of the AC sub-layers under field loading, the rutting characteristic of the evaluated asphalt mixture, and the interaction of all these factors. In a mechanistic pavement analysis, an AC layer with higher stiffness and lower laboratory rutting life (i.e., PMA AC mixes when compared with HP AC mixes) may experience lower compressive strains in the AC sub-layers under field loading conditions and result in a better pavement rutting life. Therefore, a full mechanistic analysis coupled with laboratory-measured engineering and performance properties would be necessary to quantify and effectively evaluate the impact of HP binder on the rutting performance of the corresponding AC pavement.
Cracking Performance
Three performance tests were considered to assess the resistance of PMA and HP AC mixtures to cracking. These tests belong to three levels of testing: basic, intermediate, and advanced. The basic level included the IDT-CT characterized by a short time for the specimen preparation and testing without requiring any specific cutting, coring, and gluing. The intermediate level included the Texas OT that needs longer times for specimens’ preparation and testing. The advanced level featured the direct tension cyclic fatigue test that requires operations of cutting and/or coring to prepare the specimens as well as multiple days to be able to complete and analyze the test results.
Indirect Tensile Test
IDT-CT was conducted at 25°C on specimens prepared from loose mixture collected during construction in accordance with ASTM D8225-19 at a loading rate of 50 ± 2 mm/min. Two sets of specimens were considered for the IDT-CT; Set I included specimens compacted to the in-place air-void range (refer to Table 1) and Set II included specimens compacted to 7.0 ± 0.5% air-void level as per ASTM D8225-19. The cracking tolerance index (CT index) and the fracture strain tolerance (FST) were then calculated from the load–displacement curve of the test using Equations 2 and 4, respectively. Previous studies have shown that these indices are highly correlated, with some showing a better repeatability of characteristics and performance discrimination potential among asphalt mixtures ( 16 , 17 ). It should be noted that as part of the BMD initiative in Virginia, VDOT is currently evaluating the use of the IDT-CT index to assess the resistance to cracking of asphalt SMs subjected to a relatively lower traffic level (i.e., <10 million equivalent single axle loads [ESALs]) when compared with the ones evaluated in this effort (>10 million ESALs).




where
Gf = total area under the load–displacement curve divided by the product of the specimen thickness (t) and diameter (D) in kN/mm,
m 75 = slope of interest expressed in Equation 3,
p 85 = 85% of the peak load (Pmax) at the post-peak stage in kN,
p 75 = 75% of Pmax at the post-peak stage in kN,
p 65 = 65% of Pmax at the post-peak stage in kN,
l 85 = displacement corresponding to p85 in mm,
l 75 = displacement corresponding to p75 in mm,
l 65 = displacement corresponding to p65 in mm,
St = indirect tensile strength expressed in Equation 5 in kPa,
D = specimen diameter in mm, and
t = specimen thickness in mm.
Figures 8 and 9 show the results of CT and FST indices for all PMA and HP AC mixtures, respectively. The data presented in these figures did not include any outliers. The Dixon Q outlier test ( 18 ) was performed at a significance level of 5% on both indices to identify and remove outlier(s) from the data sets. The CT index and FST values are indicators of cracking performance for asphalt mixtures. Higher CT index and FST values generally indicate a better cracking resistance of the evaluated mixture and, therefore, less cracking potential in the field. The mean (i.e., average) CT index of Set I ranged from 21 to 583, with a COV ranging from 14.3% to 43.1%. For Set II, mean CT index values were similar, ranging from 31 to 610 with a COV ranging from 11.2% to 32.0%. The mean FST for Set I ranged from 5.2 to 14.8 with a COV ranging from 1.4 to 9.5%. For Set II, the mean FST values were similar, ranging from 6.1 to 15.8 with a COV ranging from 1.9% to 7.5%. It should be remembered that the specimens of Set I were compacted to an air-void level relatively lower than the specimens of Set II. Overall, the CT index showed a significantly greater variability when compared with the FST, which could be attributed to the calculation of a slope as part of the CT index ( 17 ).
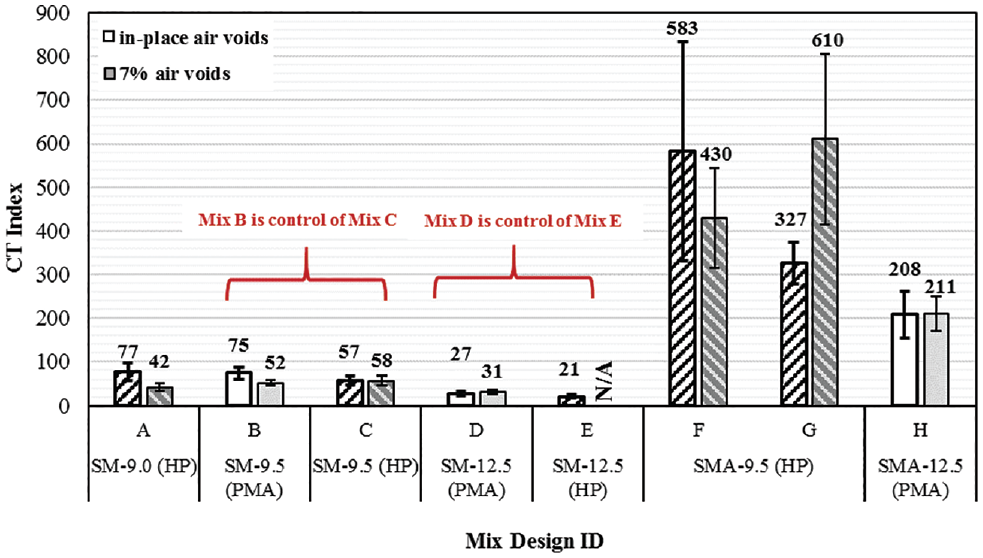
Performance test data for IDT-CT index of PMA and HP mixtures at 25°C.

Performance test data for IDT FST of PMA and HP mixtures at 25°C.
For VDOT practices, there are currently no pass/fail criteria for the CT or FST index when PMA and HP mixtures are evaluated. It is evident from Figures 8 and 9 that the differences in the magnitude of CT index and FST values between SMs and SMA mixtures were large and unexpectedly high regardless of asphalt binder type (i.e., PMA versus HP). SMA mixtures had much higher CT index and FST values when compared with those of SMs. However, as noted in ASTM D8225-19, the range for an acceptable CT index value is highly dependent on mixture type and associated specific application. Therefore, a quantitative evaluation of cracking performance should be performed only among mixtures of the same type (i.e., SM versus SMA). The SM-PMA and SM-HP mixtures had statistically similar CT index and FST values, indicating that the IDT test could not detect the expected impact of high polymer modification in improving the cracking resistance of SMs. The SMA-HP mixtures had statistically greater CT index and FST values when compared with those of SMA-PMA mixtures, indicating a better resistance to cracking, which could be attributed to the compatibility of the expansion effect of polymers in HP binders and the differences in volumetric properties and aggregate gradation characteristics of SMA mixtures. Overall, SMA-HP mixtures indicated the most promising cracking performance among all evaluated mixtures based on laboratory testing.
Previous studies also showed numerous limitations of using the IDT test and its associated indices to evaluate the cracking performance of asphalt mixtures ( 17 , 19 ). These limitations included the lack of sensitivity to air-void level and stiffness. Although higher densities of pavements would result in better cracking performance, CT index values were higher with the increase in air-void level regardless of the asphalt mixture and binder type. Moreover, the use of higher RAP contents would result in a decrease of the cracking performance life for pavements. However, for a given design, mixtures with higher RAP contents had greater CT index and FST values regardless of binder type. In this study, the IDT test had inconsistent results when the impact of high polymer modification on the cracking performance of SMs and SMA mixtures was evaluated. Although various factors including the differences in mixture compositions could have led to such inconsistent results, it is expected that mixtures with a higher polymer content would be more resistant to cracking ( 2 , 3 ). Future efforts should be considered by VDOT to assess the feasibility of using the IDT test at intermediate temperatures to evaluate the cracking resistance of PMA and HP mixtures.
Texas Overlay Test
The OT was performed on field cores obtained from the field and on specimens prepared from loose mixture collected during production in accordance with Tex-248-F ( 7 ) procedure to evaluate the mixtures’ resistance to reflective cracking. The horizontal opening and closing of joints and cracks that exist underneath a new AC overlay were specifically simulated. The OT fixture was designed to increase the functionality of the AMPT by enabling it to determine the reflective cracking susceptibility of asphalt mixtures. The OT specimens were 150 mm long by 75 mm wide by 37.5 mm thick and were trimmed from SGC samples 150 mm in diameter by 115 mm in height that were compacted to in-place air voids. Once prepared, each OT specimen was glued on two metallic plates, well fixed on a mounting wide plate using epoxy. The test was conducted in a controlled displacement mode at a loading rate of 1 cycle per 10 s with a maximum displacement of 0.6350 mm at 25 ± 0.5°C. Each cycle consisted of 5 s of loading and 5 s of unloading. The number of cycles to failure was defined as the number of cycles to reach a 93% drop in initial load, which is measured from the first opening cycle. If a 93% reduction in initial load is not reached within a certain specified number of cycles (5,000), the test stops automatically.
A power function defined in Equation 6 was used to fit the load reduction curve function of the number of loading cycles to determine the crack propagation rate (CPR) ( 20 ). The critical fracture energy (Gc) at the maximum peak load of the first loading cycle was determined using Equation 7. Gc was considered the energy required to initiating crack.


where
NL = normalized crack driving force or load at each loading cycle in kN,
N = number of loading cycles,
CPR = crack propagation rate,
Gc = critical fracture energy in kN-mm2,
Wc = fracture area at the maximum peak load of the first loading cycle,
b = specimen width, that is, 76.2 mm, and
h = specimen height, that is, 38.1 mm.
Figure 10 shows the number of cycles at 25°C at which each evaluated AC mixture reached a 93% reduction in initial load. A higher number of OT cycles to failure indicates a better resistance to reflective cracking. Specimens compacted to an in-place air-void range were evaluated only by the OT. In general, confounding effects of asphalt binder type (PMA versus HP) and other factors such as morphological characteristics of aggregates had a significant impact on the reflective cracking behavior of the evaluated AC mixtures. For all HP AC mixtures, a similar or greater number of OT cycles to failure were observed when compared with the respective PMA AC control mixtures regardless of the mixture type (SM versus SMA), thus indicating an increased flexibility and resistance to reflective cracking of the HP AC mixtures under different environmental conditions. In addition, a significantly greater number of OT cycles to failure were observed for SMA mixtures. Further, SMA-HP mixtures had the greatest number of OT cycles to failure among all evaluated AC mixtures.

Performance test data for OT of PMA and HP mixtures at 25°C.
The OT data were further analyzed to quantify the resistance of the evaluated mixtures to cracking initiation and cracking propagation in accordance with the approach of Garcia et al. ( 20 ). The crack initiation is represented and evaluated using the critical fracture energy (Gc), and the resistance to cracking during the propagation of the crack is evaluated using the CPR. A greater Gc value indicates that the evaluated AC mixture is tough and requires high initial energy to initiate a crack. On the other hand, a greater CPR value indicates that the evaluated AC mixture is more susceptible to cracking (a fast crack propagation indicates a shorter reflective cracking life). Figure 11 shows a design interaction graph plotting Gc versus CPR of all PMA and HP AC mixtures. Four categories were identified on this interaction plot:
Tough–crack resistant: simulating a good resistance in both crack initiation (i.e., higher Gc values) and crack propagation (flexible or crack resistant) (i.e., lower CPR values).
Tough–crack susceptible: simulating a good resistance in crack initiation (i.e., higher Gc values) but susceptible to crack propagation (brittle) (i.e., higher CPR values).
Soft–crack resistant: simulating softness and susceptibility to crack initiation (i.e., lower Gc values) but slowing down the propagation of the crack (flexible) (i.e., lower CPR values).
Soft–crack susceptible: simulating a significantly poor resistance to both crack initiation (i.e., lower Gc values) and crack propagation (brittle) (i.e., higher CPR values).
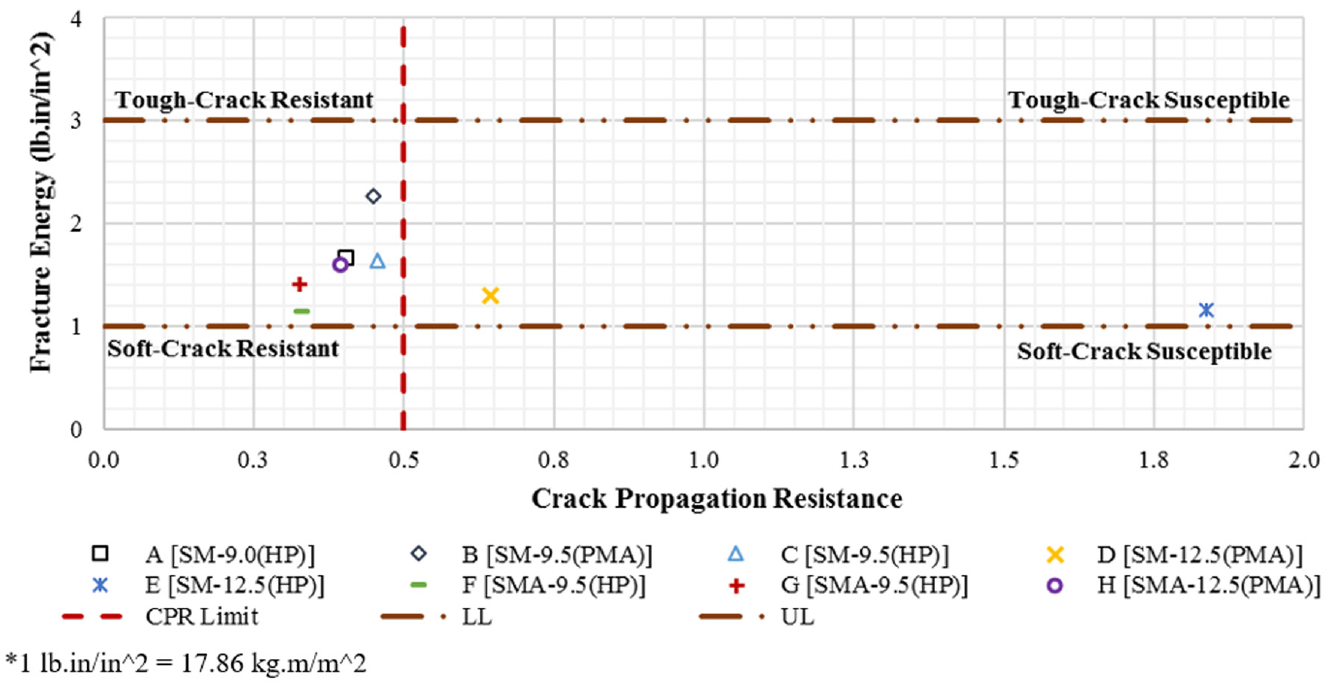
Cracking resistance interaction plot for PMA and HP AC mixtures.
A preliminary threshold for a CPR of 0.5 was proposed ( 20 ). Moreover, preliminary limits for the Gc were identified: an upper limit of 3 to screen the evaluated AC mixtures with high brittleness potential and a lower limit of 1 to guarantee a minimum stability under traffic of the evaluated mixtures. It should be noted that these thresholds were used for comparison purposes only. Independent efforts should consider defining new thresholds specifically for PMA and HP AC mixtures. As seen in Figure 11, all mixtures except Mixtures D and E had a CPR value lower than 0.5, indicating good cracking resistance. Moreover, all mixtures had a Gc from 1 to 3, indicating good resistance to crack initiation. SMA-HP mixtures (Mixtures F and G) showed the most soft–crack-resistant behavior among evaluated mixtures, and Mixture D showed the most soft–crack-susceptible behavior.
Direct Tension Cyclic Fatigue
The simplified viscoelastic continuum damage test, known as the direct tension cyclic fatigue test, was performed using the AMPT in accordance with AASHTO TP 107. The cyclic fatigue test was performed on specimens 100 mm in diameter by 130 mm in height cored from samples 150 mm in diameter by 175 mm in height compacted from loose mixtures collected during construction. All test specimens were compacted to in-place air voids. The developed damage characteristic curves were then used with the viscoelastic material properties (i.e., |E*|) to obtain the fatigue behavior of the asphalt mixtures. To define the asphalt mixtures’ fatigue performance, a fatigue cracking index parameter, referred to as apparent damage capacity (Sapp), is usually used. The calculation of Sapp was conducted with FlexMAT for Cracking, an Excel-based tool provided by the Federal Highway Administration (FHWA) ( 21 ).
Figure 12 shows the fatigue characteristics at 25°C of all PMA and HP AC mixtures. A fatigue characteristic for each mixture was developed by fitting a power regression function between the number of cycles to failure and the applied strain levels. A higher and flatter fatigue curve indicates a better resistance to fatigue cracking. Fatigue performance was better for the HP AC mixtures than for the PMA AC mixtures at all strain levels, thus indicating increased flexibility under different environmental conditions regardless of the mixture type (SM versus SMA). The noticeably better fatigue performance for HP AC mixtures can be mainly attributed to the dominant behavior of the additional polymer. Fatigue performance was better for SMA mixtures than for SMs regardless of the binder type (PMA versus HP). However, a difference in the laboratory fatigue resistance will not necessarily translate into the same difference in fatigue performance of the AC pavement in the field.
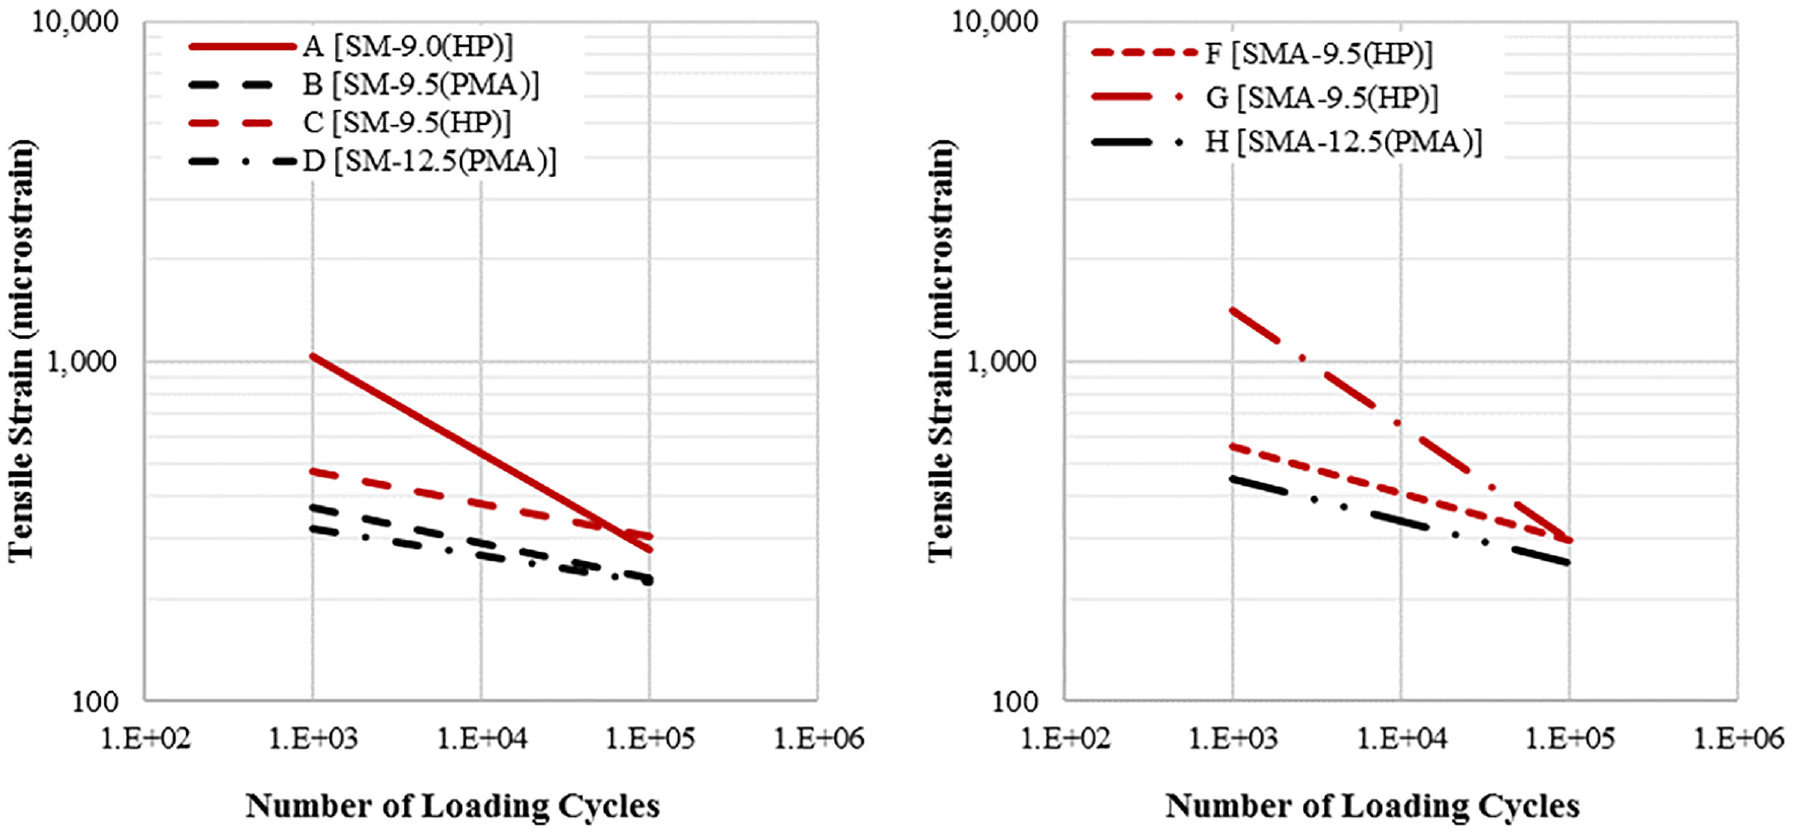
Fatigue characteristics for all PMA and HP AC mixtures at 25°C: (a) SM and (b) SMA.
The Sapp index, developed by the FHWA, can be used as another parameter to indicate cracking performance ( 21 ). This index accounts for the material’s modulus and its toughness with regard to its potential to resist fatigue cracking. After testing, it was found that none of the PMA and HP specimens had failed even after being subjected to the maximum number of loading cycles at the selected strain levels. In other words, PMA and HP specimens should have been evaluated at higher strain levels to induce failure. Therefore, the Sapp indices were not reported as part of this study.
As stated previously, a difference in the laboratory cracking resistance will not necessarily translate into the same difference in cracking performance of the AC pavement in the field. Many factors affect the cracking life of an AC pavement such as stiffness, the developed tensile strain under field loading, the cracking performance characteristic of the evaluated asphalt mixture, and the interaction of all of these factors. Therefore, a full mechanistic analysis would be necessary to evaluate effectively the impact of HP binder on the cracking performance of the corresponding AC pavement.
Performance Evaluation of Field Cores
Field core samples collected just after pavement construction were used to measure in-place layer thickness and air voids (see Table 1). In addition, the cracking resistance of these cores was evaluated by means of the IDT test and OT at 25°C. These 150 mm-diameter cores had a thickness less than the 62-mm and 37.5-mm thickness set forth for typical IDT test and OT specimens, respectively. The research team acknowledges the variation that might be induced with high variations from the target heights; therefore, the data generated were used for comparison purposes especially with plant-produced laboratory-compacted specimens to assess the impact of specimen preparation type (laboratory versus field compaction) and other components such as in-place densities. No cores were sampled for Mixture E; therefore, no data are available. Figure 13 shows the CT and FST indices of all cores by mixture type. Similar observations could be made: SM-PMA and SM-HP mixtures had statistically similar CT and FST values, whereas SMA-HP mixtures had greater index values than SMA-PMA mixtures. Figure 14 shows the number of cycles to failure and an interaction plot determined by the OT. All mixtures had a CPR value lower than 0.5, indicating good cracking resistance. Moreover, all mixtures had a Gc closer to 1, indicating a promising resistance to crack initiation that can be induced because of the polymer modification. It can also be seen that CPR and Gc decreased with the increase of polymer content (PMA versus HP), indicating the positive impact of HP on the resistance to reflective cracking.
Performance test data for IDT test of PMA and HP mixtures at 25°C: (a) CT index and (b) FST.

Performance test data for OT at 25°C of PMA and HP mixtures: (a) number of cycles to failures and (b) interaction plot.
Conclusions and Development of an Initial Roadmap
The purpose of this study was to assess the viability of using HP AC mixtures in Virginia as a reflective crack mitigation technique or when deemed appropriate as a tool for increased resistance to rutting and cracking on higher volume facilities. Another objective was to assess the ability of various testing protocols to discern the performance of asphalt pavements through a comprehensive evaluation of three PMA and five HP field-produced mixtures placed in Virginia. Based on the results, the following conclusions were derived:
An improved durability performance by means of Cantabro mass loss test was observed with high polymer modification of AC mixtures. Therefore, Cantabro mass loss can be used to assess the durability of PMA and HP AC mixtures in Virginia.
An improved rutting performance by means of APA and RLT tests was observed with high polymer modification of AC mixtures. Therefore, both tests could be used to evaluate the rutting properties of PMA and HP AC mixtures in Virginia. Moreover, these results should also be compared and correlated to rut depths obtained from mechanistic-empirical pavement design simulations and field performance.
Based on results from the mixtures tested in this study, the IDT test showed contradicting observations when evaluating the impact of high polymer modification on the cracking performance of asphalt mixtures. Future efforts should be considered by VDOT to assess the feasibility of using the IDT test at intermediate temperature to evaluate the cracking resistance of PMA and HP mixtures. However, OT and direct tension cyclic fatigue revealed similar observations and were able to capture the impact of high polymer modification. Moreover, these results should also be compared and correlated to predicted cracking obtained from mechanistic-empirical pavement design simulations and field performance.
Footnotes
Acknowledgements
The authors thank Andrew Barbour, Christopher Burns, Troy Deeds, Donnie Dodds, Scott Hodgson, Derek Lister, Danny Martinez Rodriguez, and Jennifer Samuels of VTRC for their outstanding efforts in sample collection and testing. Appreciation is also extended to Linda Evans of VTRC for her editorial assistance. Sincere appreciation is expressed to personnel at Eurovia Atlantic Coast LLC dba Virginia Paving Company and Fort Myer Construction Corporation for their contributions to this effort. The authors are also appreciative of the technical review panel for their expertise and guidance: David Shiells, Thomas Schinkel, and Sungho Kim of VDOT and Jason Provines of VTRC.
Author Contributions
The authors confirm contribution to the paper as follows: study conception and design: J. Habbouche, I. Boz, B. K. Diefenderfer, and S. Kim; data collection: J. Habbouche, I. Boz, B. K. Diefenderfer, and S. Kim; analysis and interpretation of result: J. Habbouche, I. Boz, B. K. Diefenderfer, and S. Kim; draft manuscript preparation: J. Habbouche, I. Boz, B. K. Diefenderfer, and S. Kim. All authors reviewed the results and approved the final version of the manuscript.
Declaration of Conflicting Interests
The author(s) declared no potential conflicts of interest with respect to the research, authorship, and/or publication of this article.
Funding

Data Accessibility Statement
The contents of this paper reflect the views of the authors, who are responsible for the facts and the accuracy of the data presented here. The contents do not necessarily reflect the official views or policies of the Virginia Department of Transportation, the Commonwealth Transportation Board, or the Federal Highway Administration. This paper does not constitute a standard, specification, or regulation. Any inclusion of manufacturer names, trade names, or trademarks is for identification purposes only and is not to be considered an endorsement.