



Abstract
The rapid advancement of connected and autonomous vehicle (CAV) technologies, although possibly years away from wide application to the general public travel, are receiving attention from many state Departments of Transportation (DOT) in the niche area of using autonomous maintenance technology (AMT) to reduce fatalities of DOT workers in work zone locations. Although promising results are shown in testing and deployments in several states, current autonomous truck mounted attenuator (ATMA) system operators are not provided with much practical driving guidance on how to drive these new vehicle systems in a way that is safe to both the public and themselves. To this end, this manuscript aims to model and develop a set of rules and instructions for ATMA system operators, particularly when it comes to critical locations where essential decision making is needed. Specifically, three technical requirements are investigated: car-following distance, critical lane-changing gap distance, and intersection clearance time. Newell’s simplified car-following model, and the classic lane-changing behavior model are modified, with roll-ahead distance taken into account, to model the driving behaviors of the ATMA vehicles at those critical decision-making locations. Data are collected from real-world field testing to calibrate and validate the developed models. The modeling outputs suggest important thresholds for ATMA system operators to follow. For example, on a freeway with a speed limit of 70 mph and ATMA operating speed of 10 mph, car-following distance should be no less than 75 ft for the lead truck and 100 ft for the follower truck, the critical lane-changing gap distance is 912 ft, and a minimum intersection clearance is 15 s, which are all much higher than the requirements for a general vehicle.
Keywords
Frequent crashes in work zones pose a great threat to the safety of the public as well as roadway maintenance workers. In the U.S.A., a total of 94,000 crashes occurred in the whole nation’s work zones in 2017 alone, resulting in 37,000 injuries and 809 fatalities. Many of these crashes involved state Department of Transportation (DOT) workers. For example, in the State of Missouri, slowing-moving operation vehicles have been crashed into more than 80 times since 2013, resulting in many injuries to DOT workers ( 1 ). One fundamental issue for the DOT worker injuries is that the speed of mobile and slow-moving operation vehicles generally ranges from 5 mph to 15 mph. When compared with the speed of the faster moving general vehicles on a freeway or a highway, dramatic speed differences are observed. As such, drivers of general vehicles are required to take immediate action, when approaching work zones, such as slowing down or changing lanes. If, for reasons like driving under the influence ( 2 ), such action is not taken in a timely manner, crashes in work zones are more likely to happen. Research suggests that aggressive or distracted driving does occur very often and is the primary factor in crashes in work zones. Other reasons, such as the performance of heavy vehicles, speeding, and dynamic traffic conditions, may also result in work zone crashes ( 3 – 6 ). How to reduce hazards and achieve a safer environment for the DOT workers remains an urgent problem.
The rapid advancements of connected and autonomous vehicles (CAV) technologies, although potentially years away from wide application to the general public travel, are receiving attention from many state DOTs in the niche area of using autonomous maintenance technology (AMT) to reduce fatalities of DOT workers in work zones. One specific technology, named the autonomous truck mounted attenuator (ATMA) vehicle system, is being tested and deployed in several states. Figure 1 below shows some photos of an ATMA vehicle system under operation on a roadway, in which Figure 1a is an overview of the system, Figure 1b is a view from above, taken by a drone, and Figure 1c is a view from the rear. The vehicle system includes a manned leader truck, an unmanned follower truck, and a truck mounted attenuator installed on the follower truck. The leader truck is designed to take on the normal maintenance work, such as roadway striping and pothole fixing, whereas the follower truck is doing autonomous car-following and serving as a buffer in case a crash happens. The driving distance between the follower truck and the leader truck ranges from a few hundred feet to half a mile or so, and the follower truck is designed to mimic the behavior of the leader truck and drive autonomously. The follower truck is capable of not only speed control (e.g., acceleration, deceleration, and maintaining certain speed), in a similar way to adaptive cruise control, but also lateral control for the vehicle to stay in the middle of a lane. Actuators, software, electronics, and vehicle-to-vehicle (V2V) communication equipment are installed on the leader truck and the follower truck and, together, they enable the connectivity (mainly V2V) and the autonomous driving capabilities in a leader–follower style.

Autonomous truck mounted attenuator (ATMA) vehicle system: (a) system overview, (b) view from above, and (c) view from the rear.
While early research shows that promising results are observed in current testing and deployments in multiple states—for example, the statistical analysis in Tang et al. ( 7 ) suggested that the system functioned consistently in field tests performed in Sedalia, MI—research on how DOT workers should operate such new system on a roadway network is very limited. The lack of practical operation guidelines may bring considerable safety concerns. This is because of the uniqueness of this system, in that, in essence, the leader–follower system design imposes more requirements on the leader truck drivers, to ensure a safe and smooth system operation. The lead truck driver is now required to make driving decisions, not only from their own vehicle’s perspective, but also to consider the potential implications of these decisions on the follower truck. For example, when vehicles are making turns at intersections or needing to make lane changes, a regular passenger vehicle driver can simply find an acceptable headway gap in the traffic flow and proceed with their desired action. However, an ATMA leader truck driver needs to avoid a scenario where only the leader truck can proceed, while the follower truck has to remain in its previous location and wait for an acceptable gap to occur. In other words, an ATMA driver will have to wait for a gap larger than normal to make certain that both the leader truck and the follower truck can proceed with a desired action together. Another example is the car-following distance gap requirement. According to classic car-following models, the required minimum car-following gap is dependent on the operating speed and drivers’ perception and response times. However, for an ATMA vehicle system, such a minimum gap should not only consider the impact of the follower truck’s roll-ahead distance, but also the accuracy and reliability of the system in maintaining the following distance. Given the nature of autonomous driving capabilities, the required gap relies less on the human perception and response time.
To bridge this important gap, this paper aims to model and develop a set of practical operation guidelines for ATMA system operators, particularly when it comes to critical locations where decision making is needed. Specifically, technical requirements under three scenarios are investigated. The first focus is on the car-following distance, that is, what is a safe minimum distance that a follower truck should keep away from the leader truck? and what is the minimum distance that the leader truck should keep away from the general vehicle in front? Next, the critical lane-changing gap distance is examined, that is, what minimum headway gap does an ATMA vehicle system need, before both vehicles can safely proceed with a desired lane-changing action? Last, but not least, the paper investigates the situation when the ATMA vehicle system approaches an intersection: how much time is needed for the ATMA vehicle system to cross the intersection safely? This is important, especially, when the vehicles are encountering an ending green light, in case they are cut off by vehicles with conflicting movements.
Traffic flow models are developed to work with the unique ATMA vehicle system design. Traditional models, specifically, Newell’s simplified car-following model and the classic lane-changing behavior model, are modified to model the driving behaviors of ATMA vehicles at critical decision-making locations. These changes are necessary because, as discussed above, the human driver’s perception and response time is no longer a valid aspect to consider, but rather, the accuracy and reliability of the system in maintaining the following distance should be taken into consideration. In addition, the distance between a leader truck and a follower truck also plays an important role in the lane-changing process, as we now need both vehicles to switch to a different lane before the process can be said to be complete. Finally, roll-ahead distance, defined as the distance that the follower truck will roll ahead if struck by an errant vehicle, should be correctly modeled and taken into consideration.
This paper is organized as follows. First, the ATMA system is briefly reviewed, followed by a review of other relevant literature. In the third section, some preliminaries are presented, including the Newell simplified car-following model, the critical gap for lane changing, and roll-ahead distance. The fourth section presents the traffic flow models developed for ATMA system operation. In the fifth section, the data collected from field testing are introduced and then used to calibrate and validate the developed models. The modeling outcomes and implications to ATMA system operation are also presented. The final section concludes the paper and discusses how to deploy the designed operation guidelines.
Literature Review
ATMA is a quickly emerging technology that combines the usage of CAV and AMT in work zones. While CAV has the great potential of changing people’s daily lives and has attracted significant research attention recently ( 8 , 9 ), the question of when it can be widely used in common passenger vehicles is yet to be determined. On the other hand, the application of CAV in a narrowly defined and simplified environment, such as work zone locations with the lead-follower autonomous driving concept, becomes more realistic. ATMA has been receiving a significant amount of attention from state DOTs with the hope of reducing worker fatalities in work zones. Colorado and Missouri are among the first states in the U.S.A. to test and deploy ATMA vehicles to remove DOT workers from the driver’s seat ( 7 , 8 , 10 , 11 ). Several other states, including California, Minnesota, Virginia, Ohio, Tennessee ( 12 ), are in the process of testing, developing, or deploying similar technologies. In addition, Colorado DOT is leading an AMT pool fund with 13 state DOT members ( 13 ).
Many car-following models have been developed to illustrate car-following behavior. They describe how a leading vehicle and a following vehicle interact with each other, which is an important consideration to ensure a safe driving experience in a roadway network. The Gazis-Herman-Rothery model was first formulated in 1958 at the General Motors research laboratory in Detroit ( 14 ). This model related a vehicle’s acceleration to the speed of the leader vehicle, relative speed and spacing between the follower and the leader vehicles, and driver reaction time. The collision avoidance (CA) model was first proposed by Kometani and Sasaki ( 15 ). This model described the safe following distance as a quadratic function of the speeds of the follower and leader vehicles and reaction time, and the four parameters that needed to be calibrated. This model was then further improved by Gipps ( 16 ), in which several mitigating factors were considered. The Gipps model can be calibrated using more common-sense assumptions about driver behavior when compared with the previous CA model.
A simplified car-following model was proposed by Newell (
17
), in which a follower’s trajectory is a simple translation of its leader’s trajectory by a specific distance and a time. The relationship between spacing and velocity for a single vehicle is linearly related to the specific distance and time. The Newell car-following model has been empirically validated in several studies. For example, it was verified by measuring vehicles discharging from long queues at signalized intersections (
18
); the
Considering those good properties, Newell’s car-following model is adopted in this paper, but with some modifications. One basic assumption of Newell’s car-following model is that a vehicle following the leader vehicle in a homogenous space replicates the trajectory of the leader vehicle with a constant time and distance offset. However, many recent studies consider heterogenous driving behaviors. Several studies ( 25 – 28 ) have confirmed that parameters calibrated in car-following models can be different for different drivers. Focusing on Newell’s car-following model, Chiabaut et al. ( 28 ) examined and calibrated interdriver heterogeneity through a proposed effective estimation method. Other studies ( 29 , 30 ) also found evidence which suggested that a single driver’s actions can be better described using different car-following parameters and/or different models to describe a single vehicle trajectory. Focusing on Newell’s car-following model, Ahn et al. ( 31 ) discussed how the speed-spacing relationship can evolve during the acceleration or deceleration phase. They considered varying wave speed within drivers because of stochasticity, and identified wave paths through matching points with similar speed. Zheng et al. ( 32 , 33 ) further examined the changes in the speed-spacing parameters under major disturbances such as lane changes and traffic flow oscillations. Furthermore, Taylor et al. ( 34 ) extended Newell’s car-following model and calibrated the time-dependent parameters using the dynamic time warping algorithm using the NGSIM dataset. The experiment results showed a decrease in the response time and critical spacing during a deceleration period, and then recovered back to some near-steady-state condition. Thus, it is assumed that the critical spacing varies with driver’s speed, but with a constant response time for simplicity. This assumption is also based on Helly’s ( 35 ) linear car-following model, in which the desired following distance is a linear function of the vehicle velocity and acceleration.
For lane-changing behavior decisions, several models have been proposed to capture a driver’s decision on whether or not to execute a lane change. For example, Gipps ( 36 ) proposed that a driver’s lane-changing behavior in an urban street was governed by two basic considerations: maintaining a desired speed and being in the correct lane. Gipps’ model considered the driver behavior as deterministic, so that a driver decided to maintain the desired speed or be in the correct lane based on the distance to the intended turn. By extending Gipps’ model to freeways, Yang and Koutsopoulos ( 37 ) classified lane-changing behavior as mandatory or discretionary, and modeled the process as four sequential steps: decision to consider a lane change, choice of the target lane, search for an acceptable gap, and execution of lane change. The lead gap was defined as the clear spacing between the front of the lane changer and the rear of the leader in the target lane, and the follow gap was defined as the clear spacing between the rear of the lane changer and the front of the follower in the target lane. The gap acceptance model examines the lead and follow gaps for performing a lane change in the target lane.
As reviewed above, although extensively studied, the above-mentioned car-following and lane-changing models were developed with a general passenger vehicle as their study object and thus cannot be directly applied to the ATMA vehicle system. This is because the unique characteristics of the ATMA system, including its two-vehicle system design and autonomous driving capability, as well as the existence of gap distance between leader and follower trucks, all call for the modifications of classic models before they can be used.
Preliminaries
Spacing-Velocity Relationship with Newell Car-Following Model
This section shows how to derive the car-following distance for a general vehicle analytically. As mentioned above, this study adopts Newell’s (
17
) simplified car-following model, which was originally developed to describe a passenger vehicle’s car-following behavior. Figure 2 depicts its characteristics, in which a leading vehicle

Time-space diagram of Newell’s simplified car-following model.
The following vehicle

Based on Newell’s car-following model, the required car-following distance for a vehicle

Following Newell’s car-following model, Equation 2 takes a linear form, which indicates that there exists a linear relationship between the velocity and spacing, as shown in Figure 3. When the velocity of vehicle
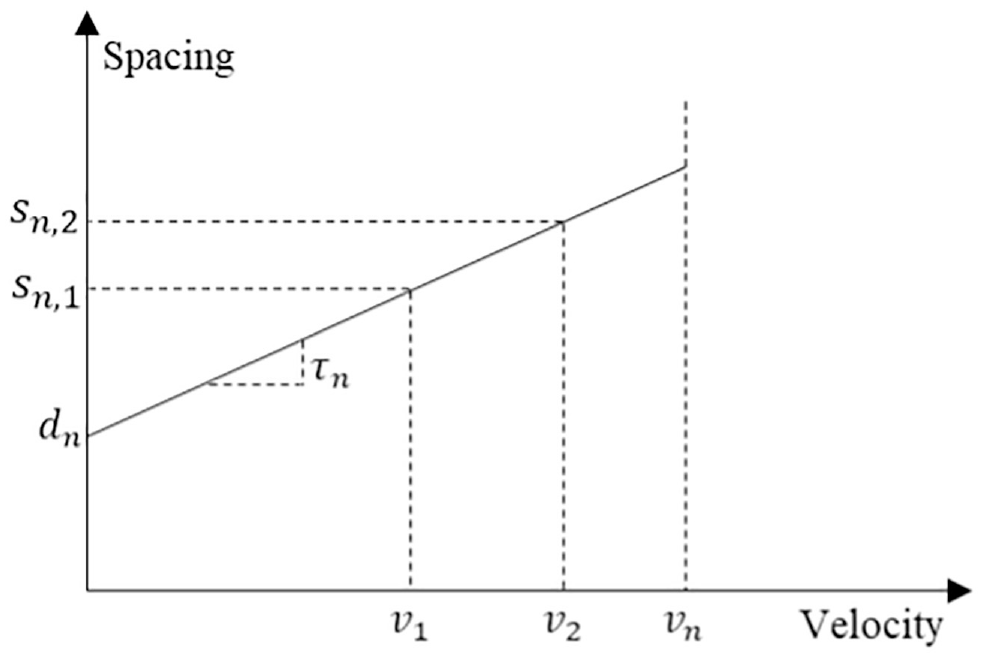
Relationship between spacing and velocity for a single vehicle.
Critical Gaps for Lane-changing
This section shows how to derive the critical gaps that are necessary for a general vehicle to switch lanes. The lane-changing models proposed by Yang and Koutsopoulos ( 37 ) are adopted, which used four sequential steps to describe a passenger vehicle’s lane-changing behavior decisions, including a decision to consider a lane-changing maneuver, choice of the target lane, search of an acceptable gap, and execution of lane-changing. Once the target lane is selected, an acceptable gap is required for the driver to change lanes.
For a general vehicle to switch lanes, it needs to consider both lead gap and lag gap, as shown in Figure 4. The lead gap
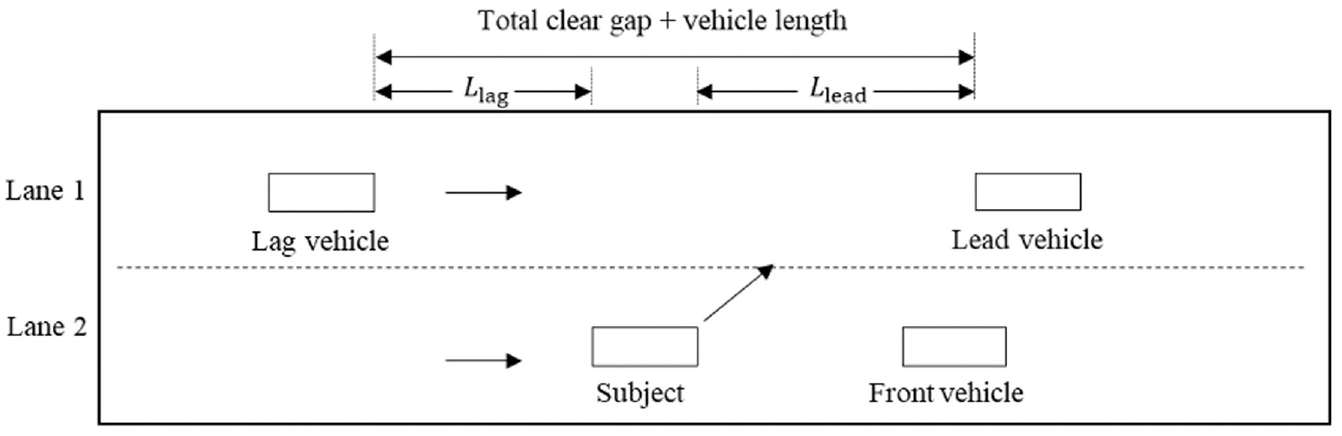
An illustration of acceptable gap for lane changing.
In other words, if the subject vehicle in lane 2 intends to change lanes to the target lane 1, the available gap distance in lane 1 needs to be larger than the summation of

Roll-Ahead Distance
A truck mounted attenuator (TMA) is a safety device used for short duration or mobile operation work. In the work zone, a TMA-equipped vehicle should be positioned at a sufficient distance in advance of the workers or equipment being protected. If a TMA-equipped vehicle is hit, it will be move forward some distance, which is commonly referred to as the roll-ahead distance (RAD). It is important to select a sufficient distance in advance of the workers or equipment being protected. Humphreys and Sullivan ( 38 ) calculated and rounded RAD for moving and stationary operations, respectively, as a function of prevailing speed, weight of TMA-equipped vehicle, and weight of impacting vehicle. RAD varies depending on the weights and speeds of the two vehicles involved, the extent to which the shadow vehicle is restrained, and certain pavement characteristics. Those distances are appropriate for the TMA-equipped vehicle speed up to 15 mph. For example, if the weight of a TMA-equipped vehicle is 10,000 lb and the weight of an impacting vehicle is 4,500 lb, the RAD is suggested to be 100 ft at the prevailing speed of 60–65 mph. Typically, Missouri DOT recommended a minimum of 150 ft RAD to the work activity during stationary operation or short duration or mobile operations ( 39 ). Texas DOT suggested that the minimum distance the TMA-equipped vehicle will be placed in advance of the work crew is 30 ft ( 40 ).
In the ATMA system, the follower truck serves as a shadow vehicle to protect the DOT worker in the leader truck when performing maintenance. When the operator in the leader truck sets a gap distance between the leader truck and the follower truck, the RAD should be considered. This paper adopts the shadow vehicle spacing recommended in the American Association of State Highway and Transportation Officials (AASHTO) Roadside Design Guide ( 41 ). According to the ATMA system configuration, the follower truck with equipment weighs 23,365 lb. For vehicle weights in this range, AASHTO recommends that the RAD for moving operations (shown in Table 1) is 172 ft, 150 ft, and 100 ft, when the speed limit is greater than 55 mph, between 45 mph and 55 mph, and less than 45 mph, respectively.
Guidelines for Spacing of Shadow Vehicles (from American Association of State Highway and Transportation Officials Roadside Design Guide)

Model Development for ATMA System Operation
This section develops traffic flow models for ATMA vehicle system operations, with the goal of determining the minimum driving requirements. Specifically, technical requirements under three scenarios are investigated: (i) the required car-following distance for a leader truck and a follower truck, respectively, while driving on a roadway segment; (ii) the critical lane-changing gap distance of the system to complete a safe lane-changing action; and (iii) the required intersection clearance time when crossing an intersection. The key to examination of these three scenarios is the modeling of car-following and lane-changing behavior. A highway with two lanes in each direction and with a signalized intersection is selected as the subject for analysis, although the model can be easily extended to other scenarios.
Minimum Car-Following Distance Requirement
Minimum Car-Following Distance for the Leader Truck
When the traffic is not congested, the operating speed of a maintenance vehicle is much slower than that of the general vehicles, so for a leader truck, its car-following distance is of less concern while driving on a roadway segment. When the traffic is congested, or when the ATMA is approaching an intersection, however, the spacing between a leader truck and a general vehicle ahead becomes shorter, and the ATMA system operator needs to watch out for the minimum car-following distance.
According to Newell’s ( 17 ) simplified car-following model, the trajectory of the leader truck can be expressed as:

where
According to Equation 2, the required car-following distance of a leader truck can be expressed as

where

where
Minimum Car-Following Distance for the Follower Truck
For a follower truck, because of its autonomous driving nature, the first part of Equation 5, that is, the distance traveled during the reaction time equals zero. Once a brake request is initiated, the computer will start to brake without any time delay. As such, when compared with the leader truck, the required minimum car-following distance only includes
In addition, as mentioned above, the minimum distance for the follower truck should also consider RAD, so that in case the follower truck is hit, it will not crash into the leader truck. As such, the minimum car-following distance of the follower truck

Critical Gap Distance Requirement for Lane-Changing
The lane-changing decision-making process of ATMA vehicles is very different from that of general vehicles. In other words, Equation 3 is no longer applicable, as it is designed for general vehicles. As illustrated in Figure 5, the ATMA vehicle system consists of a leader truck and a follower truck, both of which are in lane 2 and need to switch to lane 1. Such a leader–follower system design indicates that the system operator needs to find an acceptable gap not only for the leader truck, but also for the follower truck, so that the entire system can make the lane change together without being interrupted by general traffic vehicles. As such, Equation (3) can be modify to Equation (8) below, to calculate the required minimum acceptable gap distance

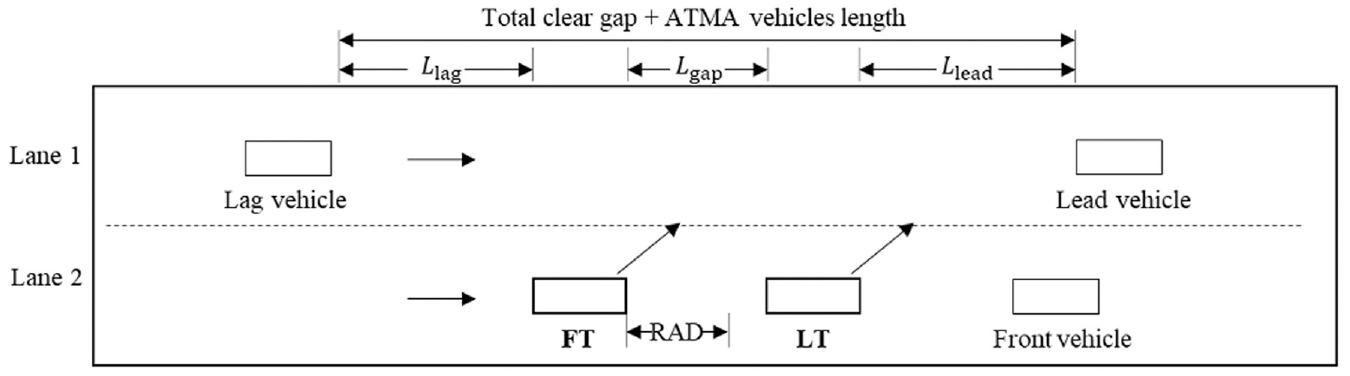
Critical lane-changing gap of autonomous truck mounted attenuator (ATMA) vehicles.
The minimum acceptable gap distance for the ATMA vehicles includes three components: (i) lead gap distance

Next, we show how to derive the needed time headway and gap distance. To evaluate the lead gap distance

As such, we can calculate the required time headway for the lead gap distance and the lag gap distance, respectively. First, for a leader truck that is driving at a speed of


Second, for

Then the lag gap distance can be estimated by

Finally, for

The minimum acceptable time headway for the ATMA vehicles to safely change lanes


After obtaining the minimum acceptable distance, the driver of the leader truck can determine whether the gap distance is sufficient for the ATMA vehicles to execute a lane change.
Intersection Clearance Time Requirement
This subsection models the minimum clearance time requirement for the ATMA vehicle system at intersections, which is the amount of time needed for vehicles to pass an intersection safely. A common general vehicle merely needs to follow the signal instruction to cross an intersection or to make a turn as long as it can enter the intersection before the light turns yellow; the designed intersection clearance time is usually sufficient for it go through the intersection, or make a turn. However, for an ATMA vehicle system, this is very different. Considering the two-vehicle design, as well as the gap distance between a leader truck and a follower truck, the clearance time designed for a single general vehicle is not enough for the ATMA vehicle system. As such, the leader truck driver needs to assess whether the signal time is sufficient for the ATMA vehicles to cross the intersection.
The distance of crossing an intersection or making a turn is shown in Figure 6. If the ATMA vehicles need to cross the intersection, the clearance time requirement for ATMA vehicles can be calculated by

where

Four-lane two-way highway intersection profile.
On the other hand, if the ATMA vehicle system needs to make a left turn at the intersection, the clearance time requirement for the ATMA vehicles is calculated by

where
Numerical Analysis
This section first presents the data collected from field testing, which is then used to calibrate and validate the developed models. The modeling outcomes and implications for ATMA system operation are presented at the end.
Field Testing Description
A field-testing event was organized at Sedalia, Missouri in May 2019 to test the ATMA system’s performance. The ATMA vehicles were provided by Missouri DOT (MoDOT), and the length of the leader truck and the follower truck are
Data Collection
Multiple hardware, including a GPS device, V2V communication, LiDARand other sensors were installed on the ATMA vehicles and, during the field testing, the vehicle status information was automatically collected and recorded. These datasets were downloaded to a working computer and processed by Python language for this research.
The leader truck log file recorded the timestamp, eCrumb message, position (latitude, longitude, and altitude), heading and velocity information of the lead truck, as shown in Figure 7a. On the follower truck, as it was driving autonomously, its log file also recorded the autonomous driving status information, such as the actual distance between the leader truck and the follower truck, the number of GPS satellites connected, acceleration, and cross track error. Figure 7b shows a screenshot of the data collected by the follower truck.
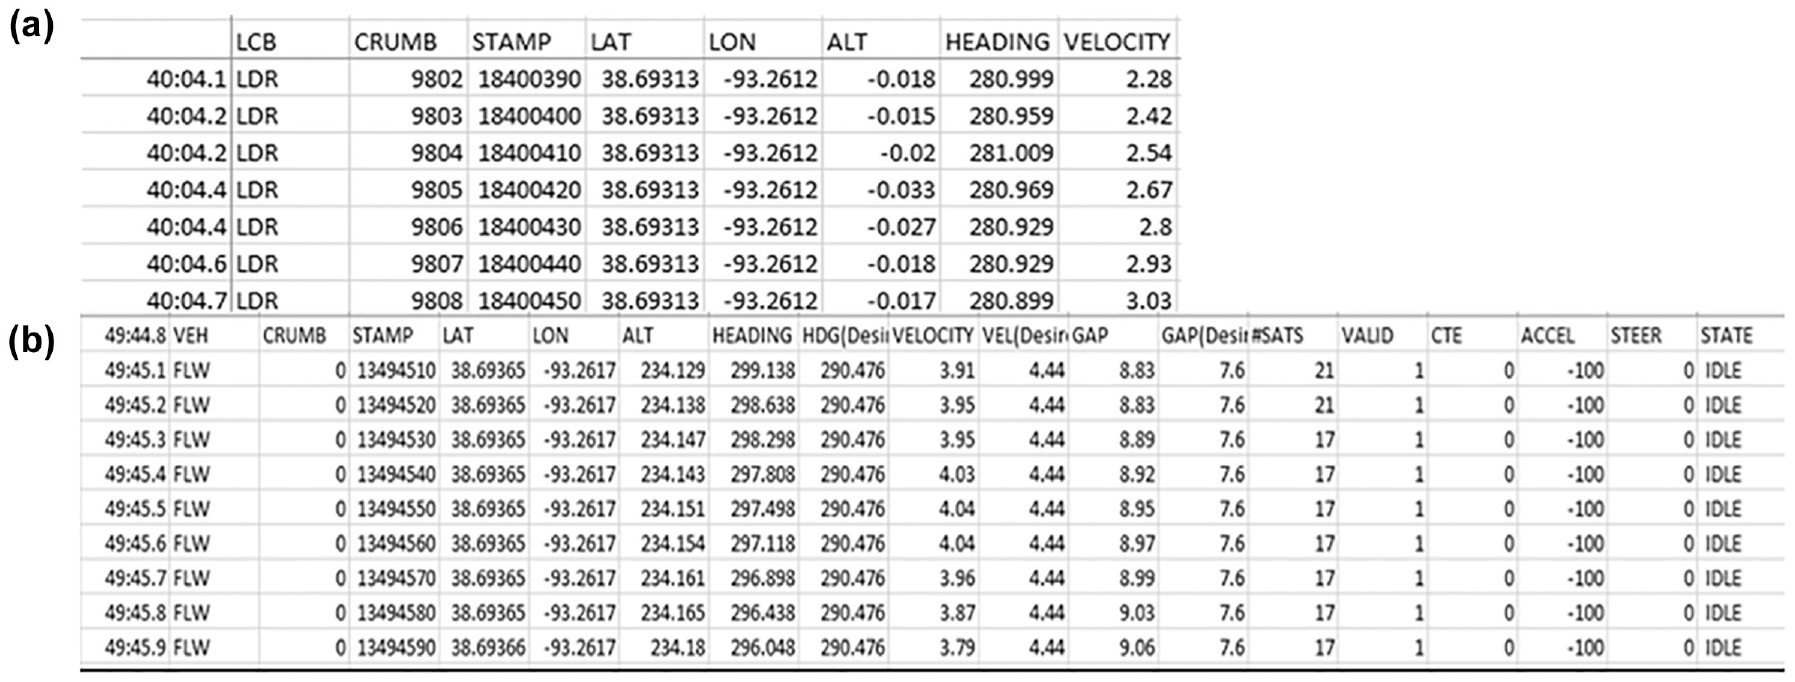
Screenshot of autonomous truck mounted attenuator (ATMA) vehicles’ log files: (a) lead truck and (b) follower truck.
To derive the minimum required car-following distance and critical lane-changing gap distance, the maximum deceleration of the leader truck and the follower truck shall be calibrated. During the field testing, emergency stop testing was performed three times, which allowed data collection for this purpose. A technician in the leader truck pushed the emergency stop button, the ATMA vehicle initiated an emergency stop, and the stop time and distance were recorded (shown in Table 2). The speed of the ATMA vehicles was set to be 10 mph and 15 mph.
Stop Time and Distance in Emergency Stop Test

When the speed was set at 10 mph, the standard deviation of the stop time was 0.09 s, whereas the standard deviation of the stop distance was 3.68 ft. When the speed was set at 15 mph, these values increased to 0.14 s and 4.27 ft, respectively. These numbers suggested that the error of the recorded stop distance was larger than that of the stop time. The accuracy of the stop time was considerably higher than that of the stop distance. Because of this, the data for stop time were used to estimate the maximum deceleration. The data analysis showed the maximum deceleration
Analysis of Car-Following Distance Requirement
Car-Following Distance Requirement for Leader Truck
The values of the parameters that are needed are first calibrated. According to Equation 5, the minimum required car-following distance of a leader truck is related to its travel speed and temporal delay. AASHTO recommends a design criterion of
Based on these parameters, the minimum car-following distance of the leader truck
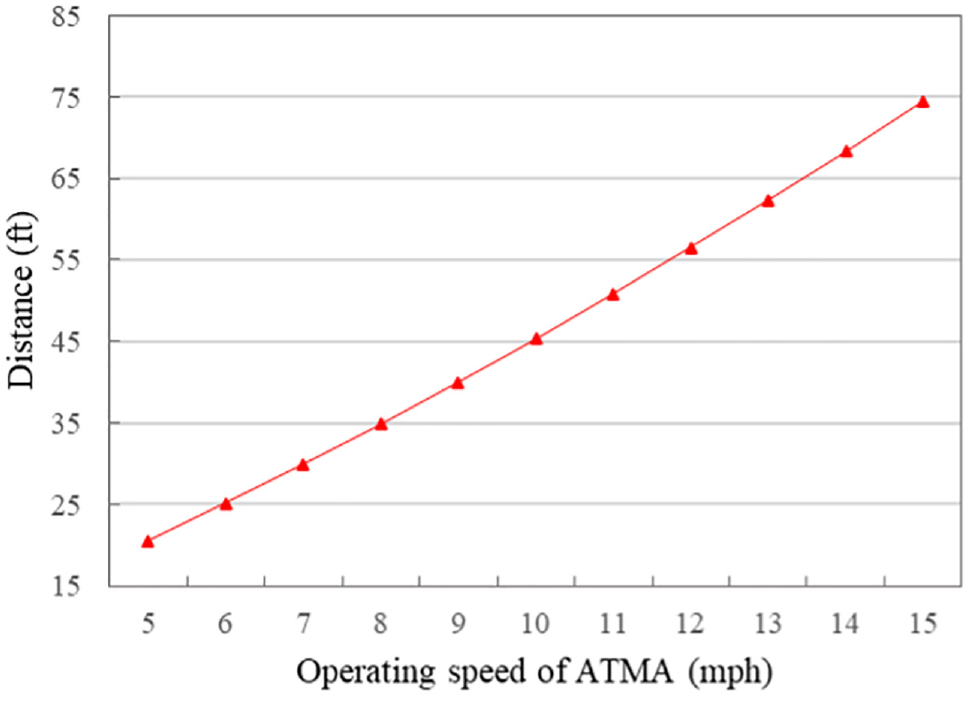
Minimum car-following distance of leader truck.
Car-Following Distance Requirement for Follower Truck
For the car-following distance of the follower truck, we first calibrate the error in following distance from the field testing. The distribution of errors between the desired gap and the actual gap is plotted in Figure 9. A positive error means the actual gap is less than the desired gap, which should be included in the minimum car-following distance to ensure safe driving. The 95 percentiles of errors are found to be 6 ft, that is,
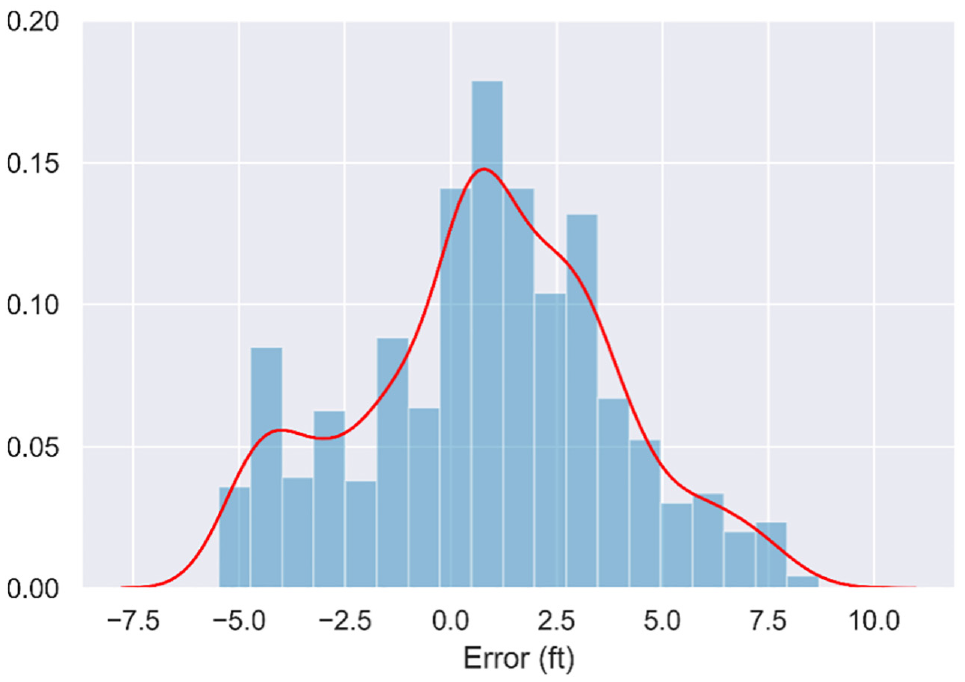
Frequency distribution histogram of error in following distance.
Based on this relationship, for the follower truck, the required minimum car-following distance
Analysis of Lane-Changing Critical Gap Distance Requirement
As discussed above, the critical gap distance for the ATMA vehicles includes three components: lead gap distance
According to Equation 11, the time headway
In total, the critical time headway for the ATMA vehicle to change lanes safely can be calculated by
The resulting lane-changing critical time headway and gap distance are illustrated in Figure 10, with the distance between a leader truck and a follower truck set at 100 ft shown in Figure 10a and 200 ft shown in Figure 10b. The free flow speed is set at 35 mph, 50 mph, and 70 mph under different scenarios, thus the RAD of the follower truck takes values of 100 ft, 150 ft, and 172 ft, respectively. When the gap distance between two trucks is set at 100 ft, as illustrated in Figure 10a-1, the required critical time headway reduces when ATMA operation speed increases, which is mainly caused by the time headway for gap distance between ATMA vehicles decreasing. The required critical gap distance slightly increases when ATMA operation speed increases, which is caused by the lead gap distance increasing, as shown in Figure 10a-2. It also can be observed that a higher free flow speed requires a longer critical time headway and gap distance. A similar pattern can be found in Figure 10, b-1 and b-2, when the gap distance between two trucks is set at 200 ft.

Critical time headway (a-1, b-1) and gap distance requirements (a-2, b-2) for lane changing subject to roll-ahead distance requirement: (a) 100 ft gap distance and (b) 200 ft gap distance.
For a typical freeway with 70 mph free flow speed, when the gap distance between two trucks is set at 100 ft, the critical time headway ranges from 25 to 47 s and the critical gap distance ranges from 886 ft to 940 ft. If the gap distance is set at 200 ft, as shown in Figure 10, b-1 and b-2, the critical time headway gap ranges from 26 to 51 s and the critical gap distance ranges from 914 ft to 968 ft. If the ATMA operation speed is set at 10 mph, which is the most commonly-seen scenario, the required critical time headway becomes 30 s and 32 s in Figure 10, a-1 and b-1, respectively. Moreover, the required critical gap distance becomes 912 ft and 939 ft in Figure 10, a-2 and b-2, respectively. When compared with a common passenger vehicle, these numbers are significantly higher which, again, confirms the previous hypotheses that an ATMA system operator needs to drive their vehicle in a very different way than when driving a common vehicle. Supplemental work zone traffic management actions, such as traffic cones or flaggers, might be helpful to ensure this lane-changing action is not interrupted by other vehicles.
Analysis of Intersection Clearance Time Requirement
Continue to use the same roadway configuration that is specified in Figure 6. The lane width is set at 12 ft so that the intersection length is 48 ft, and the intersection width is
Figure 11, a and b , present the required time for the ATMA vehicles to pass the intersection. As the intersection length is about the same as its width, the times required for crossing the intersection or making a left turn are almost equal. We can find that the required time to cross this intersection ranges from 10 to 31 s when the gap distance is 100 ft, or 13–38 s with a gap distance of 150 ft, or 15–45 s with a gap distance of 200 ft. In particular, if the ATMA operation speed is set at 10 mph, which is the most commonly-seen, the required intersection clearance time ranges from 16 s to 22 s for through-movement and a left turn.

Time required for autonomous truck mounted attenuator (ATMA) vehicles at an intersection to: (a) go straight ahead and (b) turn left.
Conclusion and Discussion
This paper focuses on modeling and developing a set of rules and instructions to operate the ATMA vehicle system, particularly when it comes to critical locations where correct decision making is needed. Different from general vehicles, the ATMA vehicle system consists of a follower truck and a leader truck, with some distance between them. The operators are required to make driving decisions, not only from the leader truck’s perspective, but they must also consider the potential implications of their decisions on the follower truck. Specifically, three technical requirements are investigated: those for car-following distance, critical lane-changing gap distance, and intersection clearance time. The Newell car-following model and the classic lane-changing behavior model are modified to model the driving behaviors of the ATMA vehicles at those critical decision-making locations. Data are collected from real-world field testing to calibrate and validate the developed models.
The modeling outputs suggest important thresholds for ATMA system operators to follow to ensure the safe driving of both public and ATMA vehicles. The results suggest a minimum car-following distance of 75 ft for a leader truck. The minimum car-following distance for a follower truck is dominated by RAD and ranges from 100 ft to 172 ft depending on the speed limit. For a typical freeway with free flow speed of 70 mph and ATMA operating speed of 10 mph, the system requires a minimum gap distance of 912 ft and 939 ft in the target lane to perform a safe lane change when the distance between a leader truck and a follower truck is 100 ft and 200 ft, respectively. For the intersection clearance time, when the gap distance between a leader truck and a follower truck is set at 100 ft, the system requires 15 s to cross an intersection or to make a right turn safely, and this increases to 25 s if the distance between a leader truck and a follower truck increases to 200 ft. When compared with a common passenger vehicle, these numbers are significantly higher, which highlights the importance of using the modeling outcomes to train ATMA system operators, as well as to provide supplemental work zone traffic management actions to work with the operation of ATMA vehicles to ensure a safe and smooth operation.
The guidelines designed for ATMA drivers show a significant difference compared with the existing guidelines for TMA operation. Besides the minimum car-following distance requirement, this study also evaluates the critical gap requirement for lane changing and intersection clearance time requirement to help ATMA drivers make decisions at those critical locations. The designed guidelines are expected to be deployed through combining with the CAV technology. With the development of CAV technology, it has been widely adopted in practice recent years. As an application of CAV technology, the ATMA vehicles are equipped with many sensors (e.g., radar, Lidar, ultrasonic, and camera, etc.), to detect obstacles and their distance. The ATMA vehicles can also apply vehicle-to-infrastructure (V2I) communication, which is the wireless exchange of data between vehicles and road infrastructure. Enabled by a system of hardware, software, and firmware, infrastructure components such as lane markings, road signs, and traffic lights can wirelessly provide information to the vehicle, and vice versa.
Specifically, the sensors installed at the front of and on both sides of trucks can detect: (i) the distance between the leader truck and the general vehicle ahead; (ii) the gap distance between two trucks; (iii) the lead gap distance between the leader truck and the follower truck on the purpose lane; and (iv) the lag gap distance between the follower truck and the lag vehicle on the purpose lane. Those realistic gap distances can be displayed on the user interface in the leader truck, so that the driver can determine whether those distances satisfy the minimum car-following distance or critical gap for lane changing. If the following distance is less than the criteria, the driver should decelerate to enlarge the following distance to ensure safety. Once the gap distance satisfies the critical headway for lane changing, the driver in the leader truck can execute a lane change. Before the ATMA vehicles approach the intersection, the leader truck can receive information from the traffic signal controller by V2I communication. When the traffic light is green, the driver needs to know how much green time is left and whether it is enough for the ATMA vehicles go through or make a left turn.
This study might be improved in the following aspects. First, the car-following behavior in reality may not strictly follow the Newell car-following model. More accurate calibration of the driving behavior might be helpful. Second, the field testing was performed with the ATMA system provided by Micro Systems Inc. (MSI), a wholly owned subsidiary of Kratos Defense and Security Solutions (Kratos-MSI). The vehicle performance, especially the deceleration performance and system accuracy in maintaining car-following distance, might be different if a product from a different company were used.
Footnotes
Author Contributions
The authors confirm contribution to the paper as follows: study conception and design: Q. Tang, X. Hu, R. Qin; data collection: Q. Tang, X. Hu; analysis and interpretation of results: Q. Tang; draft manuscript preparation: Q. Tang, X. Hu. All authors reviewed the results and approved the final version of the manuscript.
Declaration of Conflicting Interests
The author(s) declared no potential conflicts of interest with respect to the research, authorship, and/or publication of this article.
Funding
The author(s) disclosed receipt of the following financial support for the research, authorship, and/or publication of this article: This research is sponsored by U.S. DOT through Mid-America Transportation Center, project titled “MATC: Development of Autonomous Trucks Operation Guidelines and Driver Training Process”, contract number 69A3551747107.
