



Abstract
The importance of specifying proper aggregate grading for achieving satisfactory performance in pavement applications has long been recognized. To improve the specifications for superior performance, there is a need to understand how differences in aggregate gradations within the acceptable limits may affect unbound aggregate base behavior. The effects of gradation on strength, modulus, and deformation characteristics of high-quality crushed rock base materials are described here. Two crushed rock types commonly used in constructing heavy-duty granular base layers in the State of Victoria, Australia, with three different gradations each were used in this study. The gradations used represent the lower, medium, and upper gradation limits for heavy-duty base materials specified by the State of Victoria’s road agency (VicRoads). Modified compaction tests were conducted first to determine the moisture-density relationship of all mixes. Further, California bearing ratio (CBR), unconfined compressive strength (UCS), and repeated load triaxial (RLT) tests were then performed to study the effects of different gradations on strength, resilient modulus (MR), and deformation resistance. Further, permanent deformation and MR results were modeled using two popular models for each to explain the effect of gradation on the mixtures’ characteristics. The results indicate that the gradation that provides the best characteristics varies depending on the type of material used. For the materials tested here, coarse and medium gradations provide the best mixture characteristics in relation to CBR, MR, and permanent deformation. Fine gradation mixtures of these materials have lower values of these measures but are still considered acceptable considering relevant specification for the intended application.
Keywords
Unbound granular materials are commonly used in base layers of flexible granular pavements. The main function of the aggregate base layer is structural, as it significantly contributes to resisting wheel loads, through particle contacts, and interlock ( 1 ). Base granular materials are usually crushed, or partially crushed, high-quality aggregates to ensure layer stability and durability when subjected to the repeated high stresses encountered in the upper part of the pavement structures ( 2 ).
The stability of unbound granular material is provided by aggregate interlock, which is developed by the coarse aggregate contacts ( 3 ). Knight, Radjai et al., and Voivret et al. reported that coarse fractions serve to transmit loadings, while finer fractions serve to reinforce the load-carrying skeleton of coarse fractions and prevent the unbound structure from collapsing ( 4 – 6 ). This mechanism was numerically confirmed by Radjai et al. and Voivret et al. ( 5 , 6 ). Therefore, strength and deformation resistance of these unbound granular materials are attributed to their index properties, for instance: gradation, maximum particle size, particle shape, particle texture, fines content, moisture content, and plasticity index (PI). Gradation is considered a key factor that influences the performance of unbound granular base materials characterized by bearing strength, resilient modulus (MR), and permanent deformation ( 7 – 10 ).
The effect of the unbound aggregate gradation on MR values is controversial. Earlier studies conducted by Knutson and Thompson, Zaman et al., and Barksdale reported very small, if any, differences in MR of unbound granular materials with different gradations ( 11 – 13 ). However, other studies stated that gradation of unbound granular materials has a significant effect on MR values ( 10 , 14 , 15 ). Several other authors reported that coarser gradations provide high MR values ( 14 – 19 ). Generally, those studies stated that the MR for coarse gradations is 50%–160% higher than MR values of finer gradations. However, Rada and Witczak, and Zeghal found that coarse gradation produces lower MR than finer gradations ( 20 , 21 ).
With respect to deformation behavior, Barksdale and Barksdale, and Itani reported that, as the gradation becomes coarser, the tendency to undergo permanent deformation becomes lower ( 13 , 22 ). Barsdale found that coarser mixtures performed better in rutting, while finer mixtures performed better in fatigue failure ( 13 ). On the other hand, Golalipour et al. concluded that lower gradation bands (very coarse gradation with 3% fines content < 75 µm) have higher permanent deformation compared with higher gradation bands (finer gradation with 5%–7% fines content < 75 µm) ( 23 ).
Overall, it is hard to draw quantitative conclusions on the effect of gradation from these contrasting studies, except that gradation played some role in the elastic and plastic behavior of unbound granular materials.
The state road agency of Victoria, Australia, (VicRoads) has set specifications of the allowable gradation limits for crushed rock used in heavy-duty granular bases, that is, surfaced with thin bituminous surfacing (sprayed [chip] seal or thin asphalt, 50 mm). For these gradation limits, VicRoads also specified the allowable PI and California bearing ratio (CBR) ( 24 , 25 ). However, VicRoads did not specify the effects of these gradations on crushed rock performance in relation to unconfined strength and plastic and elastic deformation at different moisture content. Further, no study has been performed on the effect of these gradations on the performance of hornfels and basalt crushed rocks, that have become the most commonly used in pavement construction in Victoria in recent years. Therefore, to confirm the performance of these gradations and to improve the specification for superior performance, targeted in the mechanistic-empirical pavement analysis and design framework, a full range of testing programs should be conducted. The findings from such tests could be adopted by other road agencies using these materials for pavement bases.
To better evaluate performance characteristics of hornfels and basalt crushed rock mixes with different gradations and establish the best gradation limit(s), a comprehensive laboratory program has been conducted. Both crushed rocks, with 20 mm nominal size, were manufactured into three different gradations. The effects of different gradations on the crushed rock’s moisture-density relationship, CBR, unconfined compressive strength (UCS), MR, and permanent deformation have been assessed in this study and reported here. The results of MR and permanent deformation have been modeled using some of the most popular existing models to explain the characteristics of mixtures under elastic and plastic strains.
Material Origin and Sample Preparation
Crushed hornfels and crushed basalt were sampled from quarries in Victoria, Australia, to be used in this study. These materials contained no deleterious substances. They are hard and durable and commonly used in bases of heavy-duty sealed pavements in Victoria. The crushed rock nominal size is 20 mm for both materials. The Los Angeles values (LAV) are 13 and 15, respectively. Further, the flakiness index (FI) for hornfels and basalt is 18 and 4, respectively, indicating that both are of good quality. Three gradations, noted as G1, G2, and G3, were selected from VicRoads’ specifications for crushed rock mixes to investigate the effect of gradation on compaction, CBR, UCS, MR, and permanent deformation characteristics of the mixes ( 24 ). The three gradations, presented in Figure 1, are the lower, medium, and upper limits of the gradation envelop for heavy-duty base material as specified by VicRoads. G1 gradation is the coarse gradation with 7% fines content (< 75 µm), G2 is the medium gradation with 9% fines content, and G3 is the fine gradation with 11% fines content. The coefficients of curvature (Cc) for G1, G2, and G3 are 2.93, 3.29, and 3.86, respectively, and the uniformity coefficients (Cu) are 38.9, 54.9, and 63.9, respectively.
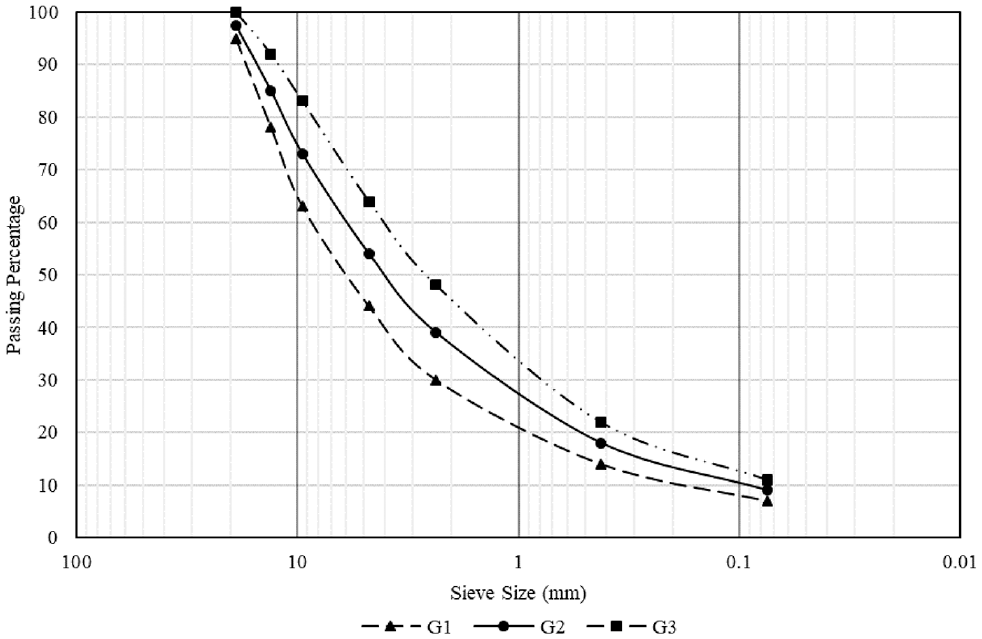
Tested gradations.
To prepare the samples according to the nominated gradations, the supplied materials were first washed and dried, then the dried aggregate particles were sieved into seven sieve sizes: 19 mm, 13.2 mm, 9.5 mm, 4.75 mm, 2.36 mm, 0.425 mm, and 0.075 mm. The materials retained in each sieve were then stored in separate buckets. For fines content < 75 µm, crushed rock dust (crusher dust) blended with refined clay were used here. The crusher dust was also washed over a 75 µm sieve to separate the larger particles. The water was collected and stored for 7 days to allow the fines to settle, then the fines were collected and dried in a 100°C oven for 48 h. The resulting fines were used as very low plasticity fines. To manufacture the samples of the three gradations, each particle size was blended by weight to the target gradation by following the nominated gradation curves. Then, the fines were added to meet the target gradations. Figure 2 shows the gradation combinations used in this study, where GH1, GH2, and GH3 represent hornfels blends with G1, G2, and G3 gradation limits, respectively, and the same applies to basalt blends. It is worth noting that the PI values of all blends are between 2 and 4, which meets VicRoads specification in relation to PI for mixes used in bases of sealed heavy-duty bases. The reason for controlling the PI values is to better evaluate the effect of gradation alone.

Engineered gradations used in this study.
Experimental Methodology
Modified Compaction Test
To determine the moisture-density relationship, modified compaction test was conducted following the Australian Standard 1289.5.2.1 ( 26 ). It should be noted that each sample was compacted in five layers in a 105 mm diameter by 115 mm high mold with the application of 25 blows per layer. No curing time was required, before compaction, as the blends used in this study are low in plasticity.
California Bearing Ratio (CBR) Test
The CBR test is a widely used empirical penetration type test for aggregates and construction materials. It can be carried out on most types of soil ranging from medium material of gravel size to heavy clay ( 27 , 28 ). CBR tests were performed in accordance with Australian Standard 1289. 6.1.1 ( 29 ). Each specimen was compacted into the mold in five layers, each with 55 blows at their optimum moisture content (OMC) to target density of 100% maximum dry densities (MDD). The testing specimens were immersed in water for 4 days to simulate the likely worst case in-service scenario for a pavement. While soaked in water, readings from a linear variable differential transformer (LVDT) were taken every 24 h to use in determining the swelling as a percentage.
Unconfined Compressive Strength (UCS) Test
The UCS test is commonly used as a key design index parameter for estimating the stiffness of pavement material used in mechanistic pavement design methods. UCS tests were carried out in accordance with Australian Standard 5101.4 ( 30 ). All specimens were compacted using modified compaction effort in five layers, each with 25 blows at their OMC to target density of 100% MDD. Six specimens per mixture were prepared for the UCS test. Subsequently, three specimens were tested immediately after compaction and the other three specimens were left to dry-back at room temperature of 25°C ± 2°C until they reached 65% OMC. Drying back granular bases of sealed pavements to between 60%–70% OMC has become a common practice in Australia to avoid premature failure ( 31 ). The specimens were prepared at 100% OMC then wrapped, except the top surface, and their weights were recorded. The wrapped specimens were left to dry at room temperature and their weights were monitored until they reached their estimated weight at 65% OMC.
Repeated Load Triaxial (RLT) Test
The repeated load triaxial (RLT) test was conducted to determine the MR and permanent deformation for all blends. This test is designed to simulate traffic wheel loading on pavement layers by applying a sequence of cyclic loadings. The equipment is capable of applying both confining and cyclic deviatoric stresses simultaneously, and it permits the measurement of axial and radial strains, which provides an understanding of materials’ behavior ( 32 ).
The MR test was carried out following AASHTO T307 ( 33 ). The testing specimens were placed, in eight layers, in a split mold (100 mm in diameter by 200 mm in height) each with 25 blows at their OMC to target density of 100% MDD. Two specimens were tested immediately after compaction and the other two were left to dry-back at room temperature of 25°C ± 2°C until they reached 65% OMC.
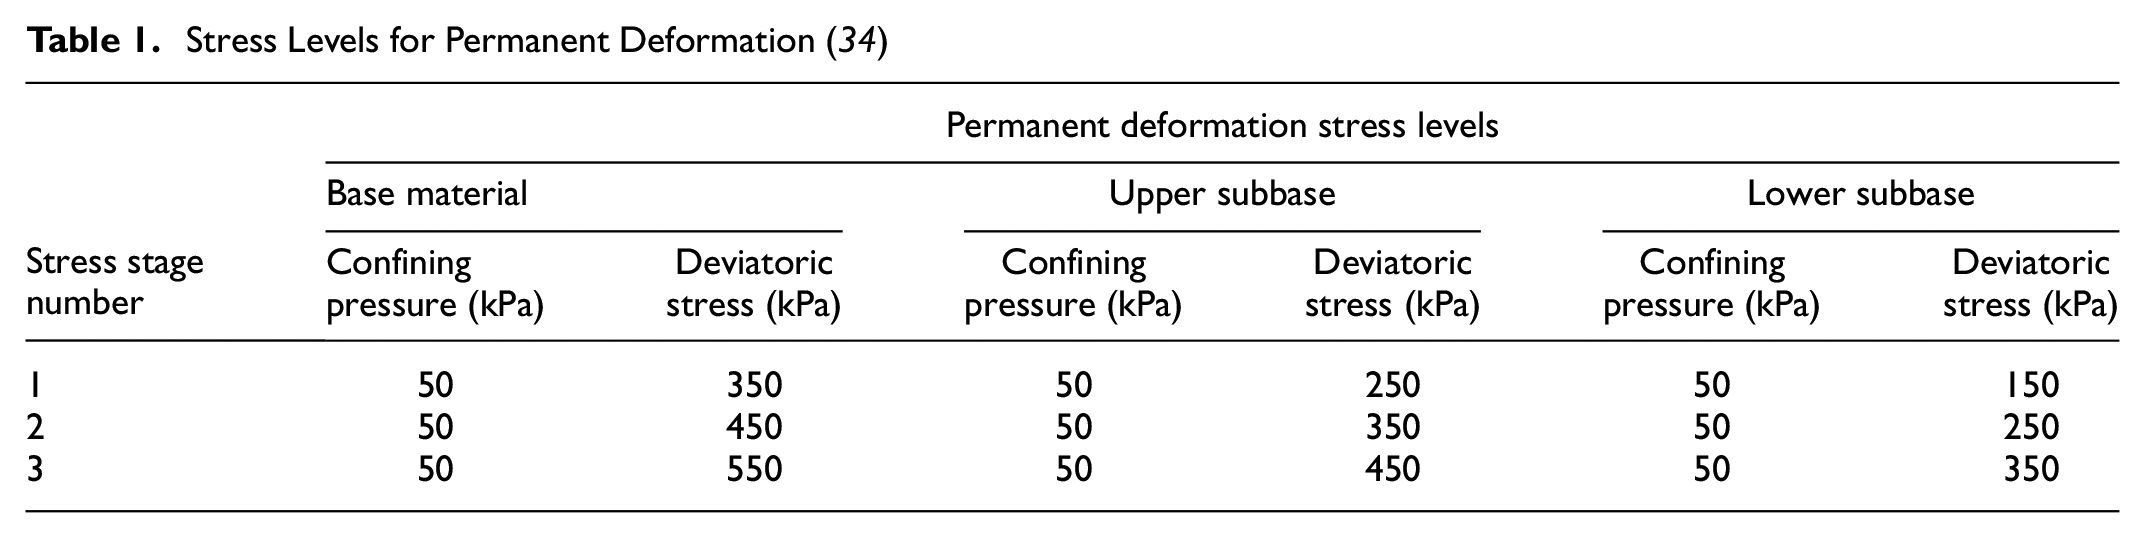
Permanent deformation tests were conducted in accordance with Australian test procedure outlined in AG: PT/T053, which is similar to AASHTO T307 except for differences in stress conditions ( 33 , 34 ). The same sample preparation used in preparing the MR specimens was used here (i.e., same specimen dimensions and compaction effort). The specimens were loaded with three different stress stages. Each stage included 10,000 cycles of loading at specified confining stress and repeated deviator stress as described in Table 1. In this study, considering types of the used materials, the levels of deviatoric stresses and confining pressure used are those related to the “base material” in Table 1.
Stress Levels for Permanent Deformation ( 34 )
Results and Discussion
Maximum Dry Density (MDD) and Optimum Moisture Content (OMC)
The MDD and OMC values obtained for each aggregate type and gradation used in the current study are presented in Figure 3. It is evident from Figure 3 that, for both aggregate types, the medium gradation blends (GH2 and GB2) produced higher MDD values than the finer and coarser gradation blends. In general, there is a slight increase in MDD as the blends move from coarse to medium gradation, then followed by a slight reduction in MDD as the blends move from medium to fine gradation. For hornfels, MDD value of GH2 was 2,360 kg/m3 compared with 2,330 and 2,323 kg/m3 for both GH1 and GH3, respectively. Further, these values for the same gradation of crushed basalt were 2,329 kg/m3 for GB2, and 2,283 kg/m3 and 2,285 kg/m3 for GB1 and GB3, respectively. This trend could be because the presence of smaller particles in a gradation allows for increased particle packing, which leads to a reduction in the void ratio and an increase in density. Further, if fine particles continue to increase, the coarse particles will “float” in the fine matrix which decreases the density, as the specific gravity of large particles is higher than small particles. The variation between MDD values of the two materials for the same gradation could be explained by the differences in their FI (18 for hornfels and 4 for basalt), where the voids decrease with higher FI, and, therefore, the mixture’s density increases ( 35 ).

Dry density-moisture content relationship: (a) hornfels and (b) basalt.
Further, the results show that, for all samples of the two material types, the changes in OMC values are of a small scale. In general, slightly more water was required to achieve MDD in finer specimens, except for GH2 which required slightly less water than GH1, likely because of experimental conditions, as the variation is barely noticeable. The differences in OMC between the two aggregate types could be attributed to the differences in their water absorption.
California Bearing Ratio (CBR)
To evaluate the influence of gradation on the soaked bearing capacity, two or three specimens per gradation per material were prepared and tested for the CBR test. The swelling measurement revealed that volume swelling induced by soaking is 0%, as the blends are very low in plasticity. After the completion of tests, the stress-strain curves were corrected as they had a concave upward shape. Then the values at both 2.5 mm and 5.0 mm penetration were recorded and used to determine CBR values, with the larger value for each sample used as the CBR value for the mixture. A summary of corrected maximum CBR values for each gradation of both tested materials is presented in Figure 4.
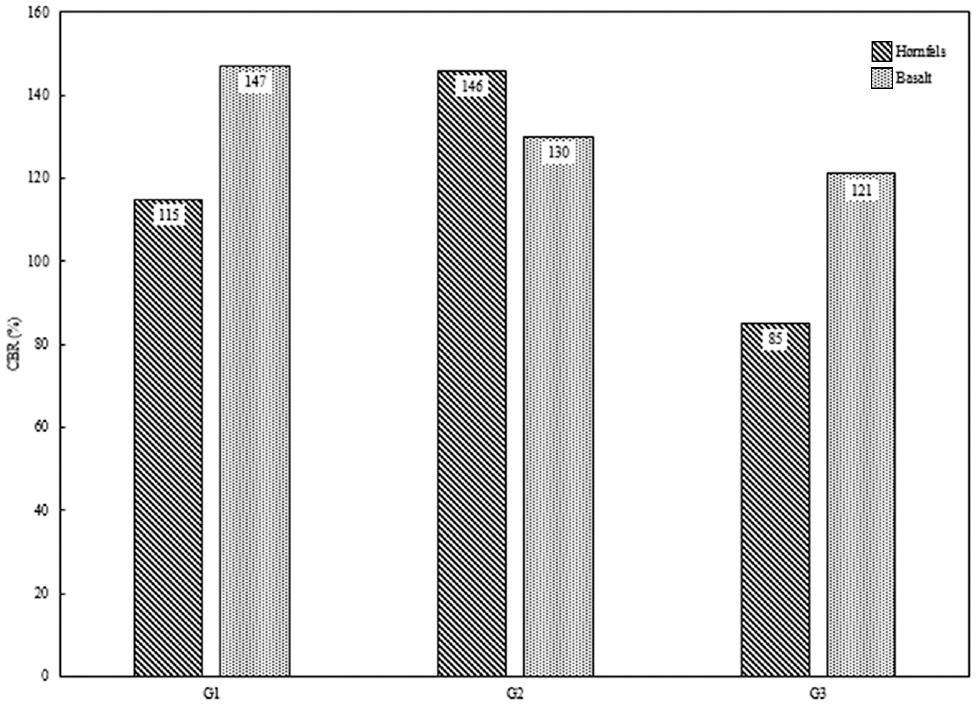
California bearing ratio (CBR) test results.
The results indicate that gradation has a great effect on CBR values. For crushed hornfels, as the gradation changes from coarse to medium, the CBR increases, and then decreases with the finer gradation. This trend could be because GH1 has high voids within the aggregate skeleton, and, as the gradation becomes finer in GH2, most voids are filled with the finer particles, therefore increasing the inter-particle friction, which improves aggregate bearing capacity. However, GH3 has a lower bearing capacity than the coarser mixes, which could be because increased fines particles above the optimum reduces the interactions of coarse particles and results in a looser aggregate skeleton. For crushed basalt, a continuous decrease in CBR values is observed as the gradation changes from coarse to fine which could be related to its low FI, that is, has higher voids than hornfels for same gradation. Increased fines content fills up more voids and reduces the interaction of coarse particles.
Except for the medium gradation, crushed basalt exhibits higher soaked CBR values than crushed hornfels. In addition, strength decrease from medium to fine gradation in crushed hornfels is more significant than in crushed basalt. This is related to the fact that crushed basalt has lower FI, that is, angularly grained with better mechanical interlock and particle-to-particle contact in the aggregate skeleton.
Unconfined Compressive Strength (UCS)
The UCS test is a cheap and straightforward method of measuring the shear strength of pavement materials. It is commonly used for stabilized and cemented materials, but it has been used in this study to investigate the effect of gradation on compressive strength at different moisture conditions of unbound granular materials. Two moisture conditions were used here, that is, 100% OMC and 65% OMC after dry-back.
The UCS test results for all samples of both materials at both moisture conditions are presented in Figure 5. The results indicate that the highest UCS values for crushed hornfels at 100% OMC are for GH2 gradation, with 180 kPa. Further, UCS values of all three gradations are much higher when tested at 65% OMC, with the highest being GH2 with 690 kPa. This mixture also had the highest bearing capacity of all hornfels mixes. This trend is similar to that of CBR results where UCS values increased from GH1 to GH2 then reduced from GH2 to GH3 under both testing conditions. Basalt samples showed similar trends in both testing conditions, with GB2 having the highest value at 65% OMC. Except for GB2 at 100% OMC, samples of crushed basalt have higher UCS values than hornfels of the same gradation in both testing conditions; however, the changes in UCS values between the different gradations are much lower than hornfels.
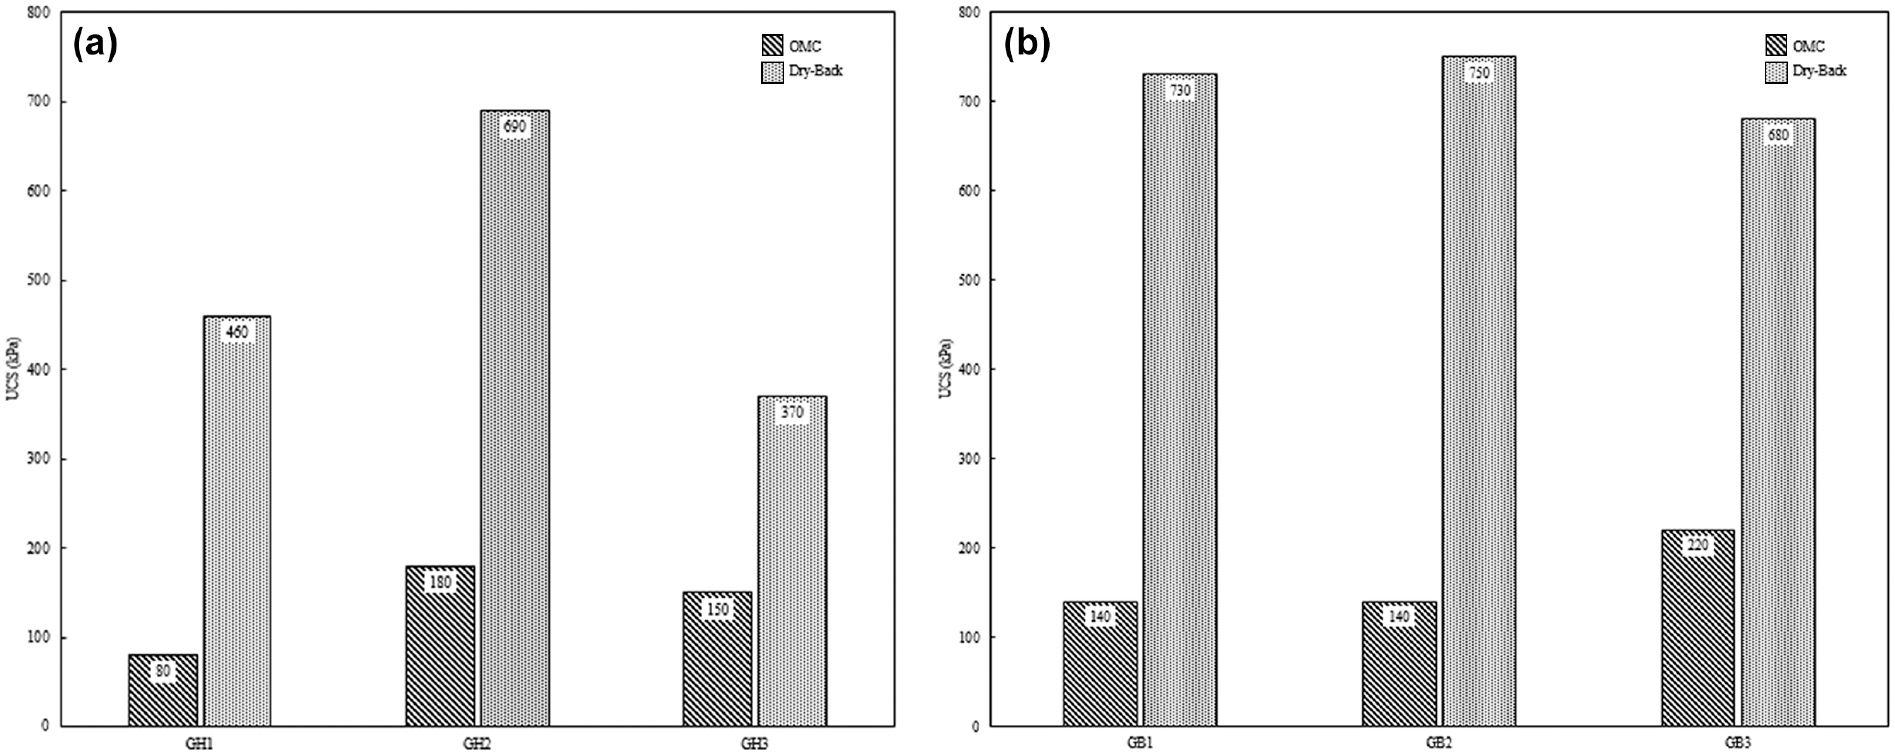
Unconfined compressive strength (UCS) testing results: (a) crushed hornfels and (b) crushed basalt.
Resilient Modulus (MR)
To successfully characterize flexible pavement materials using a mechanistic approach, MR values obtained from RLT test are required ( 36 ). Fifteen stress stages with different deviatoric stresses and confining pressures were used to assess the elastic condition of testing samples. Figures 6–9 present the deviatoric stresses and corresponding confining pressures used in the 15 stages of the RLT test and the associated MR values for the tested samples. The MR values are presented on the left vertical axis (i.e., primary vertical) and the stress stages (confining and deviatoric stresses) are presented on the right vertical axis (i.e., secondary vertical). The concept of obtaining the MR at different confining pressures is that pavement materials experience different levels of traffic wheel loading, as well as confining stress, based on their positions with the pavement structure.In general, the figures indicate that MR values of all blends are influenced by the variations in confining pressures and deviatoric stresses.
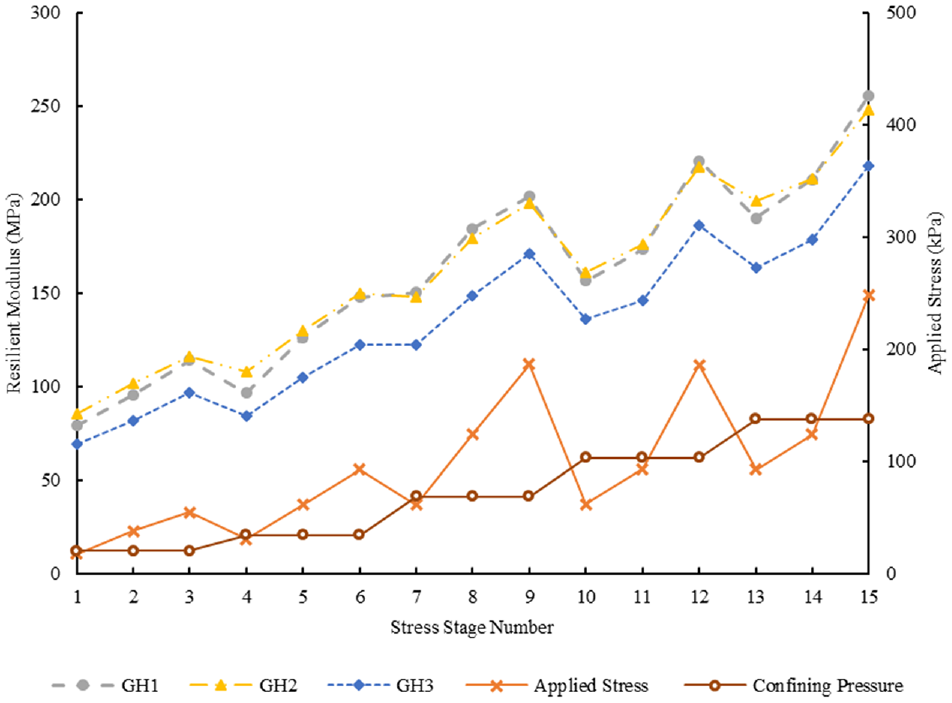
Resilient modulus (MR) testing results for crushed hornfels at optimum moisture content (OMC) condition.
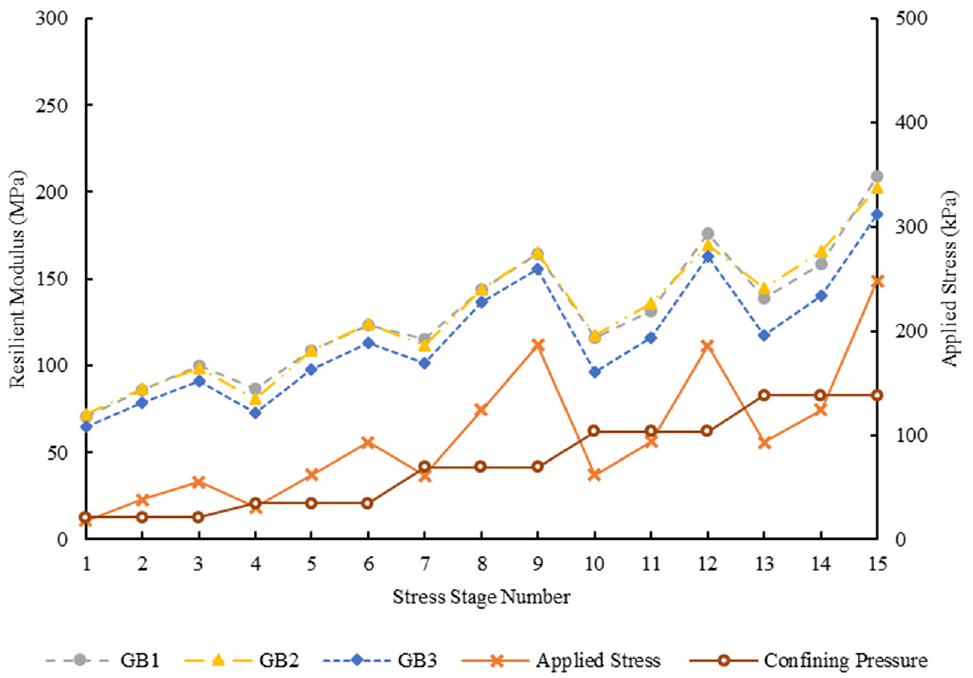
Resilient modulus (MR) testing results for crushed basalt at optimum moisture content (OMC) condition.
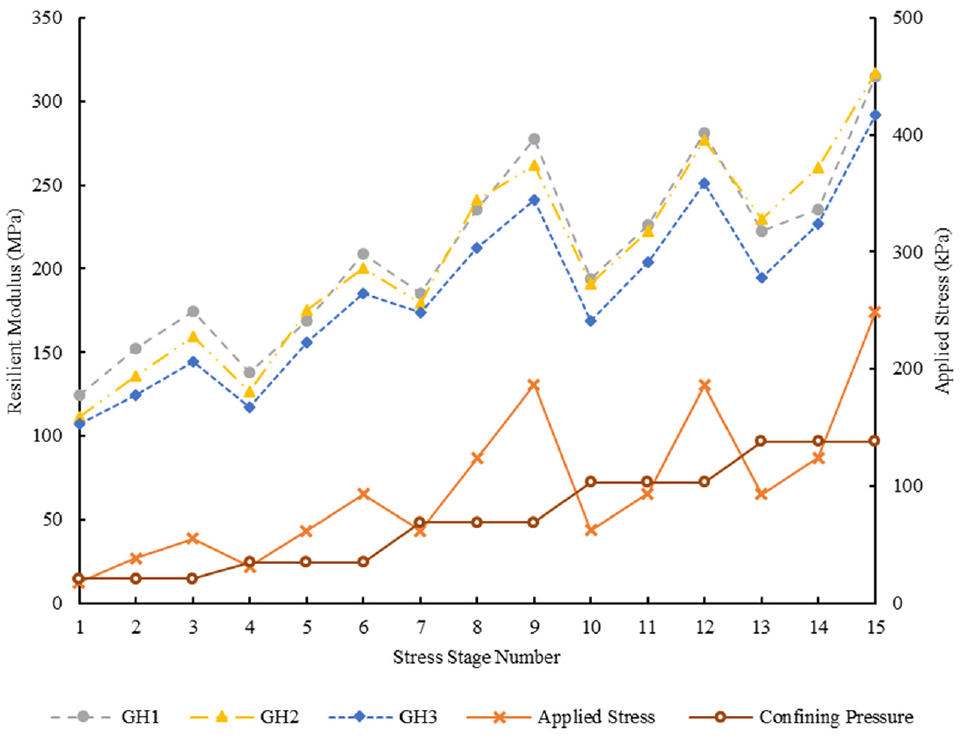
Resilient modulus (MR) testing results for crushed hornfels at dry-back condition.
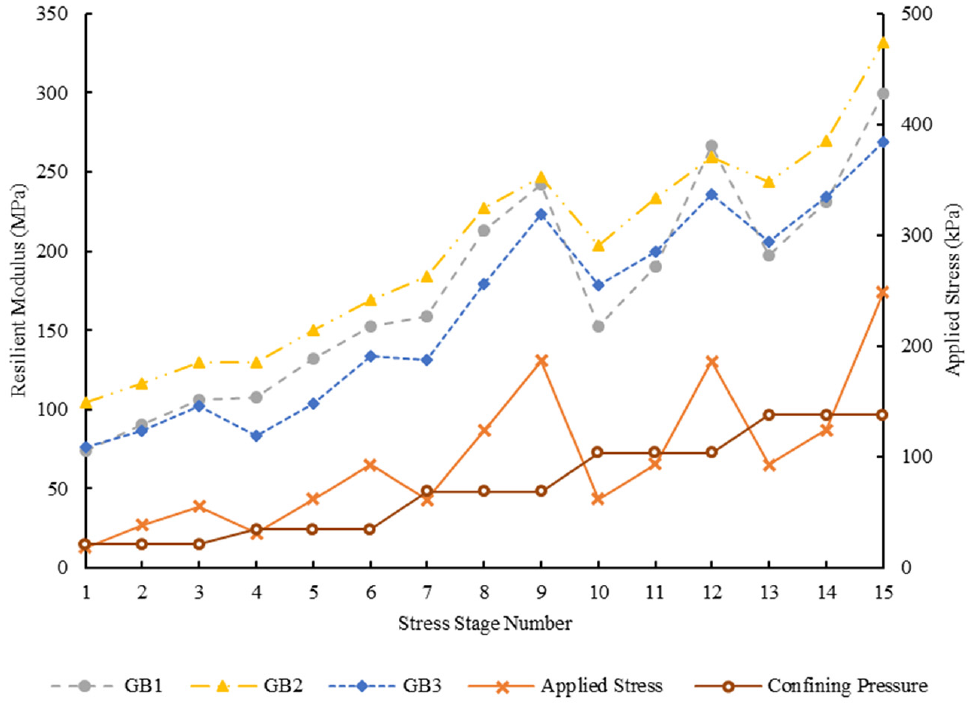
Resilient modulus (MR) testing results for crushed basalt at dry-back condition.
Figures 6 and 7 show the MR for all mixtures of the three gradations of the two crushed rock sources at OMC condition. The graphs indicate that the trend of variation in MR for all samples follows the applied deviatoric stresses and confining pressures. For both crushed rock types, the samples of GH1, GH2, GB1, and GB2 have close MR values, then followed by GH3 and GB3 having lower MR values at all deviatoric stresses and confining pressures. The MR values for both materials are very close for the same gradations, with hornfels having slightly higher values than basalt.
Figures 8 and 9 show the MR values for the same materials and gradations after drying-back the specimens to 65% OMC. For crushed hornfels, the results indicate that GH1 and GH2 have close MR values with the second being higher at most loading stages, followed by GH3 being the lowest. However, for crushed basalt, GB2 has the highest MR values, followed by GB1 then GB3 being the lowest. The differences between MR values are more evident (higher variation between samples) and their values are higher than corresponding samples tested at OMC. It can be also noticed that MR values for all blends after dry-back to 65% OMC increase when either the deviator stress or confining pressure is increased.
In general, at OMC moisture condition, moving toward finer gradation is associated with a reduction in MR values. However, G1 and G2 have close values, as higher water content (i.e., OMC) has the same effect on these two gradations. However, at 65% OMC, commonly used in practice, G2 showed higher MR values compared with the other two gradations.
Statistical analysis was conducted to evaluate the statistical significance of the effect of different gradations on MR values for the two materials. The T-test was used here, with a 95% confidence level. The analysis was performed using IBM Statistical Package for Social Sciences (SPSS) statistics 26 software. The MR values at all deviatoric and confining stresses for G1 were compared with the MR values for G2 and G3, and MR values for G2 were compared with the MR values for G3 at both moisture conditions. The analysis showed that the t value for all gradations is below 2 and the p value is higher than 0.05, which indicates that the differences between MR values of G1 and G2, G1 and G3, and G2 and G3 are not statistically significant. However, because of the small sample size and the small effect of gradation on MR which also depends on the level of applied stresses, the Cohen’s d effect size was calculated for each case to evaluate the level of gradation effect ( 37 ). The calculation showed that the difference between G1 and G2 in relation to the median MR is very small. While the differences in MR between G1 and G3, and G2 and G3 fall between small to medium effects.
Modeling of Resilient Modulus (MR) Test Results
Among several stress-based models available for characterizing the resilient response of unbound granular materials, two commonly used and relatively simple models are considered in this study as detailed below.
Bulk Stress Model
The bulk stress model (model 1 as shown in Equation 1), referenced by Hicks and Monismith, is also recommended in the AASHTO Guide ( 17 , 38 ). The major limitations of the bulk stress model are that separating the confining and deviatoric stress effects on MR and allow it to only represent a very limited range of stress paths, and thus it is expected to give erroneous results ( 39 ). A logarithmic variation was assumed on both sides of Equation 1 to change it into a linear form as shown in Equation 2.


where
MR = resilient modulus;
θ = bulk stress = σ1 + σ2 + σ3 = 3σ3 + σd (for triaxial test);
σ 1 = major principal stress;
σ 2 = intermediate principal stress;
σ 3 = σ2 = minor principal stress = confinement pressure;
σ d = deviatoric stress;
k 3, k2, and k5 = model coefficients.
The present aggregate research results were analyzed with Microsoft Excel to determine both log k1 and k2. Figure 10 presents the positive linear trends between log MR and log θ for samples of both materials under both moisture conditions. The model parameters log k1, k2, and the coefficient of determination values are presented in Table 2.
Bulk Stress Model Regression Coefficient

Note: GH1, GH2, and GH3 = hornfels blends with G1, G2, and G3 gradation limits, respectively; GB1, GB2, and GB3 = basalt blends with G1, G2, and G3 gradation limits, respectively; MAD = mean absolute deviation; MAPE = mean absolute percentage error.
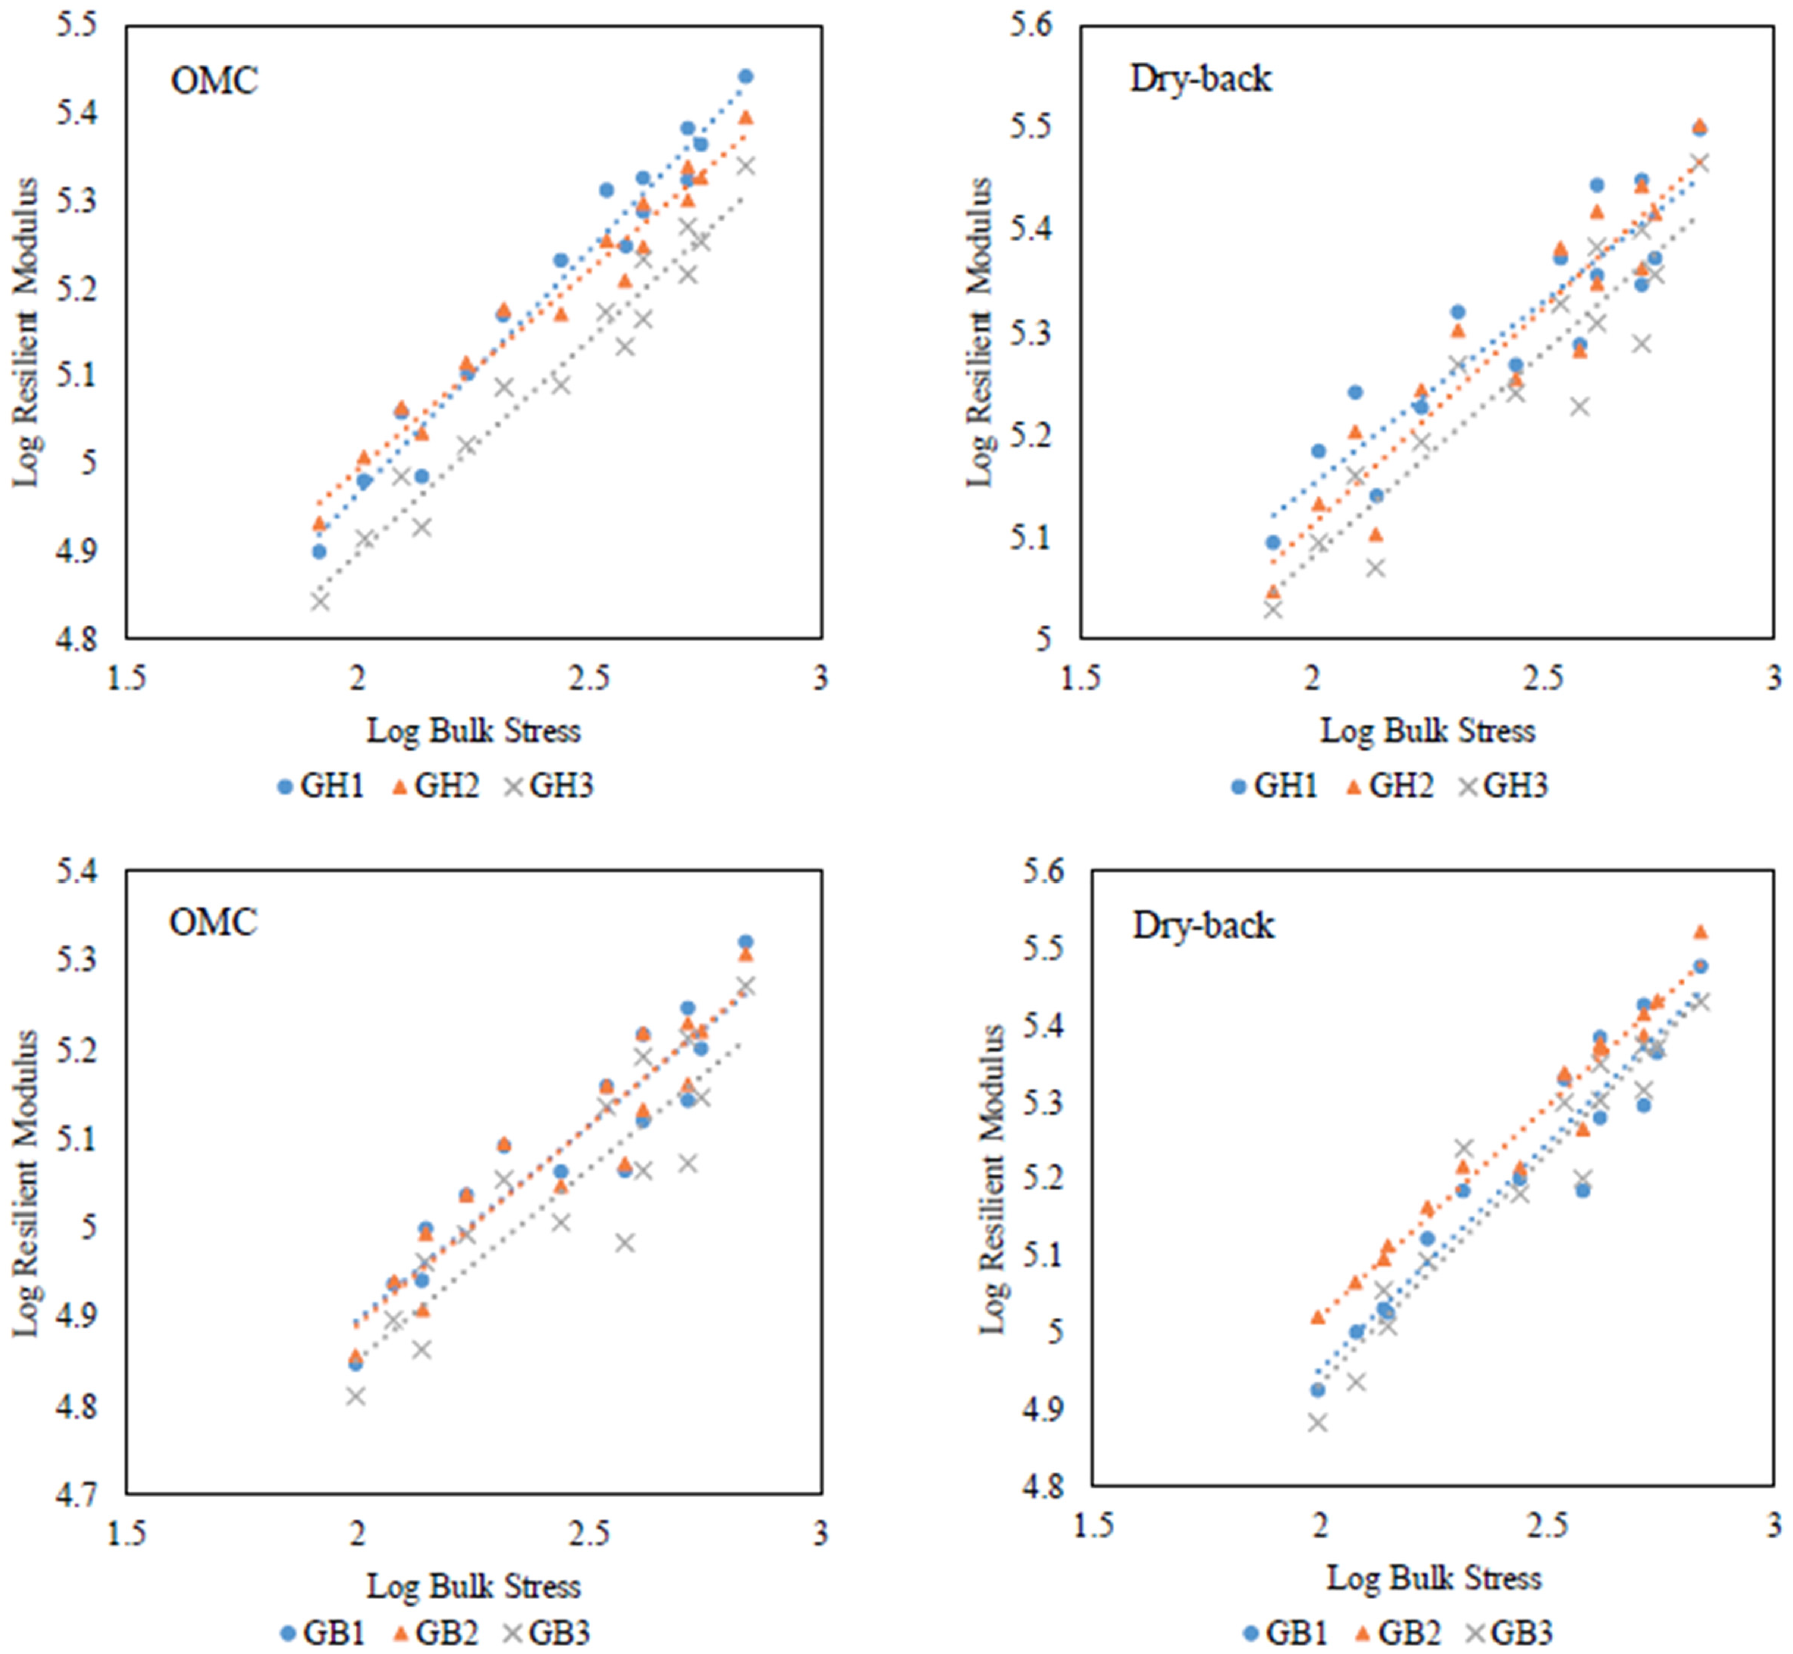
Log resilient modulus (MR) versus log bulk stress plots for both materials at both moisture conditions.
The constant parameter, log k1, which is MR magnitude indicator, varied from 3.86 to 4.09 for crushed hornfels with GH2 having the highest value at OMC moisture condition, and it varied from 4.28 to 4.44 with GH1 having the highest values at the dry-back condition. For crushed basalt, log k1 slightly varied from 4.00 to 4.02 with GB1 having the highest value at OMC moisture condition, while it varied from 3.74 to 3.93 with GB2 having the highest value at dry-back moisture condition. The k2 parameter, which represents the nonlinear nature of stress dependency, varied from 0.42 to 0.55 for both materials at OMC moisture condition, and at dry-back moisture condition, it varied from 0.36 to 0.60 for both tested materials. These results indicate that there are no clear trends to observe concerning the effects of differences in gradation on the model’s parameters.
The coefficient of determination values for all samples, when analyzed using the bulk stress model, are above 0.80, suggesting a fair fit is obtained using this model. To assess the statistical significance of modeling results, the mean absolute deviation (MAD) and the mean absolute percentage error (MAPE) were calculated and presented in Table 2. The MAD value is in MPa as it follows the sample predictor scales. The result shows that the MAD for the tested samples can reach up to 54 MPa, which means the model’s predictions can be margined up to 54 MPa. Further, there is the MAPE value, which expresses the error as a percentage; for the predicted values, the MAPE values reached up to 47%, suggesting some model results are off by nearly 47%.
Three Parameter Model
Owing to the limitation in separating the deviatoric and confining stress effects in the two-parameter model, the three-parameter model is also considered for the analysis. The three-parameter model (model 2 as shown in Equation 3), introduced by Puppala et al., is based on confining and deviatoric stresses and is being used by several road agencies ( 40 ). A logarithmic variation was assumed on both sides of Equation 3 to change it into a linear form as shown in Equation 4.


where
MR = resilient modulus;
σ atm = atmospheric pressure;
σ 3 = confining stress;
σ d = deviatoric stress;
k 3, k4, and k5 = model coefficients.
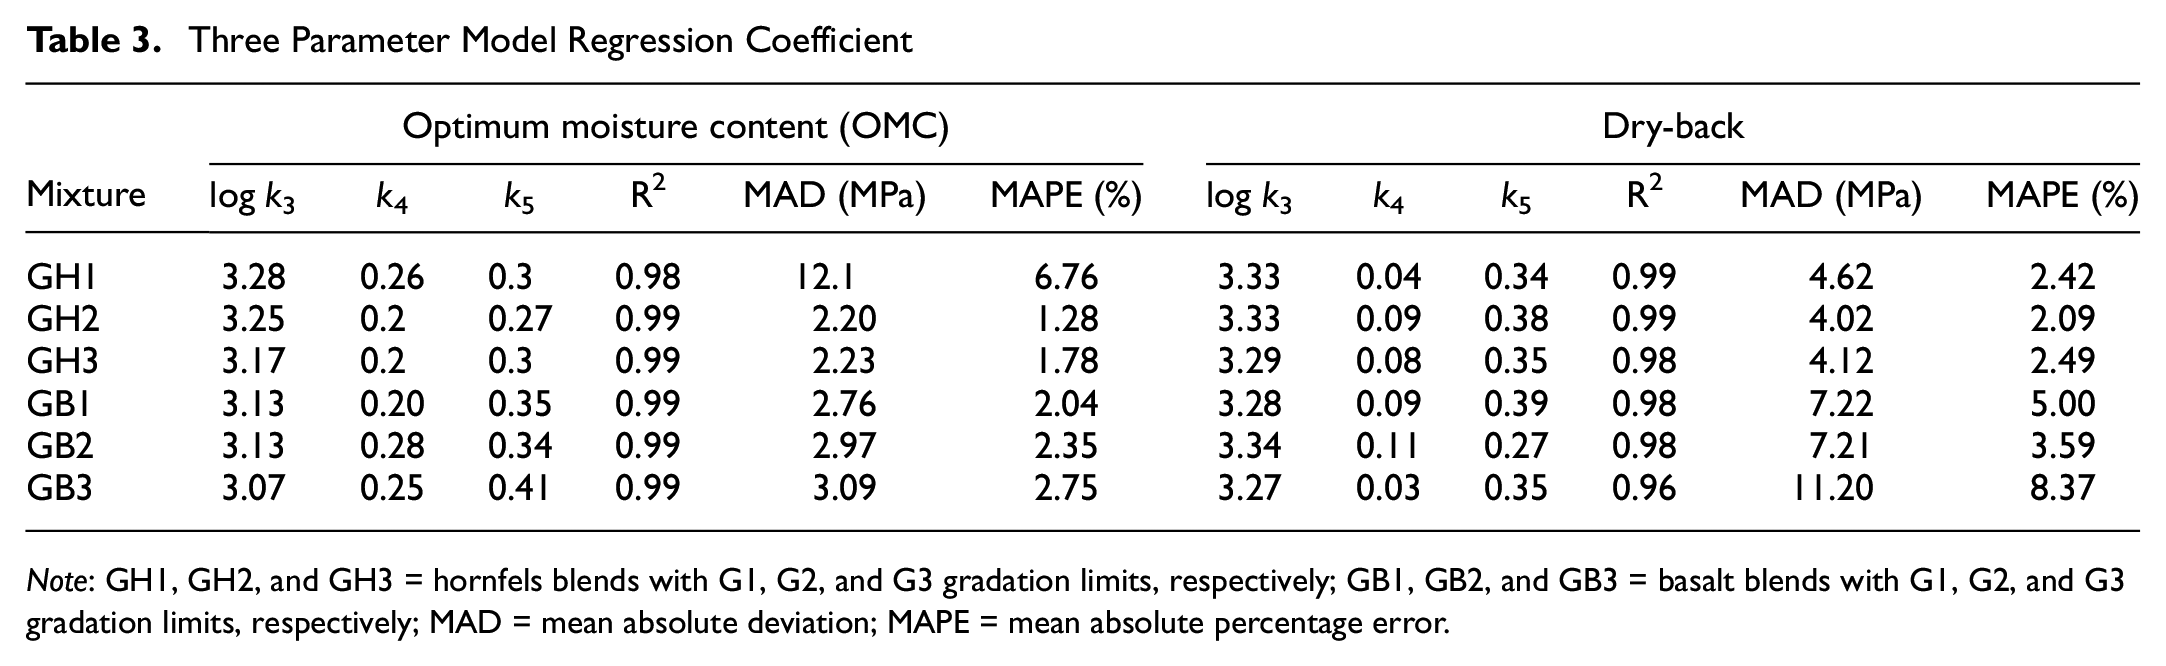
Multiple linear regression was used to analyze the test results because this model has more than one parameter. Table 3 presents the regression analysis results including model constant parameters and coefficient of determination values.
Three Parameter Model Regression Coefficient
Note: GH1, GH2, and GH3 = hornfels blends with G1, G2, and G3 gradation limits, respectively; GB1, GB2, and GB3 = basalt blends with G1, G2, and G3 gradation limits, respectively; MAD = mean absolute deviation; MAPE = mean absolute percentage error.
Assessment of the regression results yielded the following observations:
Very high coefficient of determination values > 0.96 for all samples indicating a very good fit was obtained using this model.
Statistical significance analysis showed very low MAD values < 12 MPa for all samples indicating very low margins and very low MAPE percentages < 12% indicating a very small prediction error. Those values indicating a better fit than the bulk stress model.
The constant parameter of the model correlation, log k3 (which represents the MR magnitude), varied from 3.07 to 3.28 for both crushed rock types at OMC, with high values obtained for the coarse gradations GH1 and GB1 and low values obtained for the finer gradations GH3 and GB3. After dry-back to 65% OMC, higher log k3 values were obtained and ranged from 3.27 to 3.34 with GH3 and GB3 having the lowest values again.
The k4 parameter, which represents confining pressure dependency, did not follow a clear trend. However, its values decrease when the samples are dried back to 65% OMC. This is because the effect of confining pressure would be small when the material is already dry and stiff.
The k5 parameter, on the other hand, did not follow a clear trend at any gradation or moisture condition. However, it is positive, which indicates a stress hardening in all tested mixtures. This is expected, as the unbound granular materials tend to undergo stress hardening phenomenon, that is, an increase in MR with the increase in deviatoric stress under constant confining pressure ( 41 , 42 ).
Permanent Deformation
The permanent deformation test characterizes the vertical permanent strain with multiple loading stages. Three different deviator stresses (350 kPa, 450 kPa, and 550 kPa) were used and each loading stage involved 10,000 repetitions. Confining stress of 50 kPa was applied for all loading stages. The permanent deformation test is very expensive and time consuming, therefore limited specimens were tested here. For hornfels blend, two specimens were prepared for each gradation with one specimen tested at OMC and the other tested at 65% OMC. In general, the permanent deformation test should be conducted after drying-back the samples to specific moisture content to simulate actual conditions in practice. However, the OMC condition used here was to find the effect of gradation on permanent deformation, under different moisture conditions. Figure 11 indicates that the permanent deformation for all hornfels samples at OMC condition is very high, exceeding 6% in stage 2, and the samples broke down at stage 3 before completing the 30,000 cycles. Therefore, for crushed basalt, one specimen for each blend was prepared and air dried-back to 65% OMC.

Permanent deformation test results for crushed hornfels at optimum moisture content (OMC).
The relationship between permanent axial deformation and loading cycles of crushed hornfels and crushed basalt at dry-back moisture condition are plotted in Figures 12 and 13, respectively. It is clear that all samples experienced high initial permanent strain in the first stage, followed by an increase of permanent strain at a low rate. Further, in the second and third stages, samples underwent a small increase in permanent strain in the first few loading cycles which was followed by a slow or constant strain rate with higher strain values than the first stage.
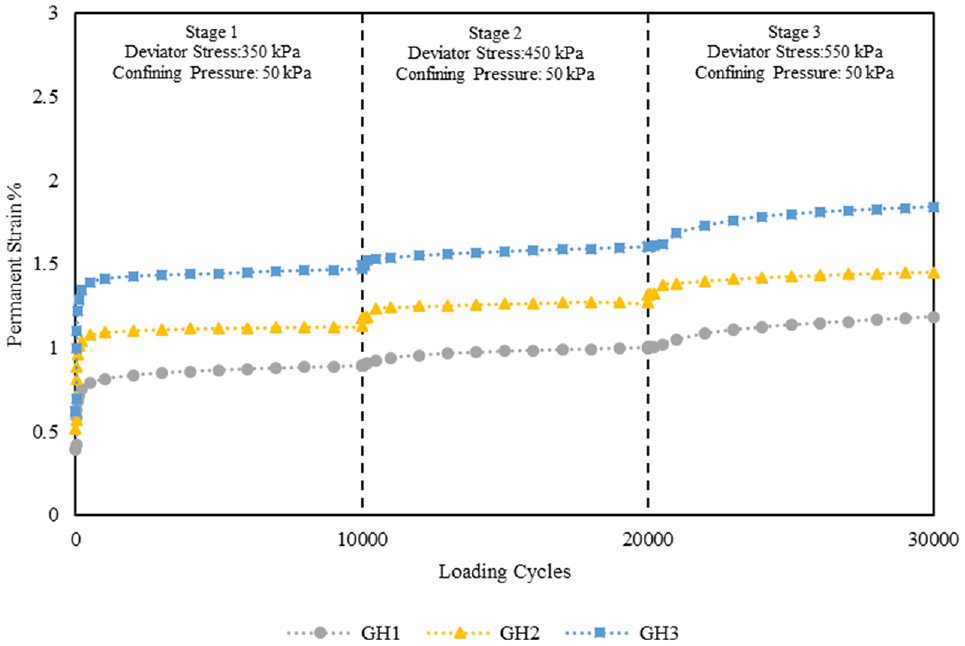
Permanent deformation test results for crushed hornfels at dry-back moisture condition.

Permanent deformation test results for crushed basalt at dry-back moisture condition.
Figure 12 indicates that the permanent strains for crushed hornfels of the three gradations are less than 2% and increase from GH1 to GH2 with GH3 mix having the highest permanent strain. For crushed basalt, Figure 13 indicates the same observations as hornfels where permanent deformations for all gradation are less than 2% with the coarse gradation GB1 having the lowest permanent strain followed by GB2 and GB3. The results reveal that GH1 and GB1 crushed rock mixes with Cc = 2.93 and Cu = 38.9 have the lowest permanent deformations (best performance) which indicates that the coarser gradation provides better plastic strain resistance.
Strain values of basalt mixes at the three stages are lower than the corresponding hornfels mixes. The differences in permanent strain between the two materials tested for the same gradation are attributed to the differences in particle shape. Crushed basalt mixtures had slightly higher resistance to permanent deformation, even when the MDD of crushed hornfels was higher than basalt mixtures of the same gradation. This may be explained by the differences in their FI, as this factor influences the internal friction in the material, where higher internal friction causes higher resistance to permanent deformation. In other words, higher FI reduces the ability of the aggregate mixture to recover under the loading action because of the breakdown which develops “weaker transition zones” within the blends. Weaker transition zones can be defined as the inability of the aggregate structure to properly transfer or distribute the loads applied to the specimens and recover as soon as it is unloaded ( 43 ).
Despite the limited sample size, statistical analysis was conducted to evaluate the effect of different gradations on unbound granular materials’ permanent deformation. The results suggested that gradation has a significant effect on the permanent deformation as the t values were above 1.9 for all gradation. In addition, the Cohen’s d values indicates a very large effect size.
Modeling of Permanent Deformation Test Results
The purpose of modeling permanent deformation data is to help interpret the results from the RLT tests and understand how unbound granular materials’ gradation affects long-term performance. To help with addressing this objective, the permanent deformation data have been modeled in this study by calibrating two commonly used models as described below.
Ullditz Model
This model was first developed by Ullidtz and modified by Puppala et al. ( 44 , 45 ). This model takes into account the accumulation of plastic strain as a function of the number of load repetitions and the stress states as shown in Equation 5. A logarithmic expression of this model was used to make it linear and simplify its use, as shown in Equation 6.


where
ε p = cumulative plastic strain at N load repetitions;
σ oct = octahedral normal stresses equal to (σ1 + σ2 + σ3)/3;
σ atm = reference stress = atmospheric pressure;
N = number of load repetitions;
A, α, and β are constants
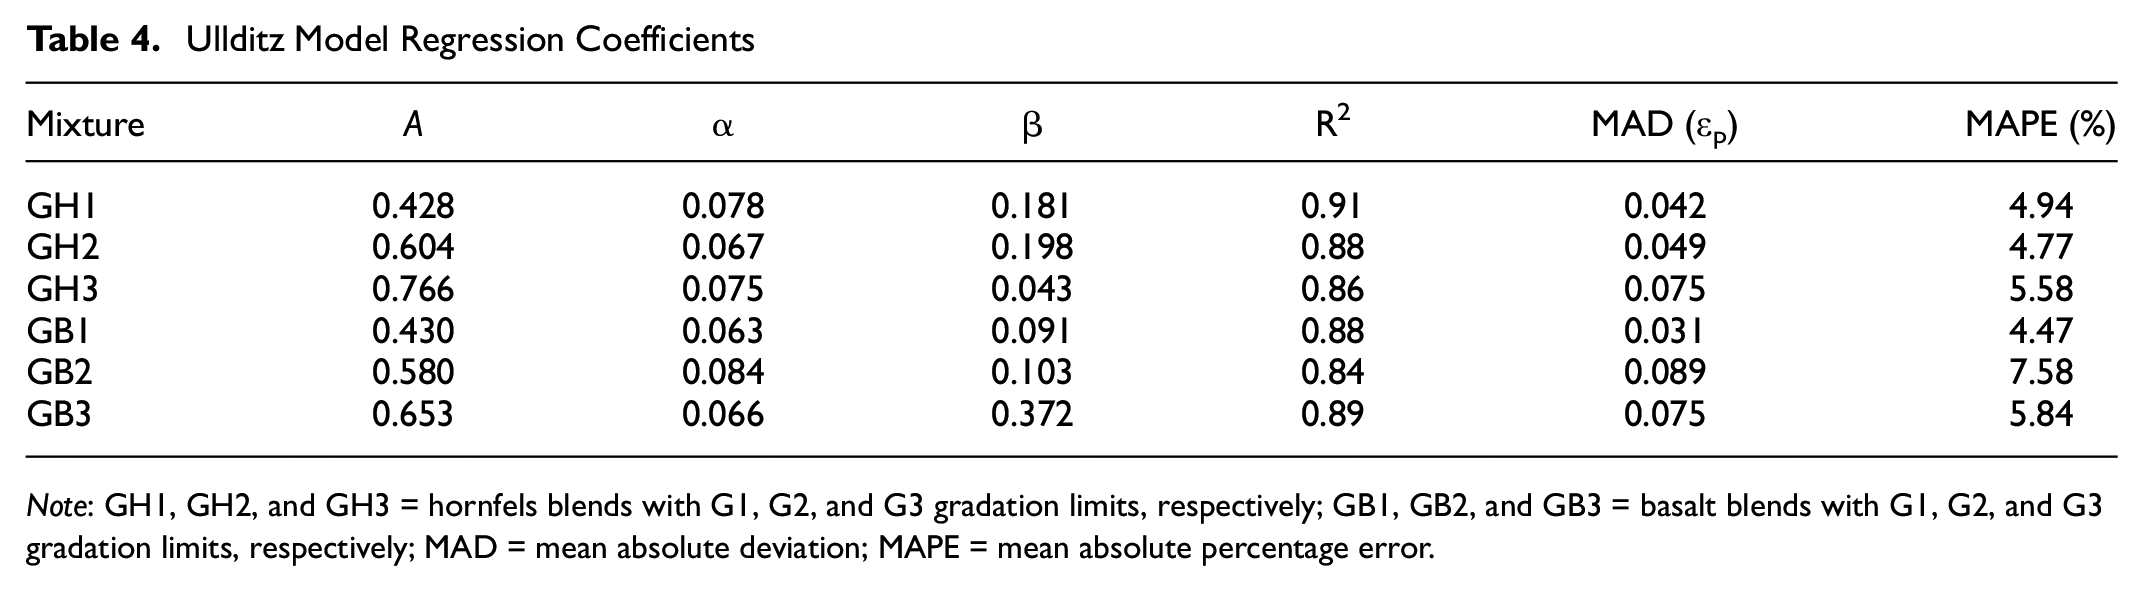
Substituting all data relevant to the cumulative permanent strain for each gradation for both tested materials together with the relevant stresses in Equation 6, it was possible to estimate (through Excel solver) the best combination (i.e., with the highest coefficient of determination, R2) of constants A, α, and β for each specimen of each sample. The results are presented in Table 4 for each gradation for both materials at dry-back condition, together with relevant R2 values. The lowest R2 value for all samples of both materials tested is 0.84, which indicates a good correlation exists between measured and predicted permanent strain values. Also, MAD and MAPE were calculated and presented in Table 4. The MAD value represents the differences in strain as it follows the sample predictor scales. The result shows that the highest MAD for the tested samples is 0.089, and the highest MAPE value is 7.5%, suggesting that results of this model can only be off by 7.5%.
Ullditz Model Regression Coefficients
Note: GH1, GH2, and GH3 = hornfels blends with G1, G2, and G3 gradation limits, respectively; GB1, GB2, and GB3 = basalt blends with G1, G2, and G3 gradation limits, respectively; MAD = mean absolute deviation; MAPE = mean absolute percentage error.
In Table 4, it can be observed that values of constant A, which represent the plastic strain magnitudes, are dependent on the mixture’s gradation and match the trend observed in Figures 12 and 13. For instance, the constant A varied between 0.428 and 0.766 for hornfels mixtures, with the lowest value of 0.428 being recorded for GH1, the coarse gradation. Also, for basalt mixtures, the A constant varies between 0.430 and 0.653, with the lowest being recorded for GB1. The constants α and β, which represent the power component of the number of load cycles and the power component of the applied octahedral stress, respectively, did not follow a clear trend. However, the results showed that both constants have positive values for all mixtures, which indicates that a mixture’s permanent deformation relies on the number of load cycles and the magnitude of applied stresses. Generally, it could be concluded that coarser gradations have a significant effect on reducing permanent deformation.
Puppala Model
The Ullditz model described above has a main limitation which is that the influences of deviatoric stress and confining pressure on the permanent strain are combined and not separated. Therefore, the Puppala model (four parameter strain model) was introduced by Puppala et al. ( 46 ). This model considers the effect of normalized normal octahedral stresses and octahedral shear stress along with the number of load applications, as described in Equation 7. A logarithmic expression of this model was used to make it linear and simplify its use, as shown in Equation 8.


where
The same method was used here to estimate the coefficient of determination (R2) and the constants α1, α2, α3, and α4 for each specimen of each sample. The R2 values, as shown in Table 5, were higher than the Ullditz model which indicates a better correlation between measured and predicted permanent strain values. Further, the MAD and MAPE values for the Puppala model are lower than their values when using the Ullditz model for the same samples, as shown in Table 5, indicating that the Puppala model has a better fit for the tested samples than the Ullditz model. The α1, which represents the magnitude of permanent strain, showed a similar behavior to the A constant in the previous model. It matches the results presented in Figures 12 and 13, as it decreases when the gradation changes from coarse to fine for both tested materials. The positive values of α2, which represents the influence of number of load cycles, almost indicates a steady behavior across the different gradations. The α3 and α4 results show that the permanent plastic strain is influenced by both octahedral and shear stresses in a nonlinear form with positive values recorded for the coefficient related to octahedral normal stress α3 and negative values recorded for the coefficient related to octahedral shear stress α4. This indicates that a decrease in octahedral normal stress and an increase in octahedral shear stress result in a reduction in permanent strain ( 46 ).
Puppala Model Regression Coefficients
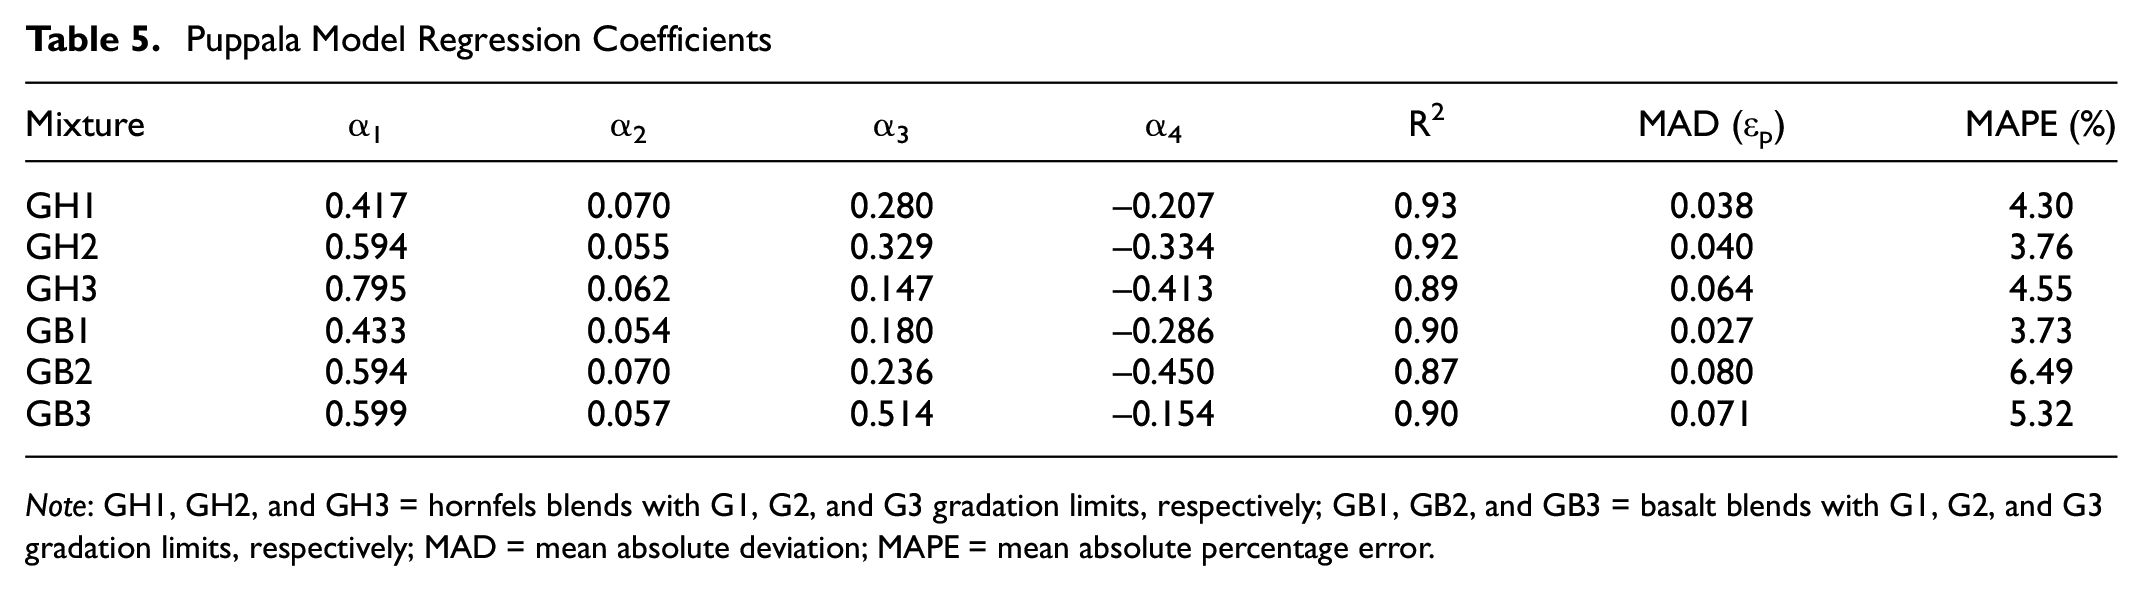
Note: GH1, GH2, and GH3 = hornfels blends with G1, G2, and G3 gradation limits, respectively; GB1, GB2, and GB3 = basalt blends with G1, G2, and G3 gradation limits, respectively; MAD = mean absolute deviation; MAPE = mean absolute percentage error.
Summary of Results
This paper presented findings from an ongoing research study to investigate the characterization of unbound granular materials that are commonly used in heavy-duty bases of sealed granular pavements in Victoria, Australia. This study aimed to investigate the effect of gradations within the acceptable limits specified by VicRoads for the above application. The first stage of the investigation involved manufacturing samples of two high-quality crushed rocks (hornfels and basalt) with three different gradations. These gradations, G1, G2, and G3, respectively, meet the lower, medium, and upper particle size distribution limits, specified by VicRoads for heavy-duty bases of sealed pavements. The second stage involved developing and conducting a comprehensive laboratory experimental testing matrix including MDD, OMC, CBR, UCS, MR, and permanent deformation. The findings of these tests provided further insight into the effect of materials’ gradations on the performance of unbound granular base materials in relation to bearing capacity, strength, elastic, and plastic deformation. A summary of these findings is presented below.
The medium gradation (GH2 and GB2) produced higher MDD values than the finer (GH3 and GB3) and coarser (GH1 and GB1) gradations.
The changes in OMC values with changing gradations are of a small scale. However, the differences in OMC values between the two aggregate types may be attributed to different water absorption properties.
In general, fine gradation mixes GH3 and GB3 had the lowest CBR values because of the increase in fines content which results in more spaces between coarse particles and, consequently, lower CBR values. However, GH2 had the highest CBR value of hornfels mixtures, while GB1 had the highest CBR value of basalt mixtures. These differences are attributed to the differences in coarse particle shapes (angular and flaky) between the two tested materials, which result in differences in ideal gradation that provides the best particle to particle interlock.
The variation in UCS results is of a very small scale, as all the tested mixtures are unbound and gain their strength through particle interlock. However, GH2 had the highest UCS values of hornfels mixtures, while UCS values for basalt mixtures were nearly the same when tested at 65% OMC.
At dry-back moisture condition, GH1 and GH2 had close MR values, and GH3 had the lowest MR at all deviatoric stresses and confining pressures. However, for crushed basalt rock, GB2 had the highest values, followed by GB1 then GB3. The results indicate that finer gradation produces lower MR values for all tested materials. According to these findings, G2 can be considered the ideal gradation for MR performance.
Permanent deformation test results showed that the coarse gradations GH1 and GB1 had the lowest permanent deformation compared with the middle and fine gradations. The fine gradations GH3 and GB3 had the highest permanent deformation among all gradations for both materials at dry-back moisture condition.
Calibration of existing models using testing results showed that the three parameter model yields higher accuracy compared with the bulk stress model in relation to MR predictions. Further, the Puppala model showed higher accuracy compared with the Ullditz model in relation to permanent deformation predictions.
Conclusion
This study focused on performance characteristic of unbound granular base materials with different gradations. A comprehensive testing program was conducted on two different materials at three different gradations each, which included compaction, CBR, UCS, and RLT tests. The UCS and RLT tests (which include MR and permanent deformation) were performed at two moisture contents, namely OMC and 65% OMC (dry-back). Also, a set of models was used to evaluate the MR and permanent deformation testing results. The results indicate that the gradation that provides the best characteristics varies depending on the type of material. For the materials and gradation limits used here, test results indicate that coarse and medium gradations provide the best characteristics in relation to CBR, MR, and permanent deformation, which are the most important performance measures. Further, fine gradations had acceptable characteristics, but they were low compared with other gradations. Therefore, the study recommends considering the gradation envelope between the coarse and medium limits when constructing a heavy-duty granular pavement base with thin bituminous surfacing.
Footnotes
Acknowledgements
The joint scholarship support provided to the first author by the Iraqi Ministry of Higher Education and Scientific Research and the Swinburne University of Technology is gratefully acknowledged. The support of VicRoads, the road authority in Victoria, by providing the crushed rocks and Claypro for this research project is also gratefully acknowledged.
Author Contributions
The authors confirm contribution to the paper as follows: Testing, Data curation and Analysis, and Writing: Ali Fouad; Supervision, Writing, Reviewing, and Editing: Rayya Hassan; Testing and Data Analysis: Abdulrahman Mahmood.
Declaration of Conflicting Interests
The author(s) declared no potential conflicts of interest with respect to the research, authorship, and/or publication of this article.
Funding
The author(s) received no financial support for the research, authorship, and/or publication of this article.
