



Abstract
Maintaining and enhancing the functionality of the infrastructure at an affordable cost are major challenges for decision makers, particularly given the need to cope with growing societal and transportation demands. This study introduces a systematic multi-criteria value engineering (VE) approach for the selection of a sustainable bridge system. A thorough VE analysis for a proposed long-span bridge in New Jersey, USA was carried out as a pilot study. The function analysis system technique was used to develop logical relationships between the project’s functions. A detailed 100-year life-cycle cost analysis (LCCA) was conducted. The study developed and evaluated eight alternative designs for deck and superstructure systems against set VE criteria comprising constructability, maintenance strategies, and environmental impact. A relative value index was used as an unbiased measure for the selection of the optimal structural system. With total savings of approximately 21% of the original design ($132.5 million), steel plate girders with a high-performance lightweight steel grid deck system have proven to “outvalue” the other alternatives, including the preferred preliminary alternative (PPA). Design engineers and decision makers can use this methodology as a systematic and convenient guide for the selection of economical and sustainable bridge systems. As such, it is necessary to re-evaluate the current practices and policies used for this purpose.
Keywords
Maintaining the functionality of bridges is vital for an efficient transportation system and for public safety. In 2019, the Federal Highway Administration (FHWA) reported that 46,163 bridges, with a total built area exceeding 231 million ft2, were structurally deficient. The condition of most of them is very poor to the point that they require replacement ( 1 ). The American Society of Civil Engineers (ASCE) suggests that nearly $4.6 trillion is needed by 2025 for this purpose ( 2 ).
In the past three decades, substantial implementation of value engineering (VE) has been embraced in construction and engineering applications to promote value ( 3 , 4 ). VE is a systematic planning process that has been proven to enhance the quality of projects and optimize their full value for societal growth through developing informed decision making. In 2019, approximately 800 approved VE transportation-related recommendations for federal infrastructure projects were reported. These recommendations collectively resulted in cost savings of approximately 10% ($3.1 billion) of the $32 billion total worth of the studied projects ( 5 ). However, bridge projects are lagging behind buildings and infrastructure in using VE as a rigorous decision-making tool. Federal regulations require VE studies to be performed for projects under the national highway system (NHS) with an estimated cost of $50 million and bridge projects exceeding $40 million ( 5 ). This mandate is created to motivate state departments of transportation (DOT) to apply VE practices to their projects and, thus, achieve the best value and minimize the life-cycle cost (LCC). However, the application of VE processes is fairly limited, at less than 7% of the total highway construction spending ($4.6 trillion) estimated by ASCE ( 2 , 6 ). Additionally, there is only limited dissemination and implementation of the techniques and results of VE studies which hinders knowledge transfer in transportation projects ( 7 , 8 ).
Fully embracing VE analysis in bridge design could enhance decision making and ensure high-quality construction. VE involves function analyses to determine the cost effectiveness of the proposed alternatives and subsequently their feasibility. This is attempted by meeting or exceeding the required functions of a project at a minimum cost ( 9 ). In this context, value improvement is achieved by promoting the function (performance) or reducing the cost, or both ( 10 – 12 ). The process can effectively integrate the sustainability attributes into the design phase and construction activities. Sustainability aspects related to bridge projects include emissions, energy efficiency, waste minimization, air and water quality, recyclable and renewable materials, durability, disposal aspects, low LCC, and user comfort.
It is the authors’ experience that the current VE application to bridge design selections is generally ad hoc with a salient subjectivity or preset strong preference. It is also the authors’ observation that the common VE practice lacks the integration of societal benefits, sustainability, and economic aspects into a systematic decision-making tool for selecting the most viable bridge design. This study attempts to fill the knowledge gap in using VE for bridge design to support optimal decision making. A robust multi-criteria VE methodology involving LCC analysis was carried out for an intended major bridge project in New Jersey, USA. Key technical and sustainability performance aspects of bridge design alternatives were considered in the VE analysis. A full preliminary design of the superstructure was performed for all generated bridge alternatives, which included a variety of steel and concrete bridge systems. The design and analysis associated with each alternative in this study exceed the typical level of detail required for VE purposes. The proposed methodology used in this study is rigorous yet simple and is a convenient way to support unbiased design decisions. As such, it is usable by engineers, researchers, and equally by governmental and private top management.
Scope and Criteria
The scope of VE analysis in this study is limited to the deck, superstructure, bearings, parapets, and wearing surface. The alignment and bridge geometry were maintained in all alternatives to the extent practicable. However, the profile and grades of the bridge were adjusted as needed to meet the vertical clearances dictated by the set marine navigation clearance and the touchdown elevations at the abutments. Combinations of superstructure and deck alternatives were investigated to determine the most economical span configuration. The pertinent performance and sustainable criteria in the VE analysis were set to avoid or minimize the potential environmental damage associated with building the proposed bridge. This includes a selection of more sustainable construction materials, reducing the footprint of the structure, the number of piers, shortening the construction schedule, reducing the risk of marine vessel collision, improving aesthetics, optimizing the durability of the structure, and reducing the frequency of maintenance.
Project Description
A long bridge is proposed to provide a direct link between the cities of Carteret Boro, Middlesex County, and Linden, Union County, as well as the New Jersey Turnpike (NJTP) (Figure 1). The bridge connects to the entire eastern seaboard via the interstate network. This is expected to enhance the current and future traffic conditions in the metropolitan region and ultimately improve regional economic development in northern New Jersey. The proposed Tremley Point Connector Bridge in New Jersey consists of a 1.1-mi-long roadway crossing the Rahway River. The Rahway River is a navigable river used for commerce regulated by the United States Coast Guard (USCG). The marine traffic in the area consists of seasonal use leisure vessels such as cabin cruisers, small motorboats, canoes, paddleboats, and sailboats ( 13 ). The intended bridge is located approximately 2,500 ft east of the NJTP which is a 122-mi-long expressway with a traffic count of 261 million vehicles, including 35 million commercial vehicles in 2019 ( 14 ).
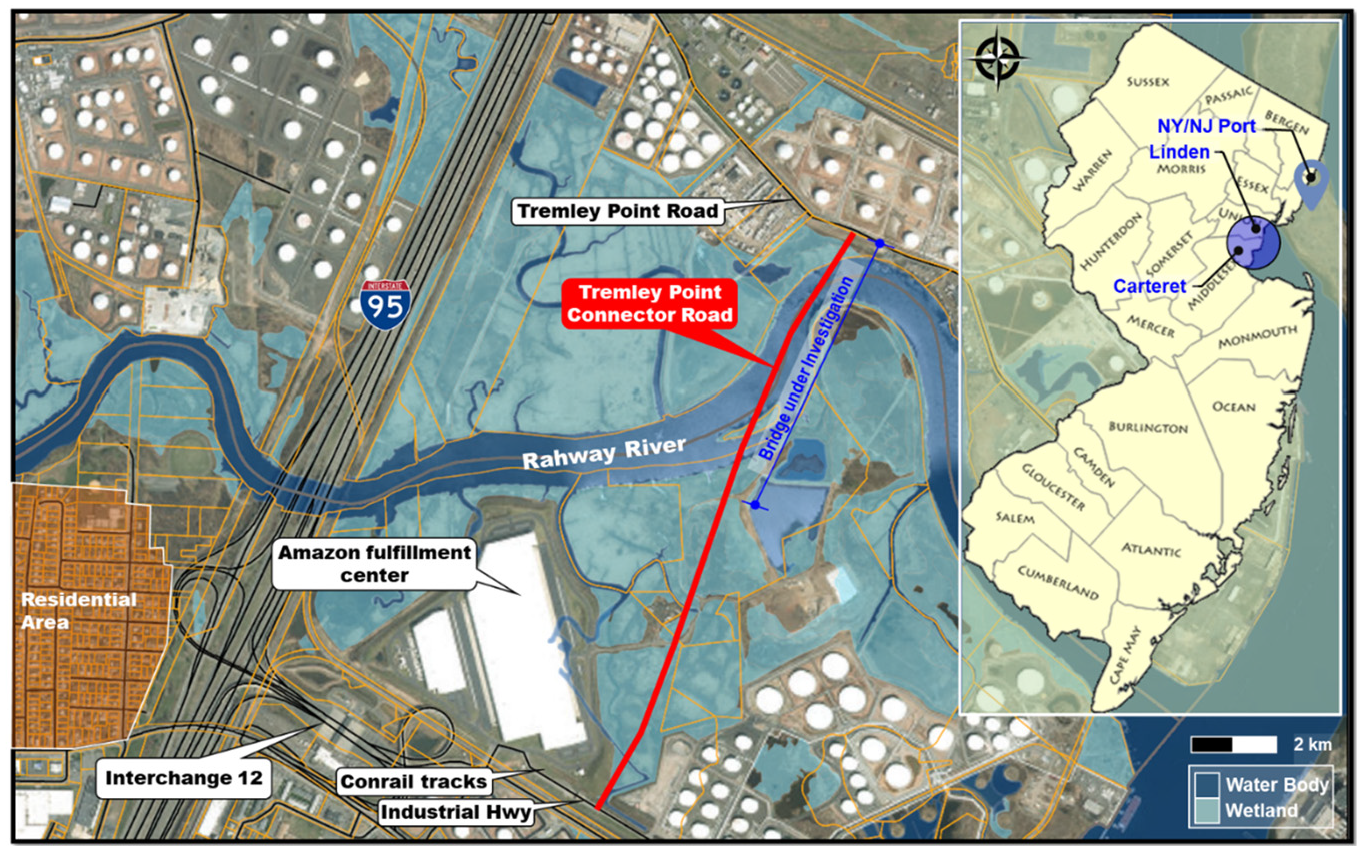
Project location and the proposed Tremley Point bridge alignment connecting the cities of Carteret and Linden after ( 13 ).
The bridge cuts through a heavily industrial area adjoining the ports of New York and New Jersey with large container terminals, Newark Liberty International Airport, and warehousing along the New Jersey coast. With more than $17.8 billion annual revenue ( 13 ), the ports of New York and New Jersey are the largest ports on the east and gulf coasts and the third largest nationwide. Approximately 400 acres of wetland and undeveloped brownfield areas on Tremley Point were identified as suitable locations to expand the existing distribution network within the vicinity of the port. The project will eliminate current and future heavy truck traffic from South Wood Avenue, away from the nearby commercial and residential communities. Moreover, the bridge provides a primary means of ingress to and egress from the northern region of the project. This includes tanker trucks from the refined petroleum facilities to enhance safety and allow secondary access during emergencies.
Methodology
The application of VE concepts involves sequential stages to reach the best use of the available resources. Figure 2 depicts the activities associated with the six VE phases: information; function analysis; creativity; evaluation; development; and presentation. A series of unstructured workshops were conducted by the VE team members, who discussed their experience in bridge design and communicated their input to generate new alternatives and assess them. The team consisted of bridge specialists, engineering consultants, and civil engineering professors. This ultimately ensures unbiased input and balanced interests in the selection of the optimal alternative (bridge design). The necessary information is collected from the project’s reports, design requirements, and environmental studies to identify the key project configurations and the critical components.
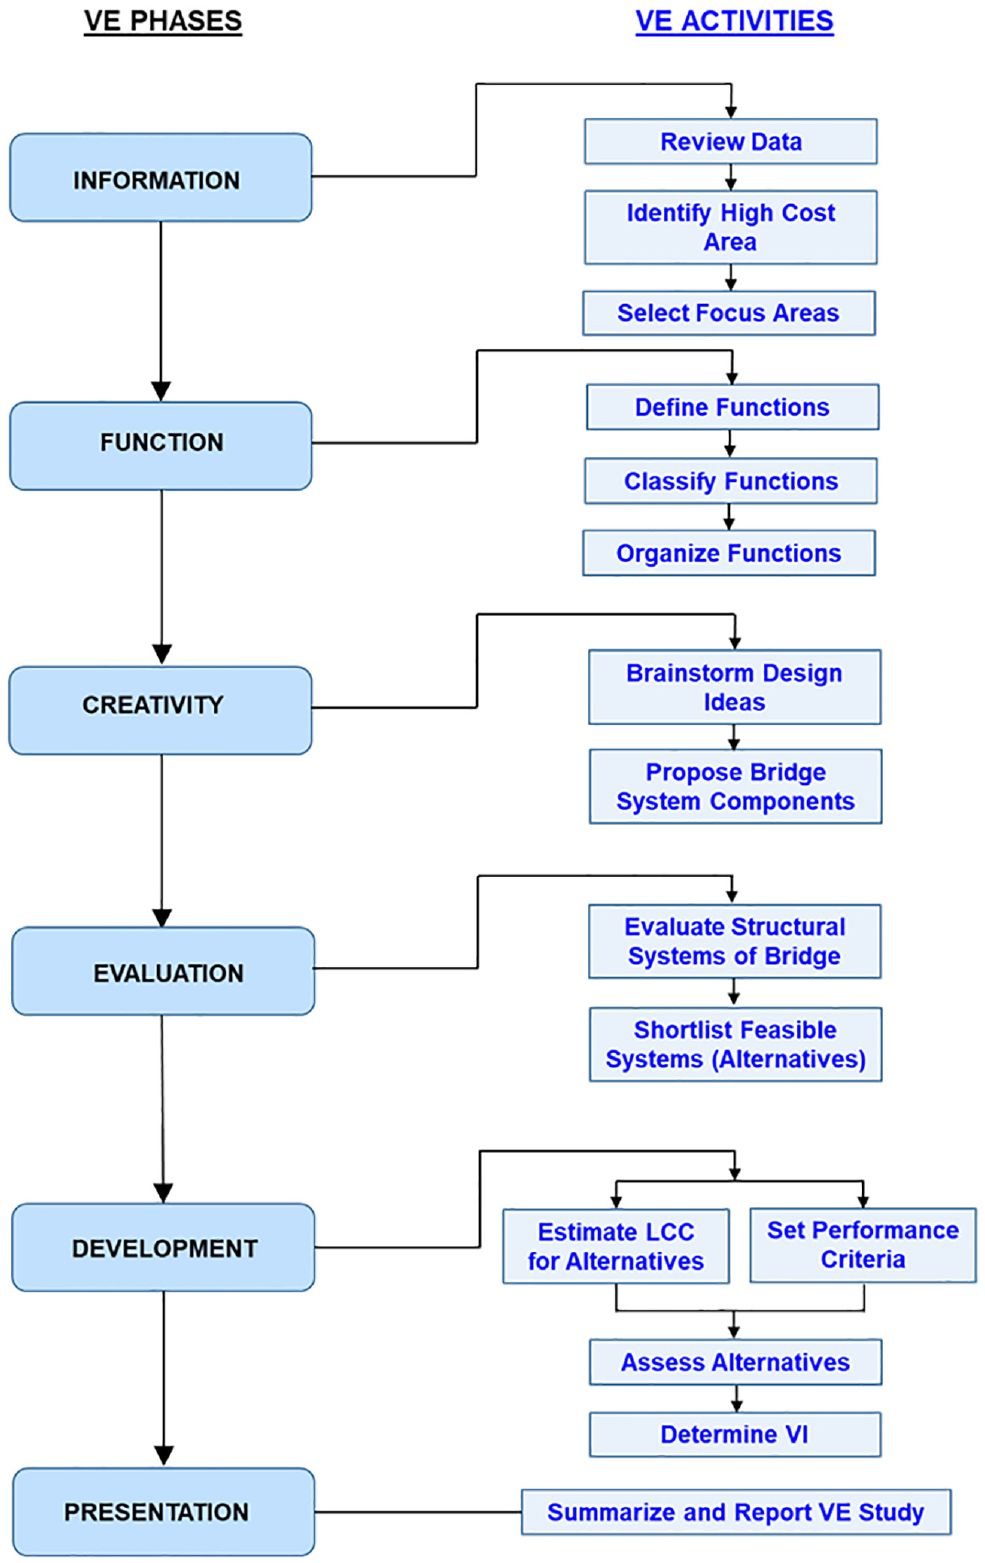
Value engineering (VE) process with key activities for this study.
Collected Information
Alignment and Geometry
The selected alignment is approximately 5,700-ft long, crossing the Rahway River on a skewed alignment to the northeast and intersecting with Tremley Point Road as shown in Figure 1. The alignment affects 4.3 acres of tidally influenced wetland along the river ( 13 ). It was, therefore, selected to minimize the roadway length, reduce the impact on wetlands and contaminated sites, satisfy the required curve radii for the specified design speed, and align with northern and southern intersection locations. USCG requires a navigable channel in the river with a minimum vertical clearance of 37 ft and which is 100-ft wide. The vertical grades vary from a minimum of 0.5% to a maximum of 3%, while cross slope for the roadway varies between 1.5% and 4%. Figure 3 shows a typical (steel) bridge cross-section.
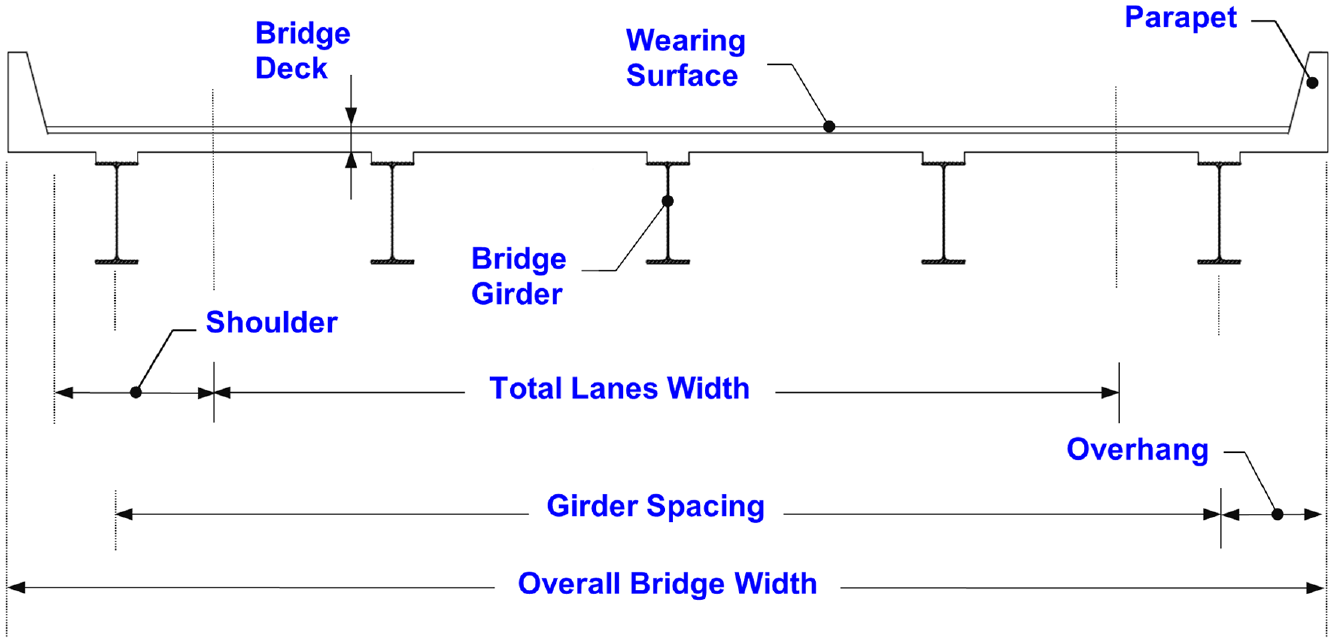
Typical bridge cross-section (steel alternative shown).
Traffic
The roadway has a design speed of 50 mph (posted speed limit of 45 mph). The total bridge length is approximately 3,340 ft; it is at least 57.5-ft wide. The bridge carries a total of four 12-ft lanes of traffic, separated by a concrete barrier in addition to 3-ft outside shoulders with no sidewalks proposed on either the north or south bounds. The majority of the proposed work will be performed offline and will have minimal impact on vehicular and marine traffic. All bridge elements in this study are designed in accordance with the latest editions of the AASHTO LRFD Bridge Design Specifications and the New Jersey Department of Transportation (DOT) Bridge Design Manual. The live load HL-93 consists of design vehicle load and lane load.
Ecosystem
This project presents inevitable environmental impacts and societal challenges. The concerns include tidally influenced and freshwater wetlands, saline marshes, contaminated brownfield sites, industrial facilities, navigation channels, aquatic environment, chemical and petroleum facilities, wildlife habitats, and threatened or endangered species ( 13 ). To this end, environmental assessments, environmental impact statements, noise impact assessments, the finding of no significant impact (FONSI), and navigation studies were prepared for this project in concurrence with various state and federal regulatory agencies. It is also intended to minimize the bifurcation of wetland systems, use available upland areas, and avoid known contaminated sites.
Original Design
The original bridge design, typically referred to as the preferred preliminary alternative (PPA), will be supported by 17 piers between the north and south abutments. The proposed superstructure is made of homogenous ASTM A709.50 W steel plate girders with a pier cap and four concrete columns for the substructure. The bridge is made of six, three-span continuous units with span lengths ranging between 210 and 226 ft for center span and between 167 and 176 ft for end spans. The preliminary design consists of eight steel plate girders with an overall beam depth of 78 in. and an 8-in. thick reinforced high-performance concrete (HPC) deck slab with epoxy coated rebar. The proposed girder spacing for the bridge is optimized to 7.5-ft uniform spacing with an overhang of 2.5 ft. Based on the low strength and compressible soils along the bridge alignment, deep foundations are required. Drilled shafts 6 ft in diameter, socketed 15 ft into the rock are required to obtain the required fixity of the pier. The drilled shafts will extend to the pier cap as columns. The average length of the drilled shafts was estimated at 50 ft, with a slight variation based on soil profile. The structural capacity governed the design of the drilled shafts since the shafts are socketed into rock. A high load multi-rotational bearing (HLMR) is used to support the bridge superstructure. High heavy truck normal weight concrete (NWC) parapets of 50 in. were used.
Estimated Cost and Budgeting
The estimated total cost of the structural construction of the PPA is $132.5 million, which includes the superstructure, substructure, and foundations for all the piers. The cost of right-of-way, ground improvements, retaining walls, the intelligent transportation systems (ITS) were not included. Under Section 16:25 of the New Jersey Administrative Code (N.J.A.C.) and provisions of 23 CFR 645 for federally funded projects, state agencies are required to effectively and safely accommodate the crossing of utility facilities. The cost and weight of the 36-in. water pipe were, therefore, included in the analysis. The general items are often a percentage of the subtotal budget of the work. It includes mobilization, site clearing, construction layout, final clean-up, bond, insurance, contingencies, and escalation (during construction). Figure 4 depicts the price breakdown for the project items as per the PPA at the construction completion date. Subsequently, the VE team managed to identify high-cost areas of the project.
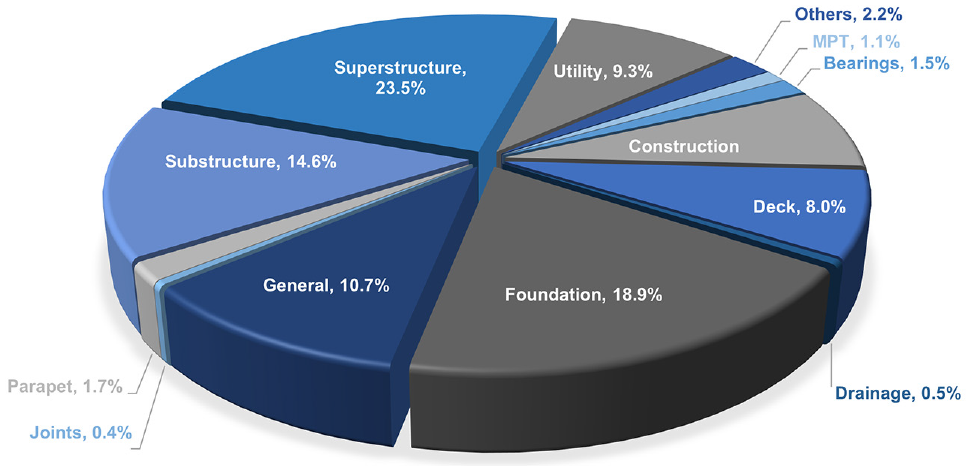
Capital cost breakdown (percent) for the Tremley Point bridge preferred preliminary alternative (PPA) ($132.5 million total cost).
FAST for Setting Project Functions
The function phase of VE enables a clear, unbiased understanding of the project needs. This is a logical phase that defines and fulfills the criteria and goals of the project. Function analysis allows the VE team to communicate the project functions of a multi-disciplinary nature. Team members identify and express the functions in a two-word description comprised of an “active” verb and a “measurable” noun, which ensures emphasis on the objectives ( 15 ). The function analysis system technique (FAST) was used to connect and organize the specific functions of the project, which better captures the significance and role of those functions ( 11 ). Figure 5 depicts the FAST diagram that the team developed for this project.
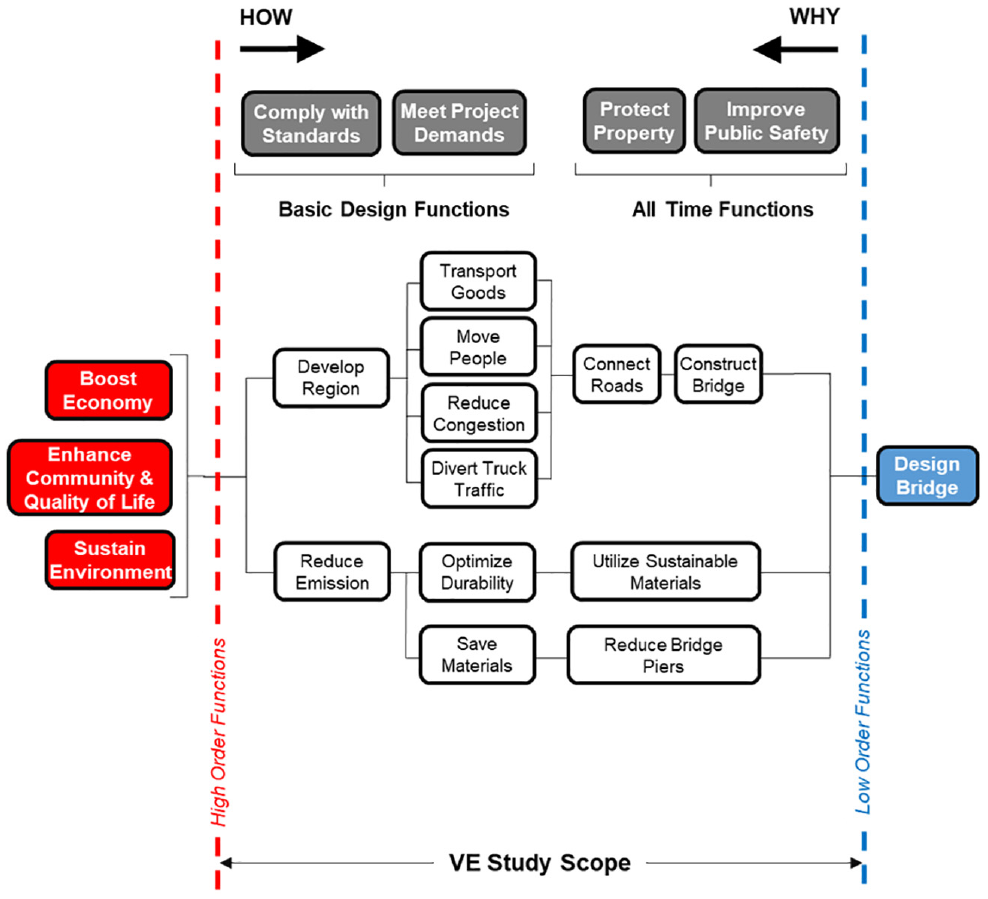
Function analysis system technique (FAST) diagram for a bridge system.
As shown in Figure 5, there three high-order functions targeted in this project are: boosting economy, enhancing community, and quality of life while sustaining the environment. The low-order function or the input in this project (i.e., bridge design) must be developed to furnish the high-order functions. In doing so, two objective design functions are targeted: complying with the standards, while meeting the project demands. The high-order function denotes the main technical functions of the bridge, whereas low-order functions denote technical solutions needed to achieve all higher-order functions. The path between high and low-order functions in the FAST diagram is driven by two main questions: why and how. The why direction provides the reason for selecting those functions; while the how direction describes the fashion in which the high-order functions are met. All-time functions are those functions that happen all the time to ensure delivering reliability and quality while the user’s satisfaction is enhanced. It is assumed that public safety and protection of property are all-time functions of the project. Complying with building regulations and codes as well as meeting the project demands are basic functions for any bridge design.
Proposed Systems: Initial Evaluation
A preliminary screening was performed for the bridge components presented in Figure 6 to determine their utility. The ideas generated from the creativity phase are systematically evaluated, screened, prioritized, and shortlisted for their potential to save cost and add value. The structural design parameters, such as continuous live load, economics, site limitations, construction equipment capacities, and other constructability factors were also discussed with the fabricator, with an emphasis on system selection and constructability.

Creativity matrix for bridge alternative systems.
System Selection
Prefabricated bridge units, box beams, AASHTO voided slab, AASHTO box beam northeast extreme tee (NEXT) are structurally inadequate for spanning more than 126 ft. Steel wide flange shapes are limited to 90 ft ( 16 ). Prestressed members can tolerate greater loads as a result of increased internal compression and provide reduced deflection ( 17 ). However, the concrete tends to have a higher self-weight compared with steel beams. A fiber-reinforced polymer (FRP) deck was considered in the analysis. FRP decks can be a relatively effective alternative thanks to their lightweight and non-corrosivity. However, they were excluded because the technology has a limited implementation history and high cost ( 18 ). The proposed alternatives in this study enable the use of accelerated bridge construction (ABC) by using precast elements, which allows significant time savings with a negligible cost impact. Moreover, New Jersey DOT requires at least four girder lines for prestressed beams to provide structural redundancy and allow for future rehabilitation ( 19 ). Following the completion of the superstructure evaluation, an investigation was performed to determine the anticipated loading and capacity of the substructures and foundations.
Constructability and Accessibility
The transportation of structural bridge elements is typically a challenging task for long-span bridges. Field splices in steel girders are permitted to ease the shipping and erection. However, the cost and effort required to construct temporary girder supports and attach field splicing might offset the benefits. Although field splices have been performed for various types of precast concrete members, it is preferable to fabricate, transport, and erect the members as one continuous unit without field splices. New Jersey DOT requires that the consideration of the shipping and handling stresses be considered during design ( 19 ). Pre-tensioning of precast concrete girders can be provided to account for shipping and handling ( 20 ). The weight and size of the structural elements as well as the proximity of the fabricator plant to the job site are governed by the practical shipping limits. For example, land shipping by trucks is regulated by 23 CFR Part 658.17 for the National System of Interstate and Defense Highways ( 5 ). The federal limit is 80, 20, and 34 kips for gross vehicle weight (GVW), single axle weight, and tandem axle weight, respectively. Permits are usually required for vehicles exceeding the required GVW limits of 80 kips for non-divisible loads in New Jersey ( 21 ). Moreover, permits and escort vehicles are usually required for vehicles exceeding 120, 16, and 16 ft in length, width, and height, respectively ( 21 ). The project site is located adjacent to NJTP/I-95, which provides connectivity to most NJ highways and interstates roads. The Rahway River flows toward the Raritan Basin along the Atlantic Ocean. As such, barge transportation is considered a viable alternative during construction given that specific navigation permits are not required for oversize or overweight transportation ( 22 ). Additionally, shipping the girders by rail was found to be a feasible option because of the proximity of the Conrail tracks to the project location. The overweight and oversize impacts have been accounted for in the cost analysis.
Design Alternatives
Shortlisting viable bridge system alternatives can further enrich decision making. In light of the aforementioned considerations and requirements, the team proposed and prescreened eight alternatives in this phase (Table 1). Similar design ideas were combined to eliminate redundancy. The structural configurations of the generated alternatives for evaluation and development are summarized in Table 2. The cost breakdown for the initial construction of the proposed alternatives is shown in Table 3. Further details about the proposed alternatives are available in the supplemental material.
Proposed Bridge System Alternatives in This Study
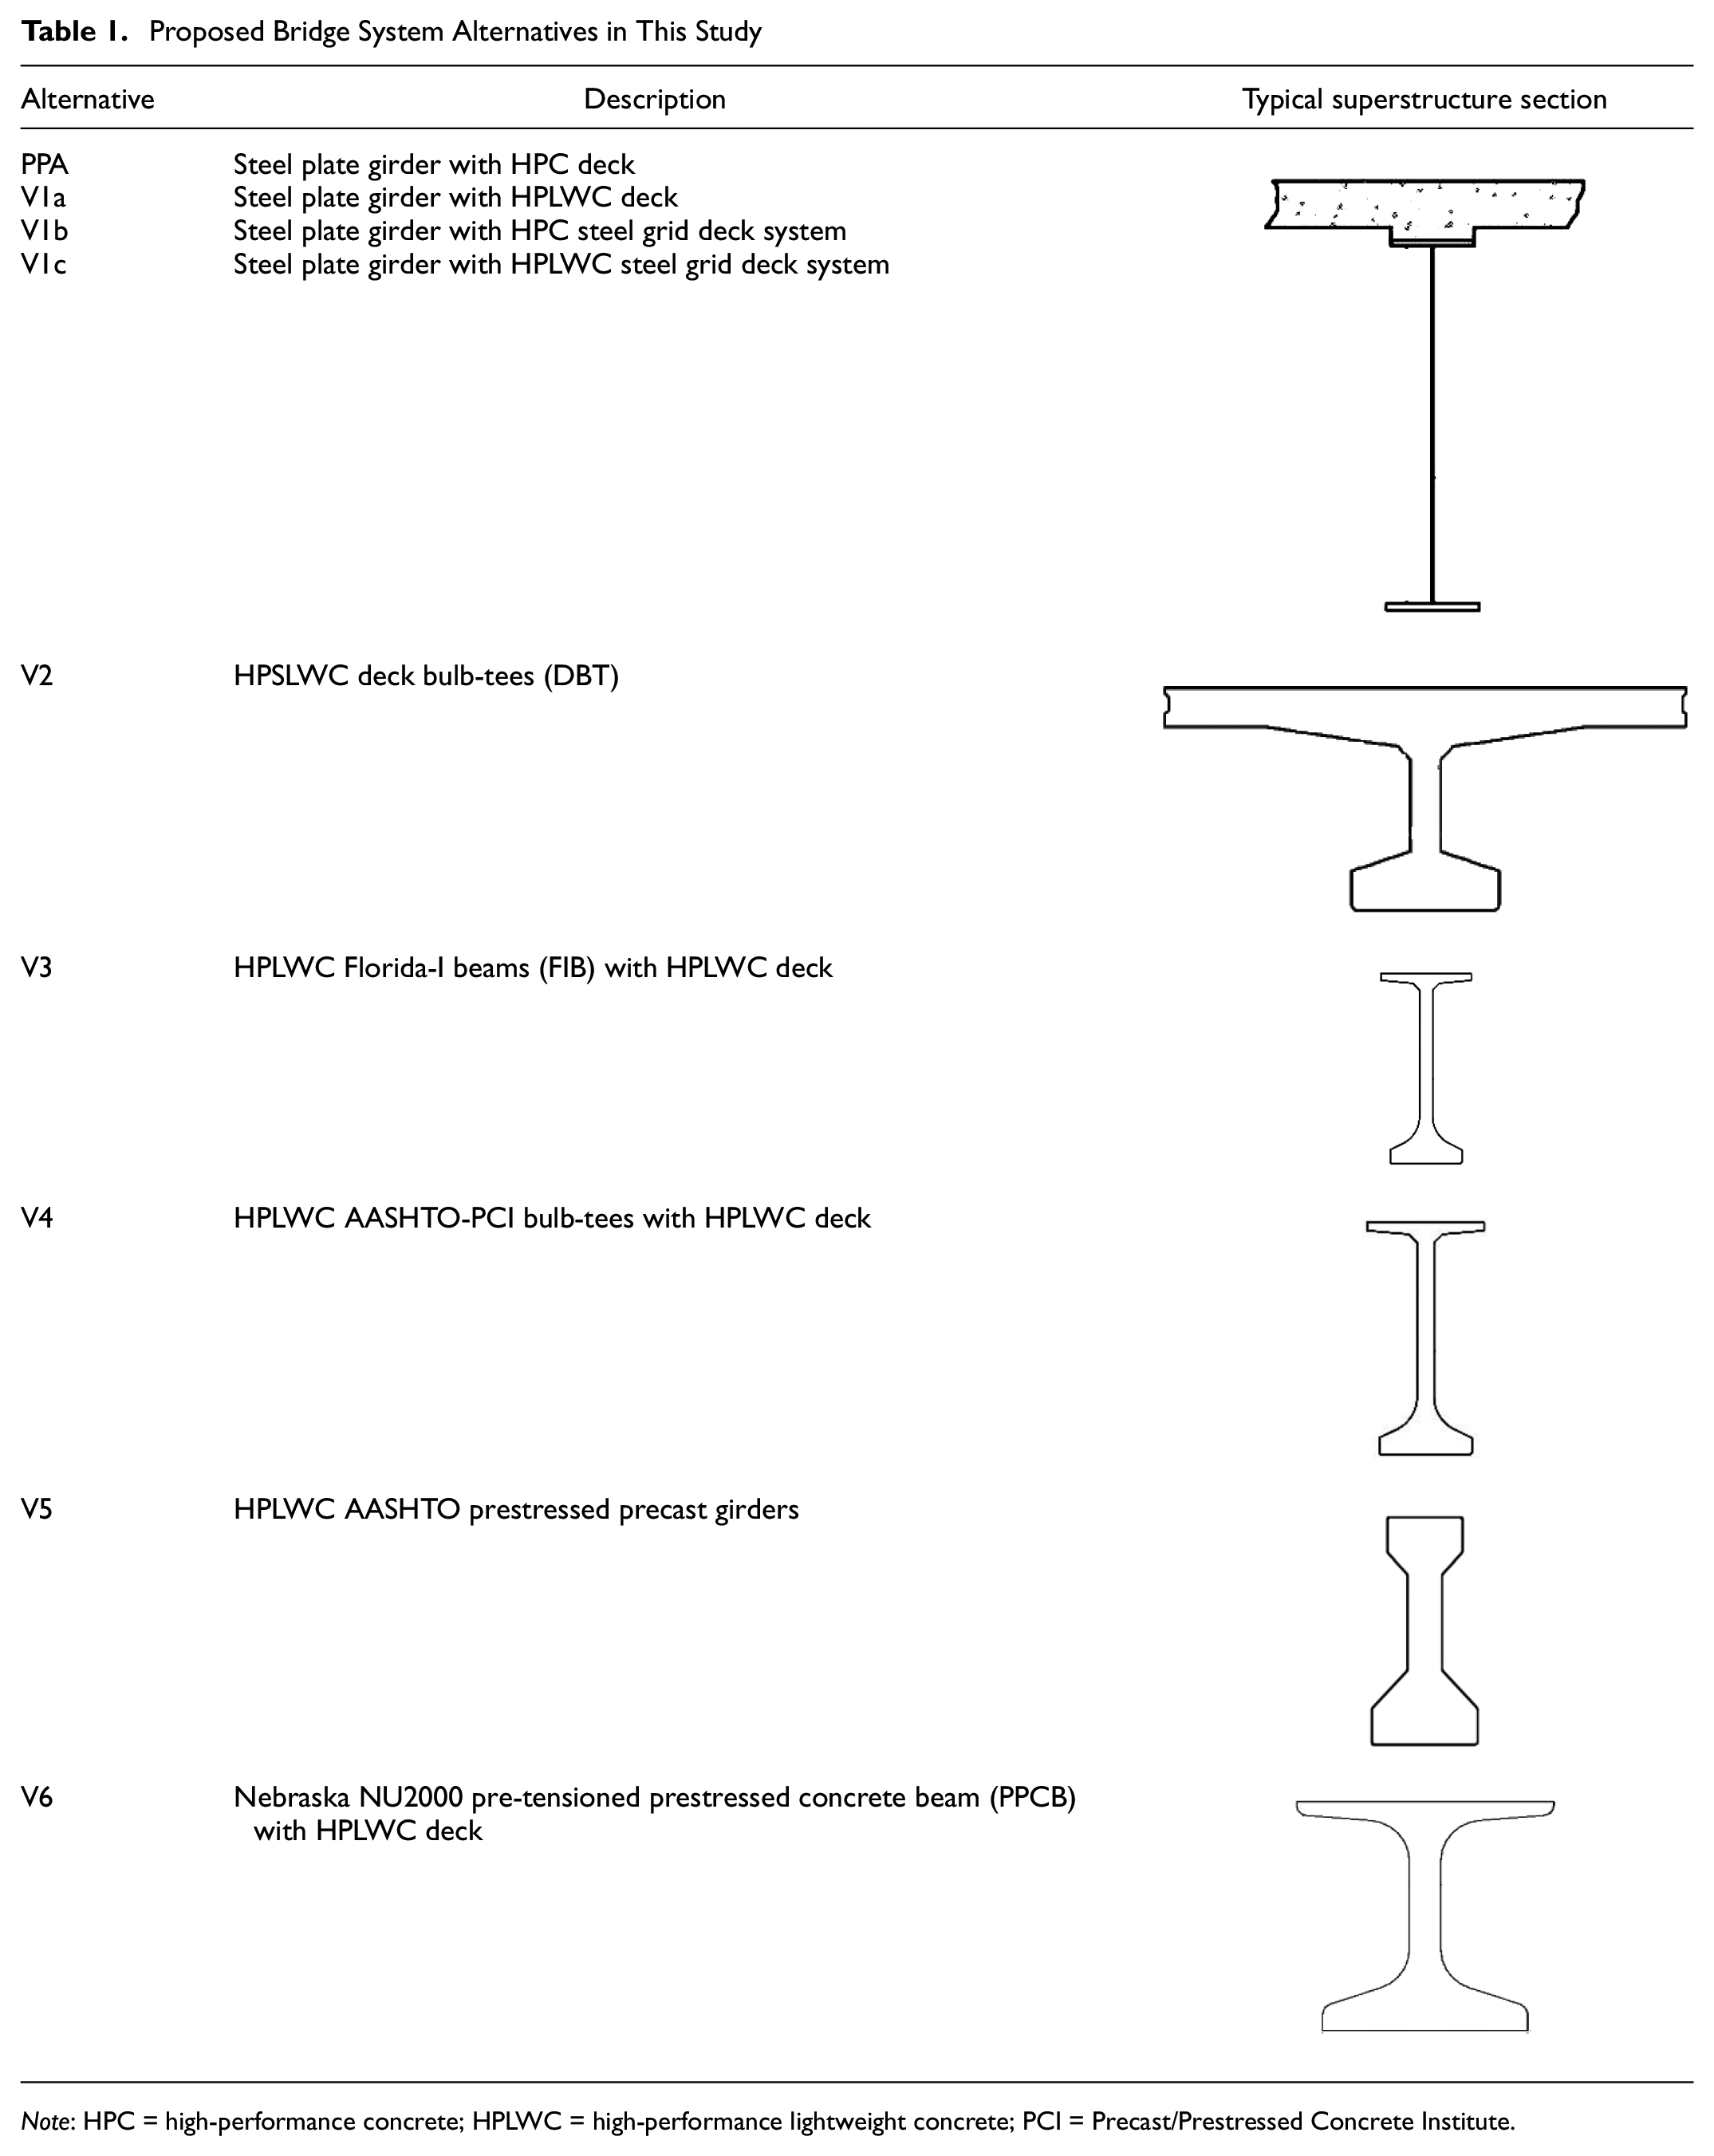
Note: HPC = high-performance concrete; HPLWC = high-performance lightweight concrete; PCI = Precast/Prestressed Concrete Institute.
Structural and Geometrical Configurations of the Eight Alternatives as Compared with Preferred Preliminary Alternative (PPA)
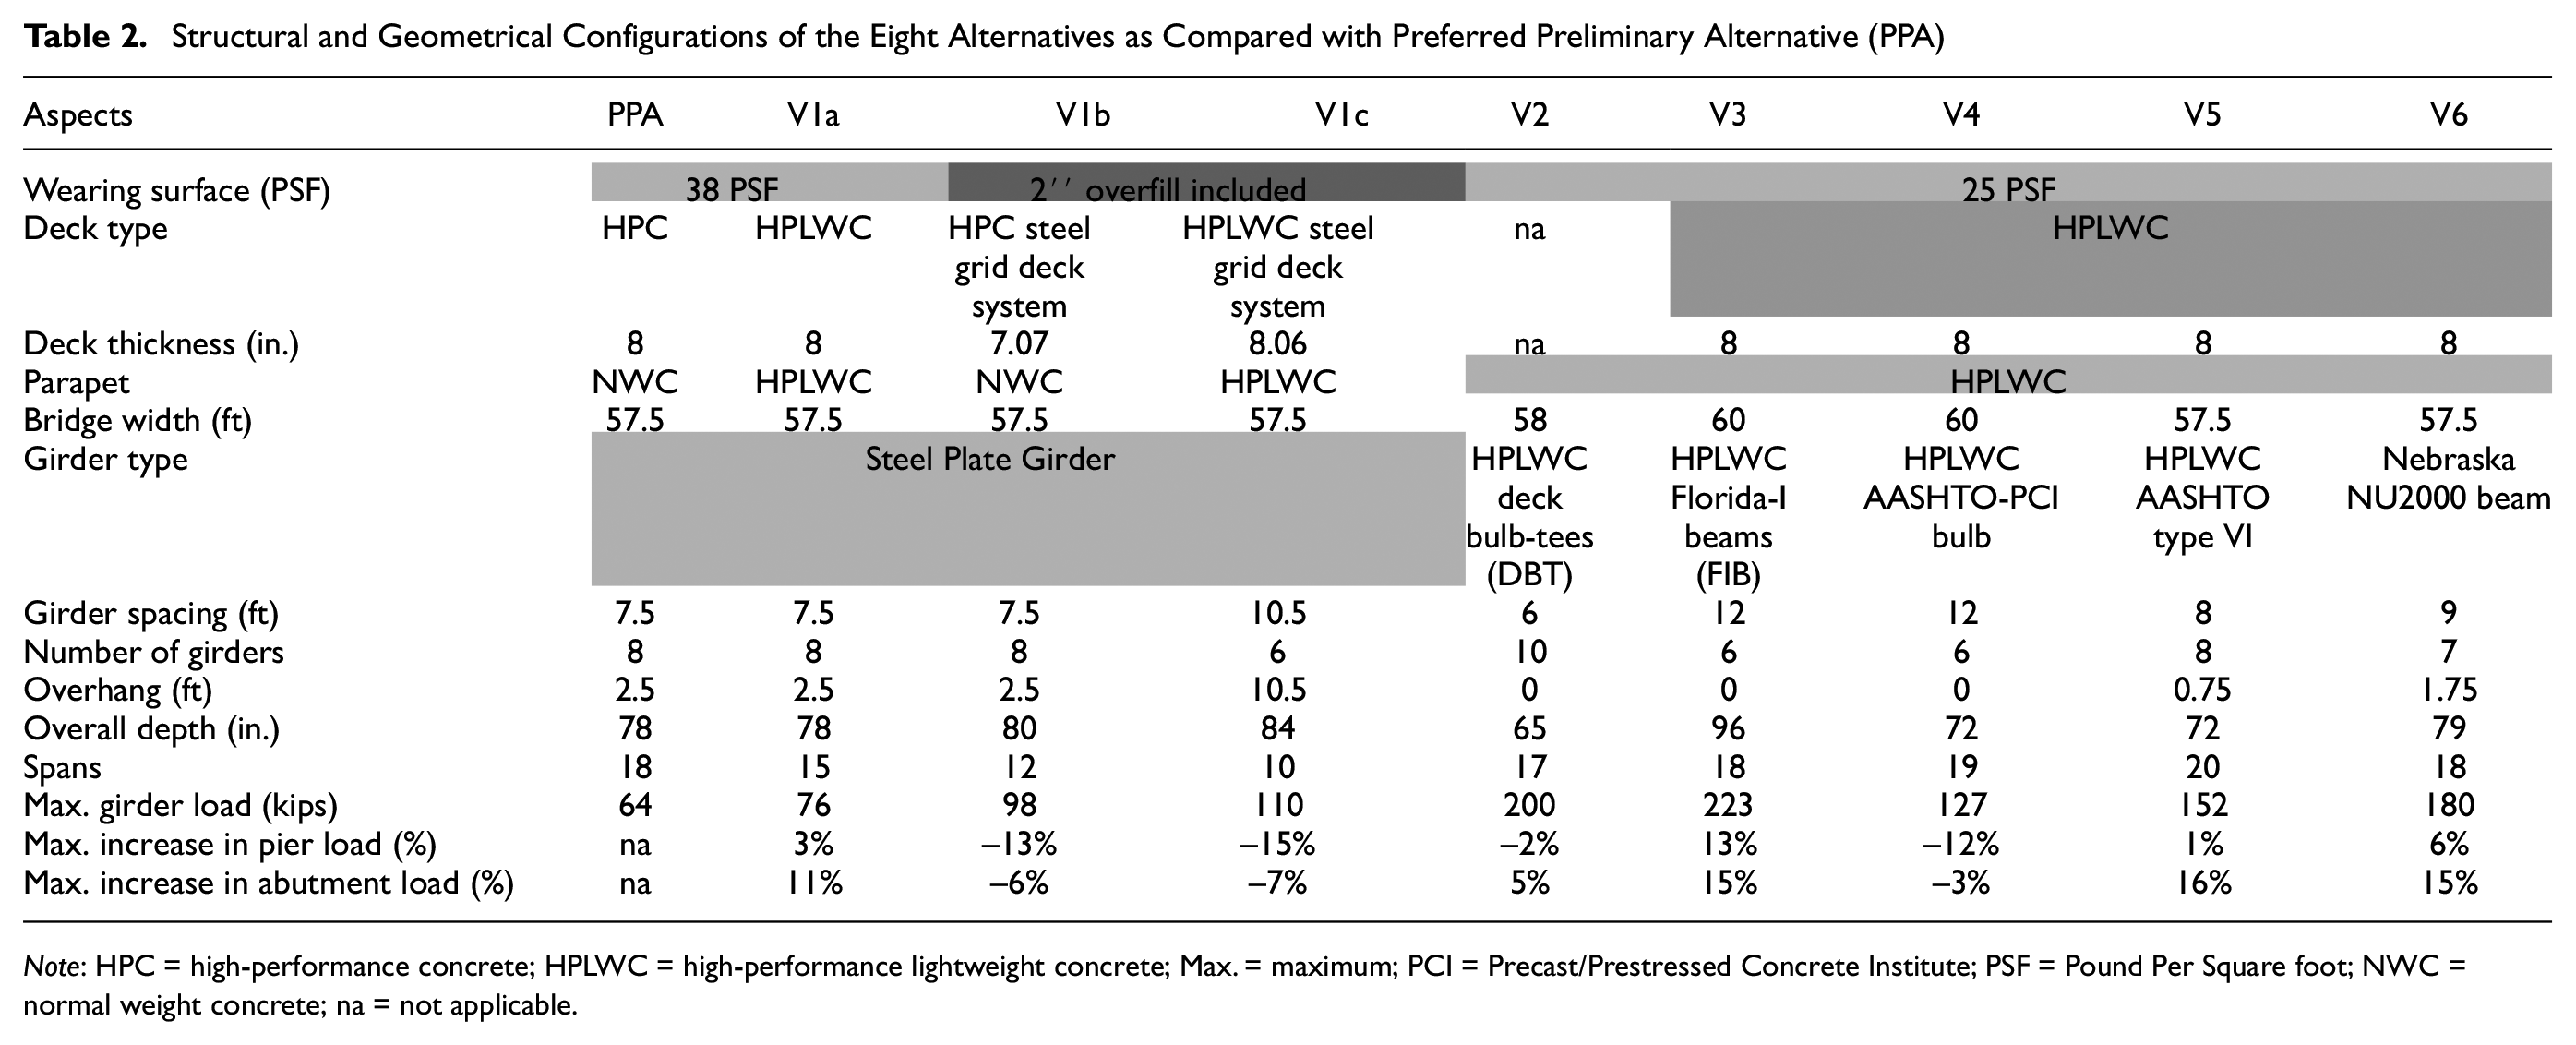
Note: HPC = high-performance concrete; HPLWC = high-performance lightweight concrete; Max. = maximum; PCI = Precast/Prestressed Concrete Institute; PSF = Pound Per Square foot; NWC = normal weight concrete; na = not applicable.
Cost Breakdown (by Category) for the Project in USD (in Thousands) for all eight Alternatives versus Preferred Preliminary Alternative (PPA)
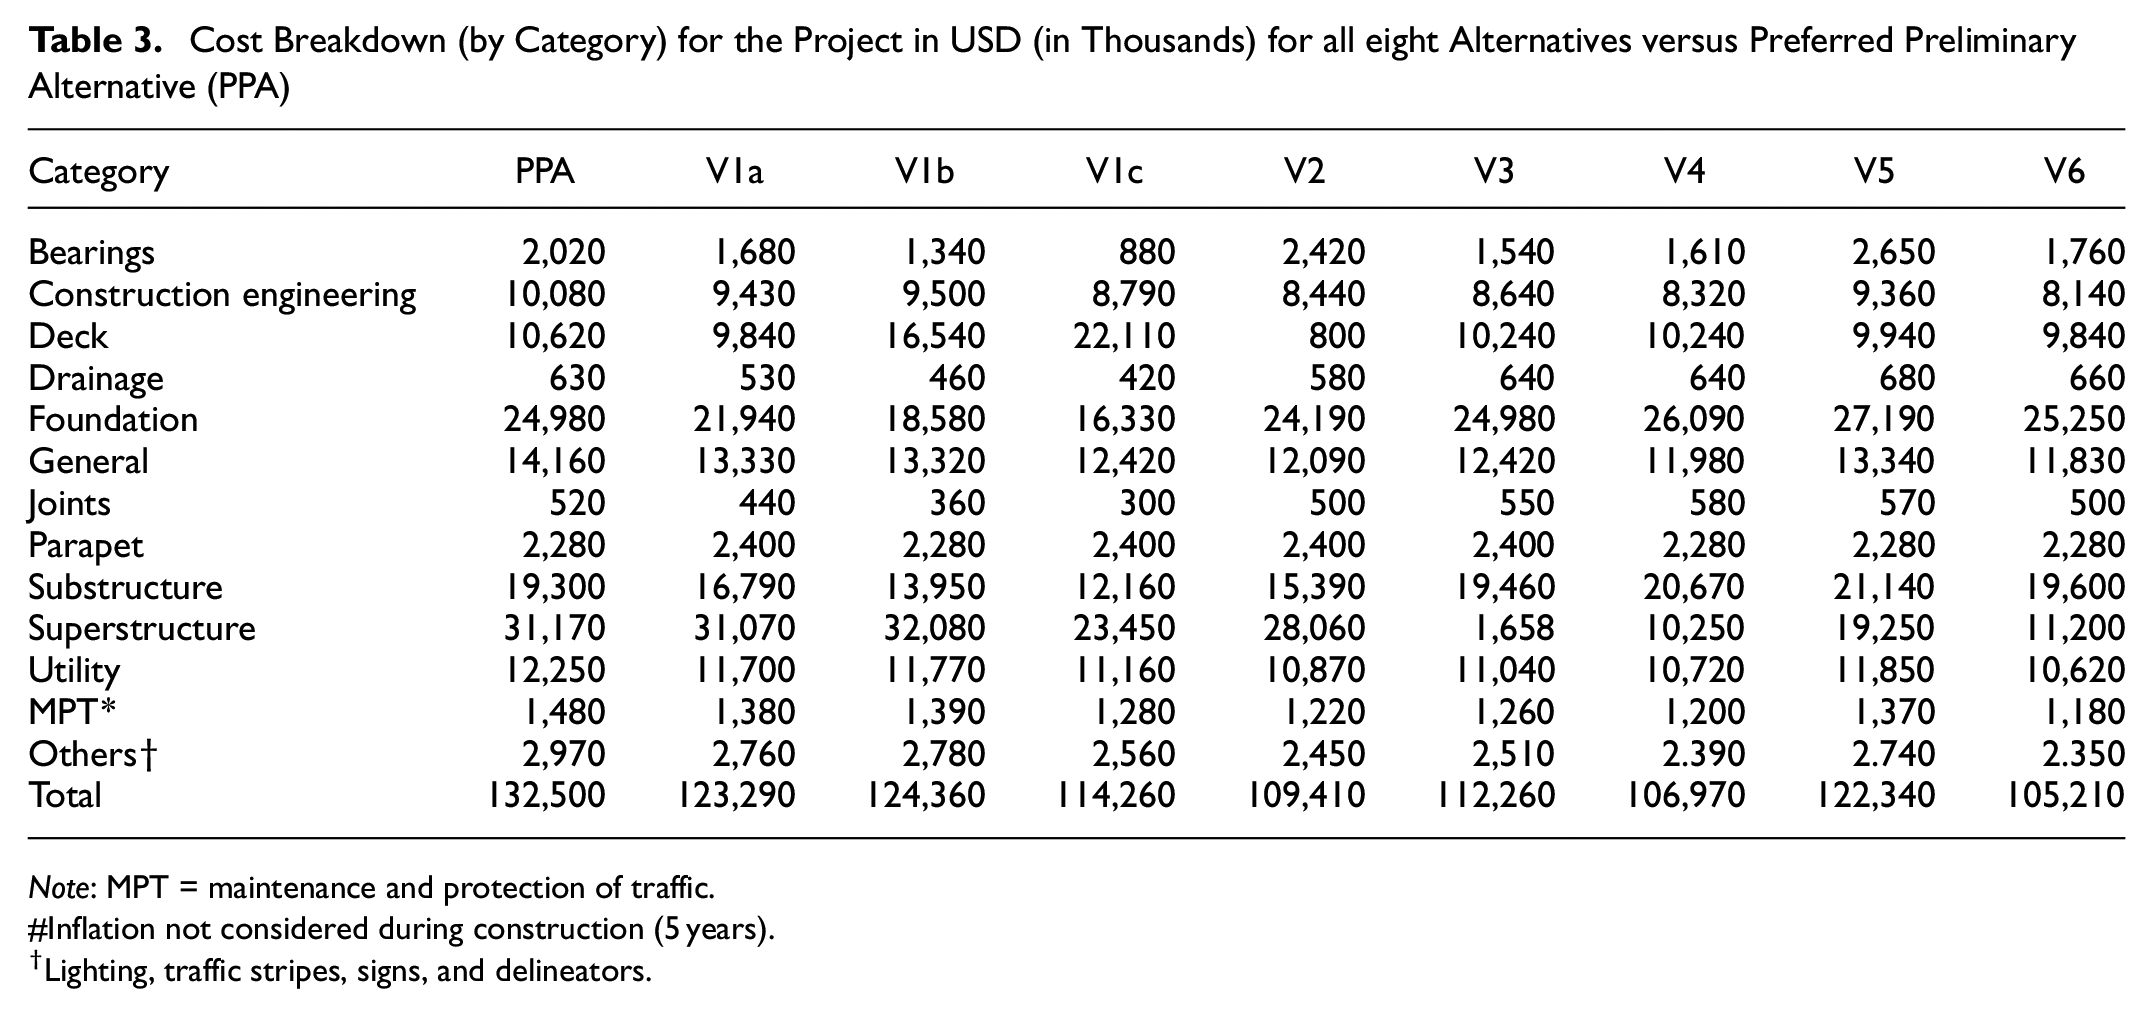
Note: MPT = maintenance and protection of traffic.
Inflation not considered during construction (5 years).
Lighting, traffic stripes, signs, and delineators.
Preferred Preliminary Alternative (PPA)
Using PPA as a base for comparison, the process involves eliminating low-potential, unrealistic and impractical solutions. The design of the drilled shafts is governed by the structural capacity and lateral deflection. The changes in axial load associated with the alternatives will, therefore, have very little impact on the pile design and cost. The increase in the axial loads on the abutments and piers for the alternate designs were limited to 10% and 15%, respectively, to provide a comparable design for the substructure and foundation (drilled shaft). The alternatives are developed further and presented in the next phase.
Alternative V1a offers a 20% reduction in dead load using high-performance lightweight concrete (HPLWC) deck and parapets. Steel grid deck system decks for Alternative V1b and Alternative V1c provide a superior strength-to-weight ratio, while HPC and HPLWC steel grid deck system decks reduced the weight by 37% and 45%, respectively compared with the conventional HPC reinforced deck. Alternative V2 consists of precast prestressed HPLWC Deck Bulb-Tees (DBT) with an 8-in.-thick deck with 0.5 in. deducted for long-term wear. Alternative V3 consists of six prestressed HPLWC Florida-I Beams (FIB) and decks with span lengths ranging between 164 and 218 ft. The AASHTO-PCI Bulb-Tees for Alternative V4 allows for a maximum span length of 198 and 163 ft for end and center spans, respectively. The girder spacing, web depths, and span length configurations were optimized to provide the best weight-to-span ratio for Alternative V5. Type V and Type VI were found to be the most practical beams for this alternative. Type VI was selected to reduce the number of spans and consequently provide savings in the substructure. The bridge has a maximum span length of 168 ft. Alternative V6 uses Nebraska University 79-in. deep (NU2000), which provides a longer span while maintaining the same depth compared with other types of I beams.
Life-Cycle Cost
To set a basis for comparison between design alternatives, the LCCA was conducted to convert the future expenses throughout the life of the bridge for each alternative into 2020 dollars as net present value (NPV). LCCA in this study includes the initial construction and operational (inspection, preservation) costs over 100 years ( 19 ). Figure 7 depicts the breakdown of the total operational cost including the cost of preservation and inspection. The miscellaneous items include cleaning scuppers and pipes, lane closures, cleaning drainage structure, parapet, and balustrade crack sealing concrete parapet repair.
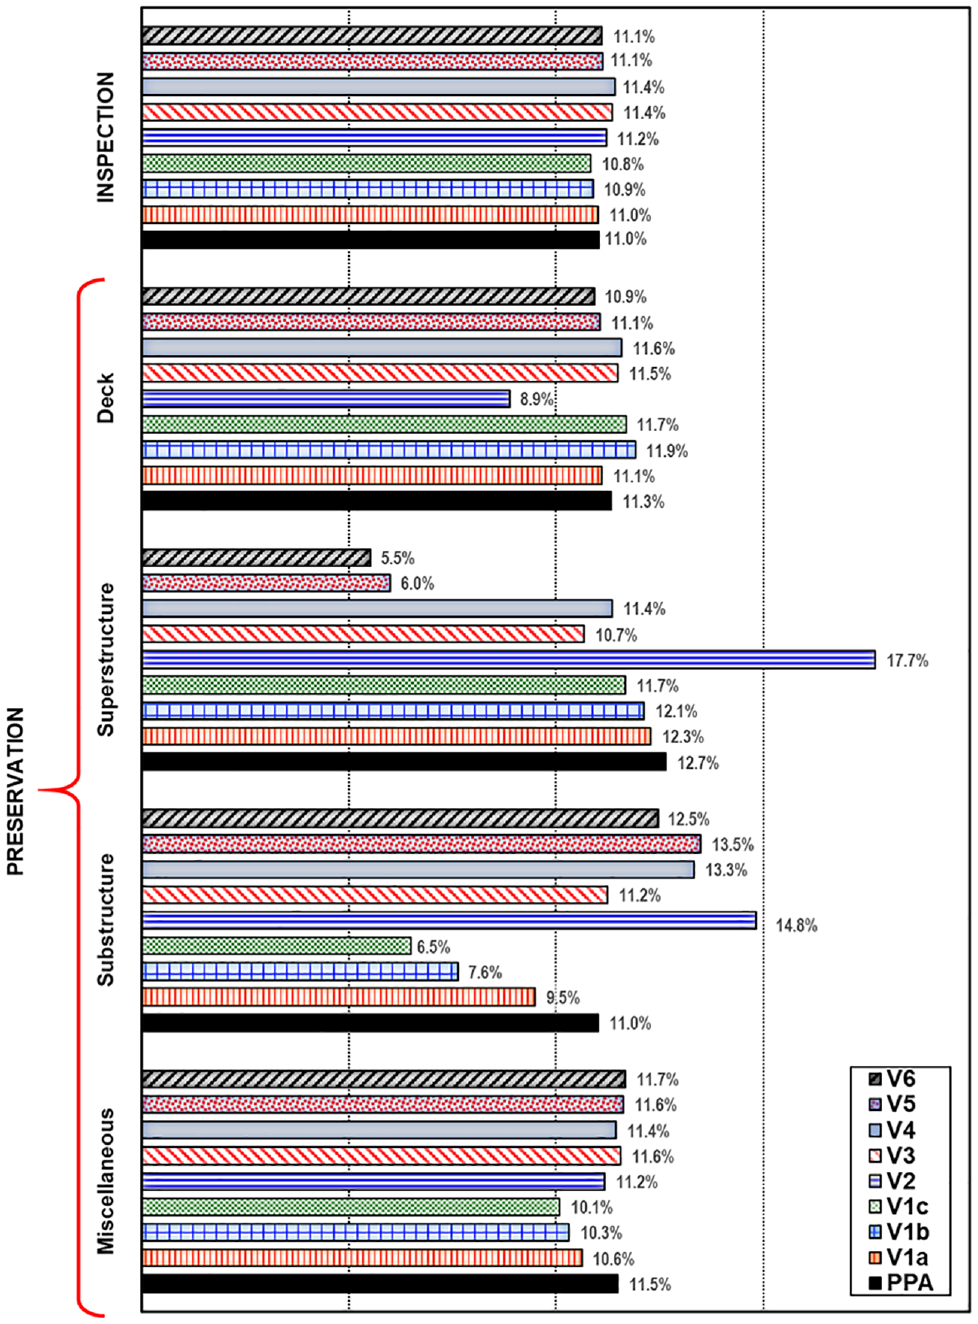
Operational cost breakdown (percentage) for the considered alternatives over 100 years.
Routine inspections of a bridge are typically performed at intervals not exceeding 24 months; an average of 20 months was assumed for the purpose of this study ( 23 ). Underwater inspections in NJ are typically performed on a 48-month (no more than 60-month) cycle. The inspection cost factored in the number of substructure elements, bearings, girders, and the overall deck area. Extended periods between maintenance cycles usually yield an uneconomical and accelerated level deterioration in the long term.
A full deck sweeping is assumed to be implemented once a year throughout the life of the bridge. This relatively high frequency is anticipated given the high traffic volumes in NJ. Deck power washing along with deck joints will commence at year 7 and will be regularly performed at two-year intervals thereafter. Seasonal activities, such as deck sweeping, debris (trash, litter, and dead animal) removal, snow removal, and deicing chemicals, are also included in the cost.
PPA and all proposed V1 alternatives are made from uncoated weathering steel (UWS) superstructures. Although UWS can have up to 120 years of service life with an annual corrosion rate of less than 0.3 mils (one thousandth of an inch), it has been found that extreme marine conditions and deicing salt can result in inadequate performance ( 24 ). This bridge is located in a “severe coastal salt intrusion zone” (New Jersey DOT Zone 3B), which is extremely detrimental to the steel elements of the bridge ( 19 ). It is, therefore, assumed that steel superstructure elements will be cleaned, washed, and repaired during the cyclical activities and painted with a three-coat system at year 65. The applied corrosion inhibitor will be performed at 15-year intervals for all deck types. Concrete surface painting of the substructure will be performed every 20 years, while concrete repairs and the installation of FRP carbon wrap will be performed at year 60. More frequent preservation is proposed for the deck for a combined deck-beam alternative (i.e., alternative V2) to reduce the risk of superstructure replacement. HLMR bearings are considered the preferred bearing type by many DOTs because of their long-term maintenance needs. Exposed steel components in HLMR bearings are typically painted or metalized to reduce the risk of corrosion ( 25 ). However, to maintain the bearing’s service life, the bearings are expected to be cleaned and debris accumulation removed every 20 years. Scuppers and drainage pipes will be cleaned out at three-year intervals. The joints are assumed to be retrofitted every 25 years.
Condition-based maintenance is focused on the response to known defects, which are typically noticed during routine inspection observations. Those maintenance activities tend to improve the condition rating of the bridge. At years 40 and 72, the installation of a shallow concrete overlay and diamond grinding of HPC and HPLWC deck would provide the most economical solution. At year 72, New Jersey DOT Type B and C deck repairs to 25% of deck area are assumed, excluding deck bulb-tee girder alternative. On the other hand, deck replacement for steel grid deck system alternatives (V1b, V1c) is not anticipated. This deck type was found to be in extraordinary condition after more than 88 years of service ( 26 , 27 ). However, it conservatively assumed that this deck will require hydro removal of the concrete and a 1–1.5-in.-thick concrete overlay placement at year 60. For concrete superstructures, it is anticipated that restoration, patching, repairing, and sealing will be required at year 65. Prestressed girder bridges typically have a lower life-cycle cost and require minor maintenance throughout their life ( 28 ). The restoration of scouring countermeasures is assumed at 20-year increments. The frequency of rehabilitation is typically controlled by increased user cost, project duration, complexity, and cost.
The LCCA extends to 100 years, including five years of construction. The discount (interest) rate has a great impact on the economic efficiency of the analysis. Despite that, the analysis is based on a 95-year service and includes the five years of construction, the service life is expected to be 120 to 150 years with the suggested routine and periodical maintenance. Therefore, demolition, replacement, disposal, and salvage values were not included. As shown in Figure 8, the LCCA presents the relative total cost of the investigated alternatives in comparison to the PPA using NPV. The total LCC (based on 100 years) for the PPA design is $136.5 million at NPV. The estimated LCC values for some alternatives (e.g., V2) have shown a measurable increase at years 45 and 65 at which major maintenance takes place for the substructure and superstructure, respectively. It is important to note that despite this, all proposed alternatives have consistently shown lower LCC estimates than those of PPA over the 100-year period, though this does not automatically warrant a higher value. This requires evaluation of the performance as will be discussed next.

100-year LCCA for the considered alternatives.
Value for Decision Making
The best alternative(s) that can achieve the project functions is identified as the one that can minimize cost (e.g., resources, energy, and material) and maximize performance (e.g., environmental impact). This can be mathematically captured using the value index (

The procedure is conducted systematically using the analysis matrix shown in Figure 9. It is important to note that the criteria and weights in this procedure were set through detailed discussions within the evaluation team to enhance objectivity. Both criteria and weights are dependent on the project’s specifics and the owner’s perspective and priorities. The set criteria for performance (value) capture non-monetary aspects including environmental impact (EI), constructability (CON), schedule (SC), road user impact (RU), material savings (MS), load efficiency (SE), operational performance (OP), and the likelihood of acceptance (LOA). Accordingly, the optimum alternative is the one that receives the highest
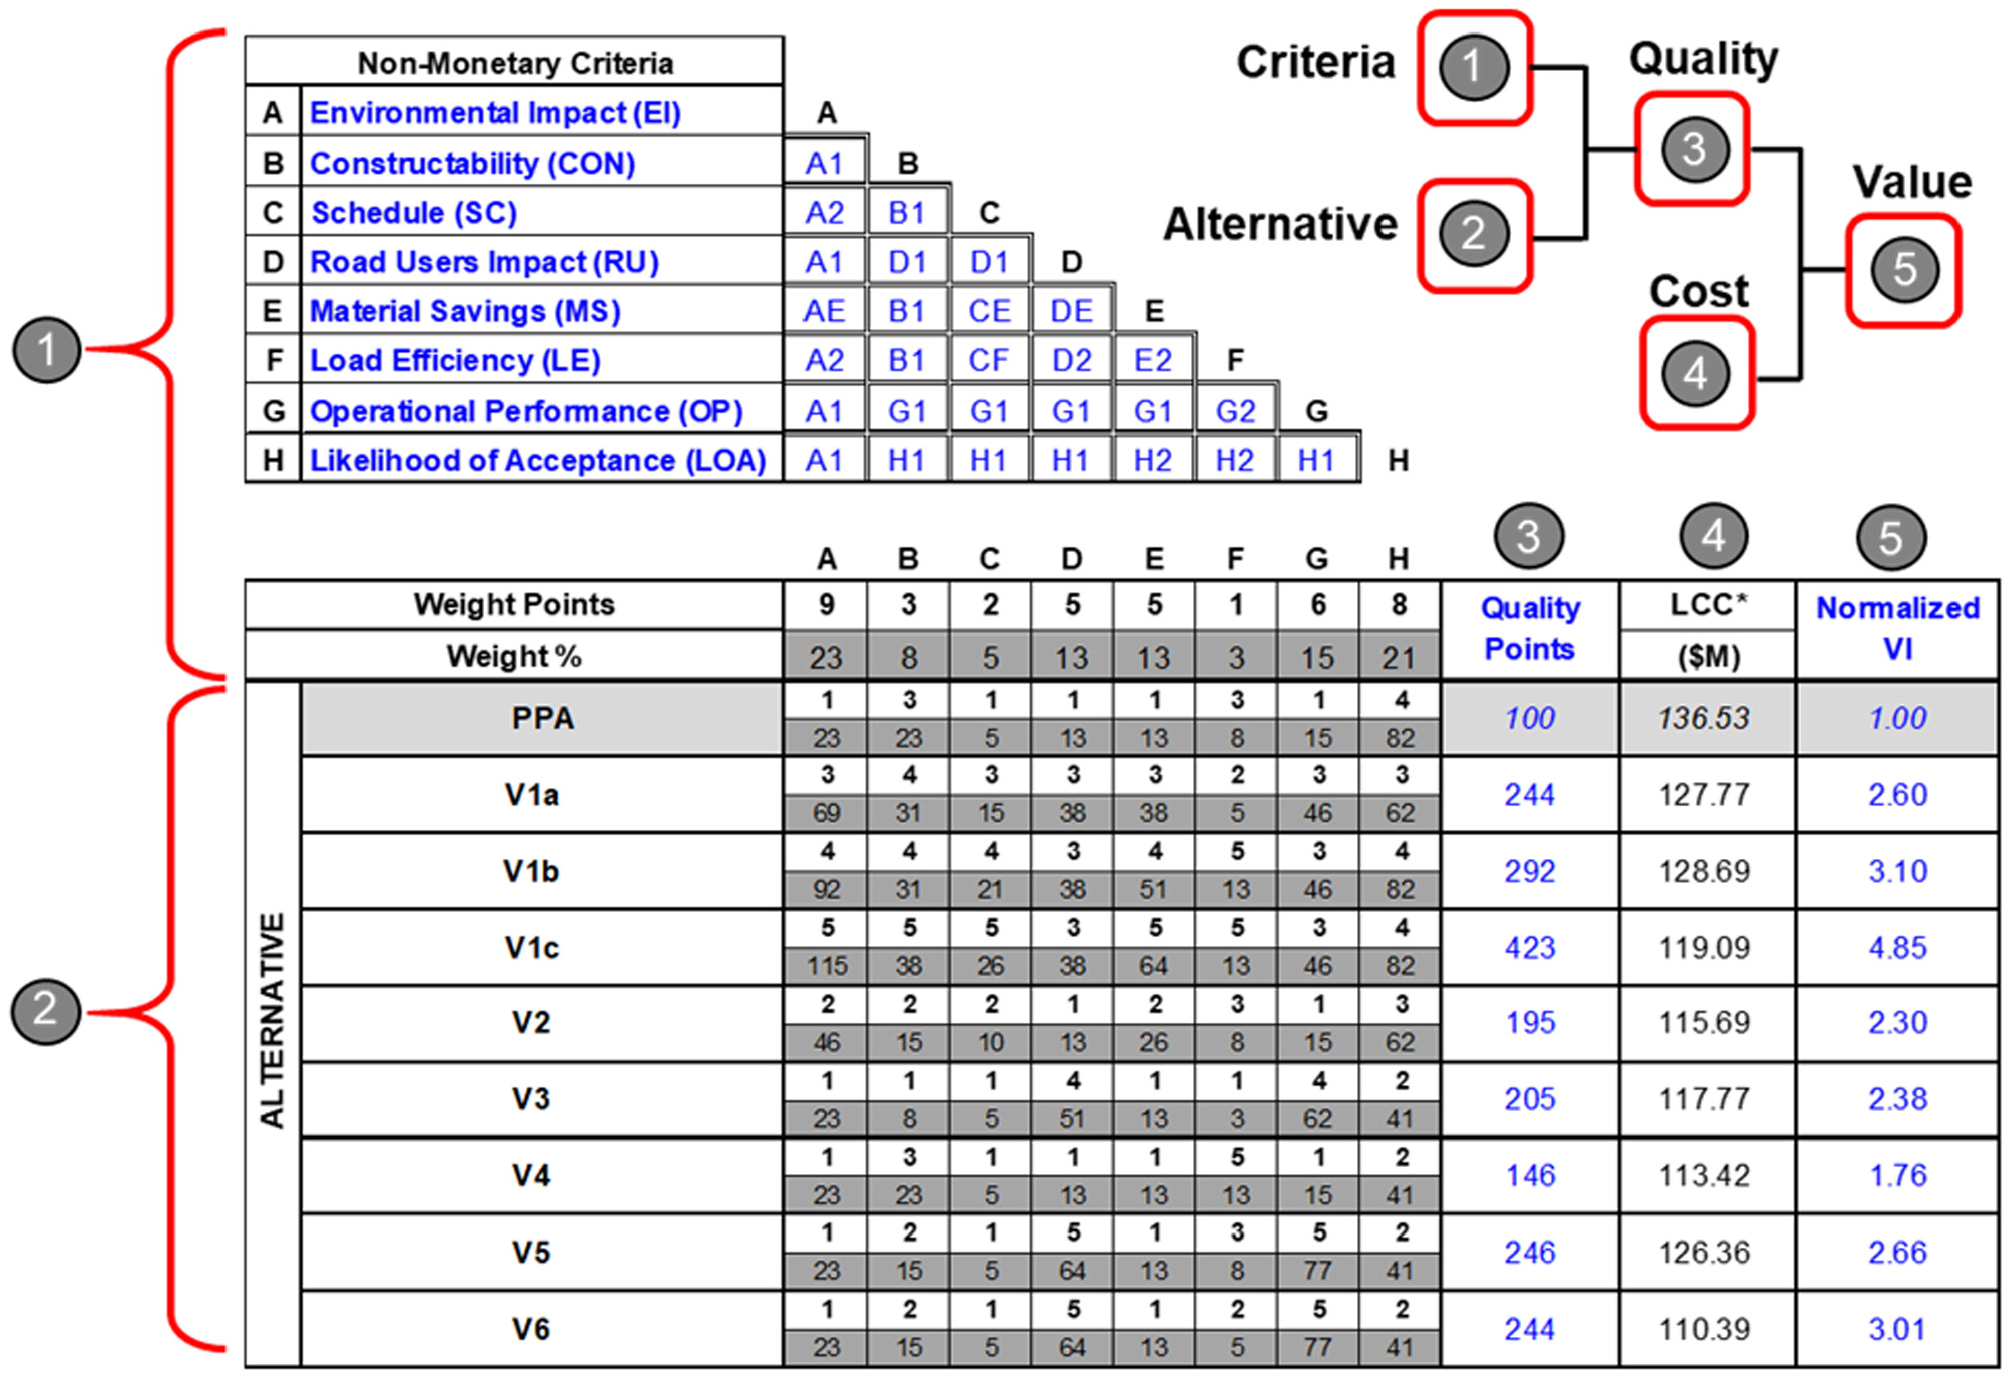
Weighted evaluation matrix (WEM) for the considered alternatives (100-year LCCA at present value).
As shown in Figure 9, the considered alternatives are listed below the non-monetary criteria. Each alternative is rated against all others using a five-point Likert score from 1 (poor) to 5 (excellent) ( 10 ). The function point for each alternative is the weight of the function multiplied by the score of this alternative for this specific criterion (e.g., material saving). The total quality (performance) points for each alternative are the sum of the points that the factors A through H receive (sum of the row). This is repeated for all alternatives. To enhance judgment and minimize bias, the evaluation team has conducted detailed brainstorming sessions to agree on the relative importance of the set criteria. Similarly, the team has based their scoring for the alternatives on quantitative technical input/parameters (e.g., span length, superstructure weight). For example, the longest span bridge (fewest piers) received the highest score. The dual symbol in the matrix is indicative of the relative importance of the criteria with respect to each other. For example, MS was judged as important as EI, SC, and RU. However, it was considered less important than CON.
Alternative V1c can provide a high-quality solution as it was given a very high rating (4 or 5 points) in many criteria (EI, CON, SC, MS, LE, and H). Conversely, alternatives V2, V3, and V4, with many low scores (1 to 3 points) are expected to provide less quality. It is important to note that the product of the criteria importance (weight %) times the score for the alternative decides the quality points an alternative can receive in any given criteria. The sum of the quality points is what finally gives the overall performance for the alternative. Together with the finances (captured in LCCA), the quality points gauge value for
Using the normalized
Cost versus Value
To support decision making, the reduction in cost for each alternative should be closely examined. This cannot be performed in isolation from value considerations. The unit cost per deck area was calculated for the PPA and the proposed alternatives. This estimate is based on the total construction cost before commissioning (end of year 5). As shown in Figure 10, the unit cost of the PPA far exceeds the New Jersey non-NHS bridge replacement unit cost ($566/ft2) reported by FHWA in 2019 (
6
). The proposed alternatives, except V1a and V1b, fall below this limit. Surprisingly, the NJ limits are much higher than those recorded nationwide ($223/ ft2) as well as the average of the tristate (NJ, NY, and CT) at $382/ ft2. Based on LCCA (Figure 8), all eight alternatives have shown total savings—based on LCCA—that vary between 7% and 21% with respect to PPA. The corresponding savings per square foot are very comparable (3% to 25%) with some fluctuation. The relative value of alternatives using the normalized

Cost per square foot of the bridge, the relative value of alternative and savings.
All proposed alternatives reduce the total investment and LCC of the project. The VE recommendations were designed to further reduce the EIs compared with the PPA. All alternatives are viable options with a range of merits. For instance, V1c was found to outperform all other alternatives, as presented in Figure 10. However, V6 and V1b provide a good balance between value and initial cost, contingent on the owner’s funding availability and preferences. Alternative V1c provides a range of advantages over the base design (PPA) including lower initial construction cost, lower maintenance and operation costs, significantly lower bridge LCC, lower interruption to marine traffic in the area, and reduced environmental and ecological impact. This alternative can potentially shorten the construction time.
It is noteworthy that some of the proposed bridges in this study could accommodate road widening to allow for a bicycle or pedestrian lane at a minor cost. This could further change the unit price and accordingly encourage a wider array of sub-options for decision makers. The time savings from the reduction in the number of substructure elements (piers) were not captured in the analysis. The wider navigation span improves the quality of life, minimizes the EI of construction, reduces the risk of marine collision, and enhances preservation. These benefits, should they be accounted for, would further support the feasibility of the alternatives proposed in this study. The use of lightweight concrete (LWC) in alternatives V1a, V1c, V2, V3, V4, and V5 provides a range of structural characteristics and architectural solutions, which can be equally viewed favorably from the sustainability perspective. In fact, the use of lightweight byproducts as aggregate in LWC enables a unique environmental edge over HPC/NWC ( 30 ). LWC has been proven to provide a sustainable structural system, without compromising performance.
Conclusions and Perspective
The rigor of this study has provided insight into the key aspects contributing to an optimized bridge design. Unlike casual VE practices used for bridges, the proposed decision-making methodology uniquely incorporates detailed aspects of bridge design, inspection, construction, and maintenance with a strong emphasis on the use of building materials, waste minimization, and sustainability metrics, including environmental, social, and economic impacts. Despite the somewhat project-specific nature of the VE analysis conducted, the adopted method is simple, systematic, and versatile enough to include resiliency and more sustainability aspects in the brainstorming stages of VE. Project functions were methodically identified and further validated using the FAST technique. The VE analysis herewith integrates the environmental impact and material selection into the design process and assessment of bridge performance. Embracing sustainability in the VE process aids transportation projects to be more environmentally just and ensures cost-effectiveness. Most of the bridge structural systems considered in this study are quite common; thus, the results could be broadly applicable.
LCCA was conducted for typical bridges with preliminary but detailed design, including common preservation and inspection activities. The design aspects that contribute to performance were objectively set upfront to estimate value using WEM. While the selected criteria and the setting of their relative importance for WEM may appear subjective, this method is more rigorous than ad hoc methods and rules of thumb commonly used to estimate value. The use of WEM has shown that the optimal bridge design is not necessarily PPA. As such, this VE methodology can ultimately push the boundary of practice and ensure more conformity with modern VE implementation in civil engineering. The findings of the proposed analysis provide a framework for further research on the impact of VE, especially in the field of bridge management. Additional case studies—with more bridge systems and in other regions—should be conducted to further support the findings of this study. The following, however, summarizes a realistic perspective for VE implementation in bridge design and potential barriers.
VE Methodology and Tools
The current use of VE in bridge design is apparently modest and suffers from some inconsistencies. For example, the present VE practice in the USA is limited to the conceptual design of bridges (i.e., alignments, roadway, etc.). This is attributed to the VE analysis being performed in the concept development phase, which typically excludes structural design and operating conditions. Like many other structures, bridge design and construction have experienced irregularities and anomalies in the decision-making phase. While the selected criteria and the setting of their relative importance for WEM could be subjective, this method is more rigorous than the ad hoc methods and rules of thumb commonly used to estimate value. Subjectivity and personal judgment can be offset by exercising balance in the background and expertise of the VE evaluators. The technical strength of the participants as well as a reasonable level of detailing in design are necessary for meaningful VE analysis.
Sustainability Dimension
The use of sustainability is a complex issue that requires a more comprehensive criterion. The incorporation of sustainability in VE encourages more sustainable construction by offering additional credits or points to materials that meet certain requirements—for example, minimum content recycled or recyclable, natural or renewable materials including the environmental impacts to produce and transport of the material. Bridge engineers are typically oblivious to the importance of the environment, sustainability aspects, and conservation of natural resources. They are by default concerned with technical aspects of the structural design. In this context, sustainable bridge design merely abides by the required environmental permits and adheres to current regulations.
Decision-making Culture
The cost and effort in conducting VE are intuitively offset by the increase in value, which should encourage stakeholders to embrace VE for bridge design. It is imperative for decision makers to distinguish between value and cost in assessing alternatives. Value is a measure of worth and observing the return on investment. Value and worth are often perceived as relative terms subject to the liking and interest of the decision makers and the nature of the project. In this context, value is typically captured or perceived as a direct monetary gain in a given project. The dollar amount of the environmental and ecological impact, resource depletion, aesthetics, and quality of life (e.g., road user cost, noise) is often unaccounted for or given disproportionate attention. As such, a balance needs to be maintained between the economy, environment, and society for changing business cultures and engineering practices ( 31 ). Rigid design schools and favoritism are also responsible for the limited versatility in bridge designs, particularly resistance to use alternate sustainable materials (e.g., LWC). This is typically coupled with a lack of appreciation and understanding of VE potentials.
VE Implementation for Bridges
The VE process is generally not used to its full potential (only 7% of the total transportation spending in the USA). Federal legislation requires the application of VE to projects greater than $40 million. State DOTs followed the federal guidelines and negated VE implementation for smaller transportation projects. For instance, the authors estimated that the transportation projects in NJ under $40 million amount to 54% of the total number of projects awarded over the last four years. These projects are given less priority in receiving VE analysis. Such drift is probably fueled by the misconception that the effort and time needed to perform VE are unjustifiable, particularly for small projects. This, even though past VE studies implementation in small transportation projects have been proved to shorten project schedules and provide cost savings and a higher overall value ( 32 ). Furthermore, the current VE application to bridge design (if any) involves a review of the structural design alternatives rather than rigorous design. As such, the proposed decision-making method may still face serious difficulties before it can be fully embraced in routine bridge design practices.
Regulations and Incentives
FHWA and State DOTs should consider detail-oriented complementary VE studies to leverage the structural, sustainable, and economic advantages of new construction materials and designs. To combat resistance to new and innovative construction materials and methods in bridge projects, decision makers must embed sustainability principles early in the project design and revisit them during construction. It is important to note that the sustainability criterion used in this study can be further broken down into other aspects and sub-classes of sustainability over the life of the project (e.g., improved resilience, and reduced energy use and emissions). LEED (Leadership in Energy and Environmental Design) and similar green certifications are typically used to capture environmental aspects and sustainability in buildings. However, parallel systems are not routinely embraced in bridge design. Key players in construction generally exhibit a lack of appreciation for sustainability and long-term gains ( 33 ), which is one of the major challenges facing VE implementation for bridges. In the absence of attractive monetary incentives, clear policies, and enforcing regulations, it is unlikely that stakeholders and practitioners could voluntarily choose to implement rigorous VE methods for bridge design.
Supplemental Material
sj-docx-1-trr-10.1177_03611981211062154 – Supplemental material for Value-Engineering Methodology for the Selection of an Optimal Bridge System
Supplemental material, sj-docx-1-trr-10.1177_03611981211062154 for Value-Engineering Methodology for the Selection of an Optimal Bridge System by Ahmad A. Mousa, Mohab Hussein and Ahmed Farouk Kineber in Transportation Research Record
Footnotes
Author Contributions
The authors confirm contribution to the paper as follows: study conception and design: Ahmad A. Mousa, Mohab Hussein, and Ahmed Farouk Kineber; data collection: Mohab Hussein, and Ahmed Farouk Kineber; analysis and interpretation of results: Ahmad A. Mousa, Mohab Hussein, and Ahmed Farouk Kineber; draft manuscript preparation: Ahmad A. Mousa, Mohab Hussein, and Ahmed Farouk Kineber. All authors reviewed the results and approved the final version of the manuscript.
Declaration of Conflicting Interests
The author(s) declared no potential conflicts of interest with respect to the research, authorship, and/or publication of this article.
Funding
The author(s) received no financial support for the research, authorship, and/or publication of this article.

Supplemental Material
Supplemental material for this article is available online.
References
Supplementary Material
Please find the following supplemental material available below.
For Open Access articles published under a Creative Commons License, all supplemental material carries the same license as the article it is associated with.
For non-Open Access articles published, all supplemental material carries a non-exclusive license, and permission requests for re-use of supplemental material or any part of supplemental material shall be sent directly to the copyright owner as specified in the copyright notice associated with the article.
