



Abstract
The seed moduli selected for backcalculation analysis of multilayer flexible pavement can have significant effects on the performance of backcalculation software and, sometimes, the final solutions of the overlay designs. Therefore, this paper aims to analyze the variability of the resilient moduli (MR) obtained by backcalculation programs, taking different seed moduli as input data. To this end, data obtained from non-destructive structural evaluation (falling weight deflectometer [FWD]) were used in three different regions of Brazil. Thereafter, the deflection basin values and the seed moduli were inputted into the two backcalculation methods: linear elastic and finite element. By varying the RM seed of one of the layers by 100%, the percentage differences in the backcalculated moduli were computed within the range of typical resilient modulus (MR) values for paving materials, and close to the upper and lower thresholds of the usual moduli in Brazil. Furthermore, with the data provided by backcalculation software and crack monitoring, these were inputted into the flexible pavement design software (MeDiNa) to also analyze the influence of the seed moduli variability on the pavement overlay design, through the cracked area percentage parameter. Therefore, it was found that the seed moduli have a high influence on the backcalculated moduli, with percentage differences of up to 68.30%, mainly for the base and subbase layers of pavement. Even with the differences obtained in the values of the backcalculated moduli, it was found that the seed moduli did not cause a significant impact on the overlay design in which the percentage difference between the cracking predicted for the surface layer was less than 2.5%.
Keywords
Departments of transportation around the world invest a lot of money each year into providing and managing transportation infrastructure resources to meet agency and public expectations. Pavements are an important component of those transportation assets, with pavement rehabilitation and maintenance being highly critical, expensive, and possessing complex elements. This is especially true at the moment, since a significant percentage of the pavement networks are coming to the end of their life cycle, and pavement rehabilitation has become even more challenging given the funding constraints faced by state transportation departments. The pavement serviceability is related to its own functional and structural properties. Clearly, the usefulness of a pavement will decrease in time as a result of traffic, climate, and other factors. Decrease in the serviceability will lead to higher operation and user costs, while the comfort of the road user is reduced. To enhance pavement quality, an effective maintenance and rehabilitation program should be set up at the right time and right place ( 1 ).
To design a pavement rehabilitation, it is essential to know the pavement condition that is subject to traffic and environmental factors. Most of those types of rehabilitation design are carried out in two steps: the first is based on the identification of surface distress and its structural problems, and the second is the rehabilitation solution, where the original pavement performance is re-established ( 2 ).
Pavement condition monitoring, including measurements of surface distress such as rutting and cracking, smoothness, and skid resistance, is fundamental for pavement management systems (PMS). Nevertheless, pavement surface distress may not reflect the existing damage or cracks within the pavement structure. Thus, it is possible that the actual pavement structure is damaged while the surface distress survey presents that the pavement condition is still good. On the other hand, structural surveys can provide an indication of pavement structural stiffness to evaluate the pavement condition ( 3 ).
Typically, the evaluation of the in-service structural condition of the pavement is part of the adequate treatment activity selection. The structural condition can be assessed using two approaches: destructive testing (DT) and non-destructive testing (NDT). The DT method depends on coring the pavement to evaluate the individual layer’s condition and acquire materials for further laboratory testing. Nevertheless, this process consumes considerable amounts of time and money, requires more labor, and damages the pavement. In the last decades, NDT methods have become more utilized because they can simulate field conditions that are difficult to simulate in the laboratory, and they are less time and money consuming. The NDT methods that are used to characterize the pavement’s structural conditions may be classified into two main groups: surface wave propagation and deflection basin methods. The first class of tests is based on the phenomena of surface waves in which different wavelengths propagate with different velocities in layered systems. The second group is based on the measurement of surface deflections caused by the application of a given load ( 4 ).
Amongst the NDT devices, the falling weight deflectometer (FWD) is the most widely used for evaluating flexible pavements (5, 6). The FWD simulates the moving wheel by applying an impulse load having a 30–40 ms duration and measures the pavement surface deflections at various offsets from the center of the load. The data generated from FWD tests are generally used to evaluate the existing structural condition of the pavement by estimating the layer moduli. This process of estimating pavement layer parameters is commonly referred to as the backcalculation method. In the backcalculation process, pavement deflections are usually determined using layer elastic theory (static approach), layer thickness, and assumed layer moduli. An interactive approach is used to vary layer moduli until the calculated deflection basin matches the FWD-measured deflection basin. A final solution is found when the difference between the calculated and measured basin is minimized ( 7 ). Figure 1 shows an example of a structure and basin deflection used in the backcalculation process.
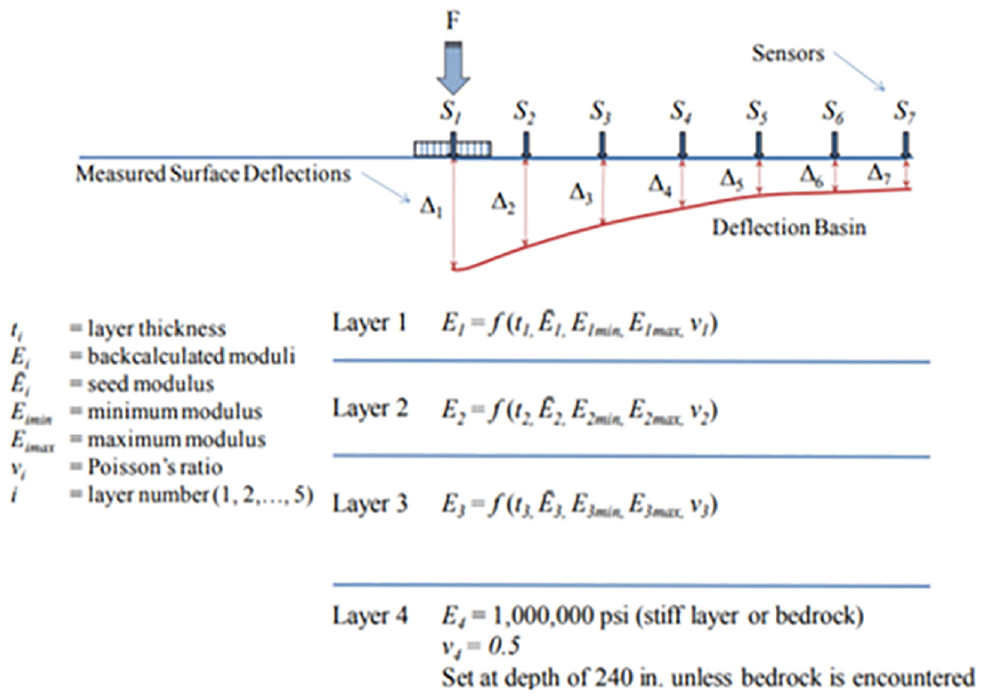
Example of layered structure and deflection utilized in the backcalculation process ( 8 ).
In the last 20 years, a series of backcalculation software have been developed based on different theories. However, like any other method, the backcalculation process has challenges and inherent limitations. Each backcalculation software application uses one of a range of methodologies, from numerical or finite element methods (FEMs) to the simplest, such as equivalent thickness methods—thus making the results different if different software and methods are used. For most road agencies without established databases, data management systems, or both, the software-required parameters (thickness and Poisson ratios) are simply assumed, so causing the final results (moduli values) to be relatively variable ( 9 ).
The value and accuracy of the backcalculated moduli are highly dependent on the backcalculation procedure, and several process-related factors can affect the final convergence. The main problems that any classic backcalculation procedure faces are convergence, accuracy, and the number of layers in the backcalculation program. The selection of the initial moduli (seed moduli) controls the convergence of the backcalculation procedure to pavement moduli that minimizes the mean square error between the measured deflection basin and the backcalculated deflection basin using the backcalculated moduli ( 10 ).
Amongst these factors, the main ones are the behavior of the granular layers, presence of stiff layer, bonding condition, and seed moduli. In view of this, it is possible to obtain more than one solution for the same deflection basin, since one basin can yield several different configurations. The problem of lack of uniqueness in the solutions makes backcalculation a complex process; therefore, careful development of the pavement model, proper program control, and engineering judgement are needed (11–13). In addition, convergence to an optimal result because of the use of “seed” moduli values during the backcalculation process, may at times lead to subjective and erroneous final moduli results ( 9 ). According to Lytton, seed moduli are the starting or assumed initial values of the layer moduli, and, in some methods, these are either generated from the measured deflections, or from regression equations, or they are presumed values ( 14 ).
In software where seed moduli are required, their selection may affect the number of necessary iterations and the time required before an agreeable solution is achieved, potentially the final moduli. If an incorrect selection of seed moduli is made, the analysis may possibly fail to find a solution within the tolerance specified between the calculated and measured deflections. In this case, an alternative set of seed moduli can provide an acceptable solution before reaching the maximum allowable number of iterations. Usually, if the tolerance is sufficiently narrow, the backcalculated moduli that are calculated are not significantly affected by the values chosen for the initial set of seed moduli ( 15 ).
Many studies have highlighted the influence of the choice of seed value for elastic moduli on the performance of backcalculation software for flexible pavements (16–21). Usually, researchers and engineers have selected seed values for pavement layer moduli by one of the following methods:
by the use of engineering judgement based on past experience
by the use of recommended seed values from backcalculation software
by the use of estimated values from the usual range of moduli found in literature and standards for similar materials
by the use of empirical equations (e.g., equations based on empirical rules)
As another alternative, researchers have conducted alternative studies by using deflection basin parameters (DBPs), since they are simple and easy to use (22–25). Some studies have focussed on correlating DPBs with pavement layer resilience moduli (23, 25). Using these empirical equations, an initial estimation of the resilient modulus (MR) for input data in the backcalculation programs is possible. For instance, Xu et al. developed equations to estimate elastic moduli of each layer by using the logarithm of some parameters as explanatory variables, as shown in Equations 1 and 2 ( 22 ).
Full-depth pavement:

Aggregate base pavement:

where
Rocha et al. also studied the use of DBPs in pavements and produced some equations to predict preliminary resilient moduli (RM) of five- and four-layer pavements ( 25 ). Nevertheless, the applicability of each of these methods tends to be limited and restricted to a specific region, pavement design, material type, and climate condition ( 26 ).
Some studies have investigated the effect of seed moduli on backcalculation results by different methods. Rwebarngira et al., by using BISDEF and MODCOMP2, evaluated the effect of seed moduli and found out that the value of initial modulus had very little impact on the backcalculated moduli for the paved surface ( 16 ). For example, when the surfacing seed modulus was doubled, only a 4% change in the backcalculated moduli occurred. Besides that, the authors concluded that the seed moduli of the surface course had no effect on the backcalculated subgrade and base moduli, and changes in the seed moduli of the base and subgrade course had a negligible effect on the backcalculated moduli. Lee used different seed sets (varying several elements) and reported that the seed moduli have a significant effect on the convergence and efficiency of dynamic backcalculation ( 17 ). In addition, the author observed that an unreasonable set of seed moduli may cause the backcalculation to converge to unrealistic results. Lee et al. used parameters backcalculated from the linear analysis to estimate the seed values for the subsequent nonlinear analysis in which the stress-dependent moduli layers were backcalculated ( 18 ).
Maina et al. analyzed seed moduli using dynamic back analysis for layer moduli computed by DynaPAVE3 software, and it was observed that proper selection of seed layer moduli using random numbers, together with improvement of algorithms for forward and backcalculation analyses, reduced the influence of seed layer moduli on backcalculated results ( 19 ). Matsui et al. studied the effect of seed moduli on the backcalculation procedure (static and dynamic) using FEM, and it was noted that the backcalculated results were greatly affected by the seed moduli, especially for the upper layers ( 20 ). Fwa and Rani developed a seed moduli generation algorithm (called 2L-BACK) based on a closed-form modulus backcalculation solution for two-layer flexible pavements, and evaluated the effectiveness of the procedure by using two backcalculation software ( 21 ). In that study, the authors found that the results of the study suggest that the algorithm can be adequately incorporated into backcalculation software for multilayer pavements. Some studies have analyzed the effects of backcalculation moduli on the overlay design (27, 28).
In addition to these backcalculation methods, new models have been developed recently where the seed moduli input are not necessary. Dynamic models are used for forward calculation, being able to model the inertial effects, the viscoelastic behavior of the asphalt concrete layer, and the damping of the materials ( 26 ). Soft computing methods, such as artificial neural network (ANN), have been used in the backcalculation of pavement moduli because of their ability to learn the internal connection of data and solve complicated nonlinear problems ( 29 ). Some methods are based on genetic algorithms (GA), which can serve as an optimization tool and facilitate the calculation of the moduli values ( 30 ).
The Purpose and Scope of the Paper
The objective of this study was to evaluate the effect of seed moduli on the backcalculation and overlay design processes. The evaluation is carried out based on backcalculation results of pavement deflections tests in three different regions of Brazil. The experiment was conducted by using two backcalculation software (ELMOD and BackMeDiNa) and one overlay design software (MeDiNa) to evaluate the influence of seed moduli. In addition, a comparison was made of the moduli obtained from the laboratory MR tests with those from the FWD tests, and relations between the two software were analyzed.
Methods
Field Tests and Data Collection
For this study, three stretches of road were used for analysis: one urban stretch (Federal University of Juiz de Fora [UFJF] ring road); and two Brazilian federal highways (BR-116 highway and BR-040 highway). For each stretch, NDT (FWD tests) and DT (drilling samples) for laboratory testing were carried out. Figure 2 illustrates the three stretches used in this study and their locations, and Table 1 summarizes the segments of each stretch, as well as the thickness of the layers. Additional information about the site and the pavement is provided below.
Specifications of Test Stretches
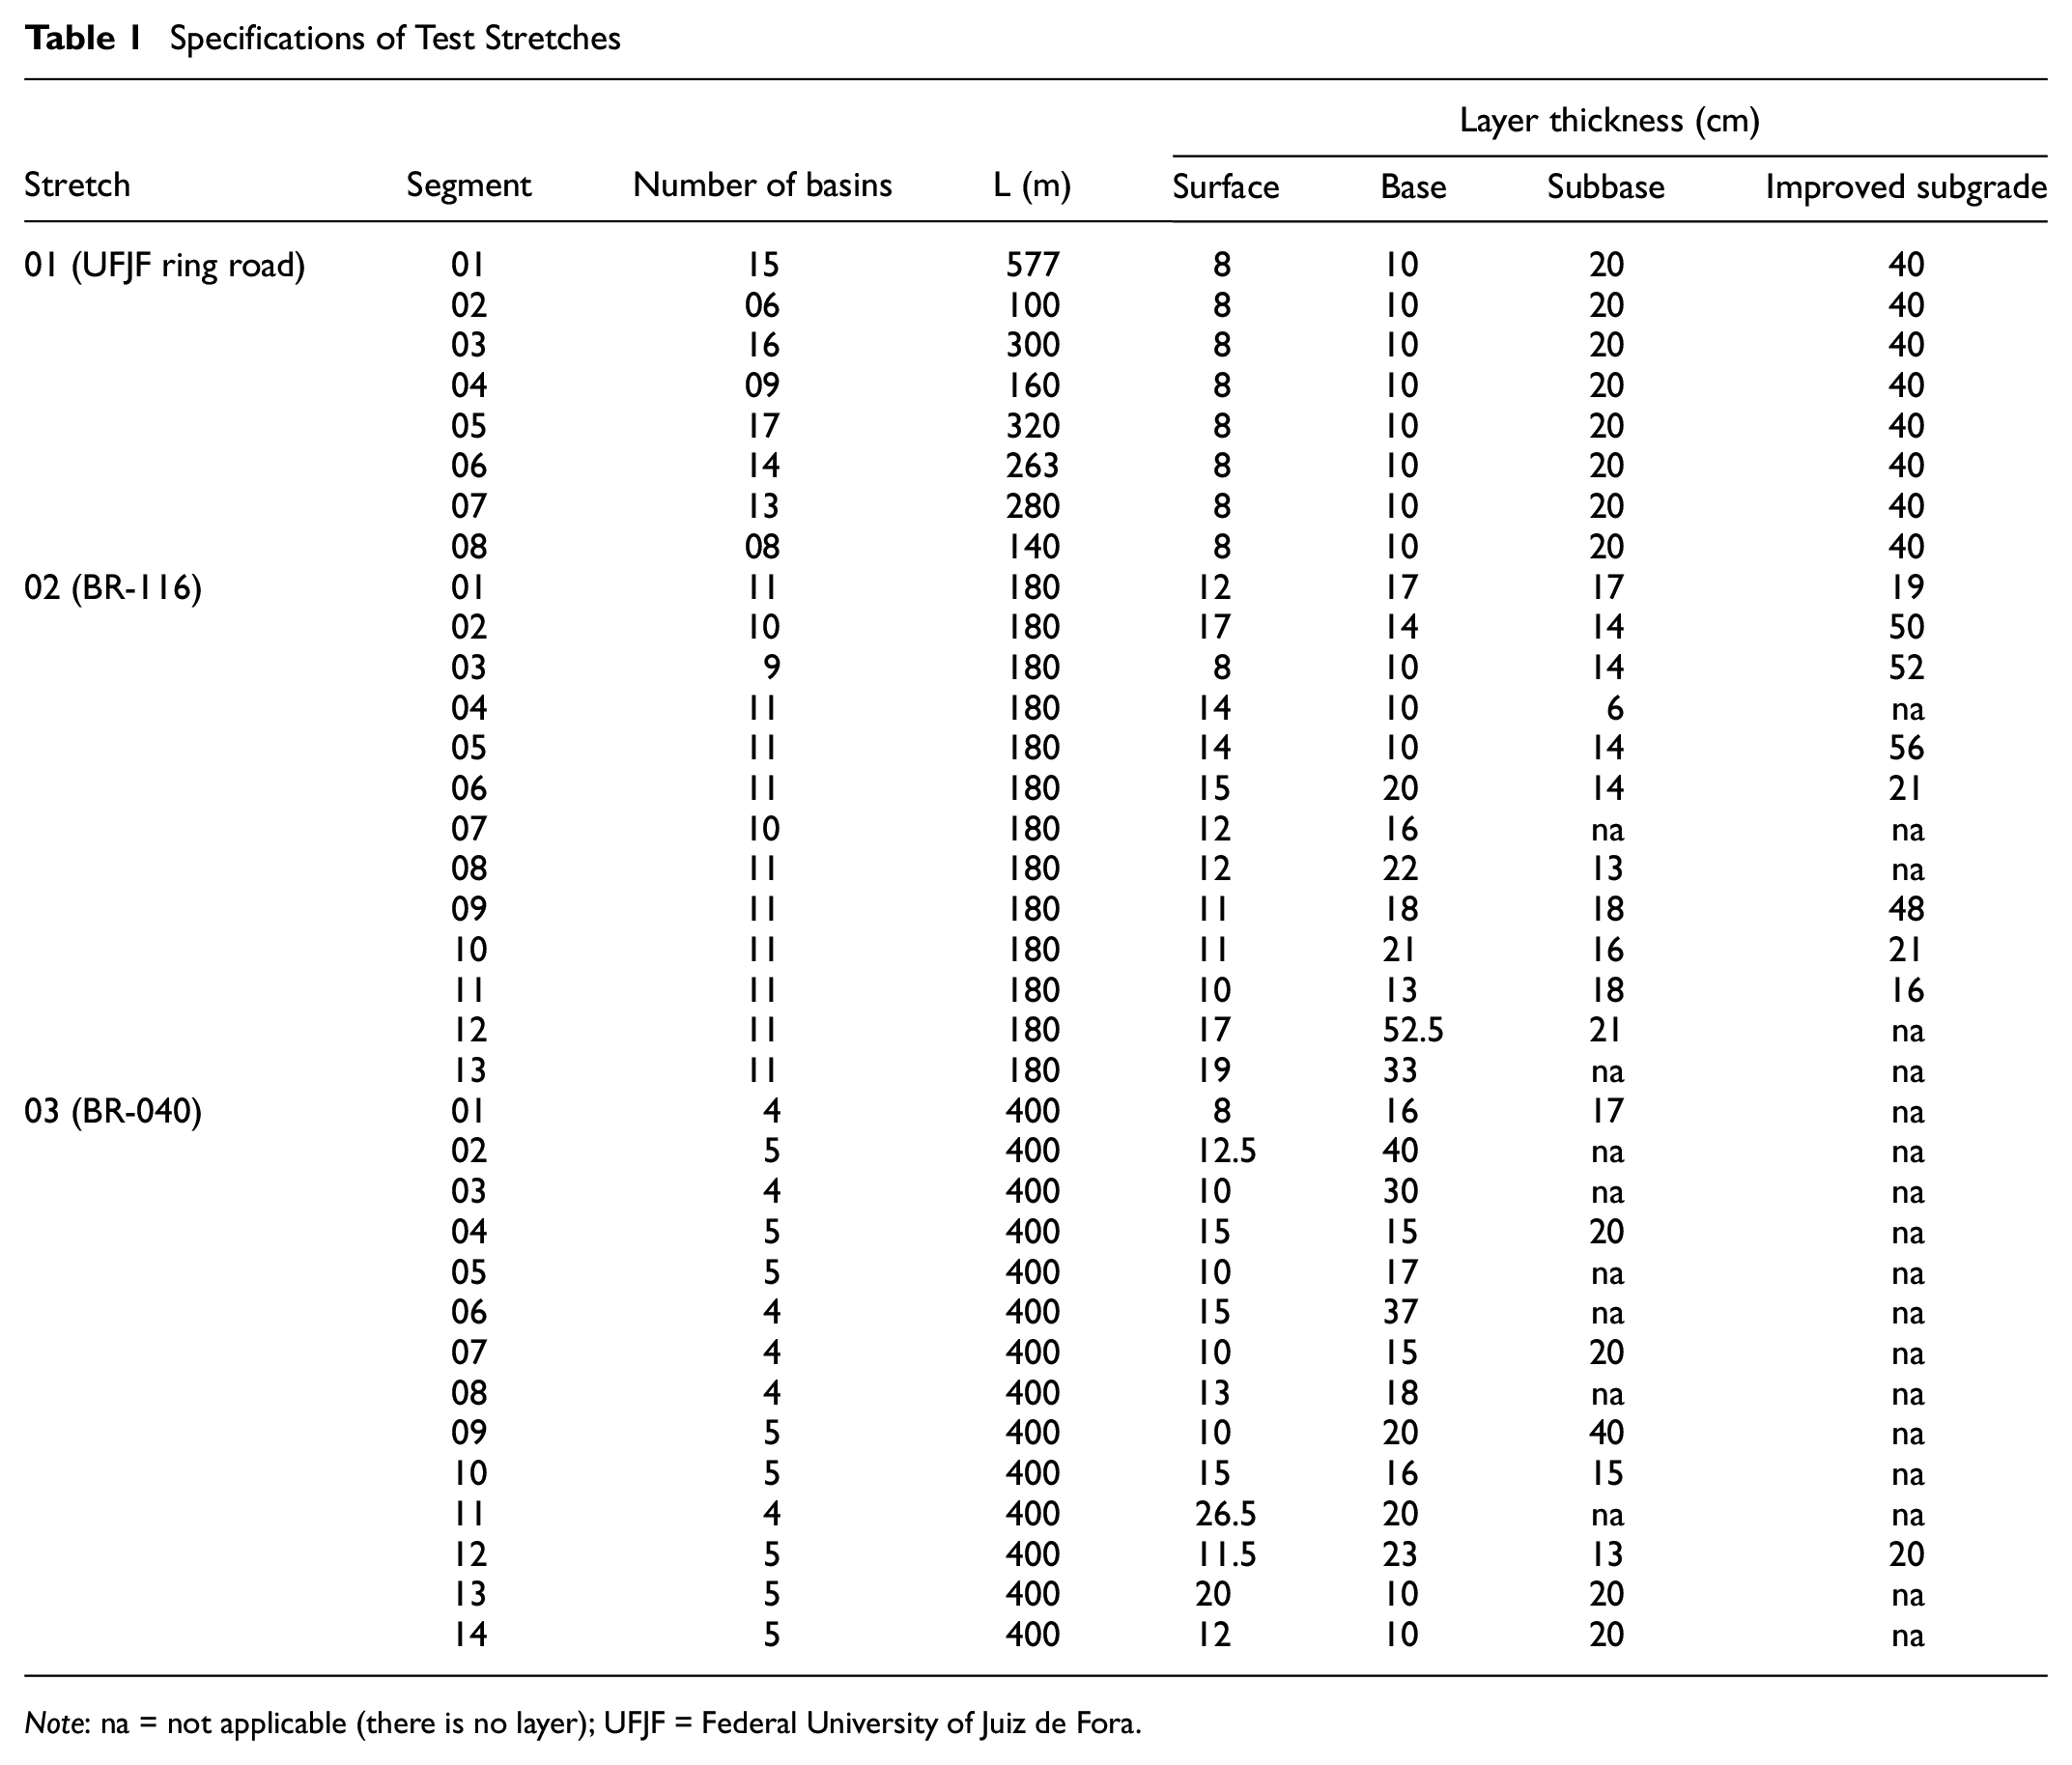
Note: na = not applicable (there is no layer); UFJF = Federal University of Juiz de Fora.
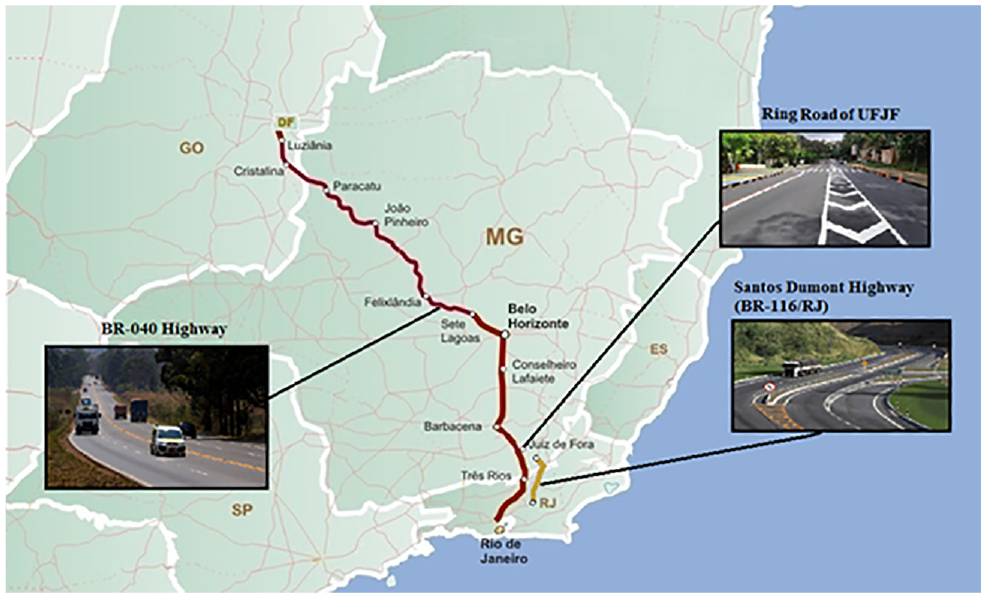
Locations of the three stretches studied.
Ring Road of Federal University of Juiz de Fora (UFJF)
The UFJF ring road belongs to the state of Minas Gerais in Brazil and has a length of about 2,140 km.
The FWD device used in this study was the 8833 KUAB and the tests were performed on the internal wheel path at a 20 m interval. At each test location, nine sensors were used to measure surface deflections at 0, 20, 30, 45, 60, 90, 120, 150, and 180 cm from the center of the loading plate. The load was about 4,100 N (40.2 kN) and the radius of the plate used was 15 cm. Along 2,140 m of section extension, 107 stations were mapped. However, since there were elements of traffic calming system, these were not included during the study, which resulted in 98 stations. To group data by sections with similar characteristics, the basins were divided into eight homogenous segments by using the cumulative difference approach and the maximum deflection as a parameter of separation.
Santos Dumont Highway (BR-116/RJ)
The BR-116 highway is a federal highway with a length of 4,490 km, which extends from the city of Fortaleza-CE to Porto Alegre-RS (on the border with Uruguay). The section studied in this research is part of BR-116/RJ highway (Santos Dumont Highway, usually known as Rio-Teresópolis) managed by Rio-Teresópolis Concessionaire (CRT), with a length of 142.5 km.
The deflection data for the stretch of BR-116 were performed by using the 8833 KUAB device (the same used for stretch 1). The highway administration established specific segments for detailed study, named sampling units (SUs), each one with a length of 180 m, and used as homogeneous segments. In total, 13 SUs and 128 deflection basins were evaluated for stretch 2.
BR-040 Highway
The BR-040 highway is a federal radial highway, with a starting point located in Brasília/DF, at the junction with BR-450 and BR-251, and with an end point located in Rio de Janeiro/RJ, at Rodoviária Novo Rio. The section used in this research is located between Brasília/DF and Juiz de Fora/MG, with 936.8 km of extension. In December 2013, the section was granted to BR-040 Concessionaire, more commonly known as Via040.
For the Via040 section, the deflectometric measurement was performed by using the FWD Dynatest 8000. As well as stretch 2, the highway administration established SUs, and 14 SUs were used in the research, with 64 deflection basins. In each of the analyzed SUs, five and four test points were performed with the FWD, with a distance of 100 m between them. The measurements of the furthest deflections (1,500 and 1,800 mm) were not calculated, since they were outside the scope of the used measuring device.
Destructive Tests
To investigate the material characteristics further, samples were drilled and collected for laboratory tests. For stretches 2 and 3, it was not possible to obtain the field resilience moduli of all layers. The tests performed with the materials were: granulometry test, compaction tests, MR, and rutting.
It should be noted that the MR of the granular layers has a non-linear behavior. However, in the tests, the final results are not constant, since different strains are applied to the samples. As some backcalculation software do not consider the non-linear behavior of the layers, and in an effort to relate such backcalculated values to the laboratory ones, a constant value for the moduli is attempted. The most usual solution is the average between the moduli obtained in different strains applied during the triaxial test. This method of calculation was used in this study to compare the moduli obtained from different methods.
Backcalculation Methodology
To evaluate the effects of the seed moduli on the backcalculated moduli, two multilayer backcalculation programs, namely, BackMeDiNa and ELMOD (version 6.0) were used in this study.
BackMeDiNa is a routine tool of the new Brazilian design method (MeDiNa). The calculation to find the RM is done iteratively using the AEMC (multi-layer elastic analysis program) module for linear elastic analysis. The process is based on the variation of the maximum and minimum RM values, around a central value, until a theoretical basin close to the field deflection basin measured by the FWD is obtained. To this end, the program compares the root mean square (Equation 3) value of the differences between the measures of field deflections and those calculated ( 31 ).

where
RMS = root mean square error (μm),
N = number of geophones.
ELMOD 6.0 was developed by Dynatest International A/S, and is used to evaluate the pavement layer moduli and overlay design based on FWD deflection data. There are three backcalculation options available in this program: linear elastic theory (LET), FEM, and method of equivalent thickness (MET). In this research, FEM was chosen to evaluate the effects of the seed moduli. The program, as well as BackMeDiNa, use the root mean square method for checking errors ( 32 ).
The backcalculations were run until the percentage difference between the error of one basin and the error of the other one (with different seed moduli) was less than 10% (Equation 4), by clicking the “backcalculation” button several times.

where
Inputs to Backcalculation Analysis
To enter the values of the initial modules into the two backcalculation programs, two backcalculations were run for each basin, varying only the seed moduli of one of the layers, while the other moduli were held constant. At first, the surface layer MR was estimated by Equation 2, and two BackMeDiNa and ELMOD program files were opened for data input, one with the MR value calculated by equation, and the other with the doubled value (100% variation). The seed moduli of the other layers were held constant and taken from the BackMeDiNa database. In both software, the full-bond condition between the interface was used and Poisson’s ratios were obtained from tables for the usual paving material used in Brazil.
Figure 3 illustrates the procedure, described for two different modulus inputs for the same basin using ELMOD. For this example, the value for MR of the surface layer by Equation 8 was 2,659 MPa, while the 100% variation of that value raised the MR to 5,318 MPa. The moduli of the other layers were held constant for the two analyses.

Example of different modular sets for the same basin, varying only the surface module (ELMOD).
The choice for varying the seed moduli by 100% was made so that the inputs in the program were within the range of typical MR values for paving materials, and close to the upper and lower thresholds of the usual moduli in Brazil. Obtaining the initial value of MR by Equation 8, it was noted that this value was low in relation to the typical resilience modulus values. When multiplied by two, the MR values fitted close to the extreme limits.
Once the process for the first layer (surface layer) of all basins had been carried out, the next step was the variation of the underlying layer (base). The input value of the first seed modulus of the base layer was the lowest obtained in the previous backcalculation for such a layer. Afterwards, the backcalculations were run in the same way for the underlying layers (subbase, improved subgrade, and subgrade).
The backcalculations were run until the difference between the error of the basin produced by the first seed modulus and the error of the basin produced by the second seed modulus was less than 10%. To evaluate the final difference, a percentage difference was performed between the backcalculated moduli produced with different seed moduli according to Equation 5:

where
Design Overlay
In addition to the backcalculation process, a parametric analysis by using the mechanistic-empirical pavement design software called National Pavement Design Method (MeDiNa) was conducted to study the effects of seed moduli on performance of the overlay design.
MeDiNa analyzes the mechanical responses of layered flexible pavement systems by linear and nonlinear elasticity. This software incorporates different subroutines, such as AEMC for the stress and strain calculations, and BackMeDiNa for the elastic modulus backcalculations. MeDiNa is the backbone of the Brazilian ME [Mechanical-Empirical] design guide, which also includes design criteria that were developed based on the material characteristics for the different regions of the country ( 33 ).
In the “overlay option” provided by the program, there are two options for the user: “design,” where the user inputs the properties of the materials and traffic and the program calculates the required thickness of the overlay layer; and “evaluate the structure,” where the user inputs all data, including the thickness of the overlay layer, and the program analyzes the structure, providing the percentage of cracked area (CA) over the project period. In this study, the design and analysis of the percentage of CA in the final period of the project were used to assess the effect of the seed moduli. The sensitivity analysis was performed by using the percentage difference between the percentage of CA yielded with different sets of moduli (by the backcalculation process), as illustrated in Equation 6:

where
For the backcalculated moduli used in MeDiNa, only those obtained by the BackMeDiNa software were used. The data relating to the layers were imported directly through the file generated by the program, since they are part of the same system. In the software, to analyze or design the reinforcement structure, it is necessary to input the values of percentage of CA and the International Roughness Index (IRI) of the pre-existing asphalt layer (obtained from monitoring tests), and the data related to the new layer (obtained from database of the software). In addition, the user inputs data relating to traffic, such as classification of the road, average daily traffic (ADT), vehicle factor (VF), growth rate, and design life.
Results and Discussion
Deflection Measurements
In this study, FWD devices were used to apply loadings to pavements and measure the deflections at various locations. In the first section of pavement, the characteristic deflections of each homogenous segment were determined by setting the statistical parameter (z) value to 2.5, because of the number of samples (basins). For the second and third sections, SUs were established as homogeneous segments. Figure 4 shows graphs for the deflection basins for the three sections.

Measured deflections for: (a) the Federal University of Juiz de Fora (UFJF) ring road, (b) BR-116, and (c) BR-040.
Comparing the Backcalculated and Laboratory Moduli
In this section, the backcalculated moduli obtained by the BackMeDiNa software were compared with the laboratory results. Figure 5 shows the comparison between the laboratory and backcalculated moduli for the Hot Mixture Asphalt (HMA) layer.

Laboratory moduli versus falling weight deflectometer (FWD) backcalculated moduli for HMA layer.
As presented in Figure 5, the laboratory tests resulted in higher layer moduli than the backcalculation method for all segments analyzed. The average MR values of the asphalt layer from the laboratory procedure were about 350% higher than those from backcalculation. There is still no consensus on the different proportions between the laboratory and the in situ backcalculation moduli. For instance, Zhou determined that backcalculated HMA layer moduli were generally 20% to 30% lower than laboratory-measured moduli (tested at the same temperature) ( 34 ). Rahim and George found that the backcalculated moduli for the subgrade were in good agreement with those from the laboratory ( 35 ). However, the backcalculated moduli from the finished pavement were approximately 40% to 100% greater than the measured moduli. More recently, Kim et al. noted that, on average, the moduli determined by FWD testing was approximately two times higher than laboratory moduli ( 36 ).
The most important reasons for the difference between the backcalculated moduli and the laboratory results for the asphalt layer are the temperature and thickness of the asphalt layer. The temperature affects the stiffness of the asphalt layer and also affects the deflection data of the FWD test because the HMA layer acts as a buffer between granular layers and the FWD load ( 37 ). In addition, the difference may be justified by the occurrence of cracks in the road, which leads to a discontinuity in the stress bulb of the pavement. It is worth noting that for a range of laboratory results, the backcalculated results did not change significantly. This may be explained by the seed moduli being in a range of 3,000–9,000 MPa, which would tend to result in backcalculated moduli in the same range, while the laboratory moduli from the same sites were high for the reasons explained previously.
Figure 6 shows the comparison between the backcalculated and laboratory test moduli for the granular layers (base, subbase, improved subgrade, and subgrade) and the curve of equality (grey line). As can be seen in the figure, the results between both methods were closer to the HMA layer, but the large scatter in these values suggests that there is no clear relationship between the two methods.

Laboratory moduli versus falling weight deflectometer (FWD) backcalculated moduli for granular layers.
As can be seen in Figure 6, the major differences between the laboratory and backcalculated moduli were observed for the base and subbase layers, mainly for higher values of backcalculated moduli, whereas for the improved subgrade and subgrade layers, the values between both methods were closer to each other, essentially the values of moduli ranging from 100 to 300 MPa. Most previous studies observed similar results, where it has been found that moduli from the laboratory-measured testing were generally less than FWD results by 10% to 100% ( 38 ). Houston et al. concluded that moduli from field FWD testing are typically of higher quality and more appropriate for mechanistic pavement design than laboratory-measured moduli ( 39 ). In addition, some software recommends adjustment factors for subgrade soils and for granular bases and subbases to correct NDT backcalculated moduli to those derived from laboratory repeated load MR tests.
There are several possible reasons for this outcome. Firstly, it is difficult to remove laboratory-compacted samples to exact field structure, density, and moisture conditions; that is, the samples collected from the field for laboratory triaxial tests are all disturbed samples, and therefore do not represent the actual conditions of granular layers in the field. Secondly, the pressure on the sample is usually applied by compressed air which does not perfectly replicate the original conditions of self-induced passive earth pressure in the field. Thirdly, the induced loading (stress) from FWD testing is different than that of laboratory tests. Fourthly, the stress calculations for the FWD test are based on a multi-layer-elastic analysis, while the pavement layers are not elastic (36, 40).
For this reason, in the overlay design, backcalculated moduli are preferred because all the distress that the pavement has already undergone as a result of the climate and traffic are incorporated into it, while the laboratory tests carried out under particular conditions are only intended to guide the backcalculation process. In the new pavement design, the tests will be representative of the original condition of the pavement as-built. The adjustments that are part of the transfer function in the design method tie the pavement in the “new” condition to the pavement in use ( 41 ).
Comparing the Backcalculated Moduli by BackMeDiNa and ELMOD
To investigate the discrepancy level of backcalculated moduli when different programs are used, the results obtained by two software were compared. Figure 7 depicts the relationships between the backcalculated moduli by BackMeDiNa and ELMOD software based on the line of equality for five pavement layers. A total of 203 deflection basins collected from these three test sections were used in this step.

Backcalculated moduli by BackMeDiNa versus backcalculated moduli by ELMOD for: (a) surface, (b) base, (c) subbase, (d) improved subgrade, and (e) subgrade.
As shown in Figure 7a, for the surface layer, the moduli correlated fairly well, with almost uniform distribution around the line of equality. The lower moduli (< 5,000 MPa) had better correlations between the two programs, while the higher moduli were more scattered. For the granular layers, the correlations of the moduli by the two programs showed the same trends. Figure 7, b–d, shows the relationship for the base, subbase, improved subgrade, and subgrade courses, and it can be seen that most of the data points were below the line of equality, indicating higher moduli produced by BackMeDiNa software. Overall, ELMOD software tends to underestimate the values of moduli as compared with BackMeDiNa, mainly for the higher moduli (> 300 MPa). Ameri et al. used several backcalculation programs in dynamic and static analysis and found that ELMOD, in some cases, overestimates the resilience modulus values of the subgrade layer ( 42 ). However, the authors used another calculation method (i.e., DBF), thus such a comparison is not suitable, since the results of this research obtained by ELMOD underestimated the moduli of the subgrade layer. Lopes used the same programs and found similar results to this research ( 43 ).
Such an outcome was expected: since programs with different approximations and algorithms were used, the final results between them would be different too. This analysis validates that, for the same basin deflection, distinct values can be obtained by different programs. This conclusion is in accordance with many literature studies (5, 44).
Influence of Seed Moduli on Backcalculated Moduli
The backcalculation results obtained by using two backcalculation programs with different seed moduli were analyzed with respect to the percentage difference of the backcalculated moduli. Figures 8 to 12 show the results of the variations for the layers. The sections below discus the trends observed based on the variation of seed moduli of each layer.

Effects of the seed moduli variation of the surface layer.

Effects of the seed moduli variation of the base layer.
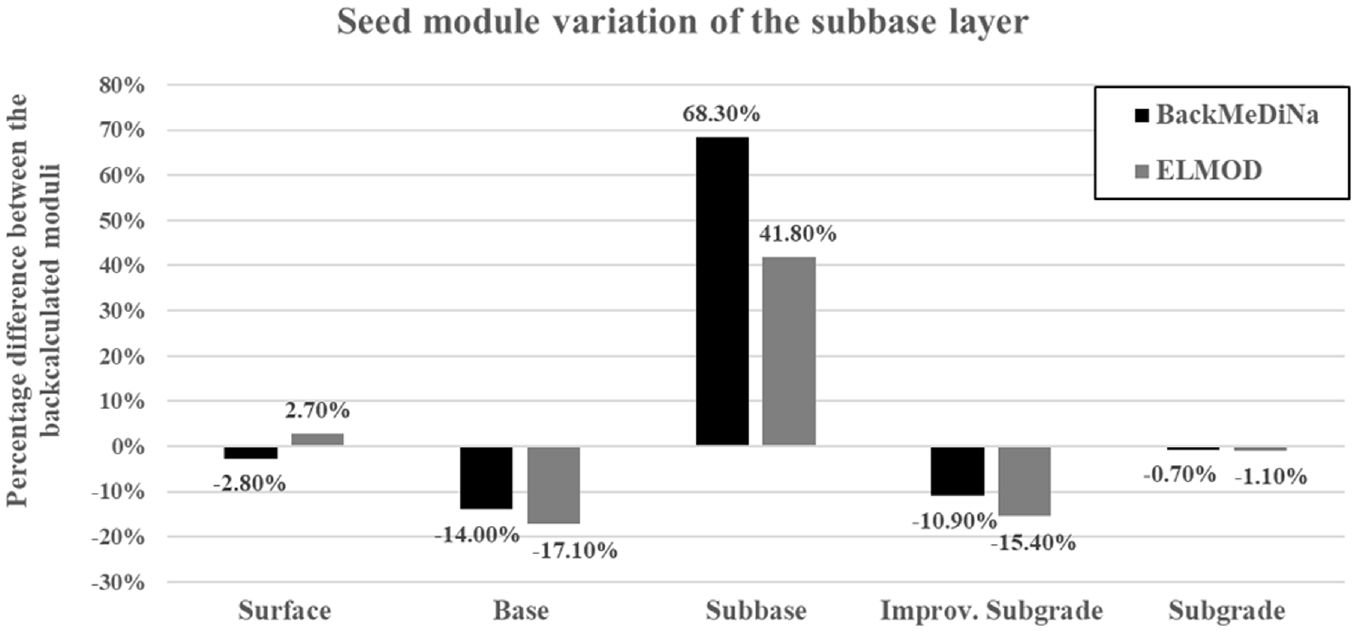
Effects of the seed moduli variation of the subbase layer.
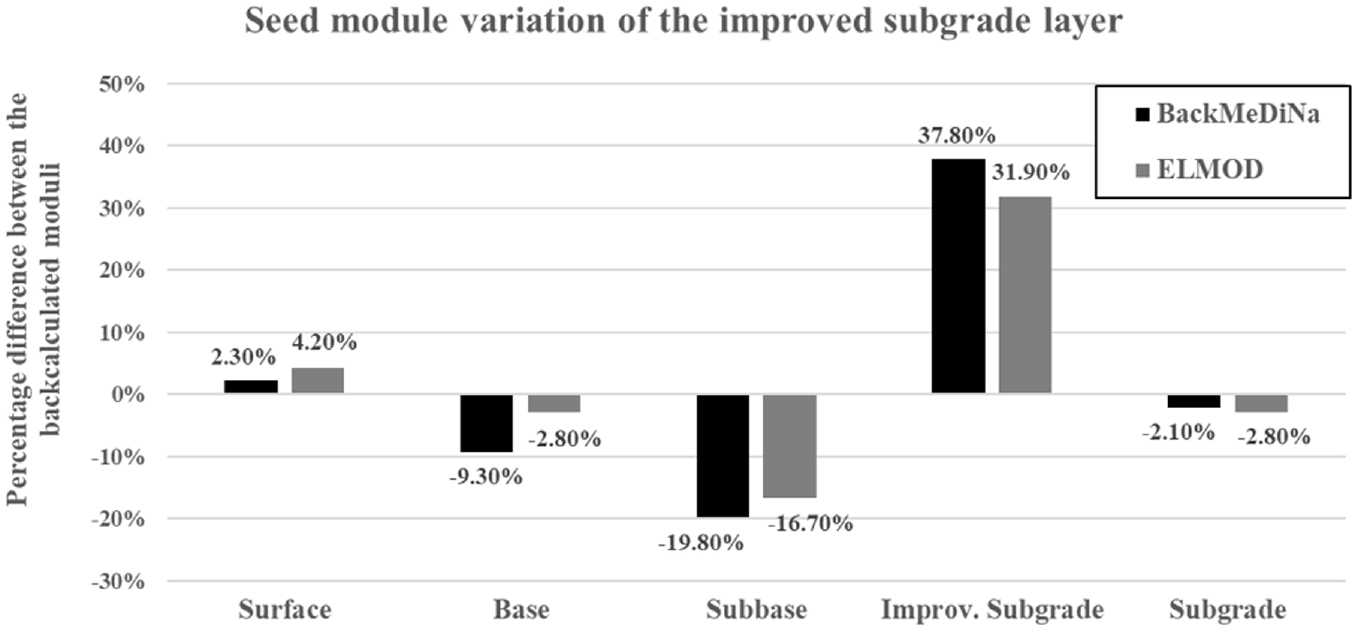
Effects of the seed moduli variation of the improved subgrade layer.

Effects of the seed moduli variation of the subgrade layer.
Asphalt Layer
Figure 8 shows the variation of the backcalculated moduli when the asphalt layer seed moduli were varied. The figure shows that the upper layers were the ones most affected by the variation of the surface layer initial moduli.
It can be noticed that, by ranging only the initial moduli of the surface layer by 100% in both programs, the backcalculated moduli of the asphalt layer tends to be slightly higher than 10%, while the base layer moduli decreased (16.1% and 9.4%, respectively). This can be explained by the increased stiffness moduli of the asphalt layer leading to stiffness compensation of the other layers. The results of the two programs were different for the final module of the subbase layer, since in BackMeDiNa there was a reduction in value and in ELMOD there was a positive compensation. This result confirms that the software works the algorithm for running the final deflection basin differently. For the underlying layers (improved subgrade and subgrade), the values were similar, that is, a slight increase (under 10%) in both programs, which indicates that the underlying layers are less affected by change in the asphalt layer moduli.
Base Layer
The variations of the seed moduli of the base layer are presented in Figure 9. The figure clearly shows that variation of the seed moduli in the base layer had a greater impact on the backcalculated moduli than the surface layer. As can be seen, the most affected layer was the base layer proper, with values over 40% difference in the final moduli, whereas the variations of the adjacent layers (surface, subbase and improved subgrade) were negative, ranging from -5.8% to -20.0%. As well as for the surface layer variations, the decrease in the moduli of adjacent layers may be justified by a stiffness compensation, since the layer tends to outweigh to reach a stiffness equilibrium of the pavement that yields the same deflection basin.
In the subgrade layer, the final moduli variations for the two programs were different, but the effects were observed to be minimal for both software, and similar to the variation of the surface layer moduli; the final subgrade moduli were barely affected.
Subbase Layer
Figure 10 shows the variations in the backcalculated moduli by the seed moduli change of the subbase layer. The trend was similar to the results obtained from the variations of base layer moduli. As can be seen in Figure 10, the final modulus values of the modified layer (i.e., base layer) were significantly increased in both programs, with percentage difference values higher than 60% in BackMeDiNa and higher than 40% in ELMOD. Similar to previous analyses, for the adjacent layers (i.e., base and improved subgrade), the percentage differences were negative, with values ranging from 10% to 17%. The surface and subgrade layers were slightly affected with the variation of the seed modulus of the base layer, with differences not more than 3%.
Improved Subgrade Layer
For the improved subgrade layer, the variation of backcalculated moduli is shown in Figure 11. According to the figure, the changes in the seed moduli of the improved subgrade layer produced less impact than the changes in the base and subbase layers. The variations were markedly similar between the two programs. The improved subgrade and subbase layers were the ones most affected, with percentage differences higher than 15%, with positive differences for the modified layer (improved subgrade) and negative for the subbase layer. The base layer also showed a decrease in its stiffness value with the change in the seed moduli of the improved subgrade layer, being more affected in BackMeDiNa. With regard to the surface and subgrade layers, as well as the previous analyses, the effects caused by the variation of seed moduli were minimal (under 5%).
Subgrade Layer
Figure 12 depicts the percentage differences between the backcalculated moduli when the seed moduli of the subgrade layer were modified. As can be seen in Figure 12, the results obtained by the two software did not follow the same trend as the other layers. Even when the value of the seed modulus increased by 100%, the backcalculated moduli of the subgrade layer were only slightly affected (under 10% in percentage difference). In the improved subgrade and base layers, the final percentage differences obtained in the two software were shifted (i.e., in BackMeDiNa the percentage difference for the base and improved subgrade layers were positive and negative, respectively, while in ELMOD, they were negative and positive, respectively). The backcalculated moduli variation of the subbase layer were different for the two software as well, with the subbase layer obtained by ELMOD being more affected (over 20%). For the surface layer, the final variations were very small (under 3%). Although the subgrade layer was slightly affected by the variation in the other layers, it is clear that the modification in its seed moduli produced a great impact on the backcalculated moduli of the other layers, mainly the ones closest (i.e., improved subgrade, subbase, and base).
Influence of Seed Moduli on the Overlay Design
For the purpose of analyzing the effects of the seed moduli on the potential performance of the overlay pavement, the backcalculated moduli obtained from different seed moduli were input into a response prediction program (MeDiNa). To evaluate these impacts, data from the first two stretches were used, and analyses were carried out based on the percentage difference between the CAs with different sets of backcalculated moduli. On the first attempt, the structures with different sets of moduli were designed using MeDiNa software. However, the required thicknesses were found to be the minimum (i.e., 5 cm) for all segments and, therefore, the sensitivity analysis of the overlay design was performed by using the percentage difference between the CA in the design period (i.e., 10 years).
Figure 13 shows the values of CA percentage difference for variations in seed moduli of each layer, along with standard deviations. For all cases, the predicted CAs were considerably lower than the design limit (30%). The figure clearly shows that the overlay design (represented by the CA parameter) is less affected by variations in seed moduli than the backcalculated moduli. It can be seen that all percentage changes were positive, indicating that modular sets of the first input (i.e., smaller seed moduli) showed higher CAs. These results were expected since pavement structures with stiffer layers tend to be more fatigue resistant.

Effects of the seed moduli variation on overlay design.
For the surface and subbase layer, the same trend was found, that is, variations of only 0.66% and 0.60% on the final CA, with standard deviations of about 0.6%. The highest differences were observed for the base and improved subgrade layers. For those layers, the percentage differences were higher than 1%, with the highest value of about 2.75% for the improved subgrade layer considering the standard deviation. With regard to the percentage difference of CA for the subgrade layer, as well as for the backcalculated moduli, the values were the lowest affected among the five layers.
The analysis of the overlay design shows that, even with the high differences obtained in the values of the backcalculated moduli, the seed moduli did not lead to a significant effect on the pavement design. In other words, the seed moduli only cause great impact on the backcalculation process, which is one of the steps of the overlay design, which in turn was not affected by the variation of the initial moduli.
Statistical Analysis of Data
To compare the effects of different module sets, a statistical analysis was performed using the t-test for means. The t-test is a robust method in identifying mean differences because of its insensitivity to deviations from data normality if the sample size is large enough. T-test (hypothesis test) is used in this study as a robust statistical test to identify the mean difference in two datasets. Several experiments were performed where the value of one of the seed moduli was varied (doubled) and the effect on the backcalculated moduli measured. The average of the ratio between the backcalculated module was estimated and it was checked if this was statistically significant (different from 1), before and after the seed modulus being altered, as summarized in Table 2. The P-values of two-tailed t-test in the table show the rejection of null hypothesis and that the studied parameters are often statistically significant, considering P-values below 0.05.
Statistical Analysis of the Effect of Seed Moduli on Backcalculated Moduli

Note: Mean = the mean ratio between both backcalculated moduli; N = the number of the analyzed data; P-value = the P-value of the test; T = the test statistic.
According to Table 2, when the value of the seed moduli of the surface layer is altered, statistically significant changes (at 5%) are obtained in the output for all moduli except the subgrade, with an increase in the surface and improved subgrade, and a decrease in the base and subbase layers. Doubling the value of the seed moduli for the base layer results in statistically significant changes in all backcalculated moduli, with a rise in the base and a drop in all other moduli.
By changing the value of the seed moduli for the subbase layer, statistically significant changes are obtained at the output for all moduli except the subgrade, with an increase in the subbase and a decrease in the surface, base, and improved subgrade layers. When the seed moduli of the improved subgrade are altered, statistically significant variations were obtained for all moduli except for the surface, with a reduction in the base, subbase, and subgrade, and little increase in the improved subgrade layer. Finally, when doubling the value of the input of the subgrade layer, statistically significant changes were obtained at the output for the improved subgrade and the subgrade layers, with a decrease in the upper layer and an increase in the subgrade layer.
Conclusions
This paper analyzed the influence of the variations in seed moduli on the backcalculated moduli and the overlay design by using FWD data from three regions in Brazil. Also, moduli from field and laboratory tests, and moduli by two different backcalculation methods were compared. Based on the obtained results, the following conclusions were drawn:
Comparing obtained moduli from laboratory tests and backcalculation process, the values from the FWD data set were significantly higher than those tested for the surface layer. For the granular layers, the moduli from the two methods were closer than the asphalt layer; however, a relationship was not found. The moduli of underlying layers showed better approximations between both methods, namely the lowest moduli.
By comparing the backcalculated moduli by BackMeDiNa (linear elastic analysis) and ELMOD6.0 (FEM), the values of the surface layer were quite close between the two software. For the base, subbase, improved subgrade, and subgrade layer, the moduli by BackMeDiNa were higher than ELMOD, mainly for the highest moduli.
The backcalculated moduli by the two methods were directly affected by the variation of seed moduli. The changes in seed moduli of the base, subbase, and subgrade layers were the ones that caused the most impact on the backcalculated moduli, mainly for the modified layers and their adjacent ones, with percentage differences higher than 60% in some cases. The subgrade layer caused and experienced minimal impacts by the variation of the seed moduli. Overall, the variation of the seed moduli showed the same behavior for both programs.
The influences of variations in the seed moduli on the design overlay were minimal for all layers. The design performed with different modular sets (obtained from different seed moduli) showed the same thickness for all sections. In respect to the CA in the design period, the percentage differences were less than 2%, indicating a slight impact on the layer design.
The results illustrate the importance of the seed moduli in the backcalculation process and overlay design. The outcomes showed that the initial moduli cannot be overlooked, since they led to significant differences in the final results, and most software require seed moduli to run the process. Therefore, it is desirable that studies be conducted to achieve more rational seed moduli which will lead to a more efficient and accurate backcalculation process.
Footnotes
Author Contributions
The authors confirm contribution to the paper as follows: study conception and design: M. Rocha, G. Marques, R. Silva; data collection: M. Rocha, G. Marques, R. Silva; analysis and interpretation of results: M. Rocha, G. Marques, R. Silva, G. Lana; draft manuscript preparation: M. Rocha. All authors reviewed the results and approved the final version of the manuscript.
Declaration of Conflicting Interests
The author(s) declared no potential conflicts of interest with respect to the research, authorship, and/or publication of this article.
Funding
The author(s) disclosed receipt of the following financial support for the research, authorship, and/or publication of this article: This work was carried out with the support of the Resources for Technological Development (RDT) of Rio-Teresópolis Concessionaire (CRT) and BR-040 Concessionaire (Via040) under the regulation of the Brazilian Land Transport Agency (ANTT).
