
Abstract
In this study, noise measurement was carried out on a section of Third Ring Road of Chengdu in China and the environmental parameters around the measuring point were collected besides the actual measurement. Coupled with the satellite map, the section was modeled and the noise impact prediction was employed using Cadna/A software, and the noise impact from 5:00 to 6:00 p.m. of a working day of in a week was evaluated based on the prediction of road service level. Results showed that evaluating only the overall level of the road service should be enough for predicting the noise impact based on the road service level. When using road service level to predict road noise, the relationship between road speed and traffic volume should be verified. If there is a conflict between reality and theory, the actual data should prevail in the prediction. Additionally, relevant road parameters should be collected when determining the road service level. The longer the duration of collecting evaluation parameters, the more accurate the determination of service level and the more accurate and applicable the prediction results.
Keywords
Approximately 30% of the world’s population lives in environments where traffic noise exceeds limits set by the World Health Organization ( 1 ). For China, two-thirds of the urban population lives with excessive levels of noise ( 2 ). According to data from relevant platforms, the number of reports received in 2019 about noise ranked second in the total list ( 3 ). As a special source of noise, traffic noise may cause several health problems like cancer, psychological disorders, high blood pressure, and psychophysiological symptoms (4–6). In addition to health hazards, traffic noise also causes social and economic harm. Traffic noise brings an annual loss of 38 billion euros to the European Union, 0.4% of the gross domestic product ( 7 ).
At present, three methods are generally used to evaluate traffic noise: (i) field measurement, (ii) theoretical calculation, and (iii) computer simulation. Compared with the former two, computer simulation is more intuitive, convenient, and low cost, which is the trend of noise prediction research. Germany first published the RLS81 prediction model in 1981, and then revised it in 1990 and put forward the RLS90 model ( 8 ). This laid the foundation for the development of Cadna/A software. The calculation principle of Cadna/A software is derived from the calculation method of attenuation of outdoor sound propagation (ISO9613-2:1996), which is almost the same with the calculation method of outdoor acoustic sound propagation in China. The software has been certified by the Environmental Engineering Assessment Center of the former State Environmental Protection Administration. It has been widely used in the prediction and research of various noise pollution sources such as traffic noise ( 9 ) and industrial noise ( 10 ). According to previous studies, most researchers consider a certain set of road parameters (mainly road traffic volume and speed) as the source of noise simulation parameters when Cadna/A software is used for noise prediction research. For example, Cadna/A was integrated into the design concept of green buildings and predicted the acoustic environment of residential areas ( 11 ). Di et al. ( 12 ) used Cadna/A to predict the noise of several urban settlements and investigated the relationship between urban traffic noise and annoyance degree based on their prediction results. Ge and Li ( 13 ) used Cadna/A software to predict the influence of national road reconstruction on the surrounding environment, analyzed the acoustic environment in the noise-sensitive area, and discussed the influence characteristics of road traffic noise through the prediction results. Lou and Ma ( 14 ) selected one road in Kaifeng City in Henan Province of China as object and used Cadna/A software to establish a three-dimensional simulation model of the research object. The prediction results revealed the vertical noise distribution law of the road traffic noise on the buildings facing the street and found that the floor noise value and the height of the building were related. Wang ( 15 ) used Cadna/A software to predict road traffic noise and map regional noise. In fact, for any road, its road parameters change every day, so it is not accurate to judge the noise impact of a road only by a set of parameters; the choice of road service level as an evaluation parameter can make up for this point.
Research on service level in the United States can be traced back to the 1960s. The issue of the Highway Capacity Manual in 1965 ( 16 ) also marked the introduction of the concept of service level. The book divided the road service level into six grades: A–F. Each grade represented the running state of vehicles in a certain range of sections and drivers’ feelings toward these states. Class A is the highest level of road service, which decreases from A to F successively. In Class A, vehicles can run freely and unobstructed, whereas Class F vehicles are basically unable to move. Many scholars put forward different opinions on the division of service levels. Baumgaertner ( 17 ) proposed to divide the service level into nine levels, whereas Cameron ( 18 ) proposed that it would be more appropriate to divide the service level into ten levels. The classification of road service level in China is carried out on the basis of the Road Capacity Manual of the United States, which is divided into four levels. On the whole, it corresponds to the grading of the United States, in which Grade 1 in China is equivalent to Grade A in the United States, Grade 2 is equivalent to Grade B, Grade 3 is equivalent to Grades C and D, and Grade 4 is equivalent to Grades E and F ( 19 ). The evaluation of road service level mainly refers to parameters such as traffic volume and running speed. Through the judgment of road traffic running state, the service level of the studied road can be obtained. Road service level can often reflect the travel feelings of drivers and travelers. Based on the level of road service, drivers can judge the driving speed, vision, comfort level, and other effects on the studied road ( 20 ).
Su et al. ( 21 ) divided the parameter range of different road service levels by referring to the Code for Design of Urban Road Engineering (CJJ 37-2012) and took urban expressway as an example to predict and analyze the noise impact of the expressway with different road service levels. This study attempts to apply road service level to road traffic noise prediction, and it does not apply noise prediction practice to the actual road. Based on the road service level, the noise prediction of the actual road is carried out. In this paper, actual road noise is predicted.
Materials and Methods
Cadna/A Noise Prediction Software
Cadna/A software was developed by German company DataKustik GmbH. The calculation principle is almost the same as that of acoustic outdoor sound propagation calculation in China. The environmental noise prediction software is prominent and widely used and is in leading position. Cadna/A software, which contains standards and codes for use in many countries and regions, was evaluated by the Ministry of Environmental Protection of the People’s Republic of China in 2001; it has been widely used in the prediction, evaluation, and research of environmental noise in China. The noise prediction software Cadna/A can be used to calculate the absorption, distance attenuation, and acoustic reflection of air and ground, and also to draw noise maps, and the prediction results are relatively accurate, among which there are not many studies on urban road traffic.
Road Sections and Arrangement of Measurement Points
The test section is selected in the west of Chengdu Third Ring Road, near the east gate of Supo Park. Chengdu Third Ring Road is a fully closed urban expressway with seven motor vehicle lanes in a single direction, including four lanes in the main road and three lanes in the auxiliary road, and is also equipped with a non-motor vehicle lane and pavement. The design speed of the main road is 100 km/h and that of the auxiliary road is 60 km/h. The specific point locations are shown in Figure 1.

Point location layout of the measured section: (a) location shooting and (b) aerial view.
The noise measurement is mainly based on the Acoustic Environment Quality Standard (GB 3096-2008) and the Technical Specification for Environmental Noise Monitoring Urban Acoustic Environment Routine Monitoring (HJ 640-2012).
Considering the accuracy of the measured data, the location of the measurement should meet the following requirements: (i) The distance between the prediction point and the intersection is greater than 50 m; and (ii) the background noise interference is small. The specific location of the points is shown in Figure 1 and the information of the points is shown in Table 1.
Spot Layout Information Table

Noise Monitoring Methods
To check the precision of the road prediction model, the measurement value reflecting the actual sound environment should be obtained, so the environmental noise monitoring is carried out. The monitoring time was from 5:00 to 6:00 p.m. in the daytime. The noise is measured three times every hour, for 20 min each time, and the average of the three measurements is taken as the final result. The monitoring is carried out under the condition of no rain, snow, or lightning and wind speed below 5 m/s. The monitoring instruments are Coinv signal acquisition and analysis instrument (INV3062C), Coinv DASP V11 sensor, Hangzhou Aihua Instrument AWA6221B sound calibrator, tripod, data transmission line, notebook computer, and windscreen, and the requirements of Class 1 sound level meter are met.
Results and Discussion
Establishment of Section Correction Model
Based on the field exploration of the road in Supo Park section in the west of Chengdu Third Ring Road, and combined with the satellite map, the model of the road and the green belt around the predicted point was established. The plane schematic diagram of the established model is shown in Figure 2 and the three-dimensional schematic diagram is shown in Figure 3.
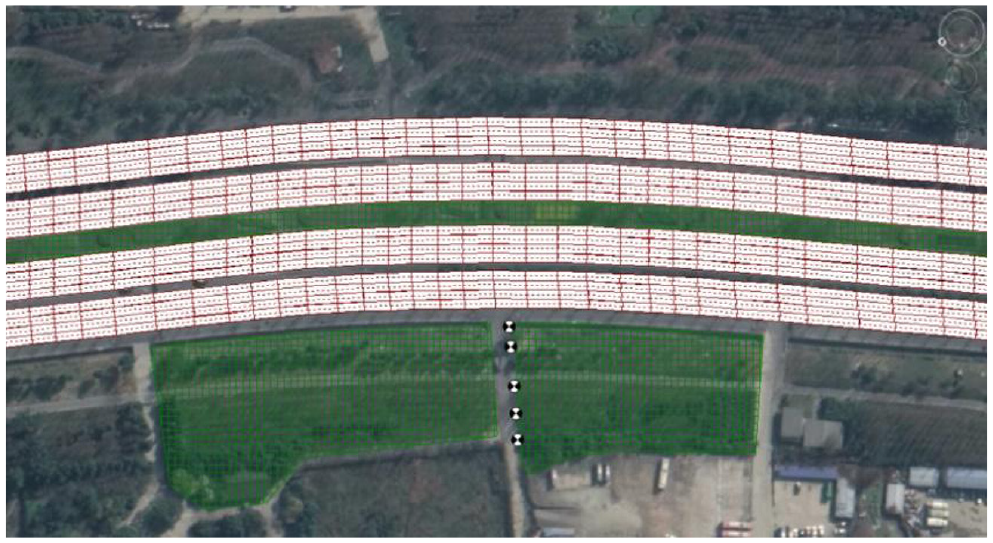
Planar setting diagram of the research model.
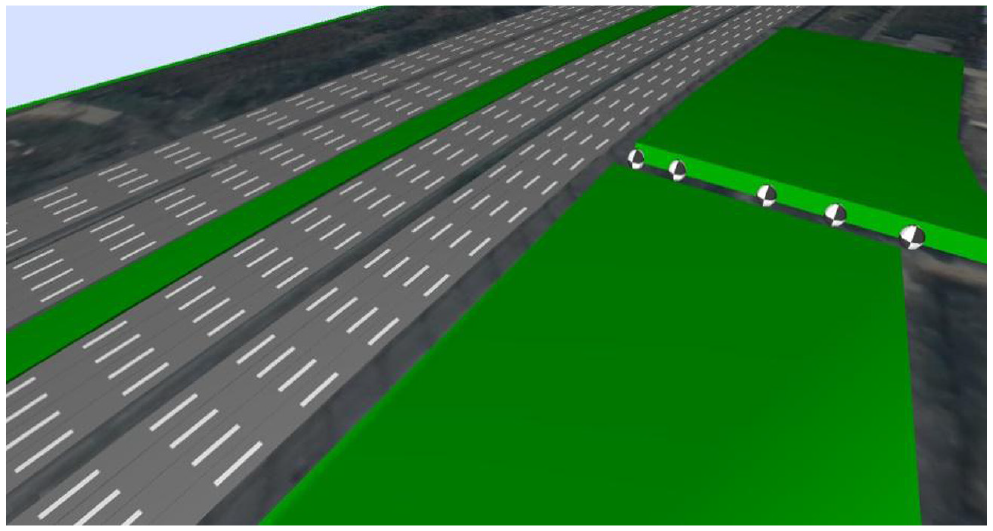
Three-dimensional schematic diagram of the research model.
Road parameters were collected in two cases: (i) where the traffic volume and speed of each lane are recorded separately; this mode is referred to as refined mode here; and (ii) where the road is divided into a closer side road, a closer main road, a further main road, and a further side road, with each of these roads having four lanes; this is called the overall mode. The road parameters are shown in Tables 2 and 3.
Road Parameters of the Study Section in Overall Mode

Note: vph = vehicles per hour.
Road Parameters of the Study Section in Refined Mode
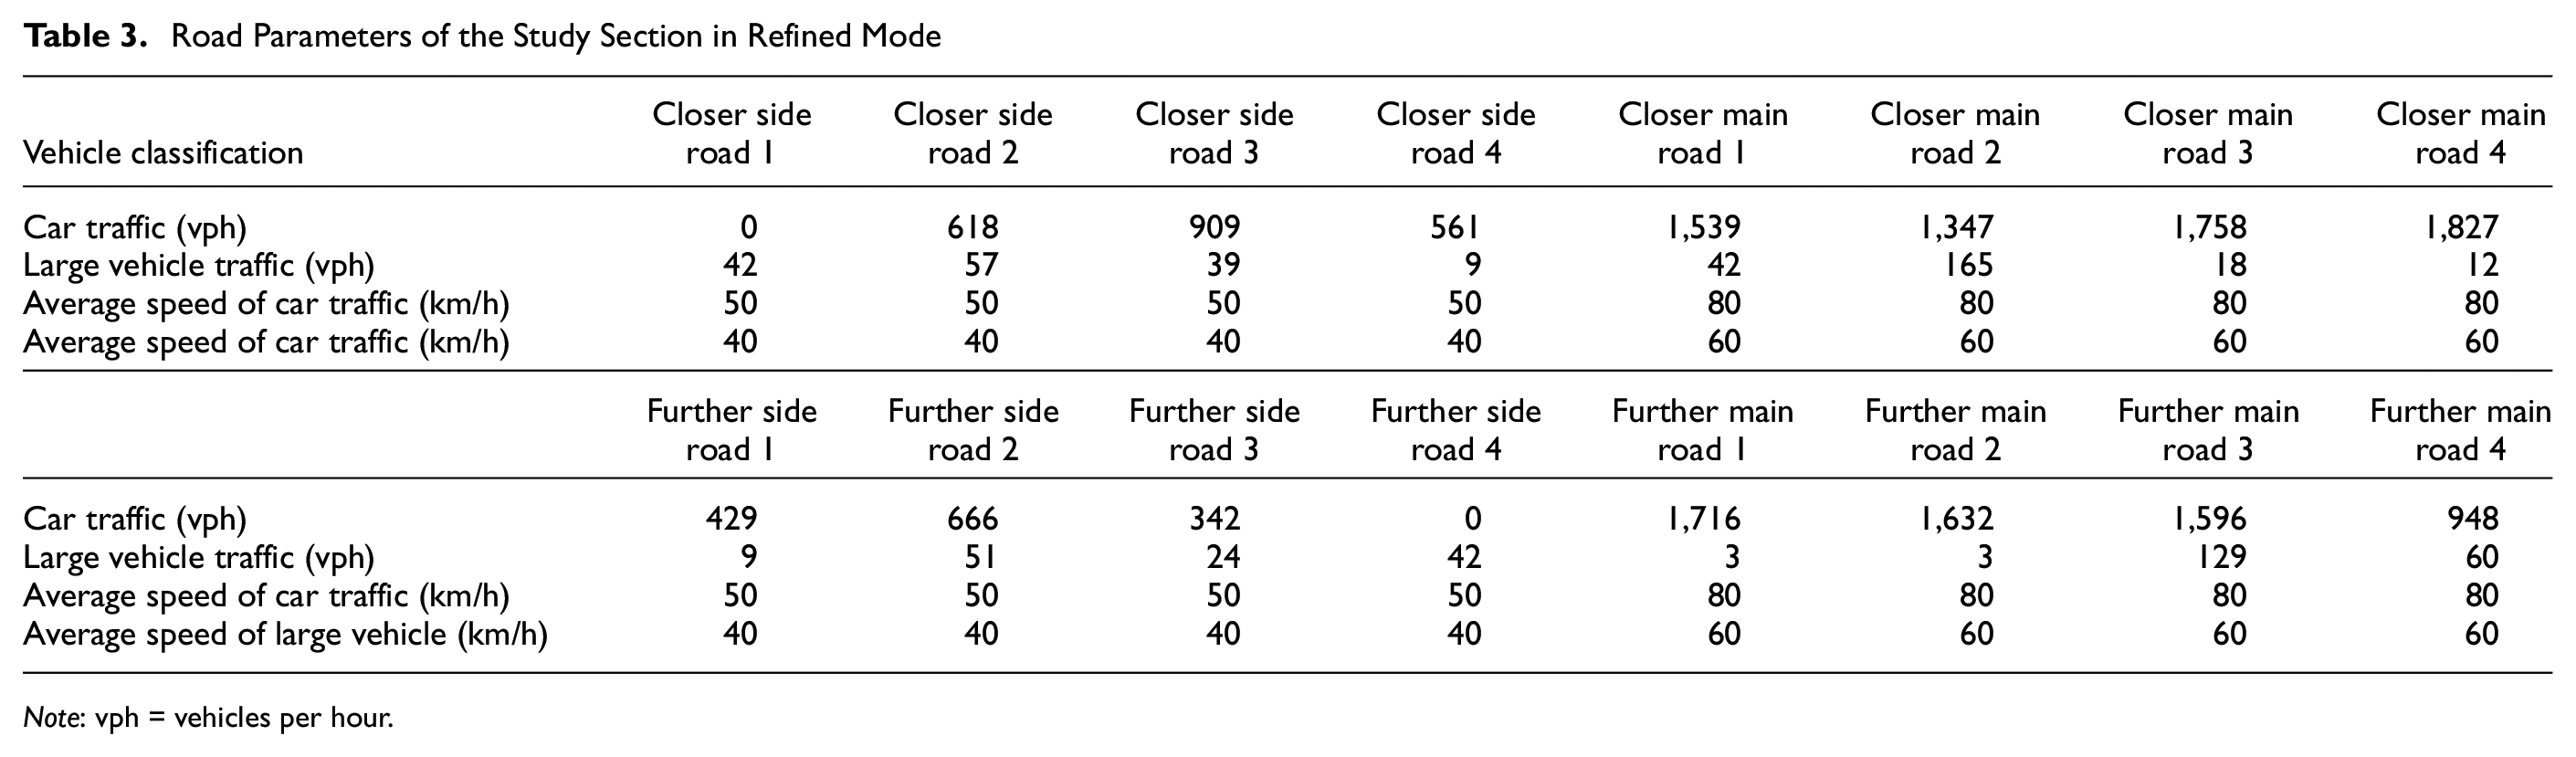
Note: vph = vehicles per hour.
Through multiple field visits, relevant parameters of the study road model were modified. The parameters include but are not limited to the width of the road, length of the road and green belt, grade of the road, and the height of the green belt. The obtained parameters were input into the model and modified by comparing the measured values and the predicted values. Noise reduction pavement was used for the side roads and general asphalt pavement was used for the main road. The noise reduction effect of the side roads set in this model was 2 dB (22, 23).
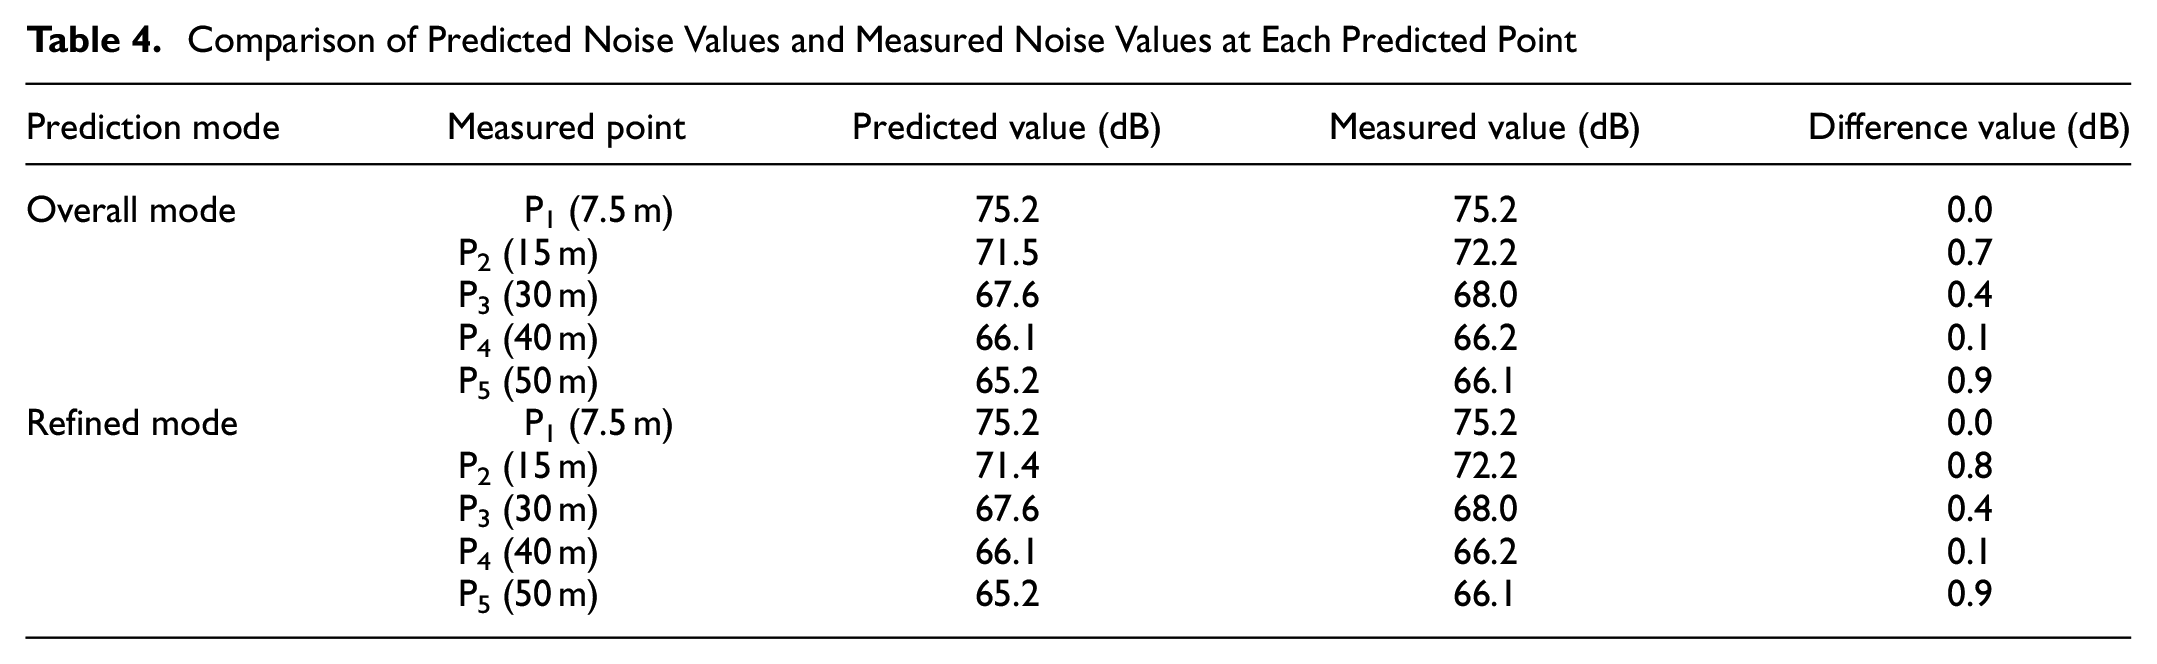
According to the comparison results in Table 4, the predicted values of all prediction points were not higher than the measured values, which is in line with the general tendency and result of the comparison between the predicted values and the measured values. The difference was in the range of 0–0.9 dB, and the magnitude of the difference was diverse for different prediction points. According to the comparison results, the model was reasonable on the whole, and the prediction results can basically reflect the impact of road noise.
Comparison of Predicted Noise Values and Measured Noise Values at Each Predicted Point
For the deviation value between the predicted result and the measured result, the error analysis was carried out from two points. First, the measured noise of the measuring point showed errors. In the actual measurement, the equivalent continuous A-weighted sound level was selected as the evaluation quantity, which had the advantage of being stable and reliable, although it cannot deviate too much from the actual results in general. However, the sound of vehicle honking, non-motor vehicles, and passers-by occasionally present in the measurement process was also recorded, and such background noise had a certain impact on the accuracy of the measured results. Second, the selection of model parameters was not accurate. As the road model for this survey was conducted in the third ring expressway, the traffic was heavy and the vehicle speed was relatively high, and there was an error in the measurement of the relative parameters of the road and the surrounding green belt.
In addition, Table 4 shows that the prediction results of the road service level subdivided into lanes were basically consistent with the prediction results of the road service level evaluation on the whole road. The difference of the acoustic environmental impact caused by the different positions of each lane can be ignored. The sound energy produced by the road as a whole can be regarded as conserved. Therefore, in the following evaluation of road sevice level, only the overall service level needs to be evaluated and lane-dividing unnecessary.
Determination of Road Service Level
The parameters of traffic volume and average speed under each road service level were selected based on previous work ( 21 ) as shown in Table 5. The actual road service level was judged according to the data.
Division of Service Level Intervals of Basic Sections of Expressways
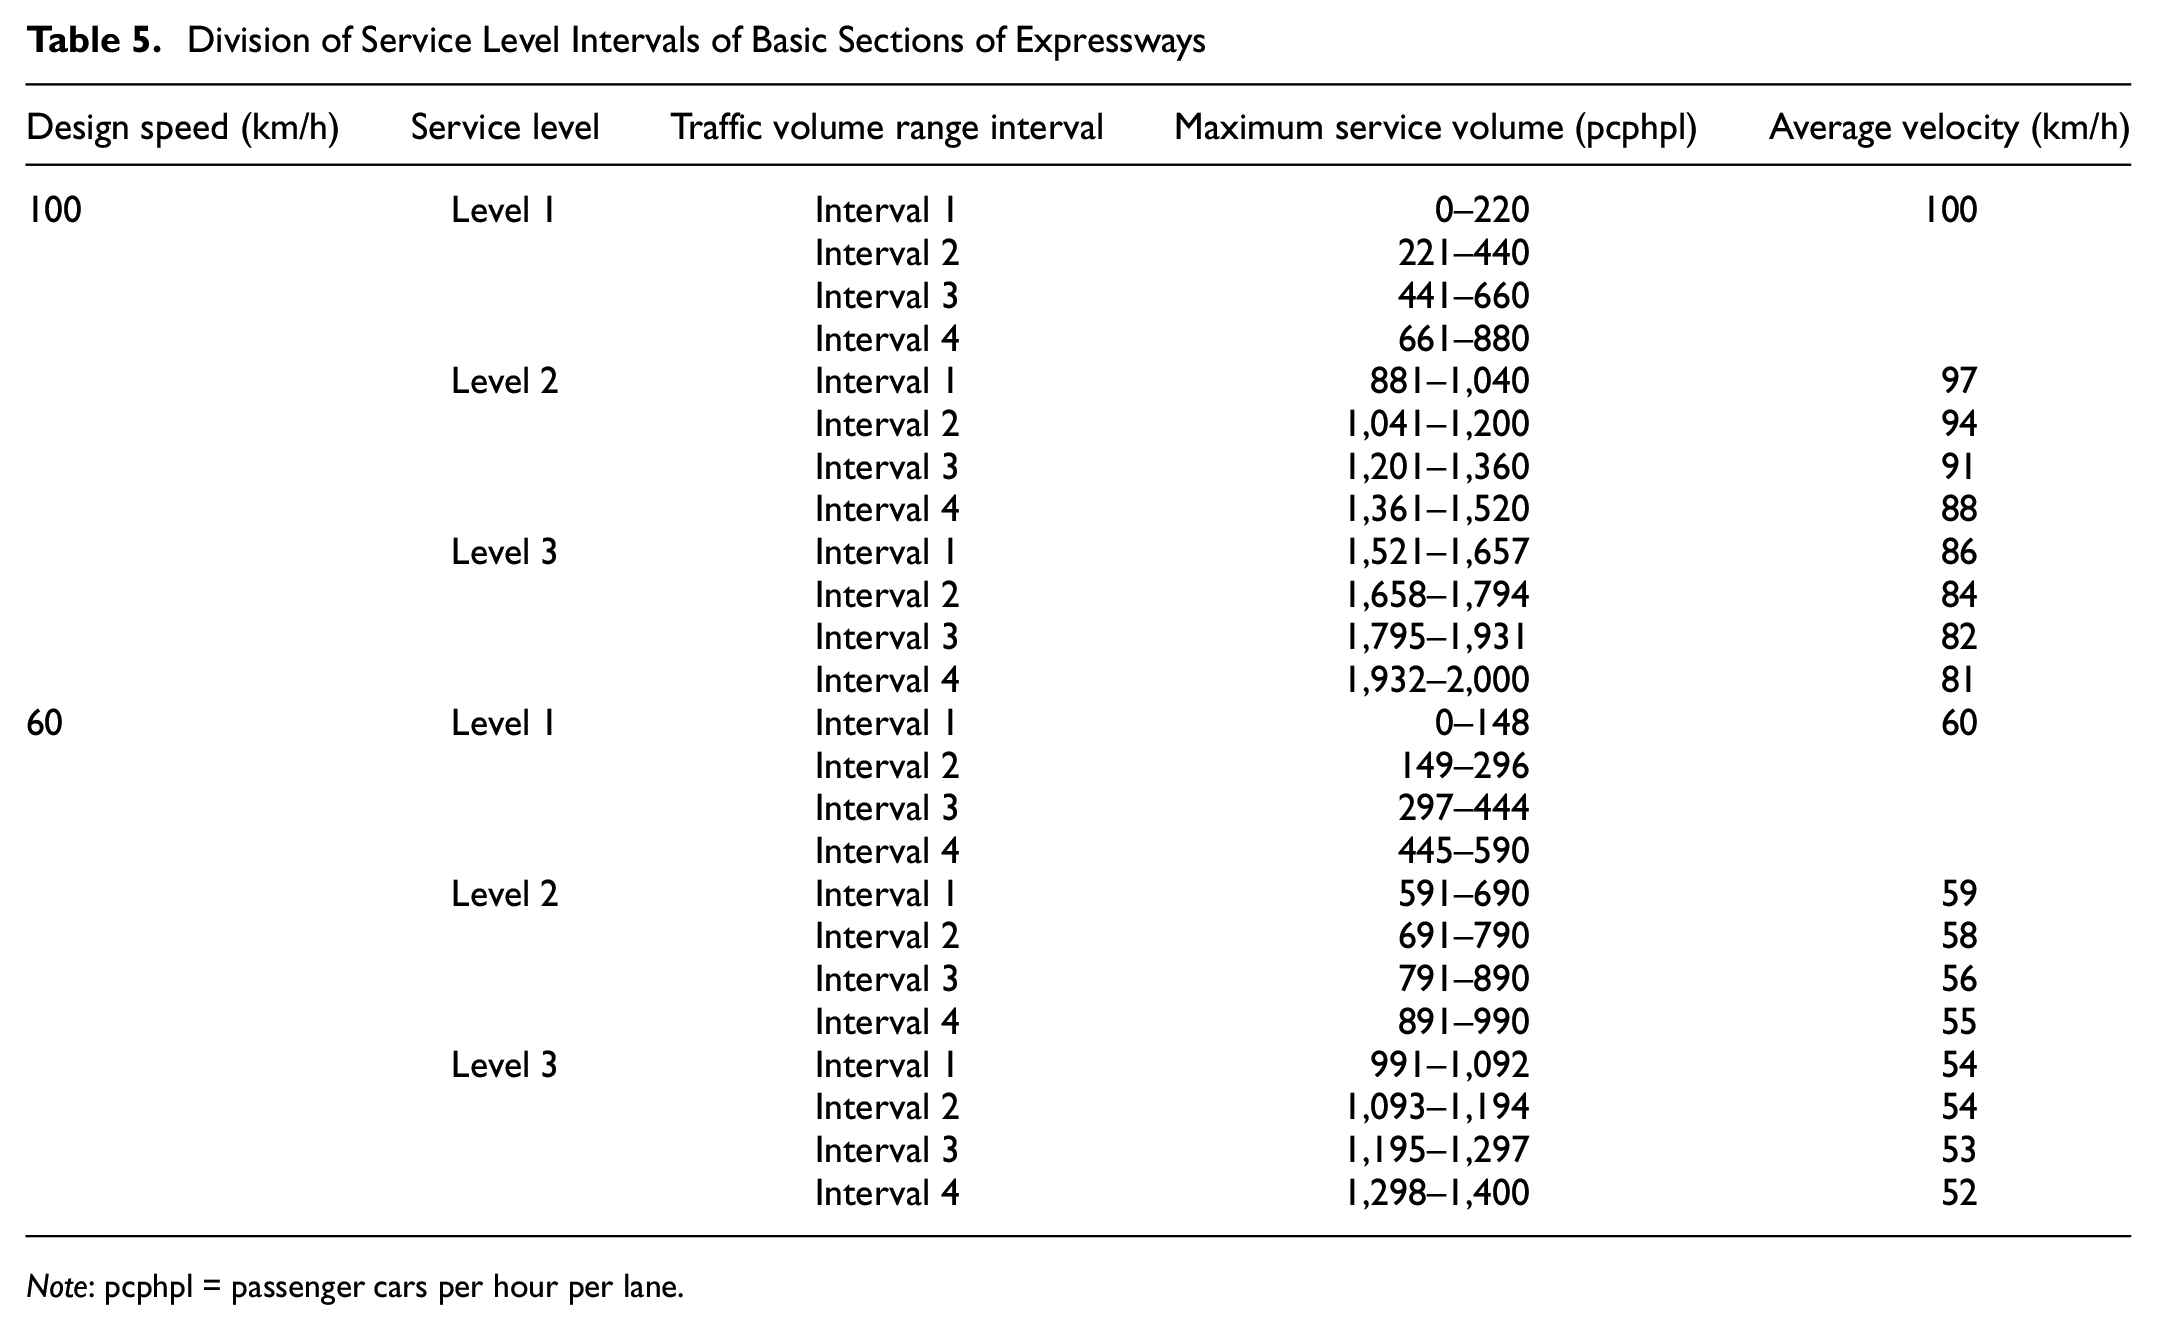
Note: pcphpl = passenger cars per hour per lane.
The road service level of the study section was assessed from 5:00 to 6:00 p.m. on the working day of a week, and the evaluation index was mainly analyzed based on the road traffic volume and the observation of road congestion. The traffic volume was regarded as effective traffic volume when vehicles were running normally (without any traffic jam) in this case. With reference to the Code for Design of Urban Road Engineering (CJJ 37-2012), the conversion coefficients of various road models are shown in Table 6.
Traffic Volume of Each Lane of the Road
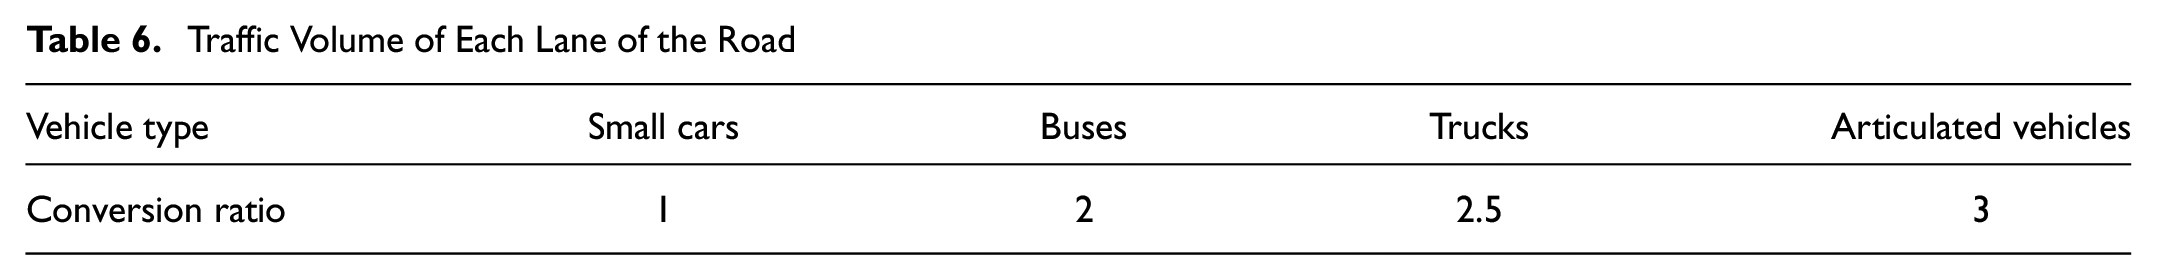
In actual monitoring, most of the large vehicles on the road during the monitoring period were trucks, so in this paper, the traffic volume conversion takes the large vehicles as large trucks for conversion. The road service level of each lane can be preliminarily judged by referring to the conversion results. The data for weekday parameter investigation and service level judgment are shown in Table 7. The total traffic volume and single lane traffic volume in Table 7 are the values converted into small car traffic volume.
Weekday Parameter Investigation and Service Level Judgment of Research Road Section

Note: vph = vehicles per hour.
From Table 7, we can get the evaluation grade of service level of the study section from 5:00 to 6:00 p.m. during the working day. Through actual monitoring, it is found that the average speed of large vehicles and cars is kept at a certain level during the monitoring period, and the general rule of road traffic volume and speed as in Table 5 is not followed. In this paper, the prediction is made according to the actual situation. The traffic volume data of large and small vehicles are calculated by backward calculation according to the ratio of heavy vehicles and the range of traffic volume of single lane. The final service level classification and parameter values of the road are shown in Table 8.
Determination of Service Level and Parameter Selection of the Study Section

Note: vph = vehicles per hour.
Prediction of Road Section Noise Impact Based on Road Service Level
Based on the data in Table 8, it is possible to obtain the noise impact of the road on the predicted points during 5:006:00 p.m. on workdays; the results are shown in Table 9.
Road Noise Impact Prediction Based on Road Service Level
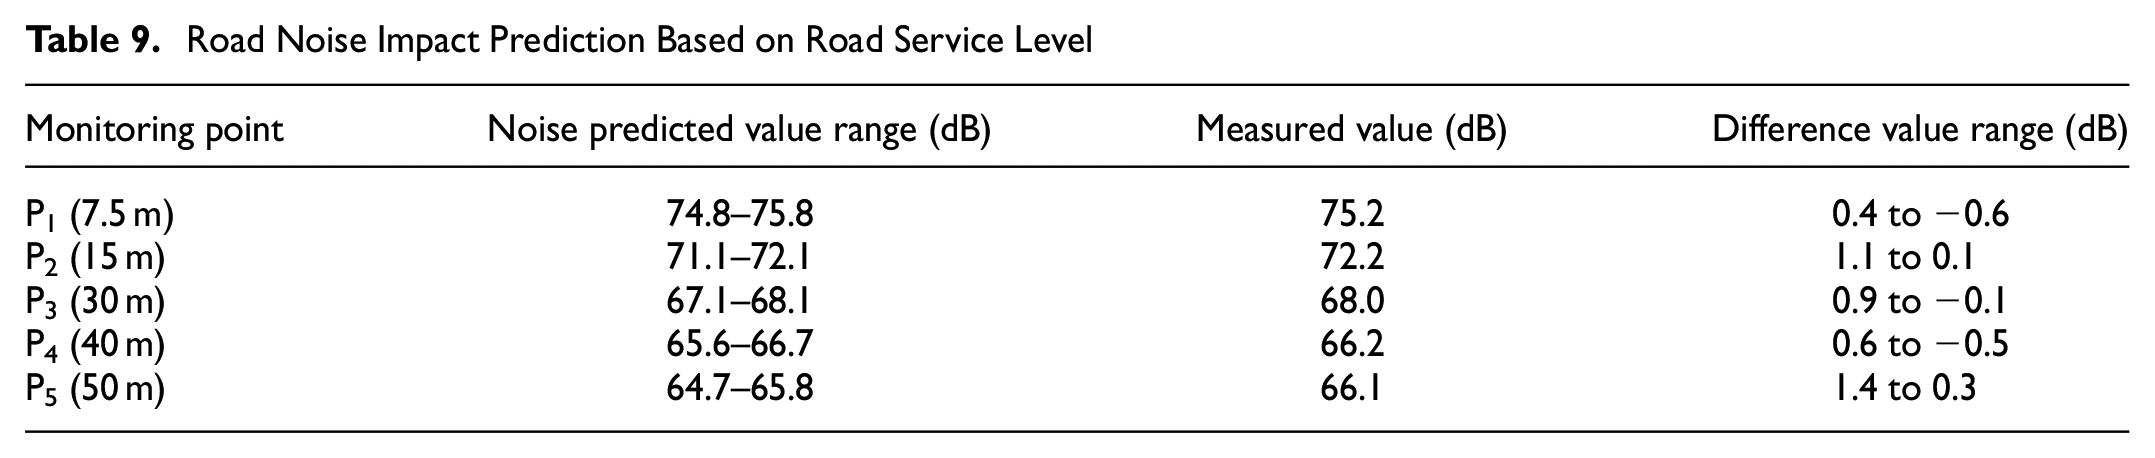
From Table 9, it can be inferred that the noise influence of the west section of Chengdu Third Ring Road near the east gate of Supo Park on the prediction points P1–P5 was 74.8–75.8, 71.1–72.1, 67.1–68.1, 65.6–66.7 dB, 64.7–65.8, respectively, during the working day from 5:00 to 6:00 p.m. The noise prediction result based on the road service level is clearly a prediction range; compared with a single predicted value, this prediction result is more realistic and reasonable and has reference value. According to the measured results, the measured noise value was within the predicted range of the noise influence value in Table 9, indicating that the predicted result has certain reliability. The accuracy of the prediction results should be tested according to the long-term monitoring values of the predicted points.
The general process of road traffic noise prediction based on road service level is summarized and shown in Figure 4. As presented in Figure 4, the road traffic noise prediction process based on road service level was mainly divided into two parts: (i) road service level evaluation, which included collecting parameters; and (ii) model correction, which included comparison of predicted noise values and measured values at each predicted point, parameter investigation, and service level judgment of the research road. Road noise impact prediction based on road service level was performed by these two parts. Road parameter collection and road noise measurement should be carried out simultaneously during the study period, and the traffic noise impact prediction based on road service level was carried out on the basis of the modified model.
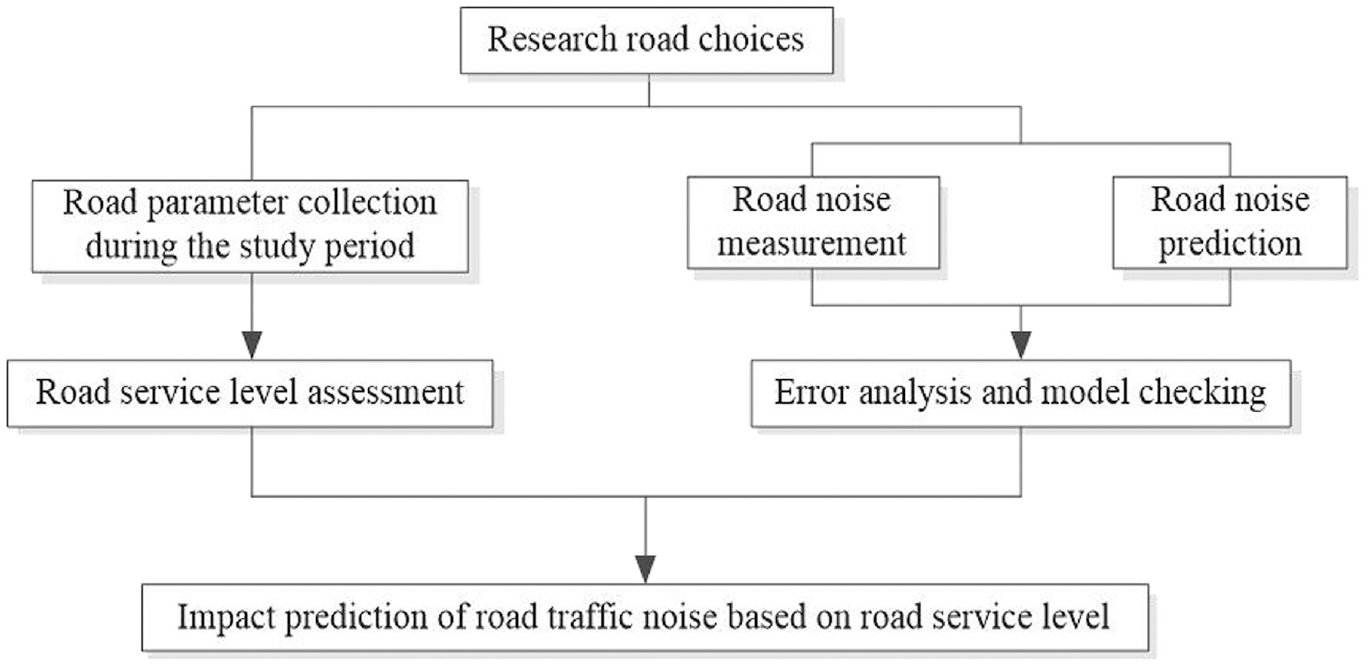
General steps of road traffic noise prediction based on service level.
Conclusions
This study applied road service level to road traffic noise prediction. Noise prediction of the actual road, a section of Third Ring Road of Chengdu in China, was conducted based on the road service level. Results suggested that evaluating only the overall level of the road service should be enough for predicting the noise impact based on the road service level. When using road service level to predict road noise, the relationship between road speed and traffic volume should be verified. The actual data need to prevail in the prediction when the theoretical value is inconsistent with the actual value. In addition, relevant road parameters can be collected when determining road service level. The longer the evaluation parameters are collected, the more accurate the determination of service level and the more applicable of the predictions. The noise monitoring of the studied road section can be conducted, and the applicability of the prediction results can be verified by comparing with the range of prediction results.
Footnotes
Author Contributions
The authors confirm contribution to the paper as follows: study conception and design: Kai Su; data collection: Mingxu Liao, Linxiao Li, Xingquan Deng; analysis and interpretation of results: Kai Su, Mingxu Liao, Yulong He; draft manuscript preparation: Kai Su, Mingxu Liao, Shaoqi Deng. All authors reviewed the results and approved the final version of the manuscript.
Declaration of Conflicting Interests
The author(s) declared no potential conflicts of interest with respect to the research, authorship, and/or publication of this article.
Funding
The author(s) received no financial support for the research, authorship, and/or publication of this article.