



Abstract
The Highway Safety Improvement Program (HSIP) is a Federal-aid program aimed at achieving a significant reduction in traffic fatalities and serious injuries on all public roads. Projects are selected based on the potential reduction of severe crashes and the greatest return on investment. In this paper, a step-by-step process and methodology were developed to evaluate HSIP projects. The process and method were implemented to evaluate HSIP projects executed in Wisconsin between 2013 and 2019. Safety effectiveness evaluation and economic assessment were conducted using the Empirical Bayes (EB) method. Crash cost benefit of implemented projects was quantified to find the benefit–cost (B/C) for a horizon of 10 years and observed period of analysis. With data available from project evaluations, Crash Modification Factors (CMFs) for common treatments were developed. A total of 64 HSIP projects were evaluated. B/C ratios greater than one were observed in 43 projects. For a 10-year horizon, the aggregated B/C ratio was 2.71. Alternatively, using the observed data during the study period of each project, the observed overall crash cost benefit was equal to $72 million which corresponds to a B/C ratio of 1.10 (benefit already surpassed project costs at 3–5 years). Approximately 536 crashes were prevented which translates to seven lives saved, 380 injuries prevented, and avoided 1,067 property damage losses.
State and local agencies have been implementing safety improvement projects following rigorous performance metric thresholds to eliminate fatalities and serious injuries of road users. The Highway Safety Improvement Program (HSIP) is a Federal-aid program aimed at achieving a significant reduction in traffic fatalities and serious injuries on all public roads. To mention some, HSIP eligible projects may include intersection safety improvements, pavement rehabilitation, shoulder widening, installation of guardrails, improvements for vulnerable road users, railroad-highway crossing improvements, and even conducting safety audits. Safety improvement programs provide a systematic approach to select, implement, evaluate, and report performance of projects in relation to safety and return on investment.
In this paper, a step-by-step process is provided for data collection, safety effectiveness, economic assessment, reporting, and development of program-specific Crash Modification Factors (CMFs). Wisconsin HSIP projects implemented between 2013 and 2019 are used to illustrate this process. Methods and procedures presented in this paper contribute to the goals of the HSIP program by providing rigorous safety and economic performance metrics which will enable informed decisions with future projects and strategies.
Literature Review
HSIP uses data-driven and strategic approaches to improve highway safety with a focus on performance ( 1 ). A wide range of highway safety improvement projects are eligible for HSIP funding. States should identify projects that are most likely to reduce the number of potential fatalities and serious injuries. Projects should improve hazardous road locations or address a highway safety problem ( 2 ). The evaluation of the program performance in every state must include the process and assessment of the results achieved in relation to safety outcomes and the attainment of safety performance targets ( 3 ).
States develop their own procedures for the selection, implementation, evaluation, and reporting. Experiences and results from a couple of agencies are provided in this section. For instance, North Carolina Department of Transportation (DOT) conducts individual project safety effectiveness evaluations and focuses on changes in target crashes. Results showed that total crashes increased or remained unchanged whereas target crashes decreased. Including target crashes in the evaluation helped assess if the project achieved its initial objective (i.e., address a specific crash type or crash contributing factor). From the review of approximately 600 projects, the benefits of crashes reduced resulted in a benefit–cost (B/C) of 14.0 ( 4 ).
Colorado DOT evaluated safety effectiveness of individual projects, B/C, and developed CMFs for group of sites with similar treatments using the Empirical Bayes (EB) and Comparison Group methods. Safety measures evaluated also included Level of Safety Service. A report was provided for each project, and CMFs were provided for intersection and segment treatments. The 29 projects evaluated cumulatively had a predicted B/C average of 2.87 and an observed B/C average of 6.86 ( 5 ).
The Kentucky Transportation Cabinet employed the shift of proportions method for the safety effectiveness of individual projects. Cable median barrier and high-friction surface treatments were evaluated which target specific crash types (cross-median, wet-weather lane-departure crashes, respectively). The shift in proportions of cross-median and wet-weather lane-departure crashes indicated a statistically significant reduction in target crashes ( 3 ).
States should identify data needs, calibrate or develop crash prediction models, develop evaluation procedures, and automate the evaluation and reporting processes to demonstrate the value of investment in safety improvements and provide palpable measures for the public ( 3 ).
Roadway safety improvement investments in road maintenance and conservation have a positive impact in reducing fatality rate in addition to preventing infrastructure deterioration and extending service life. On the other hand, increasing investment in roadway construction would lead to an increase in roadway mortality ( 6 ). In relation to public opinion, investments on safety improvements are associated with reduction of crashes, reduction of property damage, and improved quality of life. In a survey conducted in Washington State, 74% of respondents placed higher priority on safety and maintenance over new road projects ( 7 ).
Methodology
HSIP has a periodic cycle of planning, implementation, evaluation, and reporting. In this paper, the process of evaluation of implemented projects and reporting of results are provided. Evaluation and reporting processes consisted of data collection, feasibility of project evaluation, safety effectiveness, economic assessment, and development of CMFs. Figure 1 illustrates the process of evaluation of projects. The following sections of the methodology describe each step of the process in more detail.
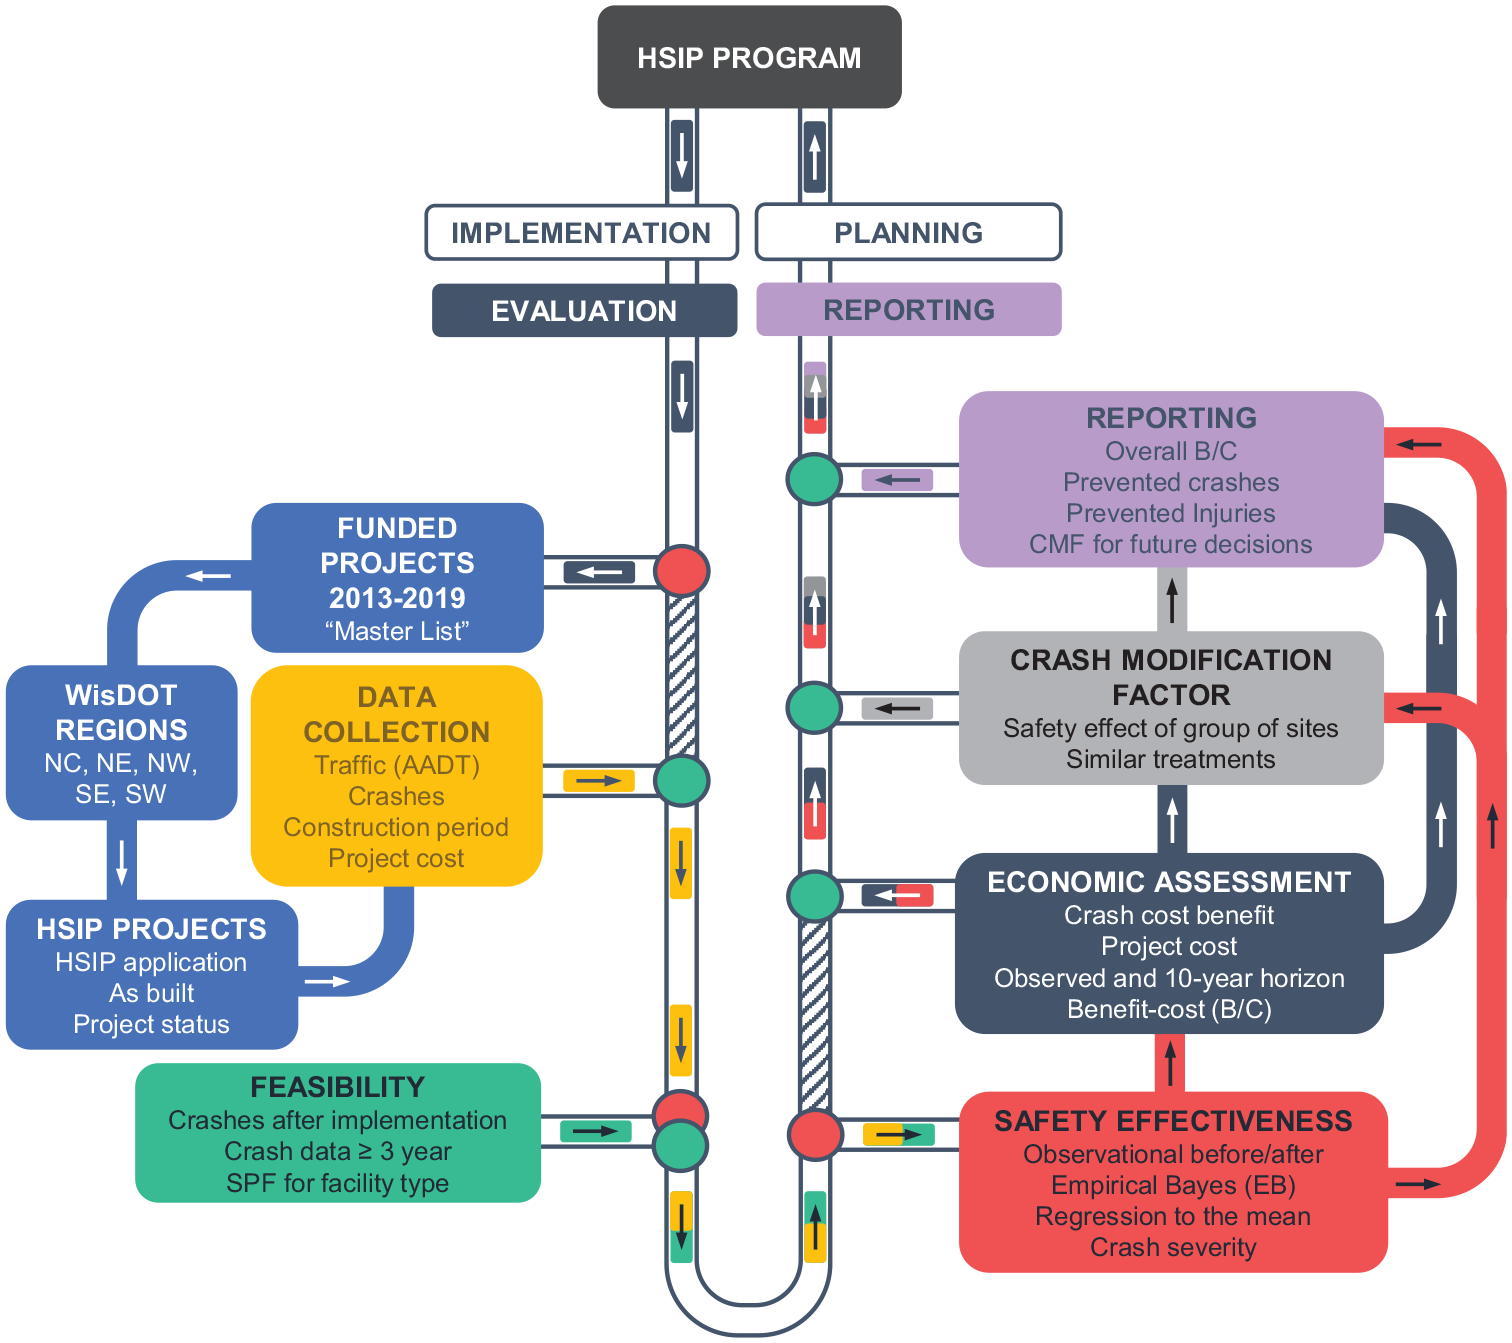
Overview of Wisconsin Highway Safety Improvement Program project evaluations.
Data Collection
Wisconsin DOT (WisDOT) is divided in five region offices: north central (NC), northeast (NE), northwest (NW), southeast (SE), and southwest (SW). Applications for safety project improvements under the HSIP program are submitted by each region and review/approval is conducted by a committee composed of regional managers and WisDOT administrators. Data required for the evaluation were collected from each region’s archives and WisDOT databases. Data collected consisted of project master list, HSIP-approved application, contract status information, as-builts, traffic, and crash data.
Project Master List
A list of funded and implemented safety projects was obtained for the period of 2013–2019 (442 projects). The list included the following information:
DOT region
County
Scheduled date
Fiscal year
Route type
Route name
Funds according to source
Work type
Based on the list of projects, a data request was sent out to each region. Data request included contract status information, HSIP-approved applications, and as-built drawings.
Contract Status Information
Each project has a record of activities and progress. Contract status information documents the dates of different events in the execution of projects. Relevant dates for safety evaluations were the date construction started and the date a project was substantially completed. Being able to identify specific dates of construction and when the roadway facility was operational provided accurate information to determine before and after periods of analysis for safety evaluation.
HSIP-Approved Applications
HSIP application follows a standard format form ( 8 ) with the description of project location, identification of hazard, proposed improvement, total project cost, and supplemental material. Additional material included as part of the application includes collision diagrams, crash history (most current five consecutive years) and appropriate crash analysis, site photos, itemized cost estimates, and potential crash reduction. Data collected from HSIP applications were project cost, project life cycle, and CMFs used.
As-Built Drawings
Project improvements may include several geometric changes, traffic control devices, signs, or infrastructure. As-built drawings provided detailed information of roadway modifications which were reviewed for each project to verify the location, area of influence, verify treatments implemented, and assess the extent of the project.
Traffic Data
Traffic data were collected before and after the treatment implementation from WisDOT’s interactive traffic web map TCMap ( 9 ). For roadway segments, annual average daily traffic (AADT) from the closest station or estimate was used. In the case of intersections, traffic volumes were collected for each approaching leg with the designation of minor or major road.
Crash Data
The WisTransPortal contains a complete database of Wisconsin crashes ( 10 ). This database contains information on all reported crashes, including location of each crash, vehicles involved, and general crash attributes. Additional crash data resources include statewide crash mapping, query, and data-collection applications.
Crash data were collected within 250 ft of the center of intersections or functional area. Based on the characteristics of project improvements, the buffer of 250 ft may not be appropriate. Improvements may include a combination of intersections and roadway segments; thus, safety evaluations were conducted at the site-specific (one facility) or at the project level (combination of multiple facilities). For instance, in the case of the evaluation of J-turns, although an intersection improvement, the 250 ft buffer for evaluation of crashes is not appropriate. The functional area of a J-turn may include long acceleration/deceleration lanes. Also, the U-turns at a J-turn may be located at a considerable distance from the main intersection (1,000–3,000 ft) ( 11 ), so the evaluation was conducted at the project level (one intersection and two segments). Similarly, corridor treatments including several intersections and segments in between were evaluated at the project level.
Crashes were collected for 5 years in the before period and at least 3 years in the after period. Crashes during the construction period were not considered. To avoid seasonal effects, calendar years (12-month periods) were used.
Project Evaluation
HSIP projects were evaluated with an observational before and after study design using the EB method, which is a rigorous statistical method that accounts for potential regression to the mean bias, traffic volume fluctuations, nonlinear relationship between crash frequency and traffic volume, and general temporal effects ( 3 ). Evaluation of safety improvement projects was divided into four components: (1) evaluation feasibility, (2) safety effectiveness, (3) economic assessment, and (4) CMF development.
Evaluation Feasibility
Safety and economic evaluations were conducted for projects with sufficient data for rigorous statistical analysis. For a project to be evaluated the following data had to be available:
Dates of beginning and end of construction
Location, physical, or functional area of facility treated
Traffic data (AADT) at all roadway approaches or segments
At least 3 years of observed crash data in the after period
Safety Performance Function (SPF) by facility type
Project costs
Although required data may be available for evaluation, this does not guarantee that an evaluation would provide statistically significant or intuitive results because limitations of SPFs, EB method, and effect of crash costs when severe or fatal crashes are observed either in the before or after period. Thus, after the evaluation of projects, a quality control process was conducted to carefully review the results.
Safety Effectiveness
The EB method determines the safety effectiveness of treatments based on the comparison of expected crashes with no treatment with observed crashes with treatment ( 12 ). To obtain expected crashes in the after period, the EB uses crash prediction models by facility type. Also, the EB method can evaluate safety effectiveness at site-specific and project levels.
Crash prediction models are composed of SPFs, CMFs, and calibration factors (C). As HSIP projects involve several facility types, crash prediction models for all these different facilities were required. Thus, a combination of local and nationwide crash prediction models and calibration factors were used. Local Wisconsin-specific SPFs and calibration factors were available from a previous study ( 13 ), which provided crash prediction models for all common intersection and ramp terminal types. Crash prediction models for roadways segments including freeway facilities available from the Highway Safety Manual ( 14 ) and Safety Analyst ( 15 ) were used.
Site-Specific Level
A site-specific evaluation focuses on one roadway facility, for instance a project with the implementation of a roundabout replacing a conventional stop-controlled intersection. The EB method has three distinctive crash designations: observed, predicted, and expected crashes. Observed crashes are historical crashes that occurred. Predicted crashes are estimates from the crash prediction model. Expected crashes are a weighted estimate between predicted and observed crashes. The weight is a function of the magnitude of predicted crashes and the accuracy of the model prediction represented by the overdispersion term of the model. Equations 1 and 2 illustrate how expected crashes for a facility in the before period are computed based on a weighted linear combination of predicted crashes and observed crashes ( 12 , 14 ).


where
The adjustment factor (

Using Equation 4, the expected crashes in the after period (

The expected crashes in the after period (

As

where

The unbiased

Project Level
Project-level evaluations focus on combining multiple roadway facilities in the same project for safety evaluation. As different facility types have different crash prediction models, predicted crashes cannot simply be added. When facilities are evaluated at the project level, there is a degree of correlation among facilities that influences crash occurrence. It is difficult to determine the degree of correlation among roadway facilities, so the average of two extremes (independent and correlated) is assumed as a representative measure. Average of independent and correlated estimates provides a measure that represents the overall crash prediction estimate of an entire project that includes multiple roadway facilities.
Deviation of the project-level analysis from the site-specific analysis is the computation of the weighted value provided in Equation 2. The rest of the equations in the site-specific approach apply to the project-level approach. Two weighted values are estimated which are a function of aggregated predicted crashes and overdispersion of all facilities. Equation 11 provides the weighted value for the independent condition and Equation 12 provides the weighted value for the correlated condition ( 14 ). Equation 13 provides the average of the two weighted values, which can be used as a single-parameter estimate and continue with the EB method computations in a similar manner as site-specific analysis using Equations 1 and 3 to 8 ( 14 ).





where
Economic Assessment
Although safety effectiveness results provide a measure of the safety effect of the treatment, they do not provide a measure of benefits in relation to costs. Accounting for the weight of severity of each crash with crash costs is an alternative to assess the overall benefit of a treatment. Change in crash costs resulting from implementation of treatments was estimated. Based on the method used for the safety effectiveness described in this paper, the EB method can be adapted to measure the difference between expected crash costs without treatment and observed crash costs with treatment (
16
–
19
). Cost modification factor (

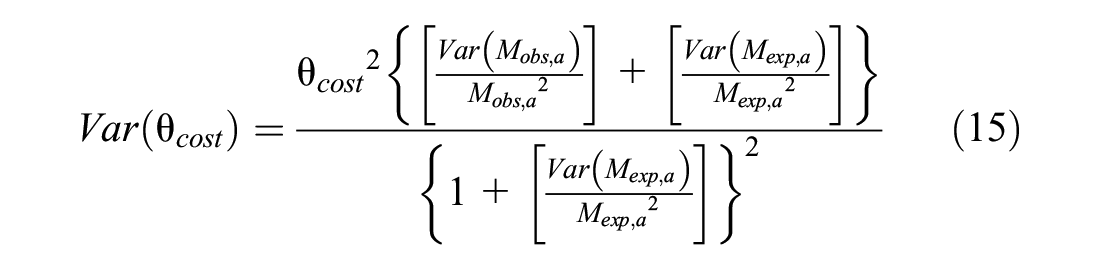
where
Additionally, the change in crash cost (


Council et al. developed crash costs using the National Highway Traffic Safety Administration national datasets, which included both police-reported KABCO and medical descriptions of injury in the Occupant Injury Coding system ( 20 ). These authors defined “cost estimate” as both human capital cost and comprehensive cost. Crash information required included the number of people involved in a given crash, severity of injuries each person suffered in the crash, costs associated with the injuries, and costs related to vehicle damage and travel delay. As part of the calculation of comprehensive crash costs, medically related, emergency services, property damage, lost productivity, and Monetized Quality-Adjusted Life Years (QALY) costs were included. Crash cost standard errors were obtained from the variance in crash costs caused by differences in the number of people involved in crashes of the same type, the severity of injuries suffered, and the age and sex of the victims ( 20 ).
For this study, available national KABCO crash cost estimates and corresponding standard errors were used ( 20 ). Crash costs were adjusted to 2020 dollars for this study using the Consumer Price Index (all urban consumers, all items, annual average index, unadjusted) to update economic costs and the Median Usual Weekly Earnings (current dollar usual weekly earnings of wage and salary workers, total, 16 years and older, not seasonally adjusted) to update QALY costs ( 21 ). For reference, updated crash costs are presented in Figure 4.
Benefit-Cost Ratio
Many factors influence the amount of economic investment justified for the implementation of a safety treatment on a roadway facility. Benefits may include crash cost savings, reduced delay, stops, fuel consumption, and emissions. Estimating the economic benefit of treatments in relation to operational and environmental benefits is a complex task that is highly dependent on site-specific conditions, assumptions made, and methodological approach. In this study, benefits account for crash costs savings only. Costs of implementation refer to all costs associated with the implementation of the treatment including survey, design, land acquisition, construction, and maintenance costs. Most safety improvement projects in HSIP targeted a 10-year life cycle. Thus, the benefit-cost ratio was calculated according to the safety benefit, project cost, and life cycle.
CMF Development
Development of CMFs using an observational before and after study design was also conducted using the EB method. From all projects evaluated in this study, commonly implemented treatments were identified, and CMFs were developed. Groups of sites that had similar treatments and operational traits were used. The EB method for development of CMFs aggregates safety estimates of individual sites or projects using Equations 1 to 4 and 9 to 13. Individual project estimates were aggregated to estimate the overall expected crashes in the after period assuming that facilities remained unchanged and had no treatment implemented to compare this estimate to the overall observed crashes at all facilities with the treatment to estimate the CMF (
22
). As the process aggregates estimates, EB estimates from each group, standard error of the CMF needed to be adjusted to reflect the variation of estimates among projects. Equations 18 to 21 provide the computations with the aggregation of estimates of all sites to obtain the unbiased


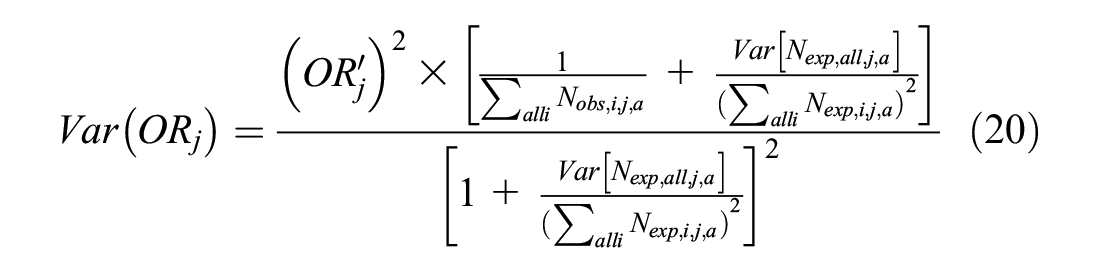

where
The unbiased
Development of Evaluation and Reporting Tool
Conducting safety evaluations requires a significant effort. With many projects to be evaluated, it is a massive undertaking to collect data, record data inputs, look up SPF coefficients, use several equations, and perform repeated computations. Thus, a novel proprietary spreadsheet evaluation and reporting tool was developed. The tool is a self-contained document that keeps all collected data, selection of SPFs, calculations, output, and reporting through an automated process. After data collection, the analyst is only required to follow five simple steps to conduct the evaluation:
Step 1: Input the raw crash data
Step 2: Input dates of beginning and end of construction
Step 3: Select SPF for facility type in the before period
Step 4: Input AADT for before and after periods
Step 5: Input project cost and life cycle
The tool automatically filters and counts crashes for before and after periods by severity and crash type, computes the crash prediction according to the SPF selected, and finds the EB estimates for both safety effectiveness and economic assessment. The tool also provides a three-page summary report in which the user is only required to input some of the project information from the HSIP application in Page 1. Figures 2 to 4 illustrate the three pages of the report.
Page 1: Project information, safety issues, countermeasure, and summary of results
Page 2: Safety effectiveness report, dates, crashes, EB estimates, and results
Page 3: Economic assessment report, crash costs, EB estimates, and results
HSIP requires that each state submit an annual report describing the progress made in highway safety improvements, assess the effectiveness of the improvements, and describe the contribution projects have had in reducing fatalities and serious injuries ( 1 ).
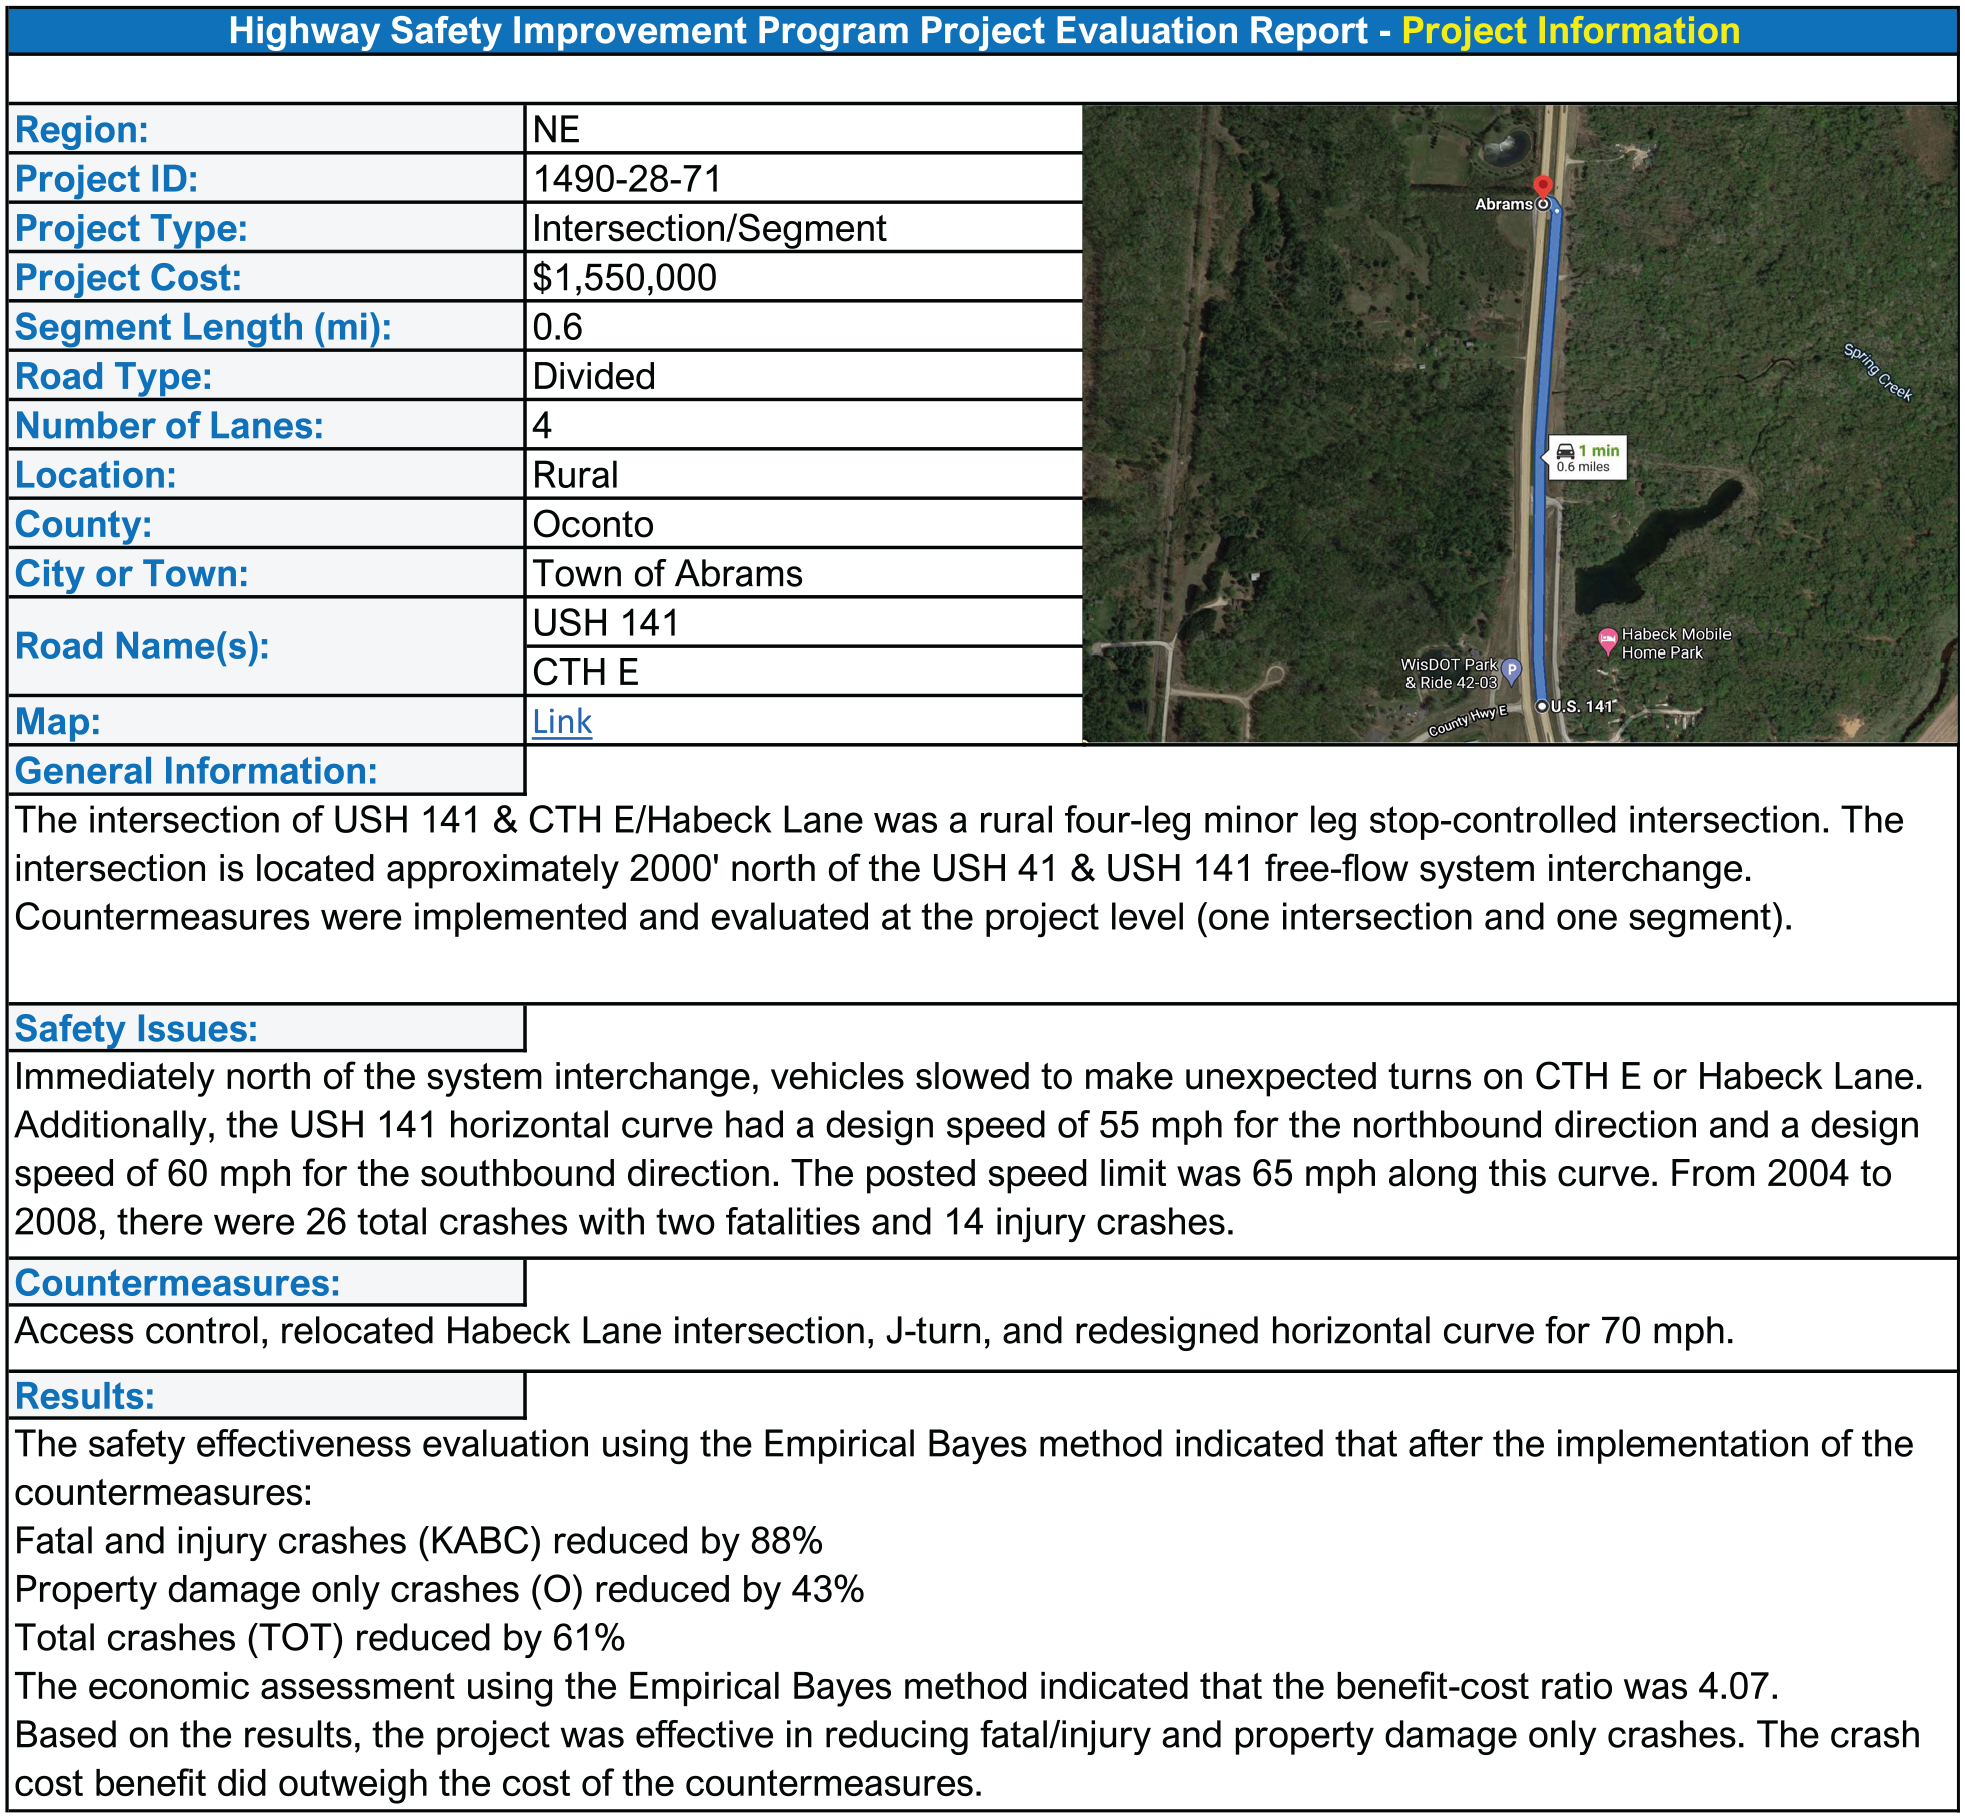
Page 1—project information.

Page 2—safety effectiveness report.
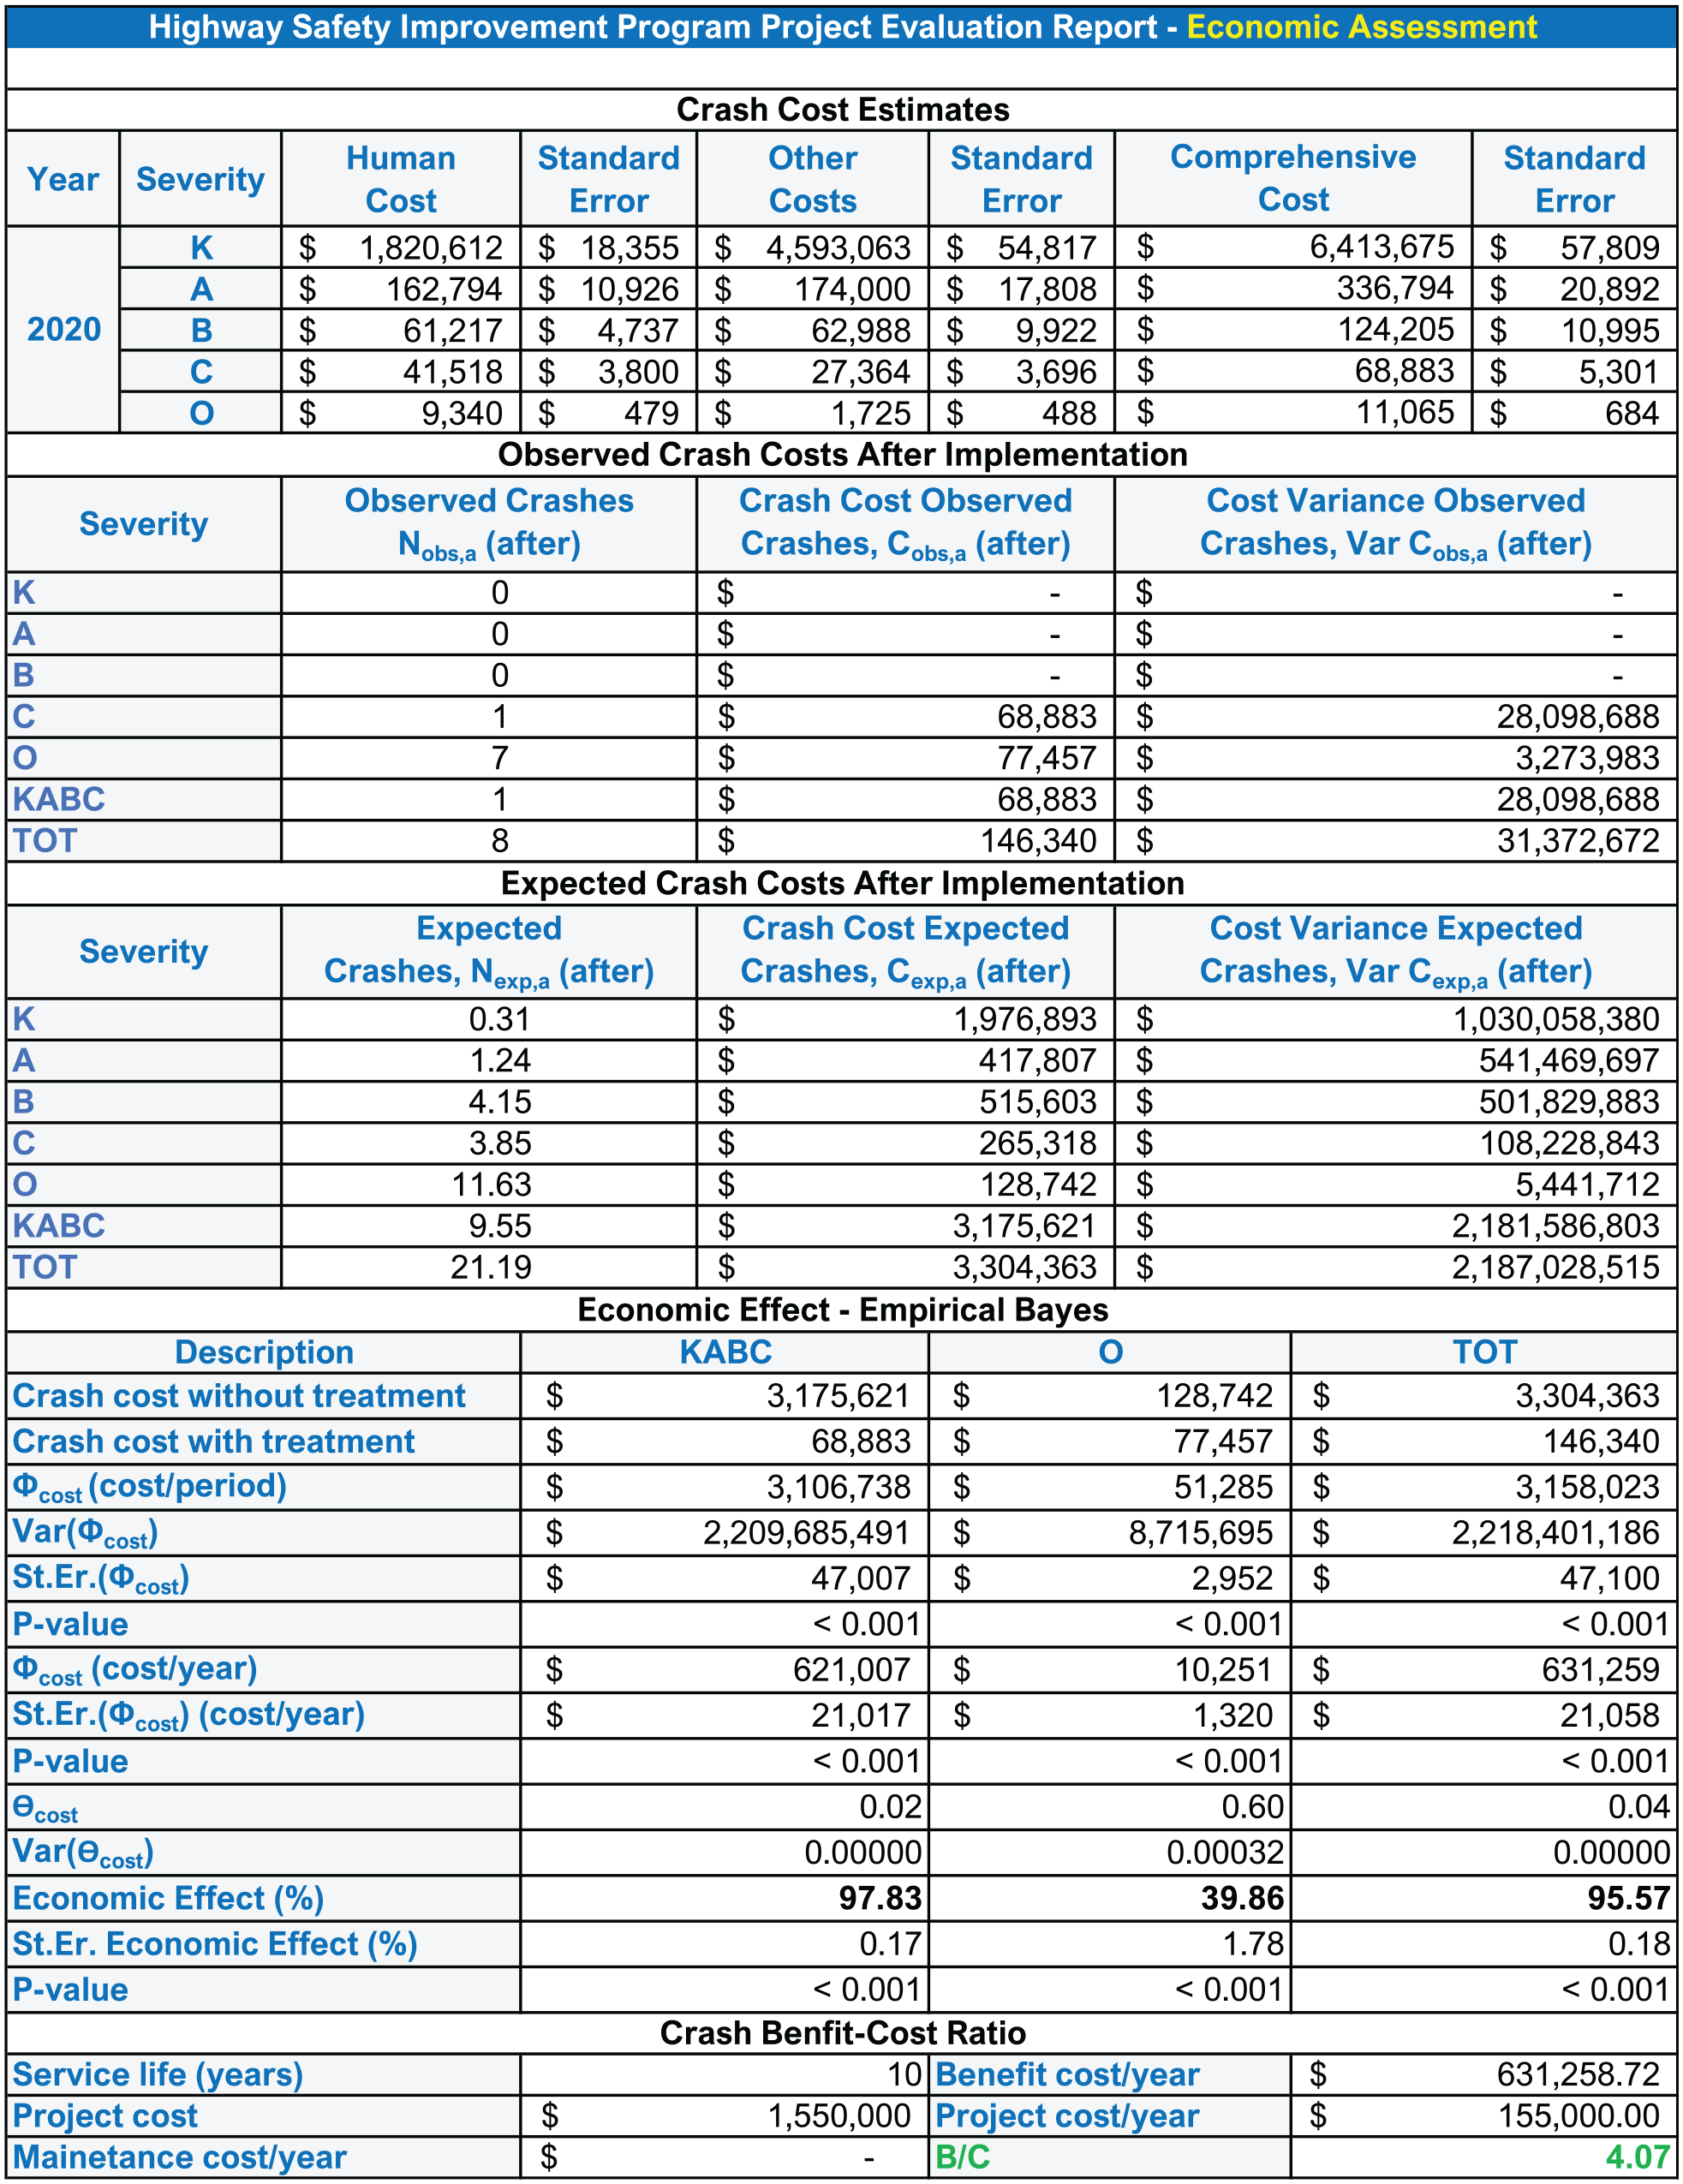
Page 3—economic assessment report.
Results
Evaluations of HSIP projects consisted of safety effectiveness and economic assessment. From the results of project evaluations, overall effectiveness of the program and accomplished benefits were assessed. Also, with the use of project evaluation estimates, CMFs were developed for common treatments implemented which will serve for project selection and analysis of future HSIP projects in Wisconsin.
HSIP Project Evaluations
Table 1 provides the results of the project evaluations including the treatment type, evaluation approach, safety effectiveness, cost of project, and B/C ratio. Treatment types were classified as follows:
1. Roundabout
2. J-turn
3. Intersection improvement
Signals Signal actuation
Black plate signals Left/right turn lane
Monotube Left turn offset
Overhead signal Right turn channelization
4. Segment improvement
Horizontal and vertical realignment Edge line
Rumble strips Lane designations
Shoulder Pavement marking
5. High-friction surface
6. Cable barrier
7. Brake check
8. Light poles
Safety improvement projects were evaluated following site-specific (SS) and project-level (PL) approaches. Results of the safety effectiveness in Table 1 are provided by severities: fatal and injury (FI), property damage only (PDO), and total (TOT) crashes. An increase in crashes is represented with a negative value and a decrease in crashes with a positive value. Statistical significance at the 90% confidence level is highlighted in green (decrease in crashes) and orange (increase in crashes) for the safety effectiveness. Results that are not statistically significant are highlighted in yellow, and NA (not available values) represent evaluations that did not have observed crashes in the after period.
Highway Safety Improvement Program Project Evaluation Results
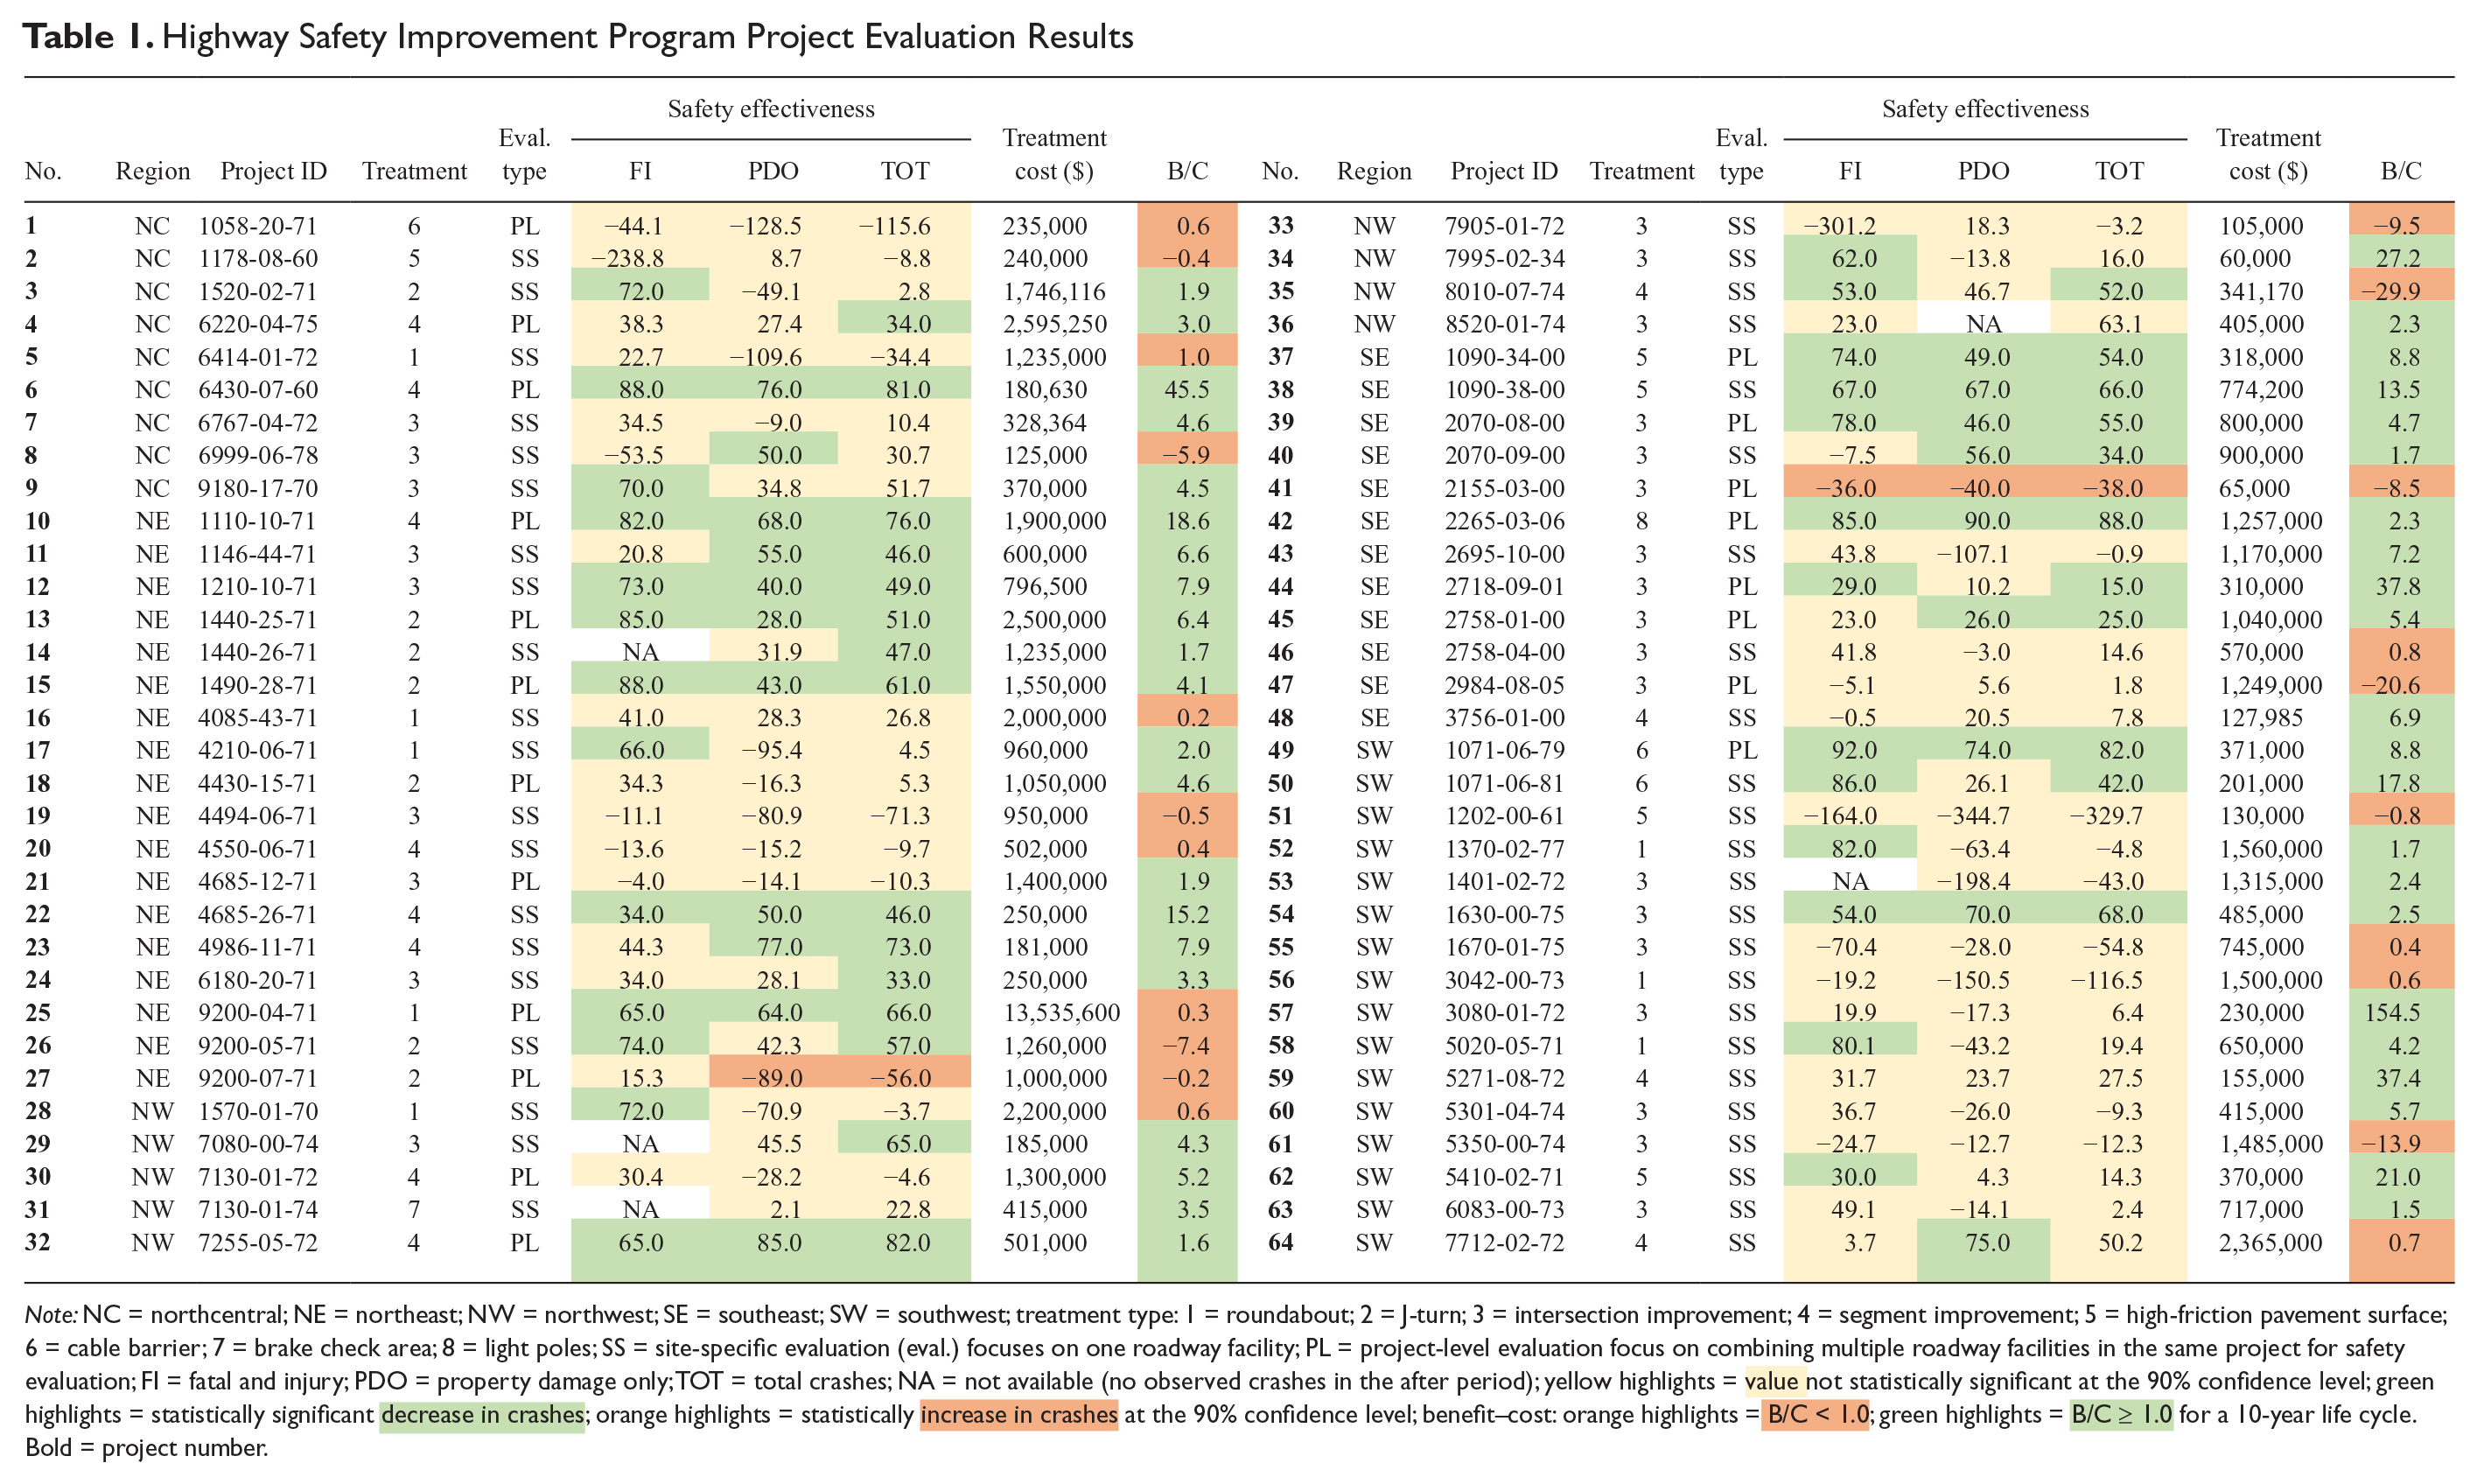
Note: NC = northcentral; NE = northeast; NW = northwest; SE = southeast; SW = southwest; treatment type: 1 = roundabout; 2 = J-turn; 3 = intersection improvement; 4 = segment improvement; 5 = high-friction pavement surface; 6 = cable barrier; 7 = brake check area; 8 = light poles; SS = site-specific evaluation (eval.) focuses on one roadway facility; PL = project-level evaluation focus on combining multiple roadway facilities in the same project for safety evaluation; FI = fatal and injury; PDO = property damage only; TOT = total crashes; NA = not available (no observed crashes in the after period); yellow highlights = value not statistically significant at the 90% confidence level; green highlights = statistically significant decrease in crashes; orange highlights = statistically increase in crashes at the 90% confidence level; benefit–cost: orange highlights = B/C < 1.0; green highlights = B/C ≥ 1.0 for a 10-year life cycle.
Results from the economic assessment are presented in the form of B/C ratios with a project horizon of 10 years. It should be noted the B/C ratio is the result of the combination of rigorous statistical methods and crash costs before and after implementation of the treatment. Project benefit refers to the safety benefit quantified from crash cost differences between observed and expected crashes by severity. Results of B/C ratios in Table 1 indicate a value equal or greater than 1.0 in green and lower than 1.0 in orange.
Although the safety effectiveness results may not have provided statistically significant results, it is still possible to obtain statistically significant economic safety estimates to compute the B/C ratio. Of the 64 HSIP projects evaluated, eight were roundabout installations, seven J-turn implementations, 27 intersection improvements, 12 segment improvements, five high-friction surface treatments, three cable barrier installations, one brake check, and one light pole project implemented between 2013–2019. There was an overall positive return on investment of projects implemented with 43 out of 64 projects showing B/C ratios greater than one.
In the evaluation process, some limitations of the EB method were identified. The EB method combines observed crashes with prediction of crash prediction models weighing estimates based on the accuracy of the model. Crash prediction models are usually available for aggregated crash severities such as fatal and injury crashes (FI) because there are not enough crashes for fatal (K), serious injuries (A), or even minor injuries (B) to develop models for each severity, so data aggregation makes sense. However, crash severity aggregation limits the ability to evaluate specific crash severities. Thus, as an alternative, aggregated crash estimates are multiplied by severity distribution factors which are usually obtained from a large sample of crashes by facility type. Despite the intuitive approach that a severity distribution from a sample translates to the prediction of a model, estimates for severe crashes such as fatalities lack accuracy and may bias the results when severe crashes are observed in the before or after period of analysis, especially in the economic assessment.
For instance, in Table 1, in projects No. 26, 35, 47, and 61, more fatalities were observed in the after period (one or two) than in the before period (none or one). With a naïve before and after comparison, there was an increase in fatal crashes for all these projects. When looking at the EB safety effectiveness for fatal and injury (FI) crashes, projects No. 26 and 35 had statistically significant crash reductions, and projects No. 47 and 61 had small increases in crashes which were not statistically significant. Thus, severity aggregation and the EB for safety effectiveness do not account for the influence of severe crashes in the aggregated estimates as all crashes with designated aggregated severity are treated equally (i.e., fatal and injury aggregated crashes).
When the EB estimates are used in the economic assessment, costs are assigned to each crash severity. Fatal crashes have the highest crash cost value and a fatal crash in the after period of an evaluation will skew the results of the B/C ratio as illustrated in Table 1 for projects No. 26, 35, 47, and 61, which in these cases have large negative B/C ratios. Note that the benefit is the subtraction of expected crash costs assuming that there was no treatment implemented and crash costs from observed crashes in the after period with the treatment. Thus, with fatalities either in the before or after period, the crash cost of observed crashes can be significantly larger than expected crash costs, resulting in skewed results. On the other hand, some projects had significantly larger B/C ratios. In most cases, very effective low-cost treatments will result in a high B/C ratio.
Overall Performance
When looking at the overall B/C of projects by type in Table 2, most projects showed B/C ratios greater than one. However, roundabout projects showed a B/C of 0.6. As the project horizon for HSIP projects in Wisconsin is 10 years (short-term return on investment) and roundabouts have a relatively high cost, return on investment is expected in a longer horizon such as 20 years, at which the B/C would be approximately 1.2. The aggregate B/C ratio of 64 HSIP projects evaluated in Wisconsin is 2.71 for a 10-year horizon.
Overall Benefit–Cost (B/C) for a 10-Year Horizon

Crashes and Person Injuries Prevented
Although safety effectiveness and economic safety measures are commonly reported as part of safety analyses, taxpayers and the audience in general require more palpable measures to gauge the return on investment in transportation safety improvements. Thus, as part of this study, specific measures of crashes, human lives, injuries, and material loss prevented were quantified.
Using the Wisconsin CODES data ( 23 ), hospital and crash databases were linked to categorize injuries by part of the body, fracture involvement, and threat to life. Each person injured was linked to the corresponding crash report. As police crash reports are designated by the highest injury severity observed from one of the persons injured in the crash, multiple individuals with different injury severities may be involved in the crash. A total of 348,731 crashes with hospital and crash reports linked at the state level (Wisconsin) between 2009 and 2016 were used. Table 3 provides a summary of crash severity and corresponding number of persons injured.
Estimated Person Injuries per Crash

Note: K = fatal; A = serious injury; B = minor injury; C = possible injury; O = property damage only; TOT = total crashes; na = not applicable.
For instance, for every fatal crash there are 2.85 persons affected: 1.10 fatal person, 0.99 persons injured (ABC), and 0.76 persons with property damage only (no injuries). Using the estimated number of persons injured per crash by severity in Table 3, crashes and injuries prevented during the period of analysis of each HSIP project evaluated in this study are presented in Table 4. From 64 HSIP projects implemented in Wisconsin between 2013 and 2019 a total of 536 crashes were prevented, which translates to seven lives saved, 380 person injuries prevented (29 A, 134 B, and 217 C), and 1,067 property damage losses avoided (no injuries).
Actual Crashes and Person Injuries Prevented During Period of Study

Note: K = fatal; A = serious injury; B = minor injury; C = possible injury; O = property damage only; TOT = total crashes.
HSIP projects evaluated in Wisconsin provided a B/C ratio of 2.71 for a horizon of 10 years. However, observed estimates during the period of analysis were projected to 10 years assuming safety will remain the same over the years. Alternatively, using the observed data during the study period of each project (3–5 years after implementation), the current return on investment was estimated. In Table 5, based on the results of crashes prevented by severity and the overall project costs, the current overall crash cost benefit is equal to $72 million, which corresponds to a B/C ratio of 1.10. Therefore, the crash cost benefits of the 64 HSIP projects have already surpassed the cost of the projects at 3–5 years of the projects’ life cycle.
Overall Benefit–Cost (B/C) for Observed Periods After Implementation

Note: Note: K = fatal; A = serious injury; B = minor injury; C = possible injury; O = property damage only.
HSIP-Specific CMFs
Roadway facilities where similar treatments were implemented were selected to develop Wisconsin-specific CMFs (provided in Table 6). Treatments such as roundabouts, J-turns, and cable barrier/guardrail showed similar results as the literature with significant potential for reduction in crashes, especially for fatal and injury crashes ( 24 ). For instance, the roundabout CMFs were 0.465 for FI (53.5% potential reduction) and 1.307 for PDO (30.7% potential increase).
Wisconsin HSIP-Specific CMFs

Note: HSIP = Highway Safety Improvement Program; FI = fatal and injury; PDO = property damage only; TOT = total crashes; CMF = Crash Modification Factor.
Although the CMFs were developed in some cases with limited number of sites or projects, current estimates will contribute to decision making for future project applications and continue building the sample of projects for future evaluations and update CMFs with greater accuracy and confidence.
Conclusions
HSIP provides a systematic approach to select, implement, evaluate, and report projects that save human lives, and prevent injuries and property loss. Methods and procedures presented in this paper contribute to the goals of the program by providing rigorous performance evaluations that will influence decisions on future projects and strategies. Wisconsin HSIP projects implemented between 2013 and 2019 were used to demonstrate the methods and procedures. The evaluation process consisted of data collection, safety effectiveness, economic assessment, reporting, and development of program-specific CMFs. The safety effectiveness and economic assessment was conducted using the EB method at the site-specific or project level.
The HSIP projects had an overall positive safety and economic effect—43 out of 64 projects resulted in B/C ratios greater than one. The HSIP program (64 projects) provided a B/C ratio of 2.71 for a horizon of 10 years. Alternatively, using the observed data during the study period of each project (3–5 years after implementation), the current return on investment was estimated. Current overall crash cost benefit is equal to $72 million, which corresponds to a B/C ratio of 1.10. Therefore, the crash cost benefits of the 64 HSIP projects have already surpassed the cost of the projects at 3–5 years of the projects’ life cycle.
Using the Wisconsin CODES data ( 23 ), hospital and crash databases were linked to categorize injuries by part of the body, fracture involvement, and threat to life. Using the estimated number of persons injured per crash by severity, HSIP projects are estimated to have prevented a total of 536 crashes, which translates to seven lives saved, 380 person injuries prevented (severities A: 29, B: 134, and C: 217), and 1,067 persons loss of property avoided (no injuries).
Roadway facilities where similar treatments were implemented were selected to develop CMFs. Treatments such as roundabouts, J-turns, and cable barrier/guardrail showed similar results as the literature with significant potential for reduction in crashes, especially for fatal and injury crashes ( 24 ).
Limitations of the study include the effects of unobserved factors and crash costs. With before and after studies, it is acknowledged that there are some unaccounted temporal factors that may influence crash occurrence; however, it is assumed that most of the effect is attributed to the intervention or treatment. Also, the procedure to update crash costs assumes that costs only change as a result of economic performance, which may not reflect the effect of changes in crash reporting, crash data management, hospital records linkage, vehicle safety technologies, and road design over time. Despite advancements in crash and hospital data availability and development of more rigorous statistical methods in safety analysis, there has not been an update of crash cost estimates with national-level data. Crash cost estimates published in 2005 continue to be updated or used as reference despite the limitations of the procedure. Estimating crash cost is not a simple task, and requires a significant amount of data, resources, and effort that state or local agencies may not be able to accurately and regularly develop on their own.
Footnotes
Acknowledgements
The authors are thankful for the assistance provided by Kevin Scopoline and Michael Finkenbinder from the Wisconsin Department of Transportation. We would also like to thank Wisconsin DOT regional office managers and staff that provided the data from HSIP projects.
Author Contributions
The authors confirm contribution to the paper as follows: study conception and design: Boris Claros, Andrea Bill, Madhav Chitturi; data collection: Erynn Schroeder and Kentin Brummett; analysis and interpretation of results: Boris Claros, Erynn Schroeder, Kentin Brummett; draft manuscript preparation: Boris Claros, Erynn Schroeder, Kentin Brummett, Madhav Chitturi, Andrea Bill, David A. Noyce. All authors reviewed the results and approved the final version of the manuscript.
Declaration of Conflicting Interests
The author(s) declared no potential conflicts of interest with respect to the research, authorship, and/or publication of this article.
Funding
The author(s) disclosed receipt of the following financial support for the research, authorship, and/or publication of this article: This study was sponsored by the Wisconsin Department of Transportation.

The work presented in this paper remains the responsibility of the authors.