



Abstract
Several service and performance indicators (SPIs) have recently been developed to evaluate pedestrian infrastructures, such as different walkability indexes and pedestrian level of service (P-LOS). Given that stress has become a popular SPI for bicyclists (level of traffic stress [LTS]), this study addressed stress for pedestrians as an SPI by relating measurable attributes of different urban street segment environments with pedestrian perceived stress. A stress-based pedestrian SPI was proposed to classify street segments into four levels of pedestrian stress. A total of 1,043 pedestrians across 30 segments in Bogotá were surveyed about their perceived stress. Multimodal traffic counts, location audits, and layout dimensions were collected in each segment to estimate an ordered probit model that explained four stress categories. Physical infrastructure attributes and traffic operational conditions were found to affect perceived stress at given locations. The similarities between the proposed stress index with the LTS and P-LOS are discussed, and the proposed SPI is applied to pedestrian infrastructure planning and design in light of sustainable transportation goals.
Various indicators have been used in recent decades to assess pedestrian infrastructure service or performance. A variety of measurements or service and performance indicators (SPIs) for pedestrian infrastructure have been developed, relating measurable elements of a given road segment with a perceived proxy of the service or performance. Thus, any pedestrian SPI defines a single service or performance variable (e.g., quality of service [QoS], comfort, satisfaction, or stress) as being related to various measurable characteristics (e.g., traffic volume, pedestrian density, traffic speed, interaction with other street users, geometry). One commonly used SPI is pedestrian level of service (P-LOS) ( 1 ), introduced in 1985. P-LOS has been evolving from its early stages, where user density was the only input, to its current multivariable and multimodal approach. Other indicators, such as the walkability index ( 2 – 5 ), were introduced before the 2000s and also incorporated measures from both operational and physical attributes related to the infrastructure. However, despite these developments, stress has not been commonly used as an objective variable in the design of SPIs that evaluate the effect of measurable characteristics on this psychological response.
Psychological stress can be defined as an adaptative response to an identified stimulus that leads to changes in an individual’s psychological and physiological equilibrium ( 6 ). These changes are associated with each person’s coping strategies and can affect their task performance and decision making ( 6 , 7 ). In the transport literature, psychological stress has been found to influence travel-related decisions because stressful situations have a negative impact on emotional and behavioral responses ( 8 ). For example, some studies have revealed that stressors such as traffic congestion, noise, and pollution are associated with learned helplessness ( 9 ). Others have found stress to be one of the most relevant affective factors related to the commute ( 8 ), and proposed that stress is the polar opposite of relaxation and, as a negative affective response, is related to avoidance behaviors in relation to situations and places ( 10 – 12 ).
From the perspectives of transportation and development, increasing walking and bicycling in cities is critical to enhancing urban sustainability ( 13 – 15 ). Understanding how the built environment affects behavioral and psychological responses is key to encouraging commuters to choose nonmotorized modes. Although stress was initially explored as an SPI for pedestrians in the 1990s ( 16 ), its use and application were not extensively endorsed. In contrast, a recently developed SPI to assess stress in bicyclists, called level of traffic stress (LTS), has become popular worldwide and has recently been implemented in a variety of studies (including Furth et al. [ 17 ]; Huertas et al. [ 18 ]; and Mekuria et al. [ 19 ]). LTS is an SPI that evaluates the level of stress experienced by bicyclists in a street segment or at an intersection. It is a practical methodology in which any street can be classified into four stress levels, each of which is associated with a type of user that can ride on it. Thus, LTS1 indicates the lowest possible level of stress and means that the most inexperienced users can tolerate riding their bicycles on such infrastructure. Conversely, LTS4 means that only the most experienced users can use such infrastructure given its conditions and the skills required to use it. This LTS model evinces that bicyclists’ stress levels are related to the contexts while traveling. Furthermore, the evidence shows that nonmotorized users also perceive their contexts and that such perceptions directly affect SPIs ( 20 , 21 ). The previously mentioned similarities imply that the estimation of a pedestrian stress SPI could provide information relevant to promote walking in the same way LTS provides information on strategies to promote bicycling.
Accordingly, identifying the physical characteristics and operational attributes of a given street segment that relate to different stress levels could provide insights for policy making into the design and implementation of sidewalks that are attractive to pedestrians. This study proposed a stress-based pedestrian SPI for urban sidewalks using objectively measurable right-of-way (ROW) attributes, both geometric and operational. An in-person survey was administered to 1,043 pedestrians, and a series of measurements were conducted in 30 different street segments in Bogotá, Colombia. Multimodal traffic counts, location audits, and layout dimension measurements were collected to estimate an ordered probit model with four categories (to make it similar to the bicycle stress indicator). The proposed stress indicator, its relevance in light of current SPIs, and its applications are discussed. This study contributes to the literature by providing a specific SPI that, based on LTS, assesses pedestrian stress on urban sidewalks. The SPI only assesses sidewalks and not intersections and considers actual on-site pedestrian stress perceptions. It characterizes the role of two different groups of attributes (i.e., infrastructure- and operation-related) as stress explanators for pedestrians on the ROW.
Literature Review
The emotional and behavioral responses of pedestrians and cyclists, and their perceptions, are influenced by stimuli from the built environment ( 11 , 12 , 22 ) as a result of their constant and direct interactions ( 23 , 24 ). One of these emotional responses is stress. In transportation, stress has been the subject of research, especially exploring its relation to and effects on health ( 25 ), quality of life ( 26 , 27 ), and livability ( 28 ). Stress has also been commonly associated with personality traits ( 29 ) and built environment characteristics ( 30 ). In nonmotorized transportation, specifically for bicycling, stress (LTS) has been used as an SPI. LTS is a methodology that classifies bicycle infrastructure (i.e., segments and intersections) into one of four levels of stress ( 19 ). These levels reflect the riding suitability that infrastructure provides for bicyclists with different degrees of experience and tolerance for traffic conditions (i.e., from users with the least tolerance—LTS1, to “strong and fearless” users—LTS4) ( 17 , 18 , 31 , 32 ). These tolerance levels are derived from the bicyclist types found by sampling Portland’s population, based on their willingness to use a bicycle ( 33 ) and from further explorations of such groups ( 34 ). Bicyclists’ LTS evaluation comprises the measurement of tangible attributes at the location, classified into two groups: infrastructure-related attributes (e.g., geometric) and operational attributes (e.g., traffic and interactions). In the first set of attributes, standard measures include lanes per direction, obstacle presence, presence of a buffer (i.e., parking lane beside the bike lane), and bike lane width. Lanes per direction and obstacle presence increase stress levels, whereas buffers and lane width reduce it. The operational set of attributes includes speed limit or prevailing speed, shared lanes, and traffic flow. These measures are positively related to stress levels (17–19, 35).
LTS studies have shown that the stress response in urban environments can influence travel-related decisions. Low-stress networks, for instance, are attractive to potential bicyclists ( 17 ), whereas higher stress levels can deter people from choosing bicycling as a mode of transportation ( 35 ). Other transportation studies include stress as an affective response toward commuting ( 7 , 36 ). For instance, it was found that there is a correlation between low commuting stress and a positive attitude toward the mode used ( 36 ), which subsequently influences future behaviors and modal choices ( 37 , 38 ). From this perspective, stress correlates with active traveling mode choice ( 39 ). Evaluating the level of stress an infrastructure causes in its users is related to their traveling behavior and decisions, especially when users are in direct contact with the built environment, as is the case for bicyclists and pedestrians ( 24 ).
However, for pedestrians, much less research has been conducted on SPIs assessing stress, despite its potential impact on people’s health ( 40 ). One of the initial studies on pedestrian stress was conducted in the 1990s and proposed comparing level of service (LOS) categories from A to E and five stress levels. The higher the stress level, the lower the LOS. Four primary variables that affect pedestrians’ perceived stress were proposed: density related to walkers, the presence of buffers, traffic volume, and traffic speed ( 16 ). These variables also coincide with some of the variables used to estimate P-LOS based on the Highway Capacity Manual multimodal LOS methodologies ( 41 ). In the following years, new groups of characteristics associated with the social and built environment that influence pedestrians’ perceived stress were found ( 42 ). From the social perspective, it is suggested that a way to decrease perceived stress is by increasing the level of trust associated with the neighborhood ( 42 ). Built environment interventions can increase this trust (i.e., increasing the presence of people and therefore “eyes on the street” from outside buildings) ( 43 ). The literature also shows that higher pedestrian stress levels result from high pedestrian density because of the higher probability of personal space invasion in crowded environments ( 12 , 44 ). Furthermore, among the measures used to describe arousal in an environment, noise and pollution appeared in different studies as being positively associated with stress ( 9 , 11 , 36 )
Recently, perception-related variables have been commonly expressed through latent variables that include users’ subjective aspects ( 45 ). Latent variable “discomfort” was identified from different pedestrian perceptions, including perceived stress ( 46 ). This latent variable influences pedestrian-perceived protection, surrounding, and sidewalk characteristics to ultimately generate an indirect effect on pedestrian perceived QoS when walking on urban sidewalks ( 46 ). Other research has identified objectively measured characteristics of the built environment (i.e., median strip presence and buffer width) and sidewalk operation (i.e., bicyclist presence) to indirectly influence a latent variable with similar characteristics ( 47 ).
Methods
The fieldwork for this study comprised infrastructure audits, layout dimension measurements, and multimodal traffic counts at 30 different locations in Bogotá, Colombia. The locations were selected to attain various local characteristics and diversity in street typologies, traffic, and built environments. Perceived stress was measured using an in-person survey administered to at least 30 pedestrians in each of the selected 30 sidewalks. A total of 1,043 valid responses resulted from a systematic pedestrian selection (of one in every three passersby) to assure randomness and avoid biases such as self-selection. Each survey lasted an average of 8 min, and the overall response rate was 33.2%. The sample’s age (35 years on average), gender (49.3% men and 50.7% women), income level, and walking trips were distributed similarly to the 2015 Bogotá’s household travel survey ( 48 ). The survey was applied from June 2 to June 19, 2018, during workdays from 08:00 to 18:00. The questionnaire included general perception questions and sidewalk-related perception statements answered on an 11-point Likert scale (0 to 10). Overall perceived stress was measured by considering the respondents’ level of disagreement or agreement with the statement “walking on this sidewalk is stressful” (where 0 is “totally disagree” and 10 is “totally agree”). No further instructions or clarifications were provided for the meaning of stress. Overall stress was used in this study, given that the main objective was to assess the relationship between on-site objectively measured attributes and perceived stress.
Traffic counts were carried out simultaneously with the survey administration in 5-min periods and included nonmotorized and motorized users. The audits were used to assess the quality of the built environment ( 49 ), including the measurement of sidewalks and buffer widths (i.e., the separation between the sidewalk and motorized traffic including bicycle lanes, parked cars, and green infrastructure), and the evaluation of the presence of potholes and median strips, among others. Table 1 presents the explanatory variables used in this study.
On-site objectively measured and subjective attributes

Note: See Figure 1 for a graphic description of the on-site measurable objective attributes.
Each sidewalk was visually assessed to evaluate pothole presence or any condition that could be perceived as a pothole.
The buffer width is an on-site measurable objective attribute that can be challenging to measure as it depends on the sidewalk’s environment. For this study, the buffer width was defined as the distance between the edge of the motorized traffic infrastructure and the edge of the infrastructure used for walking (i.e., the lateral separation between the pedestrians and the motorized vehicles). The main buffer typologies reported in the literature are no lateral separation (i.e., buffer width = 0), lateral separation with no vertical barriers, and lateral separation with vertical barriers (e.g., trees and on-street parking) ( 41 ). These are schematized in Figure 1.

Schematic representation of the on-site objectively measured variables in the right-of-way (ROW).
Two secondary variables were calculated based on the on-site objectively measured attributes shown in Table 1 and Figure 1: pedestrian density and traffic volume. Pedestrian density was calculated as the rate of pedestrian flow divided by the sidewalk’s effective width. Motorized traffic volume was estimated through a passenger car per unit (PCU) measure, considering several types of vehicles on the road adjacent to each sidewalk. The equivalences of vehicles to calculate the PCU were adapted from Arasan and Arkatkar ( 50 ), and Equation 1 was used for the calculation.

The average perceived stress for each location using all the available survey responses was calculated. This value was used as the dependent variable and the attributes’ values (Table 1) as independent variables. Based on the four discrete categories of the LTS by Mekuria et al. ( 19 ), this study proposed four stress categories for the level of pedestrian stress (LPS) (i.e., LPS1 = low, LPS2 = medium-low, LPS3 = medium-high, and LPS4 = high) related to the mean stress value calculated for each location. Next, a parsimonious ordered probit model (stepwise approach) was estimated to identify the variables that significantly explained stress. To use ordered probit models, an unobserved variable, z, defined as a linear function of each observation, is calculated using Equation 2 ( 51 ),

where
X is the vector of the independent variables (i.e., objectively measured attributes presented in Table 1),
ε is the random disturbance term associated with z.
Based on Equation 2, it is possible to determine the observed stress-level categories for each observation using Equation 3,
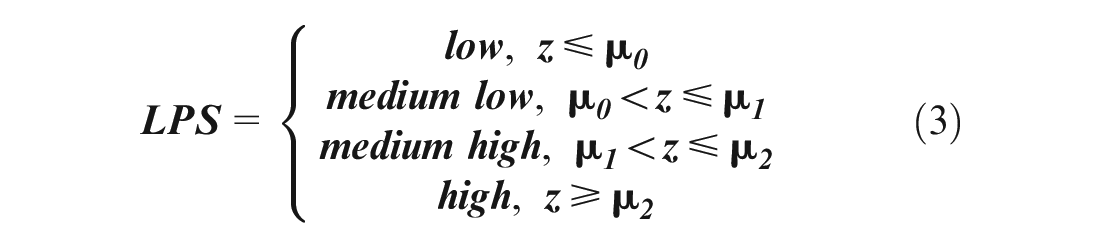
where μ is the thresholds defining the stress levels based on the estimated z value (Equation 2). To estimate these thresholds, an iterative process to maximize Nagelkerke’s pseudo R2 was used. Initially, four categories were established assigning an arbitrary threshold (i.e., LPS1 under percentile 1, LPS2 between percentiles 1 and 2, LPS3 between percentiles 3 and 4, and LPS4 above percentile 4). With these initial thresholds, a first model was estimated, whose Nagelkerke R 2 was the object of maximization. Subsequently, a new model was estimated, varying the value of the thresholds by 1% in each step (N = 156,849 steps), and in each of these steps, Nagelkerke’s pseudo R2 for the new estimated model was compared with the previous one until the maximum value for this measure was achieved. Once the maximum value was reached, such thresholds were implemented to define the best model. Equations 2 and 3 were adapted from the literature ( 47 , 51 , 52 ), and, in this sense, positive coefficients in the model (Equation 2) are associated with higher stress levels, whereas negative coefficients are associated with lower stress levels.
Finally, the proportional contribution of each attribute on the perceived stress was calculated to quantify and compare the attributes’ influences on stress. To calculate the proportional contribution of each attribute, Equation 4 was used, based on different proportion calculations proposed in research by Ortúzar and Willumsen ( 45 ),

Results and Analysis
The model results showed that both infrastructure and operational attributes significantly influenced the mean stress level ratings or LPS of sidewalks. The infrastructure attributes that significantly explained the LPS were the buffer width, the presence of potholes on the surface of the sidewalk, and the presence of a median strip. In turn, the relevant operational attributes are those related to pedestrian volume and density, and motorized traffic (PCU) volume and speed (Table 2). Having developed the iterative process that was implemented to maximize Nagelkerke’s pseudo R2, the first LPS was found to be below a location’s stress average of 2.457 (four sidewalks and 12.4% of the observations); the second was between 2.457 and 4.285 (16 sidewalks and 53.7% of the observations); the third was between 4.285 and 4.916 (six sidewalks and 20.3% of the observations); and the fourth level was above 4.916 (four sidewalks and 13.6% of the observations). The lowest mean stress value was 1.54 (Figure 2a) and the highest 5.54 (Figure 2n). The mean stress of the 30 locations was 3.69 (i.e., LPS2). Figure 2 shows four examples of the audited locations for each LPS and their corresponding mean stress value.
Ordered Probit Model Results

Note: LPS = level of pedestrian stress; PCU = passenger car per unit; AIC = Akaike information criterion; SE = standard error.
p < 0.100; *p < 0.050; **p < 0.010; ***p < 0.001.

Level of pedestrian stress (LPS) street classification for 16/30 cases and average perceived stress (with 1.54 = lowest stress and 5.54 = higher stress).
LPS can be determined based on the value for the unobserved variable z in Equation 5 and the estimated thresholds presented in Table 2, according to Equation 3,

where
BW= buffer width (m),
PP = potholes presence on the sidewalk surface (yes = 1/no = 0),
MSP = median strip presence (yes = 1/no = 0),
PV = pedestrian flow—both directions (5 min),
PD = pedestrian density (pedestrian volume/effective width),
TV = PCU (5 min), and
TS = Motorized traffic speed (km/h).
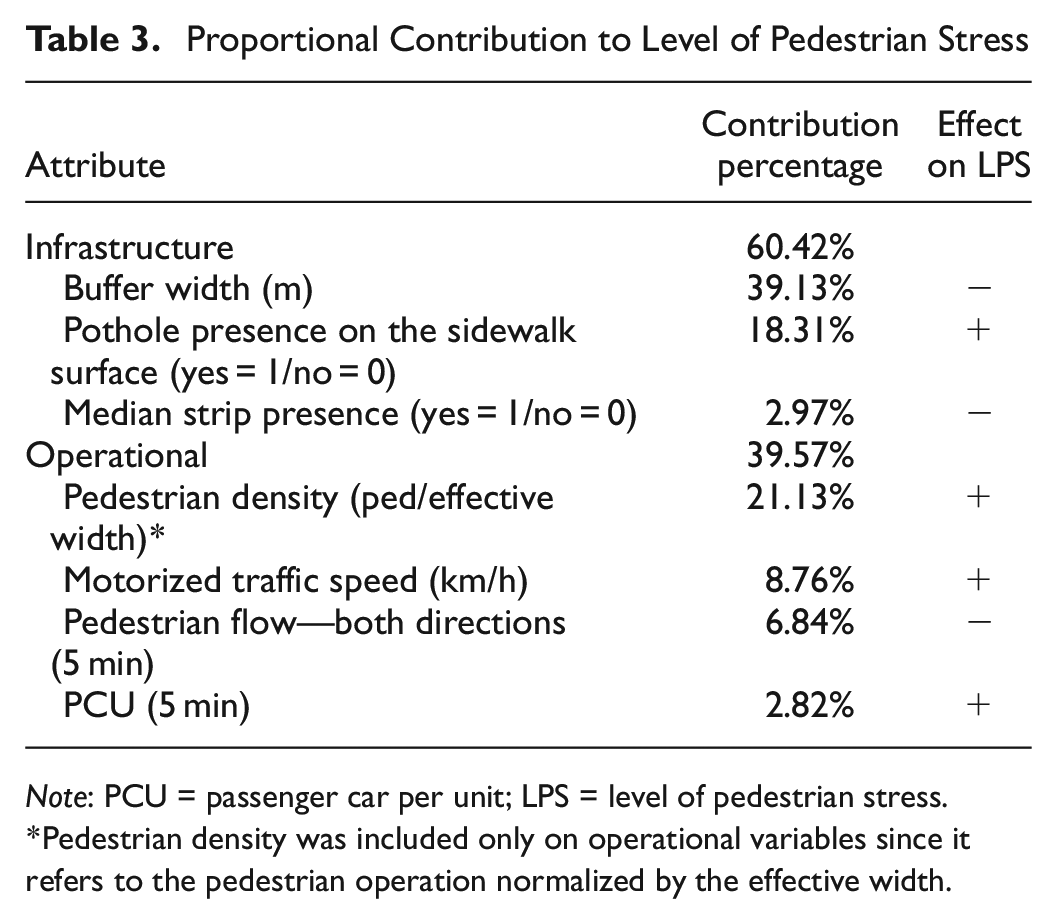
When assessing the results for their positive and negative impact on LPS, it was found that the attributes both increased and decreased the LPS, as shown in Table 2. Buffer width, median strip presence, and pedestrian flow were associated with lowering the LPS. In contrast, potholes on sidewalks, pedestrian density, and motorized traffic speed and volume were associated with LPS increases. When both groups (i.e., those positively and negatively associated with stress) were evaluated for their proportional contribution to the total effect on z, both were found to have almost the same effect on LPS. Attributes increasing the LPS accounted for 51.1% of the total effect of the attributes on z, whereas attributes decreasing the LPS accounted for 48.9% of the total effect. In relation to the sets of attributes (i.e., infrastructure- and operation-related), the influence of infrastructure attributes on LPS were found to be greater than operational ones. Table 3 shows the proportional contribution of each group of attributes on LPS.
Proportional Contribution to Level of Pedestrian Stress
Note: PCU = passenger car per unit; LPS = level of pedestrian stress. *Pedestrian density was included only on operational variables since it refers to the pedestrian operation normalized by the effective width.
Given these results, it was proposed that increasing the buffer width would decrease LPS, whereas the opposite would occur with the presence of potholes on the surface of the sidewalk. More specifically, whereas buffer width is indirectly related to operational attributes because it measures the separation between the pedestrians and moving vehicles, the presence of potholes directly measures the sidewalk’s condition. Based on the data presented in Table 3, the impact of buffer width greatly exceeded the impact of vehicular flow or speed, highlighting this infrastructure attribute as the most relevant attribute in relation to LPS reduction. The lack of sidewalk maintenance seemed to cause the greatest rise in LPS because of the presence of potholes, which make it difficult to walk on sidewalks. This result is supported by the literature that highlights the relationship between potholes, poor maintenance, and unsafe spaces ( 53 ). Furthermore, uneven sidewalks are a consequence of the presence of potholes, and such conditions can be associated with a risk of falling or of posing obstacles to pedestrians, including those that have reduced mobility ( 54 ).
With reference to the impact of motorized traffic on LPS, vehicular flow and speed were found to have a small but significant effect on LPS. As identified in the literature, noise and pollution are correlated with stress ( 9 , 11 , 12 , 36 ), which explains the effect of motorized traffic on pedestrians. However, according to the results, variations in traffic flow and speed conditions had fewer effects on LPS compared with infrastructure-related attributes. This finding has implications for physical interventions that are intended to mitigate stress. Intervening and modifying traffic operations in urban contexts require pricy, multiagency efforts, but intervening and maintaining sidewalks could be established as a much easier strategy to affect pedestrian perceived stress. Given that the physical conditions of sidewalks affect LPS the most, decision makers could focus their interventions on these conditions first and more rapidly.
It was found that high or low LPS could not be strictly associated with a particular street typology. A street typology is composed of different attributes that can positively and negatively affect LPS indicators (see Tables 2 and 3). Although major arterial roads generally have more traffic and higher speeds—both of which increase perceived stress—they also have the necessary space for wider sidewalks and buffer zones. For instance, example b in Figure 2 shows a very low LPS, despite being one of the city’s arterial roads. In this case, although motorized traffic volumes and speeds are relatively high, attributes decreasing the LPS, such as generous buffers, median strips, and broader sidewalks (which reduce pedestrian density), exerted a mitigating effect on stress. Conversely, examples n and o in Figure 2 show that busy minor streets with low pedestrian counts and high levels of motorized traffic can have high LPS, meaning that being on a local street does not necessarily result in lower LPS. Although pedestrian volumes may be lower on minor roads, narrow ROWs with lower effective widths can result in higher pedestrian densities, which have a greater effect on increasing pedestrian stress.
Another result that required analysis and interpretation was the opposite signs of pedestrian volume and pedestrian density (see Table 2). An interpretation of such a phenomenon is that both crowded and empty sidewalks can generate stress for walkers. Crowds are generally associated with unintentional interactions with other pedestrians, reducing one’s ability to walk freely ( 55 ), and generating feelings of submissiveness that imply avoidance responses because of the lack of control over one’s movements given the restricted space ( 12 ). Since sidewalks are physically limited spaces, higher pedestrian densities cause crowding, which, in turn, is positively related to stress ( 44 ). Example o in Figure 2 exemplifies how high pedestrian density is associated with high LPS. In contrast, an empty sidewalk can be related to fear of crime or accidents ( 56 ). As proposed by different authors, stress tends to diminish when a sense of trust within the neighborhood increases. This tends to happen by having other people present ( 42 , 43 ). Furthermore, the literature has shown that social contact satisfies a basic psychological need, thus increasing well-being ( 57 ), which implies that at least some pedestrian presence is needed to reduce negative affective responses and, probably, stress levels.
Discussion
The results of this study revealed that the friendliness of pedestrian infrastructure can be evaluated from different perspectives, including physiological and emotional responses such as stress. Apart from early research conducted by Mozer ( 16 ), since 1990, the literature has focused on “walkability” as the generic target to pursue to assess the pedestrian-friendliness of an urban area ( 5 ). However, walkability is a wide and open neologism commonly associated with urban conditions related to land use and density of both the population and destinations ( 3 , 58 ). Given the above definition, walkability incorporates urban characteristics that are hard to intercede (e.g., changing and mixing land uses requires substantial efforts in any city). Therefore, modifying the pedestrian-friendliness based on walkability indexes could be a complex and demanding task. On the other hand, results from this research showed that easily measurable and modifiable attributes, like the separation between cars and pedestrians (i.e., buffer), can be assessed to mitigate stress and increase sidewalks’ pedestrian-friendly measures regardless of the adjacent land uses.
Other SPIs that have been used to evaluate the service or performance of nonmotorized infrastructure include Mozer’s stress measure ( 16 ) , perceived QoS ( 47 ), LOS ( 59 , 60 ), and LTS ( 19 , 28 ). These SPIs are estimated using both infrastructure- and operation-related attributes that were assessed in this study. As the results showed that these sets of attributes were adequate to estimate mean stress on a sidewalk, it could be justifiable to say that different dependent variables hinge on the same group of attributes. For example, in relation to LOS, the literature shows that traffic volumes and speeds, conflicts, and surface conditions are relevant to the evaluation of this SPI ( 60 ). Likewise, the results showed that these attributes were relevant in explaining stress. The perceived QoS that was evaluated in a previous study was also explained by the surface condition and the buffer ( 47 ). In other studies assessing stress, speed appeared as a relevant factor ( 17 ), whereas others defined buffer, traffic volumes, and, again, speed as relevant to stress ( 16 ). In sum, the attributes that were proven to explain stress in this study are likely to be generalizable as pivotal characteristics in further SPI estimations. This generalization is key to evaluating nonmotorized infrastructure from multiple perspectives to enrich the understanding of the implications of promoting more efficient travel in cities.
As a sustainable means of moving in cities, walking is desirable for its personal and societal benefits. However, walking intention and actual walking behavior depends on several factors, from intentions and attitudes to planned behaviors ( 61 ). In any case, as presented in the literature, the sidewalk’s local environment and the street operation provide valuable information on how appealing streets are for people to walk on. Environmental psychology had proved that stressful environments are associated with negative emotional responses and thus with avoidance behaviors ( 11 ). Furthermore, the evidence supports the relationship between low commuting stress and positive attitudes toward the transportation mode and active traveling choice ( 8 , 39 ). The relationship between the proposed SPI (i.e., LPS) and the intention to walk, despite being theoretical, appears to be a relevant subject to discuss. In a recent study, it was suggested that there may be an association between good SPIs and subsequent behaviors related to the evaluated transportation modes ( 21 ). De Vos et al. also propose that positive SPIs, such as travel satisfaction, can influence attitudes toward travel modes, and subsequently influence the decision to choose modes ( 61 ). In this case, it would be expected that lower stressful sidewalks would be associated with a higher intention to walk. In other words, contexts where stress is mitigated could increase the attractiveness of walking.
From this perspective, low-stress, attractive infrastructure is key to changing behaviors. The results of this study revealed that a comprehensive approximation should consider both infrastructure- and operation-related characteristics to design low-stress sidewalks. Assessing stress mitigation on urban sidewalks should consider both sets of attributes (operation- and infrastructure-related). This consideration implies that investment in developing low-stress sidewalks should be guided by frameworks that optimize the cost-effectiveness relationship, where the results presented provide some clues in relation to the impact of different attributes on stress. As discussed earlier, infrastructure-related attributes primarily affect stress; therefore, in the case of the city studied, such attributes should be assessed first. However, to further increase their impact, it is essential to enhance understanding of pedestrians’ perceptions of the significant attributes included in this study, as proposed in the literature.
Conclusions
This research has identified a set of streetscape characteristics and features (physical infrastructure attributes and operational conditions) that relate to pedestrians’ perceived stress. Stressors and mitigators were found to interact with each other in tradeoffs that directly affected the perceived stress related to context stimuli. Thus, high perceived levels of stress are not necessarily associated with particular street typologies (e.g., main roads), rather, this perception involves a more complex process. This finding led us to propose that stress levels based solely on traffic volumes or speeds could be neglecting the effects of adequately designed infrastructure. These tradeoffs revealed that pedestrian LOSs were affected by different sources of stimuli and not just those related to the maximization of the travel utility (i.e., speeds and traffic and pedestrian volumes). Instead, interaction with others and the capability of moving away from noise and pollution mitigated stress, which shows that pedestrians want built environments to be comfortable spaces to walk in as well as to have transportation facilities.
Although this research provides an approach to estimate pedestrians’ perceived stress, and represents a step forward in enhancing pedestrian infrastructure design, the authors caution with regard to some limitations and considerations. In relation to replicability, this approach is limited, as it demands the gathering of data that may not be easy to automate (i.e., pedestrian volumes and specific physical attributes of sidewalks). Future studies in this respect could use traffic and speed data extracted from different sources (i.e., Waze and Google traffic application programming interface) to expand the area of analysis to more generalized models, as proposed for the LTS developed by Huertas et al. ( 18 ). Furthermore, the assessment of sidewalk condition was not thorough, in that some of the attributes considered could have been more specific to improve sidewalk characterization. For instance, auditing whether the infrastructure has potholes does not capture the range of characteristics that can provide more thorough diagnostics on sidewalk condition. This could be addressed by including other attributes such as surface level and material continuity.
It is suggested that this kind of study could be replicated in different cities across the world to provide new findings on how low-stress environments can promote walking in other parts of the world. Further research on SPIs could focus on creating multiobjective models that can assess the different facets of pedestrian and bicyclist infrastructure evaluation. Finally, forthcoming studies assessing pedestrian stress levels could evaluate the integration of both physical measurable attributes and users’ perceptions of their surroundings (e.g., their perception of safety), in an individual SPI.
Footnotes
Acknowledgements
The authors are grateful for the support received by the Vice-Presidency of Research and Creation at Universidad de los Andes and for other internal research resources from Universidad de los Andes and the Urban and Regional Sustainability (SUR) Research Center. The authors are grateful to the data collection team for helping with the data collection process. We thank Tiziana Laudato for proofreading this paper.
Author Contributions
The authors confirm contribution to the paper as follows: study conception and design: A. Rodriguez-Valencia; data collection: J. A. Vallejo-Borda; analysis and interpretation of results: A. Rodriguez-Valencia, H. A. Ortiz-Ramirez, W. Simancas, J. A. Vallejo-Borda; draft manuscript preparation: A. Rodriguez-Valencia, J. A. Vallejo-Borda, H. A. Ortiz-Ramirez, A. Rodriguez-Valencia, W. Simancas, J. A. Vallejo-Borda. All authors reviewed the results and approved the final version of the manuscript.
Declaration of Conflicting Interests
The authors declared no potential conflicts of interest with respect to the research, authorship, and/or publication of this article.
Funding
The authors disclosed receipt of the following financial support for the research, authorship, and/or publication of this article: The support received by the Vice-Presidency of Research and Creation at Universidad de los Andes for financing the doctoral research of H. A. O-R. In addition, other internal research resources from Universidad de los Andes and the Urban and Regional Sustainability (SUR) Research Center were necessary to make this research possible.
