




Abstract
The steady growth of online shopping in the last decades has led to an impact on personal travel and on freight transport that is yet to be fully grasped. Previous research on the subject offers mixed findings, with several studies pointing to complementarity between online and in-store shopping, while others suggest substitution, modification, or neutrality. Using data from a 7-day shopping survey in Lisbon, Portugal, which involved 400 respondents, this paper applies structural equation modeling to explore the relationships among online shopping and in-store shopping preferences, while also considering the period of the week in which the purchases took place, since it is expected that the interaction between shopping and other personal travel behavior varies between weekdays and weekends. The result shows that online shopping preference leads to more online purchases, while in-store shopping preference leads to more in-store purchases. Furthermore, online shopping on weekdays has a positive association with both online and in-store shopping on weekends, which supports a complementarity effect. This effect is linked to a younger population, which commutes by car, and lives in less central areas. Since deliveries are becoming increasingly faster, while living centrally is becoming progressively more difficult, complementarity might give way to substitution, with the foreseeable challenges to maintaining street vitality, if this issue is not addressed timely by policymakers.
Since the 1990s, progress in information and communication technologies (ICT) has made way for a permanent revolution in relation to doing business: e-commerce ( 1 ). Online shopping has been growing steadily over the last years, with the Asia-Pacific region leading the global e-commerce worldwide growth change in 2019 ( 2 ). Even if sales in Europe and the U.S. “cool off,” Latin America and the Middle East/Africa are expected to experience above average growth rates in the coming years, as is usual when online shopping is establishing itself in new markets ( 2 ). In 2019, 14.1% of the total retail worldwide sales came from online purchases, amounting to 3.53 trillion U.S. dollars ( 3 , 4 ). Online shopping demonstrates the potential to replace in-store shopping, and has therefore been the subject of extensive research in urban planning and transportation studies, especially considering its increasingly significant impact on personal travel and freight transport ( 1 , 5 – 8 ).
Results from previous research indicate four types of probable impacts on personal travel originating from e-commerce dissemination: substitution (replacing trips with online purchases), complementarity (generating more trips), modification (changes in trip chaining and scheduling), and neutrality (no apparent effect on physical shopping) ( 9 – 11 ).
The COVID-19 pandemic tipped the balance toward substitution of in-store shopping, since the “stay at home” necessity blurred the work-life boundaries, forcing the implementation of behaviors that were already detectable before, but to a much higher extent ( 12 ). In a very short amount of time, working from home, preferring on-demand streaming services to attending a movie session, and choosing home deliveries instead of in-store shopping or going to a restaurant became common behaviors ( 12 – 14 ). Although a large part of these changes is expected to revert to the before-COVID situation, some habits are bound to remain, thus enhancing the role of online shopping ( 15 ).
Considering that shopping-related activities are responsible for a significant percentage of household trips—approximately 20% in the Lisbon Metropolitan Area, a value similar to the one found in the U.S. National Household Travel Survey—but also that, in some cities, the most sought-after retail real estate properties are already locating away from the center, to locations where rents are cheaper, but yet still close enough for rapid deliveries, identifying the impact of the four aforementioned phenomena is crucial for policymaking, since their impacts on travel demand, but also on street vitality, are significantly different ( 16 – 18 ).
Therefore, this paper contributes to the research on these phenomena by using data from a 7-day shopping survey to better understand the relationships between online and in-store shopping and other personal travel behavior. It aims to explore the differences between weekdays and weekends, which is relevant considering that most people still have a very restricted time budget for workdays, which affects shopping and personal travel. Having access to a 7-day survey is also relevant, since it makes it possible to address intrapersonal variability: on different days, the same individual does not always perform the same activities ( 19 ). The survey addresses in-store and online purchasing, but not online browsing/searching for goods. Within purchasing, only retail purchases are included in the survey, along with purchases made at restaurants, cafes, and bars.
For this effect, structural equation modeling (SEM) is used to address the interactions between online and in-store shopping preferences, while at the same time considering weekday and weekend shopping purchases, since it is expected that these relationships might vary in different periods of the week. It is acknowledged that these relationships are valid in the specific context of a country where online shopping has been popular for several years, and that the relationships might be different considering different types of goods.
This analysis is especially relevant at this point, since the data was collected immediately before the outbreak of the COVID-19 pandemic, thus allowing for future comparisons of immediately pre- and post-pandemic scenarios.
The paper is organized as follows: a brief literature review is presented in the next section, followed by a description of the data and methodology. After that, SEM is implemented, and the model results are discussed. The paper finishes with the conclusions and guidelines for further research.
Literature Review
A brief review of the existing literature shows four types of personal travel impacts originating from e-commerce dissemination: substitution, complementarity, modification, and neutrality. Although many studies support substitution, some have shown that complementarity is a more likely phenomenon ( 10 , 20 – 22 ).
Specifically considering data from a survey and using SEM, the analysis of Ferrell in 2005 has since become a classic reference, and is often quoted in research made considering this subject matter and method ( 23 ). Ferrell uses SEM to analyze home shopping, using data from the San Francisco Bay Area Travel Survey 2000. It mostly includes teleshopping, but also some online shopping. The conclusions are concurrent with a substitution effect. This is contrary to Ferrell’s previous work which supported complementarity ( 24 ). The difference is found in the unit of analysis: complementarity was supported considering the household as a unit; substitution is found considering individual disaggregate data as units, and therefore that women, in general, teleshop more than men. This is attributed to time-starvation and suggests that the unit of analysis, and home shopping responsibility, are very relevant when devising a study of this nature.
Shortly after these works, Farag et al. ( 25 ) are already dealing specifically with online shopping data from Utrecht, The Netherlands, in 2007 ( 25 ). Farag et al. implement a 2-day travel diary, which includes socio-demographic and land-use characteristics, and shopping attitudes. Using SEM, they find both complementarity and substitution effects: online searching leads to in-store shopping, which in turn positively influences buying online. Using an adapted version of this framework, in the Twin Cities, U.S., Cao et al. find support for a complementarity effect from online searching on both online and in-store shopping, and from online shopping on in-store shopping, with a similar result (considering the same framework) being found in Nanjing, China ( 26 , 27 ).
Using data from the U.S.’s National Household Travel Survey (NHTS) and SEM, and building on the previous researchers’ conclusions, Zhou and Wang also found a complementarity effect from online shopping to in-store shopping ( 28 ). Additionally, they conclude that in-store shopping leads to less online shopping: as it appears, “the in-store shopping experience suppresses the desire of online shopping” ( 28 ).
Ding and Lu used GPS data from a 7-day activity travel survey and SEM to model the effects of online shopping and in-store shopping on personal activity travel behavior, such as trip chaining or leisure activities, finding a complementarity effect, but also that online shoppers tend to shop in-store on weekends rather than on weekdays ( 29 ).
Lee at al. mention that “some researchers have used structural equation modeling (SEM) to investigate bi-directional interactions between online and in-store shopping” and refer to some of the authors that have been addressed in this review, but instead use an ordered response model to address the issue of online and in-store shopping frequency in Davis, California, U.S. ( 30 ). The conclusion is, nevertheless, that there too, online shopping has a complementary relationship with in-store shopping frequency.
More recently, Shi et al. analyzed a sample of 710 respondents in Chengdu, China, using a binomial logistic regression ( 31 ). This analysis, though, arrived at a different conclusion: that e-shopping has a substitution effect on the frequency of shopping trips. Since this study is very recent (2019), it may be one of the first demonstrating a shift from a complementarity to a substitution effect of online shopping. This conclusion cannot be generalized because of two factors. The first is that e-commerce is not growing at the same pace in every region of the globe. Research from 2020, conducted in Shiraz, Iran, by Etminani-Ghasrodashti and Hamidi, reveals that, for now, online shopping has a complementarity effect on in-store shopping ( 32 ). But they notice that “the proportion of online shopping among the study population is remarkable despite the barriers to access popular online applications in Iran.” This suggests that online shopping is likely to become even more popular as the study population becomes older and responsible for household shopping. The second factor is that not all goods are alike. Other authors have been exploring the influence of online shopping on in-store shopping considering specific goods and spatial attributes. Some examples are Zhen et al., who developed trivariate probit models to explore the influence of spatial attributes on shopping channel choices for different search goods (books) and experience goods (clothing) in Nanjing ( 33 ) (a definition of search and experience goods can be found in Nelson: experience goods are those in which “it will pay the consumer to evaluate by purchase rather than by search,” while search goods will almost always demand a pre-purchase gathering of information about price and quality of the goods [ 34 ]). The conclusion is that travel time to stores is positively associated with online shopping for search goods, but not for experience goods. A similar conclusion is found by Schimd and Axhausen, who, using an integrated choice and latent variable (ICLV) model in Zurich, Switzerland, concluded that experience goods are preferably purchased in-store (in this case, considering standard electronic appliances as search goods, and groceries as experience goods) ( 35 ).
A comprehensive review of many of these studies points to the lack of a common conceptual framework, thus questioning the pertinence of direct comparison between results: differences in sampling, or even in the definition of key concepts like e-shopping or e-shopper, might account for apparently contradictory results ( 36 ). Other perceived issues are product differentiation, holding a driving license, and having access to a car; education and experience in using the internet and the characteristics of the service; and household shopping responsibility ( 5 , 37 – 39 ). Finally, a positive attitude toward online shopping leads to more online shopping, while the pleasure related with in-store shopping leads to less online shopping ( 21 , 35 , 40 ). These attitudes may also influence significantly the conclusions about shopping behavior.
A possible conclusion about the studies to date could be that the use of ICT progressively enables a hybrid shopping process ( 41 ). In that case, using SEM is advantageous, since it makes it possible to explore the bidirectional relationships between online and in-store shopping. It also makes it possible to analyze the relationship between shopping behavior and other personal travel behavior.
Methodology
Research Hypothesis
The research hypothesis is built on the findings mentioned in literature: that a positive attitude toward online shopping might lead to more online shopping, with the same being applicable to in-store shopping. These attitudes were addressed in a shopping survey and will enter the model as latent constructs: online shopping preference and in-store shopping preference. Using SEM makes it possible to explore the interrelationships between these preferences, but also how they transform into actual behavior (i.e., if a positive attitude toward online shopping effectively translates into more online purchases, and a positive attitude toward in-store shopping into more in-store purchases). Since it is expected that shopping behavior is related to other travel behavior dimensions, and these relationships might present significant differences on weekdays and on weekends, online and in-store purchases also enter the model as endogenous variables, considering the period of the week in which they took place. Based on the reviewed literature, it is expected that socio-demographic variables, along with internet experience, mobility, and shopping opportunities, may also present an impact on these relationships, therefore entering the model as exogenous variables. The conceptual model, which considers the possible relationships between weekday and weekend shopping as well as between shopping behavior and shopping preferences, is presented in Figure 1 and will be tested using an SEM model.
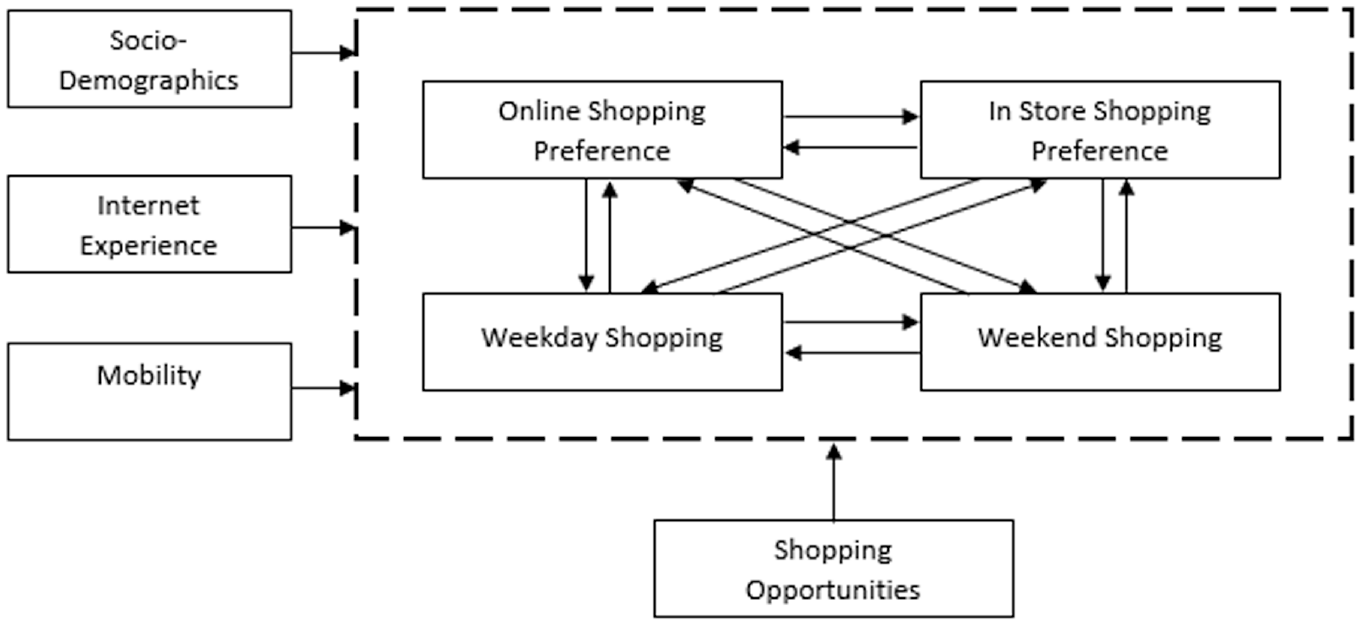
Conceptual model.
Case Study and Data
The data used here comes from a 7-day shopping survey, conducted between January and February 2020 in the city of Lisbon. The municipality of Lisbon lies at the core of the Lisbon Metropolitan Area, with its boundaries being coincident with those of the city of Lisbon. The city is the capital and political center of Portugal, with a population of 506,654 inhabitants in 2018 ( 42 ).
Figure 2 presents a possible scheme of the commercial structure of the city. The kernel density estimation (KDE) method was used to generate density surfaces—a method that has been frequently used to “smooth” data for visualization ( 43 , 44 ). In this case, it allows easy identification of different areas according to the concentration of retail, restaurants, cafes, and bars. The density surface refers only to the high-street, which would be harder to present otherwise. Shopping malls are presented as points, divided into two categories: those with a leasable area less than 15,000 m2, and those with a larger area. The latter are, in general, more recent, while also containing one or several anchors (food court, supermarket, cinema) that are able to attract a very significant number of buyers. They are identified within the municipality, and in its immediate vicinity, since some respondents also referred to these as shopping destinations (there are other shopping malls, and big box retail in general, around Lisbon, but at a longer distance and attracting fewer people, or no one, from the sample). It may be worth mentioning that in the 2011 census, the average area of a census block was 22,500 m2, meaning that a density of 100 establishments per km2 corresponds to 2.25 establishments per block, which is what one can expect from an essentially residential area with just some local commerce (one or two cafes, maybe a grocery shop), while 1,000 establishments per km2 corresponds to a density which is mostly surpassed at “Baixa” and its surroundings—the historic central business district (CBD) of Lisbon ( 45 ).
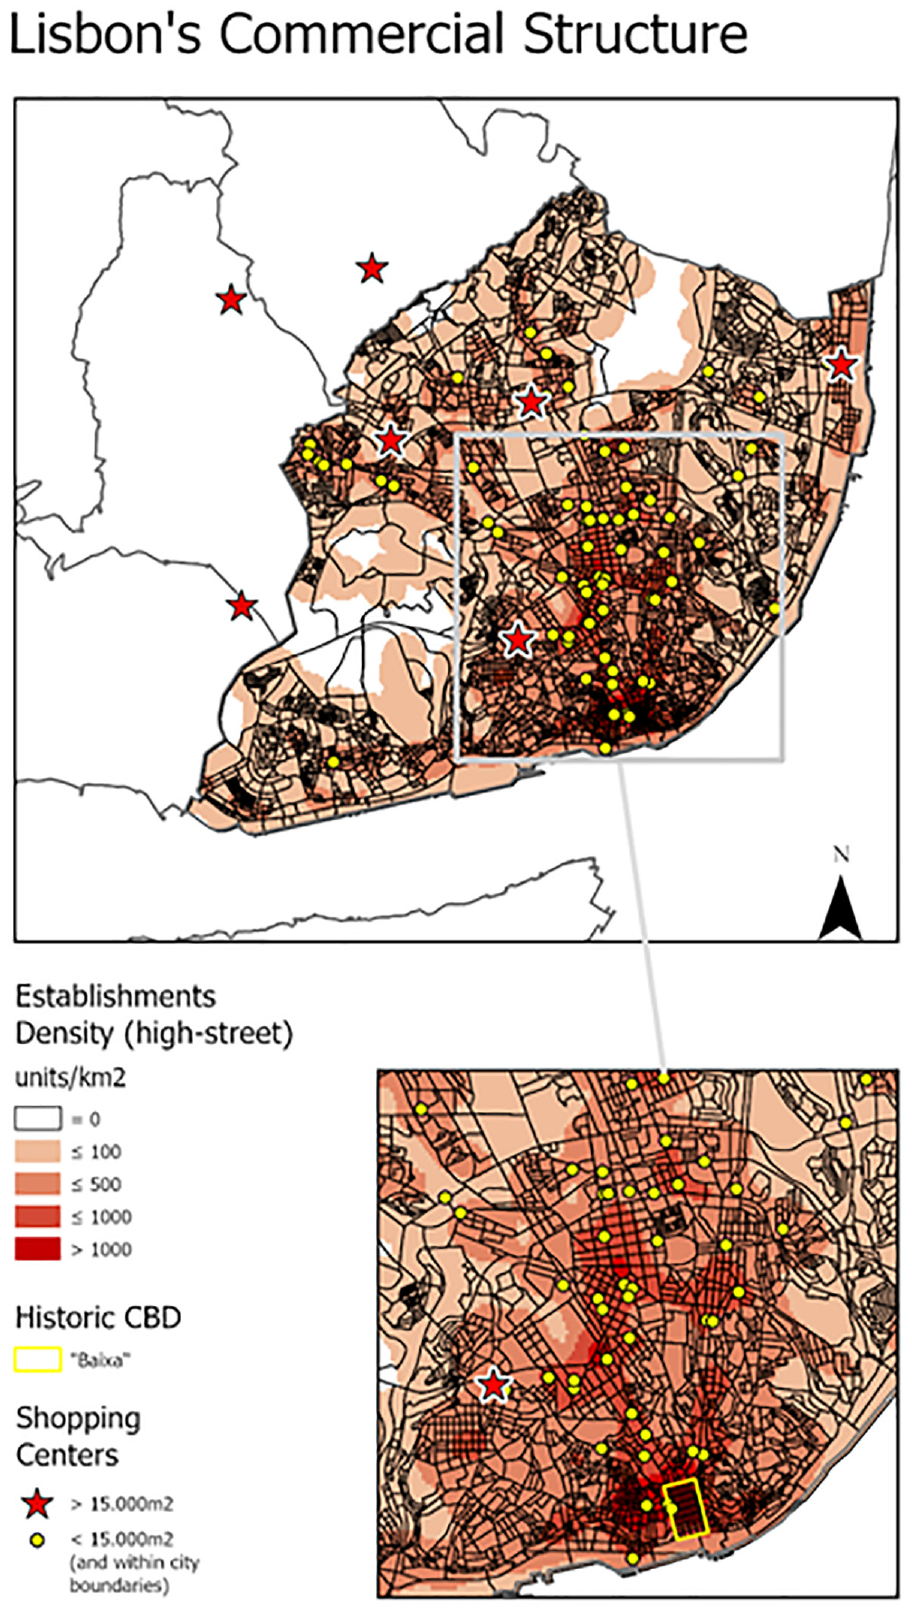
Lisbon’s commercial structure.
The survey was divided into three parts, characterizing: the respondent (gender, age, education, income level, household type shopping responsibility, car ownership, and other factors that influence shopping behavior); weekly shopping patterns (shopping frequency and type of acquired products, online or in-store purchase) and shopping trips (travel mode, scheduling, trip chaining, and other characteristics of the shopping trip); and attitudinal aspects related to in-store and online shopping, using Likert-scale questions.
The survey addressed purchases made in the previous week, considering the need to span a period where different types of shopping activities had occurred within the same household. Every purchase was registered considering the nature of the purchased items: retail items (divided into several subcategories, like groceries and household items, or clothing items, among several others) and restaurants, cafes, and bars. Every change of item or location corresponded to a different purchase.
The survey was implemented to an opinion panel, controlling the sample design for gender and age, to match the Lisbon census of 2011 ( 45 ). A pre-recruitment email was sent to a panel of 2,043 respondents, containing a detailed explanation of the project. At total of 1,648 respondents demonstrated their willingness to participate. In the end, it was possible to obtain 400 valid answers, considering both the completeness of the answers and the sample design.
The age of the respondents ranges from 18 to 70 years old, and the sample is thus representative of the population, considering age and gender, but presenting a higher degree of highly educated people: 75.5% of the sample possesses a bachelor’s degree, while in the census this group represents only 44.3% of the total. Since education is a determinant in online shopping, some bias toward online shopping may be expected in the results. Considering also that 95.3% of the respondents indicated they had full or shared household shopping responsibility, this may also bias the results toward more shopping, in general. Table 1 presents the descriptive statistics of the variables. Table 1 presents the definitions and descriptive statistics of the variables obtained from the survey, here used to characterize the sample.
Definitions and Descriptive Statistics of the Variables

Methodology
The modeling method used is SEM. SEM is a combination of two types of statistical methods: factor analysis and simultaneous equations models ( 46 ). SEM is nowadays very popular as a modeling method because of its ability to estimate several endogenous variables simultaneously and also to include latent variables. In this way, it is particularly suited to modeling indirect and non-recursive relationships (in which there are feedback loops). As mentioned before, it is also a modeling technique used frequently in studies about shopping behavior ( 25 – 29 ). Specific estimation methods in SEM allow for the use of discrete variables (e.g., number of shopping trips). One of them is weighted least squares (WLS), which was developed specifically to deal with discrete and censored variables, but WLS has strict assumptions about sample size, which must be, usually, 1,000 observations at least ( 47 , 48 ).
Since the sample size used here contains 400 observations, a relatively new estimation method, Bayesian estimation is used ( 49 ). It is implemented in the AMOS 26™ software ( 50 ). The Bayesian estimation method uses a prior distribution, which is combined with the observed data, using the Bayes theorem formula to estimate an updated version for the model parameters, called a posterior distribution ( 50 ). This distribution reflects a combination of both the initial belief (given by the prior distribution) and the empirical evidence ( 51 ). This is done using Markov chain Monte Carlo (MCMC) simulation techniques ( 50 ). The prior distribution used here is based on a previous maximum likelihood (ML) estimation (the estimation results are available on request). The priors can only have a relevant effect on the model coefficients when the sample size is very small or the model specification is patently contradicted by the data ( 50 ). In the MCMC implemented in AMOS the first samples are discarded (burn-in) to allow the simulation to converge to the true posterior distribution; by increasing this number, the dependence from the ML prior distribution is reduced (the default value for burn-in samples in AMOS is 500, here 1,500 is used).
The simulation stops when the model achieves stability in the estimated parameters. In AMOS this is assessed by a convergence statistic (CS) which, by default should be smaller than 1.002 ( 49 , 50 ).
The model in this study contains both a measurement submodel and a structural submodel. It could be described by the following set of equations, where Equation 1 represents the structural submodel and Equation 2 the measurement submodel:


where
η is a vector (6 × 1) of latent endogenous variables,
B is a matrix (6 × 6) of coefficients of η variables,
Γ is a matrix (6 × 6) of coefficients of exogenous variables,
x is a vector (6 × 1) of observed exogenous variables,
ζ is a vector (6 × 1) of errors from structural relation,
y is a vector (6 × 1) of observed endogenous variables,
Λy is a matrix (6 × 6) of regression coefficients of y on η, and
ε is a vector (6 × 1) of measurement and errors on y.
The model outputs include the average value of the posterior (posterior mean) distribution, the posterior standard deviation, which is similar to the conventional standard error, and confidence intervals ( 49 , 50 ). Actually, what is calculated is not exactly a confidence interval but a Bayesian credible interval, which has better properties than the conventional confidence interval if the posterior distribution is not normal ( 50 ).
Results
The model fit indicators include the predictive posterior p (ppp), the deviance information criteria (DIC), and the effective number of parameters. The posterior predictive p-value (ppp) is a Bayesian counterpart to the classic p-value, and since it uses posterior predictive replications of the data, it is able to measure directly the discrepancy between the sample and the population quantities ( 52 ). Lee and Song argue that if the ppp is close to 0 or 1, then the null hypothesis, stating that the model is plausible, should be rejected ( 53 ). Cain and Zhang recommend values between 0.10 or 0.15 as cutoff values for the ppp, depending on the model and sample characteristics ( 54 ). The Deviance Information Criterion (DIC) is an indicator used to compare competing models and can be viewed as a Bayesian equivalent or analogy of Akaike Information Criterion (AIC) ( 55 ). Differences smaller than 3 in the DIC values between competing models should not be used for drawing conclusions about which is the better model ( 55 ). The effective number of parameters can be considered as the number of unconstrained parameters in the model, and represents the decrease in variance expected from the model estimation ( 56 ).
In the presented model, ppp is equal to 0.18, DIC is equal to 233.64, and the effective number of parameters is 60.49, suggesting the model has an acceptable fit. Because the Normed Fit Index (NFI), the Comparative Fit Index (CFI), and the Non-Normed Fit Index (NNFI), which were obtained through the previous ML estimation of the model, are not affected by the non-normality of the data they could also be relied on to assess the model fit ( 57 ). NFI is 0.887, CFI is 0.976, and NNFI is 0.968, indicating a good fit.
Table 2 presents the measurement submodel results for: in-store shopping preference (InStorePref), which is a latent construct of the attitudinal variables Q2, Q3, and Q4, that reveal a positive attitude toward in-store shopping; and online shopping preference (OnlinePref), which is a latent construct of the attitudinal variables Q9, Q10, and Q11, that reveal a positive attitude toward online shopping. All the other attitudinal variables included in the survey were excluded from the latent variables since they decreased the fit of both the preliminary exploratory factor analysis and the measurement submodel.
Measurement Equations for the Latent Constructs InStorePref and OnlinePref
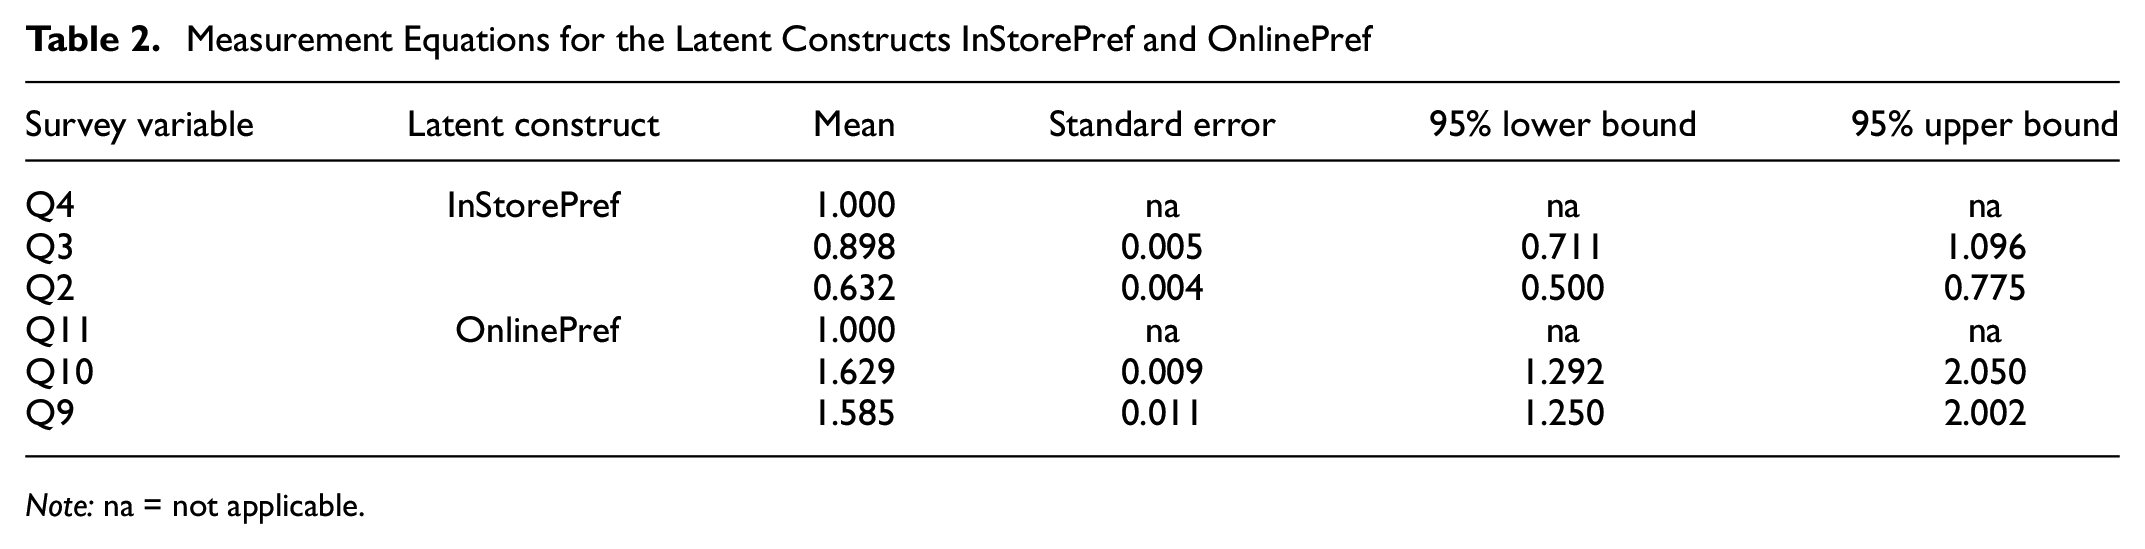
Note: na = not applicable.
Because the conceptual model presented in Figure 1 considers the possibility of bidirectional relationships between the different endogenous variables, six non-recursive specifications are built to compare them with the adopted model. Each one of these specifications considers, separately, bidirectional relationships between pairs of endogenous variables. One of these model specifications was non-identifiable. It is also important to note that the model OnlineWeekday<->InStoreWeekend is the only one of the non-recursive models for which it was possible to attain the default CS values, indicating that the other specifications are more unstable. The non-recursive specifications are compared with the adopted model using the Bayesian, and, also, the ML fit indexes. Additionally, the coefficients significance level is also used.
Table 3 presents the comparisons between the different models. The ppp, the AIC and the Expected Cross-Validation Index (ECVI) of the adopted recursive model indicate that it is a superior model to the non-recursive specifications. Also, the coefficients of the non-recursive specifications tend to be non-significant at 90% confidence level. The only exception is the model InStoreWeekday<->InStoreWeekend, for which all the coefficients, including the covariance between error terms, are significant. The DIC in this model is smaller than the one for the adopted model, but this difference, smaller than 3, does not make it possible to draw conclusions about which model is better. Nevertheless, both the ppp and the ECVI indicate that the recursive model is better.
Comparison between the Adopted Recursive Model and Non-Recursive Specifications

Note: AIC = Akaike Information Criterion; DIC = Deviance Information Criterion; ECVI = Expected Cross-Validation Index; ML = maximum likelihood; ppp = posterior predictive p-value.
Coefficients significantly different from zero with a 90% confidence level.
Table 4 presents the standardized direct effects of one variable on another, as well as the total effects (the sum of the direct and indirect effects). The confidence intervals were estimated according to the abovementioned methodology.
Direct and Total Effects for the Adopted Model (Standardized)

Note: na = not applicable.
Coefficients significantly different from zero with a 95% confidence level.
Coefficients significantly different from zero with a 90% confidence level.
As can be noticed, some of the variables presented in Table 1 are not present in the final model. This is because improving model fit implied excluding some of the exogenous variables. The appropriateness of this decision is discussed by Ory and Mokhtarian, who debate that, while some scholars find that when a model does not fit the data, parameter estimates “are potentially bogus,” others emphasize that the exclusion of relevant variables “constitutes an omitted-variables bias” ( 58 ). Since more fully specified single-equation models have already been studied exhaustively, Ory and Mokhtarian opted for parsimony and focused on relationships among key variables. The same decision was taken by Cao et al. for similar reasons ( 26 ). In the present study, it is found that the argument may also be considered valid in the model, and therefore the choice is made to focus on the relationships between the key significant exogenous and endogenous variables. In this case, age, education, income, internet use, shopping opportunities, and car use entered the final model as exogenous variables, while the latent constructs in-store shopping preference (InStorePref) and online shopping preference (OnlinePref) entered the model as endogenous variables, along with those related with weekday and weekend shopping purchases.
Discussion
The analysis of the results shows that in-store shopping preference (InStorePref) is significantly related to age (positively) and education (negatively), although with a smaller magnitude. A straightforward interpretation is that older people, and especially those with a lower degree of education, prefer to shop in-store. This is also consistent with the effects found for online shopping preference (OnlinePref): negative with age and positive with education (though indirect and not significant pertaining to the latter), which is also in accordance with the literature, as is the positive, direct, and significant effect of internet use on online shopping preferences. The effect of car use is not as straightforward: commuting by car has a negative and direct effect on in-store shopping preference, and a positive and direct effect on online shopping preference. Both are significant at the 95% confidence level. This can eventually be explained by analyzing InStoreWeekday and InStoreWeekend: age has a direct and significant effect on both variables, but, more importantly, income has a direct and significant negative effect on InStoreWeekday. Since car use also displays a significant and negative direct effect on that variable, while shopping opportunities present a direct, positive, and significant effect, a possible conclusion is that a preference for shopping in-store translates into a purchase, especially on weekdays (positive effect of InStorePref on InStoreWeekday); those purchases, in turn, are made by people that are older, with smaller incomes, and living in areas where more shopping opportunities exist; since they are not car dependent (negative effect of car use on both InStorePref on InStoreWeekday), all these suggest shoppers living in more central areas.
As for online shopping purchases, the preference to shop online (OnlinePref) has a direct, positive, and significant effect on the total number of online purchases on weekdays (OnlineWeekday) which, in turn, has a direct, positive and significant effect on the number of online purchases on weekends (OnlineWeekend). At this point, it is perhaps relevant to notice that, while using a framework similar to other authors, online searching was not considered, which other authors found to have a complementarity effect on both online and in-store shopping ( 25 – 27 ). But if internet use is used as a proxy for that (the more time spent online, the more likely it is for someone to engage in some type of online searching), then the positive effect of internet use on online shopping preference—and the direct and positive effect of that on online shopping on weekdays, and of that on both online and in-store shopping on weekends—might be a consequence of internet use, and online searching. Figure 3 presents the empirical relationships among endogenous variables, which make it possible to better visualize the relationships among the endogenous variables.
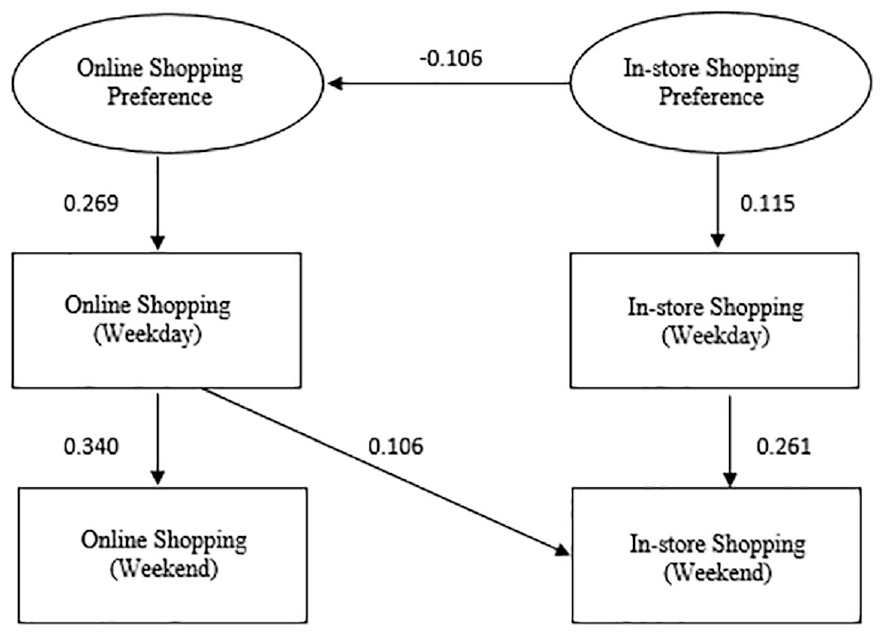
Empirical relationships among endogenous variables (standardized direct effects).
The interactions shown in Figure 3 reveal that an in-store shopping preference leads to more in-store shopping, both on weekdays and weekends. Since there is a negative effect of in-store shopping preference on online shopping preference, and considering the discussion about the role of the exogenous variables and what they represent, a possible conclusion is that in the sample, two distinct groups can be found: an older group, with a smaller income, that prefers shopping in-store and has the opportunity to do so, suggesting they are located in more central areas; and a second group, which is younger, uses a car to commute (not living as centrally), and displays a preference toward online shopping. This group also spends more time online, which leads to more online purchases during the week, which in turn leads to both online and in-store purchases during the weekend (eventually suggesting that, during the week, and since they are younger, they may have a tighter time budget because of other chores, and especially considering their not so central location). The effect found is thus of complementarity between online and in-store shopping, but considering that the period of the week plays a key role in this relationship: online shopping on weekdays leads to in-store shopping on weekends.
Conclusion
On this paper, SEM was applied to investigate the interactions between online and in-store shopping preferences and purchases, considering weekends and weekdays, since different personal travel behavior that occurs in those two different periods was expected to interfere with shopping behavior. It was found that, as expected, a positive attitude toward online shopping leads to more online purchases. The same can be stated about in-store preference and in-store purchases. Online shopping on weekdays leading to more online shopping on weekends, both online and in-store, has been noticed before ( 29 ). The conclusions not only support those findings, but also the need to further explore the interactions between shopping behavior and other travel behavior, since it was noticed that in-store shopping preference can be related to an older, more centrally located group, and online shopping preference to a younger, internet-using, and more “car dependent” group. This second group shops online on weekdays, with that leading to in-store shopping on weekends, which shows a complementarity effect, but constrained to weekends. The reasons behind this might be plentiful, including a tight time budget during the week. It must be considered, though, that the survey took place within the boundaries of Lisbon’s municipality, which is, in general, very central when compared with the rest of the Metropolitan Area of Lisbon (considering shopping opportunities, transportation, and other centrality indicators). If tourism-led gentrification further dislodges older residents from the center, and if younger residents are not able to move in, cannot this complementarity eventually lead to substitution? And, while part of the behavior because of the current COVID pandemic might revert to the before-COVID scenario, same day delivery (SDD) online shopping has already been noticed to have a higher potential to replace in-store shopping than regular online shopping ( 8 ). The pandemic might thus tip the balance toward substitution of in-store shopping. The current pressure to limit car access to city centers might also add to this effect. Ultimately, if in-store retail remains in the center, but substitution and car induced shopping to the periphery occurs, this will lead to a foreseeable problem in trying to maintain street vitality at the center. Other authors have focused on the subject of maintaining street vitality while implementing pedestrianization schemes, finding that, though these measures promote safety and liveability (a more intense use of the public space), they also enhance commercial gentrification ( 59 ). And, even by implementing one or other version of town center revival measures (town centre management structures or others) in historical centers like the one of Toledo, Spain, depopulation and substitution of residents by tourists has become a serious problem, with the center at risk of becoming a “cathedral of consumption” if short time rental is not controlled ( 60 , 61 ). Commercial- and tourism-led gentrification has long become a concern, but a solution for controlling car access, promoting commercial diversity and fighting tourism-led gentrification, might ultimately be found by actively implementing rent-controlled housing and other housing solutions that can allow for the younger population to live in the center ( 62 ). In Lisbon, the City Council has been presenting a series of measures to tackle this issue, and, therefore, further research will consider them ( 63 ). Special focus will be given to obtaining longitudinal data to understand retail location patterns, and the shoppers’ location patterns, thus allowing understanding of the way online shopping is affecting the relationships between bricks-and-mortar shops and consumers’ locations. This analysis will also help to evaluate the possible impacts of the housing policies being implemented (will they have the potential to, indeed, alter the consumers’ pool of bricks-and-mortar shops?), thus supporting policymaking.
Footnotes
Acknowledgements
The authors would like to thank the three anonymous reviewers who significantly contributed to improving this work.
Author Contributions
The authors confirm their contribution to the paper as follows: study conception and design: R. Colaço, J. de Abreu e Silva; data collection: R. Colaço; analysis and interpretation of results: R. Colaço, J. de Abreu e Silva; draft manuscript preparation: R. Colaço, J. de Abreu e Silva. All authors reviewed the results and approved the final version of the manuscript.
Declaration of Conflicting Interests
The author(s) declared no potential conflicts of interest with respect to the research, authorship, and/or publication of this article.
Funding
The author(s) disclosed receipt of the following financial support for the research, authorship, and/or publication of this article: the authors would like to acknowledge Fundação para a Ciência e a Tecnologia (FCT) for Rui Colaço’s PhD grant SFRH/BD/136003/2018.