



Abstract
The objectives of this study were to assess the in-service safety performance of roadside culverts and evaluate the potential impacts of installing various safety treatments to mitigate the severity of culvert-involved crashes. Such crashes were identified using standard fields on police crash report forms, as well as through a review of pertinent keywords from the narrative section of these forms. These crashes were then linked to the nearest cross-drainage culvert, which was associated with the nearest road segment. A negative binomial regression model was then estimated to discern how the risk of culvert-involved crashes varied as a function of annual average daily traffic, speed limit, number of travel lanes, and culvert size and offset. The second stage of the analysis involved the use of the Roadside Safety Analysis Program to estimate the expected crash costs associated with various design contexts. A series of scenarios were evaluated, culminating in guidance as to the most cost-effective treatments for different combinations of roadway geometric and traffic characteristics. The results of this study provide an empirical model that can be used to predict the risk of culvert-involved crashes under various scenarios. The findings also suggest that the installation of safety grates on culvert openings provides a promising alternative for most of the cases where the culvert is located within the clear zone. In general, a guardrail is recommended when adverse conditions are present or when other treatments are not feasible at a specific location.
Each year, nearly 40,000 fatalities occur throughout the United States as a result of traffic crashes ( 1 ). Approximately one-third of all fatalities result from run-off-road (ROR) crashes, which are a particular concern on high-speed roadways. Roughly 18 percent of fatal ROR crashes involve a collision with a culvert or roadside ditch based on data from the National Highway Traffic Safety Administration (NHTSA) Fatality Analysis Reporting System (FARS) ( 1 ).
Culverts are installed to allow water to flow along, or under, a road or railroad. As culverts are generally installed within the clear zone, the American Association of State Highway and Transportation Officials (AASHTO) Roadside Design Guide (RDG) indicates that cross-drainage structures or transverse culverts may create a hazard to motorists who run off the roadway ( 2 ). To prevent vehicles from striking a crossing culvert, the RDG provides several potential safety treatments, which include: redesigning using a traversable slope; extending the culvert outside of the clear zone, allowing vehicles to stop safely or regain control; or shielding the culvert by installing devices such as guardrails or safety grates on the culvert face ( 2 ). Beyond these alternatives, additional measures include eliminating, relocating, or delineating the structure.
However, the RDG and other existing guidance documents do not specifically indicate the circumstances under which specific safety treatments are most appropriate. The choice of safety treatments depends on several factors, including traffic conditions, cross-sectional characteristics of the roadway and roadside, and design elements of the culvert. There is significant variability in these characteristics from site to site and the variables that are most influential in design practice include the traffic volume, number of lanes, lane and shoulder width, speed limit, culvert size, culvert type, and culvert offset among others ( 3 ).
To date, there has been limited research and guidance as to the selection of appropriate safety treatments for crossing culverts (3, 4). Consequently, this study examines the safety impacts associated with culvert-involved crashes, in addition to examining the impacts of three types of safety treatments (culvert extensions, guardrail installation, and safety grate installation). As a part of this study, data were collected for all culvert-related crashes that occurred between 2007 and 2017 on the primary road network maintained by the Iowa Department of Transportation (DOT). Subsequently, the Roadside Safety Analysis Program (RSAP) was used to analyze the performance of the aforementioned design alternatives.
Beyond this introduction, the remainder of this paper consists of five sections: the second section provides a summary of the state-of-the-art and state-of-the-practice, the third section details the data that were utilized in this study, the fourth section describes the methods used as a part of the safety analysis, the fifth section presents the results from these analyses along with an accompanying discussion, and the last section summarizes key findings and conclusions.
Review of State-of-the-Art and -Practice
Roadside crossing culverts have been shown to have an impact on the level of injury sustained by crash-involved vehicle occupants. From a design perspective, there are various alternatives to prevent vehicles from being involved in these types of collisions or to mitigate the severity when such crashes do occur. Prior research has examined the cost-effectiveness of different treatments under various scenarios. A prior Iowa study found that culvert extensions and the installation of gratings yielded the lowest crash costs ( 3 ). Similar findings were shown from a Texas study, which recommended that the end terminals for all culvert types within the clear zone are designed to match existing slopes ( 4 ). Ultimately, the selection of an appropriate treatment is dependent on a series of site-specific factors, such as culvert characteristics, roadway geometry, and traffic volume.
For traversable slopes, it is suggested that the crossing culvert should be extended or shortened in order for the inlet and outlet of the culvert to match with the foreslope ( 5 ). Matching the inlet and outlet of a culvert to the foreslope of an embankment is desirable since it will reduce the target area of the openings for ROR vehicles to hit. However, for non-traversable culverts, designers often extend the culvert outside the clear zone ( 2 ). Based on the RDG, clear zones range from 7 to 46 ft depending on the design speed, roadside slope, traffic volume, and horizontal curvature ( 2 ). While extending the crossing culvert will reduce the probability of an errant vehicle striking the opening of the culvert, this will not completely eliminate the risk, as the fill material required for the slope may also have an impact on the potential for ROR vehicles to roll over depending on site-specific topographic conditions ( 6 ).
In some cases, certain treatments may not be viable. For example, in the case of large crossing culverts, the extension of a culvert beyond the clear zone may not be suitable because of the high construction costs associated with the large amount of fill material that is required ( 6 ). In such scenarios, an appropriate solution may be to shield the culvert with longitudinal safety grates. Several studies have shown the use of safety grates to be preferred to other treatments in various cases (3, 4). This treatment can improve safety by reducing the clear opening width of the culvert.
Another safety treatment that can be used to prevent ROR vehicles from striking the culvert openings is the installation of a barrier (e.g., thrie-beam, high-tension cable, or concrete). This approach is generally considered when other safety treatments are infeasible ( 2 ). The barrier is normally placed on the side of the roadway instead of near the culvert because of the steepness of the roadside slope. As a result, this can increase the number of crashes as the barrier itself, positioned within the clear zone, creates a potential hazard to motorists ( 3 ). A recent study found that the installation of a median cable barrier reduces the frequency of fatal and severe injury crashes, but increases the number of property-damage-only crashes ( 7 ).
State-of-the-Practice Survey
In addition to reviewing the extant literature, a questionnaire was sent to staff involved in hydraulic and geometric design at state DOTs across the U.S. to identify current practices related to the implementation of safety treatments for roadside culverts. The questions in the survey were related to culverts installed perpendicular or diagonal to the highway (excluding culverts parallel to the highway such as those under driveways or side road crossings, as this was beyond the scope of this study). The survey was conducted using an electronic survey platform and the study design was approved as exempt by the Institutional Review Board (IRB) at Iowa State University. Complete responses were received from 18 state DOTs.
Agencies were asked about the methods used to reduce the risks associated with culvert-involved crashes, as well as the contextual factors that are generally considered in selecting among these alternatives. Figure 1 shows that the most commonly used alternatives to limit the risk of ROR crashes are: 1) to shield edge drops with steel guardrail; 2) to extend the length of the culverts to provide recoverable side slopes; 3) to install traversable culvert grates; and 4) to shield edge drops with an approved bridge rail system. Examples of each of these treatments are shown in the photographs in Figure 2. While additional comments indicated the preferred method would be to locate the culvert drop off outside the clear zone, it was noted that is not possible in many situations. In that case, shielding the culvert is preferred.

Methods for limiting risk of culvert-involved crashes.
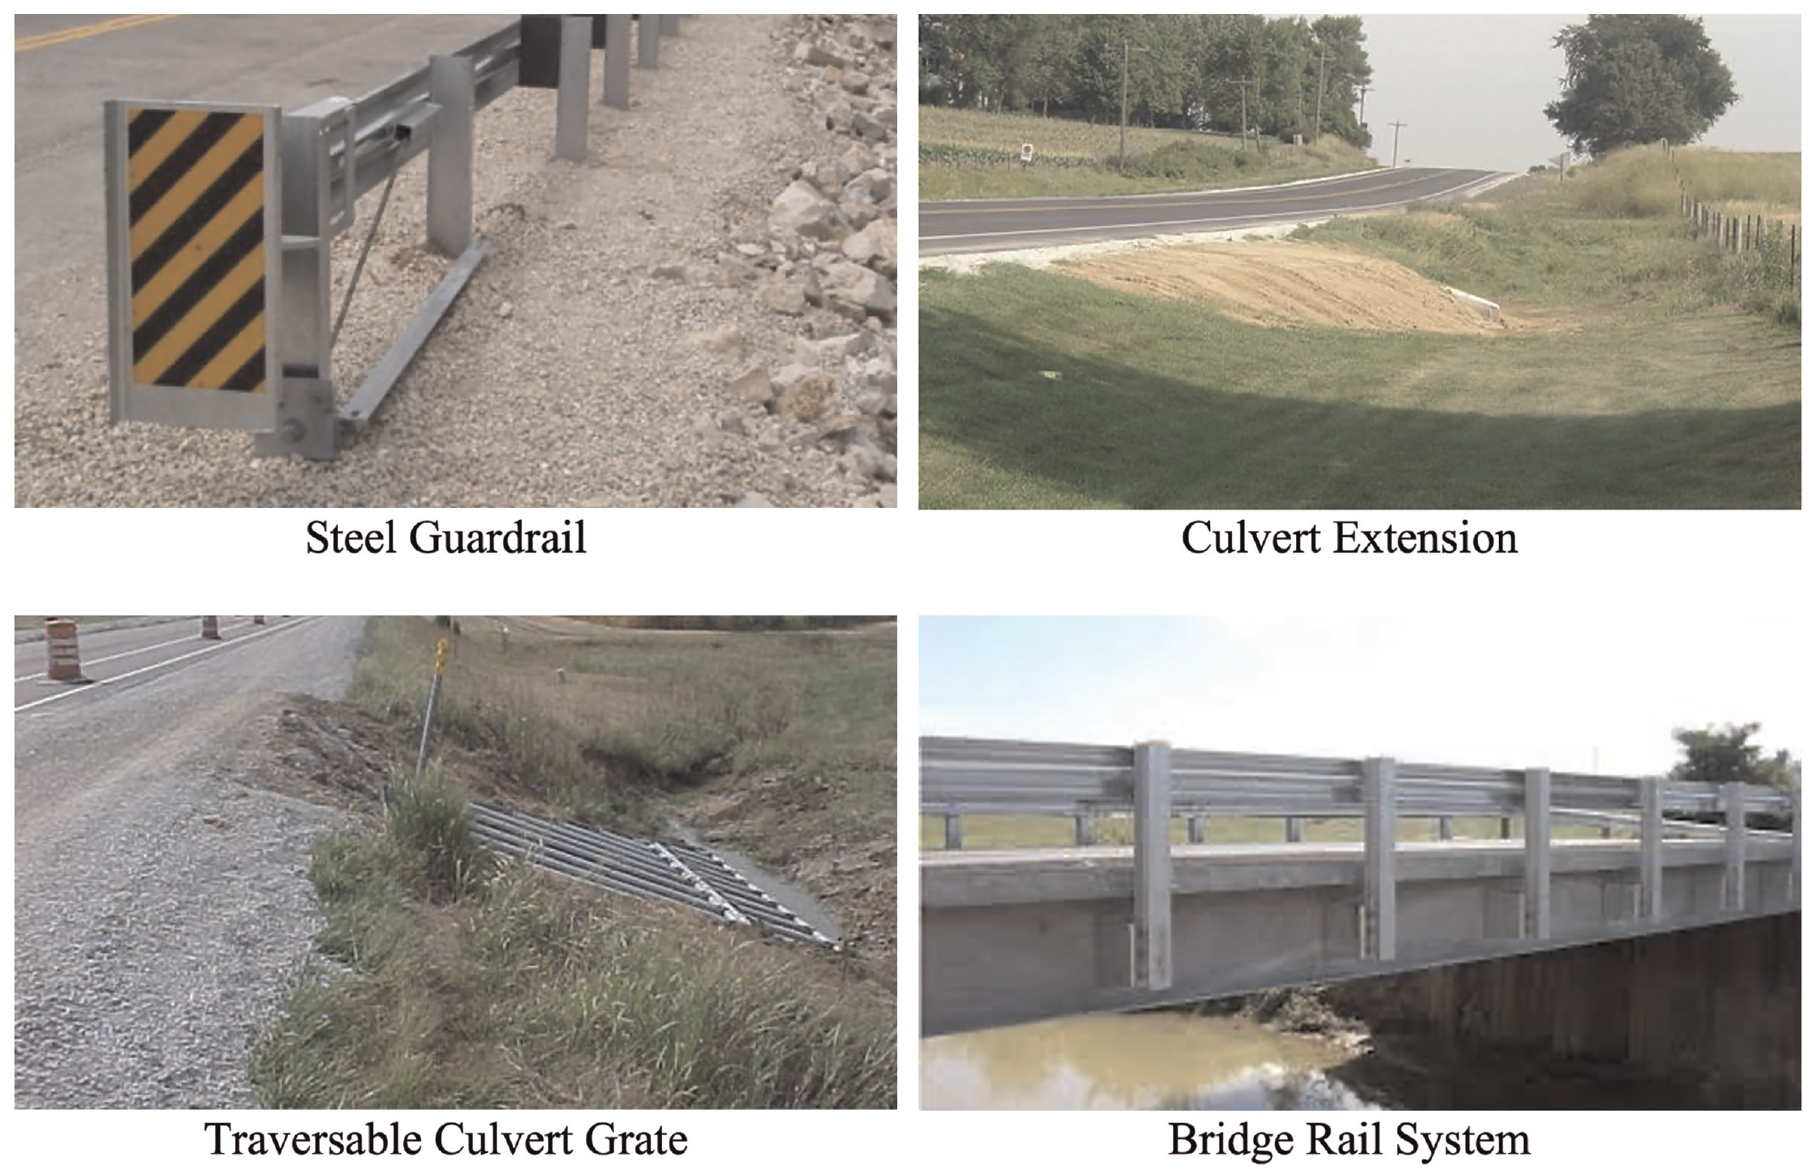
Example applications of culvert safety treatments.
Agencies were also asked about the factors that are used to determine when and where culvert treatments are applied. Twelve of the 18 responding agencies indicated they had some type of written policy that indicates when to provide ROR protection for culverts. Most of these policies are included in state highway design manuals. Figure 3 shows the prevalence of various screening factors that respondents indicated affected their selection of treatment alternatives. The most commonly used factors included design speed/speed limit, lateral offset from the edge of the traveled way to culvert opening, traffic volume, embankment slope, crash history, culvert size, and embankment height.
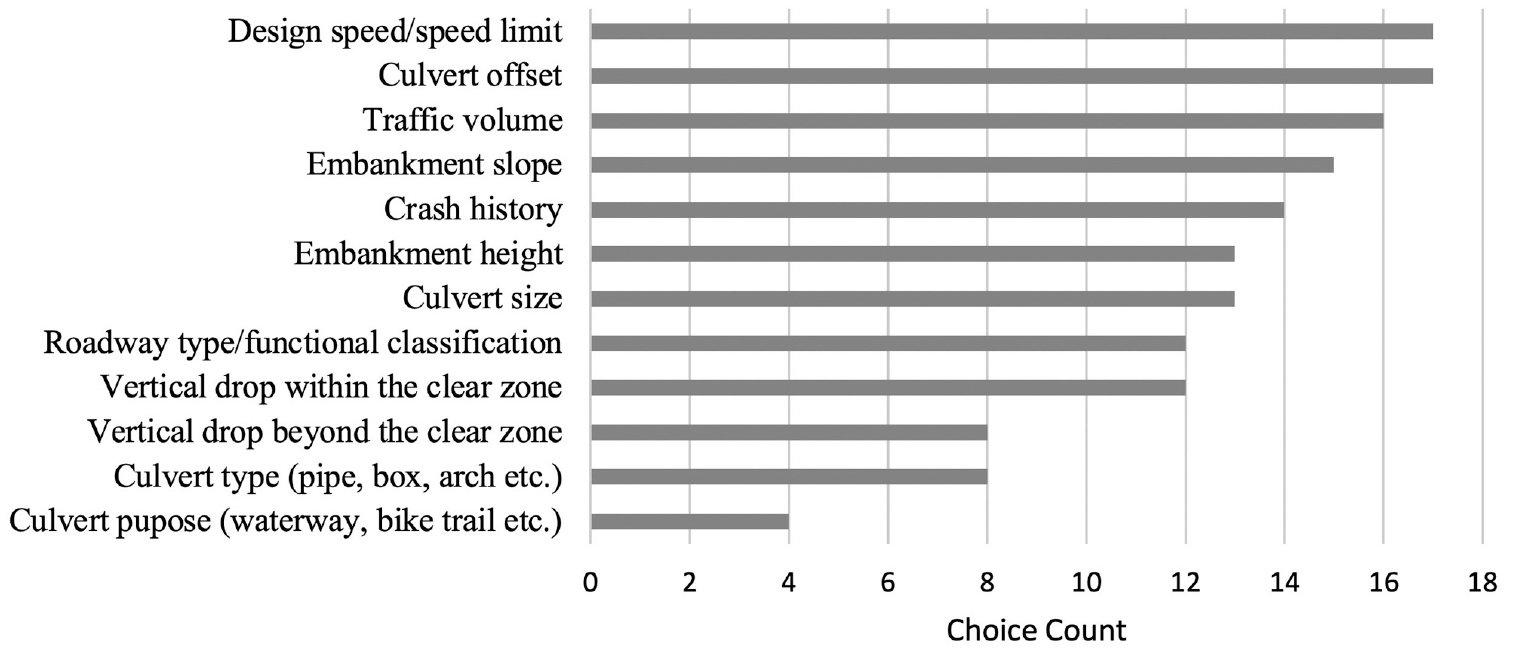
Factors affecting selection of treatment alternatives.
Overall, the guidance provided by agencies tended to be very general in nature. To this end, the principal objective of this study was to evaluate the effectiveness of various safety treatments for culverts under several design scenarios. This approach allows for more detailed insights as to the circumstances under which selected treatments provide advantages or disadvantages as compared with other alternatives.
Data Collection
Extensive data collection activities were conducted using information available from various databases maintained by the Iowa DOT to quantify the safety impacts of culverts, as well as to assess the potential impacts of several countermeasures. Each database included georeferenced location information for pertinent features and, as such, ArcGIS was used to integrate these databases into a joint analysis dataset.
Roadway Database
The Geographic Information Management System (GIMS) is a database maintained by the Iowa DOT, which provides information on roadway characteristics and traffic information. Within this database, there are three datasets that are commonly used in safety analysis. First, a traffic information file contains information on the annual average daily traffic (AADT) and percentage of vehicles by type (e.g., trucks, motorcycles, buses). A roadway information file includes details of geometric design characteristics such as the number of lanes, lane width, and presence/type of median. Finally, a lane inventory dataset outlines information such as the presence of rumble strips, shoulder widths, posted speed limit, and other features. A unique identifier is used to link information from each of these three files for each road segment in the GIMS database. The final analysis dataset included information from culverts that were located along 5,909 mi of two-lane 55-mph highways and 630 mi of four-lane 70-mph divided highways.
Culvert Database
A culvert dataset was obtained from the Iowa DOT that contained information pertaining to culverts on the primary (i.e., state-maintained) road network. This inventory file provides information as to the placement status (e.g., parallel versus transverse), culvert dimensions, shape, material, and culvert location (latitude and longitude). This database initially included a total of 29,019 culverts. A quality assurance (QA) process was conducted to determine the percentage of roadway system in which reliable culvert location data existed. Approximately 29 percent of the entries included missing information as to the culvert dimensions (either length or width). About 27 percent of the entries did not have placement information as to the culvert orientation (e.g., crossing, median, or ramp culvert), with these errors typically occurring along long, contiguous stretches of roadway. As it was uncertain whether these were crossing culverts or not, cases where culvert placement was unknown or could not be verified using aerial photographs were removed from the dataset. As the emphasis of this study was on perpendicular culverts, traverse culverts were also removed. Collectively, these filters reduced the dataset to 11,045 culverts. Using information from the culvert dataset and GIMS dataset, all of these culverts were spatially linked to the nearest road segment. This allowed for integration of culvert and roadway information for analysis purposes.
Barrier Database
The barrier dataset consists of detailed information on the installation locations of beam guardrail, concrete barrier, cable barrier, and crash cushions. These data were used to identify those culverts that are being shielded by some type of barrier. A QA review was conducted for these data using aerial photographs. Ultimately, this dataset was found to be largely incomplete with a substantive amount of inaccuracies. Thus, a manual review was conducted using satellite imagery to determine whether any form of protective barrier was present. Approximately 6.2 percent of culverts were found to be shielded by some form of barrier.
Crash Database
In this study, crash data from Iowa DOT were utilized from between January 2007 and August 2017, the duration over which such information were available. The crash data consists of information pertaining to each crash, from the crash level to the person level. For the purposes of this study, culvert-related crashes were identified using two methods:
The two fields “crash sequence of events” and “first harmful event” were filtered for the value “culvert” in the crash database.
A manual search for the keywords “culvert” and “pipe” was performed in the database that included the police narratives of the crashes.
Crash Code Review
An exclusive crash code method was implemented as an attempt to extract culvert-related crashes from the crash database. The relevant fields used for this selection were “first harmful event” and “crash sequence of events.” The first harmful event field describes the first event in the crash that resulted in damage or an injury and is present in the crash-level file. The crash sequence of events field describes the events for each vehicle in the order in which they occurred, which includes the first four significant events (harmful and non-harmful) in sequence. This field is recorded at the vehicle level. Both fields were filtered for cases where the culvert code was present.
Searching by first harmful event yielded 1,206 crashes while searching by crash sequence of events resulted in 2,322 crashes. This resulted in the identification of a total of 3,528 crashes, including duplicate entries that flagged either field. After removing duplicates, there were 2,330 culvert-related crashes found across the state of Iowa. These crashes were further filtered to limit the dataset to only those occurring on the primary road network (i.e., Interstates and roads on the U.S. or state highway systems). After applying these criteria, 872 culvert-related crashes on the primary road network were identified.
Crash Narrative Review
Another method to extract culvert crashes was implemented by investigating the crash narratives as described by law enforcement officers on scene manually. A quick search on a few particular keywords was conducted to identify potential culvert-related crashes. The keywords “culvert” and “pipe” were used for a study period covering 11 years (2007–2017). This resulted in a total of 2,133 crashes for the term culvert and 357 crashes for pipe. After identifying these 2,490 crashes, a manual data review resulted in the removal of duplicates and additional crashes that did not appear to actually involve a culvert. As before, only crashes that occurred on the primary road network were selected, using the same filtering criteria as described previously for searching on crash codes. Overall, 435 culvert-related crashes were identified by searching on crash narratives, of which 260 crashes had not been previously identified using the crash code methodology. Ultimately, a total of 1,132 culvert-related crashes were identified on the primary road network during the analysis period using these two search methods.
Integration of Crash and Culvert Data
Attempts were also made to match the crash data with information for the related culvert that was involved in the crash. Consequently, each crash was spatially linked to the nearest culvert. It is important to note there is significant imprecision with respect to the location information in both the culvert and the crash databases. For example, some of the crashes were found to be more than 1 mi from the nearest culvert. In this study, all crashes that were more than 1,640 ft (500 m) from the nearest culvert were removed, reducing the number of crashes to 937. This threshold distance was selected among various alternatives to allow for conditions in which the vehicle would have struck the culvert and still continued to travel for some distance before coming to a stop.
Since this study only focused on the crossing culverts, parallel culverts were removed from the dataset, which resulted in 547 crossing culverts that had experienced a crash during the study period. As a result, the total number of crashes was reduced from 937 to 568 in this study. After removing those cases in which some pertinent information about the crash, the culvert, or the associated roadway segment was missing, the number of crashes was reduced to 500. Table 1 provides descriptive statistics for the entire sample of 11,045 crossing culverts where complete data were available, as well as details for the subset of 481 culverts that were linked to these 500 crashes.
Descriptive Statistics for All and Crash-Involved Crossing Culverts

Note that this study assumed that the center of the crossing culvert lies on the centerline of the roadway. Thus the offset of the culvert from the centerline of the roadway is calculated by dividing its length by two. For the purpose of this study, four different types of culverts were analyzed based on their sizes and shapes: small pipe (diameter less than 4 ft), medium pipe (diameter between 4 ft and 10 ft), medium box (width between 4 ft and 10 ft), and large box (width greater than 10 ft).
Methodology
The primary objectives of this study were: 1) to assess the risk of culvert-involved crashes in consideration of site-specific factors, including traffic volumes, culvert characteristics, and other roadway-related information; and 2) to compare the relative effectiveness of culvert-related safety treatments, including culvert extensions, safety grates, and steel guardrail. The first objective was investigated through the estimation of a negative binomial regression model using data collected from the in-service field evaluation described previously. The results of this evaluation provide important details as to the scenarios under which the risks of culvert-involved crashes are greatest.
While these results provide important insights as to the prevalence of culvert-involved crashes, it is not feasible to distinguish the potential safety impacts of various culvert safety treatments based on these data for several reasons. First, there is significant variability as to the site characteristics under which specific treatments are generally applied (i.e., some treatments are more likely to be applied under certain ranges of traffic volumes, speed limits, etc.). Second, research suggests that to mitigate the potential sources of bias from an in-service performance evaluation of this nature, both reported and unreported crashes would need to be analyzed ( 8 ). Unreported crashes need to be considered because they represent “successes” for the roadside safety treatment as these crashes are less likely to result in injury or serious property damage. Several studies have attempted to estimate the number of unreported collisions based on maintenance records ( 9 ), video camera surveillance ( 10 ), and periodic inspections ( 11 ). However, such details were not available for the purposes of this study. As such, the RSAP was used to evaluate the relative effectiveness of different roadside design alternatives.
Negative Binomial Regression Model
The number of culvert-involved crashes is comprised of a series of non-negative integers. As such, negative binomial regression models have emerged as a preferred statistical method for the analysis of such data. Within the context of this study, the probability of culvert i experiencing yi crashes during the analysis period can be expressed as shown by

where
The

where
X1 to Xk are a series of independent variables (i.e., traffic volumes, speed limit, culvert characteristics, etc.),
β1 to βk are a series of parameters estimated from the regression model, and
EXP(εi) is a gamma-distributed error term with mean equal to one and variance of α.
The negative binomial model is estimated using standard maximum likelihood estimation methods using NLOGIT version 6.0.
Roadside Safety Analysis Program
The RSAP uses an encroachment-based method to perform benefit–cost analyses on various roadside design alternatives. It allows for the determination of the “best” alternative based on a series of benefit–cost analyses that compare all alternatives. The program estimates the frequency, severity, and societal cost of roadside crashes using a conditional encroachment–collision severity approach for each alternative design in the analysis. Each alternative requires the agency costs, which include construction and maintenance costs, to be included in the analysis (default value is $ 0). The “best” alternative will be selected based on the biggest reduction in costs (benefits) compared with the agency costs for improvement. Equation 3 shows how the program calculates the benefit–cost ratio of an alternative. The numerator represents the reduction in crash costs, and the denominator represents the cost of the improvement. The program considers two factors for reduction in crash costs (CC): crash frequency and the severity of each crash. For the costs of the improvement, on the other hand, it considers the installation cost (I), maintenance cost (M), and repair cost (RE). The subscripts in the equation refer to two different alternatives (BCR21 is the benefit–cost ratio of alternative 2 versus alternative 1).

Each analysis in RSAP is based on four conditional probability modules. First, the program will estimate the expected number of encroachments based on traffic information and roadway characteristics (encroachment prediction module). Next, if an encroachment occurs, the program will determine the likelihood of that encroachment resulting in a crash (crash prediction module). Subsequently, if that encroachment has a high probability of resulting in a crash, the program will evaluate the severity of that crash (severity prediction module). Finally, the software will convert the severity of the crash into a dollar amount to calculate the benefit–cost ratio of that alternative (benefit–cost analysis module). Detailed explanations of each module can be accessed from the RSAP Update developed as a part of NCHRP Project 22-27 ( 12 ).
For the purpose of this study, two different scenarios were created to simulate the most common types of sites in Iowa: (1) two-lane undivided highways with posted speed limit of 55 mph; and (2) four-lane divided highways with posted speed limit of 70 mph. The study also considered two types of cross-drainage culverts, which included crossing culverts (culverts that cross under all lanes of travel) and median culverts (culverts crossing under one direction of travel along divided highways). For crossing culverts, four different sizes were analyzed: small pipe, medium pipe, medium box, and large box culverts; while for median culverts, only small pipe culverts were analyzed.
Table 2 shows the characteristics of different variables that were included in the RSAP analysis. The design life of a culvert, as well as the rate of return, are the values suggested by the Iowa DOT ( 13 ). For the value of statistical life (VSL), the RSAP user’s manual defines it as “the average comprehensive crash cost of a fatal crash” ( 12 ). For this study, $4.5 million was used for this variable, based on the cost per fatality recommended by the Iowa DOT (13, 14). Sensitivity analyses were conducted with different values and the results were generally insensitive across the ranges that were considered.
Project Characteristics Used in Roadside Safety Analysis Program Analysis

Default value from the program.
The AADT used in this study was based on the minimum and maximum AADT values from the GIMS files. The scenario for two-lane undivided highways had AADT ranging between 1,000 and 9,000 vehicles per day (vpd) in 2,000-vpd increments; while for the four-lane divided highway scenario, the AADT ranged from 10,000 to 50,000 vpd with an increment of 10,000 vpd. In addition, the offset distance to the culvert was also varied between the scenarios. This value is measured from the edge line of the traveled way. Five different values were analyzed for both scenarios: between 8 and 32 ft with an increment of 6 ft for two-lane undivided highways, and from 14 to 34 ft with an increment of 5 ft for four-lane divided highways. Note that the maximum offsets for both scenarios represent the limits of the clear zone. These values were calibrated using Highway Design Tools (Roadside Barriers) from the FHWA ( 15 ).
RSAP allows designers to simultaneously analyze a maximum of five alternatives. This study examined four alternatives for both scenarios: do nothing (alternative 1), safety grate installation (alternative 2), guardrail installation (alternative 3), and culvert extension outside the clear zone (alternative 4) as shown in Figure 4. The do-nothing alternative served as a baseline and did not include any safety treatments. The only cost associated with this alternative was the annual maintenance cost of $600 (initial amount for all alternatives), obtained from previous studies (16, 17).

Roadside Safety Analysis Program alternatives on four-lane divided highway.
Safety grates were the first alternative safety treatment considered. The construction cost for this treatment varied between $500 and $6,000 ( 18 ), depending on the size of the culvert. For the annual maintenance cost, this alternative required an additional $200 for grate cleaning and debris removal (twice a year) ( 19 ). The guardrail alternative required long lengths of steel guardrail to be installed along the travel lanes to keep drivers from crashing into the culvert. The length of the guardrail depended on the offset of the culvert, the design speed of the roadway, and the associated grade, which was calculated using a spreadsheet provided by FHWA ( 15 ). The construction cost of this safety treatment depended on the guardrail length, end anchor, and tangent end terminal. For the annual maintenance cost, an additional $1,000 was required for this alternative, based on Iowa DOT figures. The last alternative examined in this study was a culvert extension outside the clear zone. For this alternative, the construction cost depended on the size of the culvert and the clear zone. As for the annual maintenance cost, there was no additional cost required for this alternative.
Results and Discussions
To assess the prevalence and risks of culvert-involved crashes, the in-service safety performance data were used as a part of a regression analysis to discern how crash risks vary based on site-specific factors including the AADT, speed limit, number of travel lanes, culvert width, and culvert offset. Table 3 presents the results for the final negative binomial model. These model results include parameter estimates for each variable of interest, along with the associated standard error, t-statistic, and p-value. The model has been specified such that AADT is treated as an offset variable with its parameter estimate constrained to be equal to one. Consequently, the results from Table 3 represent the impacts of each variable on crash rate. Further, the model has been estimated so that the facility type and culvert width variables represent the relative safety performance as compared to the baseline scenario of 70 mph four-lane highways with culvert widths of 0.00–4.00 ft.
Results of Negative Binomial Model for Culvert-Involved Crashes

Note: Baseline conditions are for a 70 mph four-lane highway and culvert width of 0.00–4.00 ft.
When interpreting the model results from Table 3, the parameter estimates indicate the change in the log of the expected crash count at an individual culvert associated with a one-unit increase in the given predictor variable. Exponentiating the coefficient for each variable provides an estimate of the average effect of a one-unit increase in a predictor variable on the expected crash count. This quantity is also referred to as an incidence rate ratio.
To aid in interpretation of the results, Figure 5 presents a series of plots that relate the expected number of culvert-involved crashes over the 10-year analysis period to each of the predictor variables of interest.

Culvert-involved crashes versus annual average daily traffic, number of lanes, speed limit, and culvert offset.
These results show that crash rates are lowest on the rural Interstate system, where the associated roadway segments are four-lane highways with 70 mph speed limits. Crash rates are approximately 75 percent higher on 65-mph four-lane highways, 98 percent higher on 55-mph four-lane highways, and nearly five times higher on 55-mph two-lane highways. It should be noted that two-lane highways cover a significantly lower range of volumes (e.g., maximum AADT of approximately 14,000 vpd). As such, extrapolation beyond this limit should be done with caution.
The increase in crashes is roughly proportional to the increase in culvert size. Compared with the smallest size (diameter of 4.00 ft or less) culverts, culverts from 4.01 to 8.00 ft in diameter experienced 45.9 percent more crashes while the largest culverts (greater than 8.00 ft in diameter) experienced 121.2 percent more crashes on average. The offset from the centerline of the roadway to the culvert also showed a substantive impact on crashes as a 1-ft increase in offset was associated with a reduction in crashes of 0.4 percent.
Collectively, these results provide important insights as to how the risk of culvert-involved crashes varies across roadway locations. In addition to examining the rate of culvert-involved crashes, this study also considered the degree of injury severity sustained as a result of each crash. This study used the common five-point KABCO scale to differentiate the severity level of each crash. Under the KABCO scale, each crash is classified based on the most severe degree of injury sustained by any of the crash-involved occupants. The five injury severity categories include: fatal injury (K), incapacitating injury (A), non-incapacitating injury (B), possible injury (C), and no injury (O).
Figure 6 illustrates the distribution of crash severity (among 500 total crashes that were matched to a nearby culvert) based on different types of roadway facilities. Approximately 71–73 percent of crashes were property damage only (PDO) or possible injury. In addition, around 14–20 percent of crashes recorded during the study period resulted in minor injury. Moreover, between 7 and 13 percent of the crashes resulted in fatal or serious injury. In general, crashes tended to be less severe (B, C, O) on the Interstate system as compared with the U.S. and state highway systems. This injury severity distribution was not significantly different from the default distribution from the RSAP.

Crash severity distribution based on roadway classification.
However, the empirical setting did not allow for a direct comparison of the relative safety performance of potential culvert protective treatments given differences in key design parameters (e.g., lane width, design speed, clear zone) across highway classes as noted previously. As such, RSAP was used to compare the relative safety performance of the culvert safety treatments of interest under a range of conditions.
RSAP Evaluation
In total, 225 different RSAP models were developed in this study. These models were developed based on different AADTs, culvert offsets, and types of culverts. The threshold used for the benefit–cost ratio in selecting the best alternative in each model is 2. The following sections present the cost-effectiveness analyses. The alternative with the highest incremental benefit–cost ratio is selected as the preferred alternative under each scenario.
Scenario 1: Two-Lane Undivided with 55 mph Speed Limit
Figure 7 shows the RSAP results for two-lane 55-mph undivided highways where all the culverts in this scenario are crossing culverts. The 32-ft offset (outside clear zone) models only include the first three alternatives as the culvert is assumed to be located outside the clear zone.

Base case alternative for two-lane 55-mph undivided highways.
For the small pipe culvert, culvert extension is the preferred alternative when the distance between the edge of the traveled way and the culvert end is less than 20 ft for all ranges of traffic volumes (except for AADT less than 1,000 vpd for the 20-ft offset). As the culvert offset increases beyond 20 ft for the small pipe, the best alternative changes from culvert extension to either installing safety grates or doing nothing. This is because as the offset increases, the length of the extension to the culvert will also increase, which will result in higher installation cost compared with other alternatives.
The best alternatives for both the medium pipe culvert and the medium box culvert for all ranges of AADTs and offsets are similar, as shown in Figure 7. The primary reason for this trend is that in the RSAP analysis, the only difference between these two types of culvert is the culvert installation costs. Other variables such as the width/diameter of culvert, safety grate costs, and guardrail costs remain the same. Thus, the benefit–cost ratio does not change significantly. For these two types of culverts, most cases suggest that installing safety grates will be more effective than other alternatives (except for the cases with AADT less than 1,000 vpd, and culvert outside the clear zone).
For the large box culvert, Figure 7 shows that in most cases, the do-nothing alternative is preferable. This result is obtained because the installation cost for safety grates is significantly higher for this type of culvert than for others. Similarly, for culvert extension, the cost of installing a large box culvert is higher than for the medium box, and small and medium pipe culverts.
The benefit–cost ratio for installing guardrails is negative in all cases, indicating that the crash costs associated with the guardrails are always higher than the other alternatives. The findings suggest that while the guardrail may reduce the probability of a vehicle striking the culvert in a way that may result in serious injury, it will in turn increase the probability of a vehicle being involved in a PDO crash because of the presence of a guardrail.
Scenario 2: Four-Lane Divided with 70 mph Speed Limit
Figure 8 shows the RSAP results for four-lane 70-mph divided highways. Only small pipe culverts were modeled in RSAP for median culverts because these were the only culverts that were seen to be present in the culvert database. Similar to two-lane undivided highways, cases with offset outside the clear zone consider only the first three alternatives.

Best case alternatives for four-lane 70 mph divided highway.
For small pipe crossing culverts, culvert extension can be observed to be the optimal choice when the offset value is less than 14 ft for all ranges of traffic volumes. As the culvert offset increases beyond 14 ft, the installation of safety grates is shown to be more economical when compared with other alternatives because of the low installation cost. Note that for traffic volumes less than 10,000 vpd, if the culvert is located outside the clear zone, none of the safety treatments prove to be cost-effective.
Similar to the two-lane undivided highway analyses, both medium pipe crossing culverts and medium box crossing culverts have the same trend for all cases. As mentioned previously, the only difference between these two types of culverts is the cost of installation, which for medium box culvert is twice that for medium pipe culvert. The results suggest that for these two types of culverts the greatest economic benefits will be obtained when safety grates are used when AADT is greater than 20,000 vpd.
For large box crossing culverts, Figure 8 shows that safety grates are preferred when the culvert offset is less than 24 ft, except when AADT is less than 10,000 vpd. This safety treatment is preferred mainly because of the lower installation cost compared with other treatments. However, as the culvert offset increases beyond 29 ft for AADT less than 40,000 vpd, none of the safety treatments show positive impacts in the form of economic benefits.
For small pipe median culverts, the same trend can be observed as in the small pipe crossing culvert case. Culvert extension is preferred when the culvert offset is less than 14 ft. As the distance between the edge of the traveled way and the culvert end increases, safety grates become the preferred option over other alternatives.
Conclusion
The primary objective of this study was to examine the in-service performance of culverts on the high-speed highway network in Iowa. This included an assessment of the crash risk of culverts under various scenarios, as well as a comparison of various safety treatments aimed at mitigating the frequency and severity of collisions in which an errant vehicle strikes a culvert. This included evaluations of the cost-effectiveness of these safety treatments as compared with the baseline do-nothing scenario.
The research team conducted an in-depth evaluation of the existing culvert database provided by the Iowa DOT. An attempt was made to identify all crashes related to culverts through a review of standard fields on the Iowa crash report form, as well as through a review of pertinent keywords from the narrative section of the forms. These crashes were then linked to the nearest cross-drainage culvert, which was associated with the nearest segment on the road network.
The first stage of the analysis involved the estimation of a negative binomial regression model that related the number of crashes experienced during the 10-year analysis period to predictor variables that included AADT, speed limit, number of travel lanes, culvert diameter, and culvert offset from the roadway centerline. Crashes tended to be highest along two-lane 55-mph undivided highways and lower on the limited access freeway network, where higher design standards are in place, which include greater clear zone distances and less abrupt changes in horizontal and vertical alignment. Crashes were also more frequent at larger culverts and where the culverts were located nearer to the traveled way. Ultimately, the results of this analysis provide critical insights as to how the risk of culvert-involved crashes varies across different roadway scenarios. This empirical model can be used as a basis for predicting or forecasting the number of such crashes that would be expected under various design scenarios.
In addition to this analysis of culvert-involved crash risk, the second stage of the analysis involved the use of the RSAP to estimate the expected crash costs associated with various roadway departure scenarios. This information was used as part of an incremental benefit–cost analysis to identify which safety treatments are most cost-effective under various scenarios. A total of 225 different models were designed in RSAP based on the highway system, culvert sizes, different AADTs, and culvert offsets. Ultimately, the results of these comparisons suggest that the installation of safety grates on culvert openings provides a promising alternative for most of the cases where the culvert is located within the clear zone. Grates are expected to reduce the level of injury sustained by crash-involved occupants, as well as the associated crash costs, resulting in a higher benefit–cost ratio. The installation of safety grates was found to be the most economical choice for most highway types and for different culvert sizes in the analyses. This is mainly because of the large reductions in crash costs and low installation and maintenance costs as compared with other alternatives.
In cases where extension of culverts outside the clear zone was defined, the results showed that the benefit–cost ratio was positive; however, this was always less than the benefit–cost ratio for the installation of safety grates. On the other hand, the installation of guardrail was associated with a higher number of crashes, though the severity of such crashes tended to be less severe than in the absence of guardrail. The benefit–cost ratios for the installation of guardrails near the edges of travel lanes were significantly negative, mainly because of the increase in crash costs and high installation and maintenance costs compared with the other alternatives. In general, guardrail is recommended when adverse conditions are present (e.g., large drop-offs) or when other treatments are not feasible at a specific location.
Limitations
There are several limitations that can be addressed through future work or changes in the manner in which highway agencies maintain their culvert inventory data. One of the main limitations of this project was the degree of missing or incomplete information in the culvert database, which required an extensive quality assurance review and some manual investigation to fill in missing data where possible. Ultimately, approximately 10 percent of the culvert sizes were missing from the analyzed data, which resulted in a limited sample for specific categories of culverts.
Another limitation of this study is that the crash information provided for this study was based on information in police crash reports. There were likely numerous cases where a crash occurred with a culvert, but was not reported. RSAP predicts crashes based on the encroachment and vehicle trajectory data and, as such, may be expected to provide a more accurate estimate of the number of culvert-involved crashes. Generally, these unreported crashes tend to be less severe and, as such, the number of crashes predicted under various scenarios using RSAP is higher than what was shown by the in-service evaluation.
The installation cost provided by the Iowa DOT for safety grates was a general figure that was not associated with a specific size of grate. The costs for different sizes of safety grates was found from an online source. The maintenance costs for culverts and safety grates were found through literature review; however, these costs did not have a size associated with them either. Therefore, the same maintenance costs were used for all culverts and all safety grates of all sizes.
Another limitation is related to the RSAP software and the underlying data on which the program is based. The ROR crash frequencies generated by RSAPv3 are based on the encroachment data collected by Cooper ( 20 ). These data were collected in the 1970s in Canada and there are some ranges of volume and geometric conditions in which data are sparse. An ongoing NCHRP study (NCHRP 17-88) is aimed at updating these data, which may provide improved predictive capabilities.
In the analyses performed in this study, it was assumed that the maintenance costs for culverts, safety grates, and guardrails remained the same for varying lengths and sizes. With a better dataset having the accurate installation and maintenance costs with varying sizes for culverts and safety grates, it would be interesting to see how these results vary. Currently, the culverts were combined into groups based on highway classification, speed limit, number of lanes, median type, and culvert sizes. As a future research work, each culvert from the list of those 547 culverts can be modeled separately in RSAP. This way the simulations will give accurate results and safety treatments can be chosen thereafter based on the individual results.
Footnotes
Author Contributions
The authors confirm contribution to the paper as follows: study conception and design: P.T.S.; data collection: H.C., M.-U.M.-J.; analysis and interpretation of results: H.C., C.M.D., M.-U.M.-J., P.T.S; draft manuscript preparation: H.C., C.M.D., M.-U.M.-J., P.T.S. All authors reviewed the results and approved the final version of the manuscript.
Declaration of Conflicting Interests
The author(s) declared no potential conflicts of interest with respect to the research, authorship, and/or publication of this article.
Funding
The author(s) disclosed receipt of the following financial support for the research, authorship, and/or publication of this article: This work was supported by the Iowa Department of Transportation (Addendum 620; InTrans Project 17-620).