
Abstract
Lane-changing maneuvers on highways may cause capacity drops, create shock waves, and potentially increase collision risks. Properly managing lane-changing behavior to reduce these adverse impacts requires an understanding of their determinants. This paper investigates the determinants of lane changing in congested traffic using a next generation simulation dataset. A random parameters binary logit model with heterogeneity in means and variances was estimated to account for unobserved heterogeneity in lane-changing behavior across vehicles. Estimation results show that average headway, the original lane of the vehicle, driver acceleration/deceleration behavior, and vehicle size all significantly influence lane-changing probabilities. It was further found that the effect of vehicle size varied significantly across observations, that the mean of this variation decreased with increasing average headway, and the variance increased with increasing driver acceleration/deceleration. These empirical findings provide interesting new evidence on the determinants of lane changing, which can be used in traffic flow models to better replicate and predict traffic flow.
Lane changing and car following are two fundamental components of traffic flow theory. Car following focuses on traffic longitudinal dynamics on a single lane and lane changing investigates vehicle lateral movements on a multi-lane road ( 1 – 7 ). Lane changing is typically divided into two categories; mandatory lane changing (mandated within a relatively short distance such as at merging and diverging points) and discretionary lane changing (referring to drivers’ spontaneous choice for improving their mobility without being mandated) ( 8 – 11 ). This study focuses on discretionary lane changing. Past research has found that lane-changing maneuvers may cause capacity drops, create shock waves, and potentially increase collision risks ( 12 – 14 ).
To mitigate these adversary impacts, both macroscopic and microscopic models have been proposed to study lane changing. Macroscopic models treat vehicles as a fluid stream and calculate macroscopic traffic characteristics such as traffic density, traffic flow rate, and space mean speed ( 15 , 16 ). Using this approach, Knoop et al. identified that density values on current and target lanes had impacts on the probabilities of discretionary lane changing ( 17 ). Kinematic wave theory was used as a macroscopic approach to study vehicle lane changing ( 18 , 19 ). To complement these macroscopic models, microscopic models were used to explore the relationships between microscopic vehicle-level features and lane changing. Many of these microscopic studies explored lane-changing behavior as a function of acceptance gaps with lane changing triggered when an acceptance gap is guaranteed ( 20 – 22 ). Various studies attempted to find reasonable ranges for acceptance gaps that will make lane changing more or less likely ( 23 , 24 ). Further, Laval and Daganzo proposed a hybrid lane-changing model to balance macroscopic traffic characteristics and microscopic vehicle detail ( 25 ). They treated lane-changing vehicles as discrete particles, with limited acceleration capabilities, that interact within a multi-lane traffic stream. It has also been observed that discretionary lane-changing behavior can be triggered by the speed difference between the current and target lanes. Because drivers tend to change lanes to increase their travel speed, the probability of discretionary lane changing was found to be positively correlated with speed differentials ( 25 , 26 ).
Many studies have utilized statistical approaches to model lane changing ( 8 , 22 ). For example, Chang and Kao estimated several lane-changing probability models in uncongested traffic ( 27 ). They considered only one traffic-flow-related factor (headway or density) in each model. Park et al. found that the speed and density differences in adjacent lanes had a significant influence on lane-changing probabilities, by estimating a logistic regression model ( 28 ). In other work, Lee et al. proposed an exponential probability model with the lane-speed differences and lead-gap differences as independent variables to model lane-changing probabilities ( 29 ).
Despite providing fundamental insights, most existing studies viewed vehicles and their drivers as homogeneous elements, responding identically to surrounding traffic conditions. However, heterogeneity across vehicles and drivers clearly exists since vehicle features (size and acceleration/deceleration characteristics) may be dramatically different and drivers may exhibit different driving behaviors, with varying degrees of acceleration/deceleration behavior, willingness to accept gaps in traffic, and so on. While some elements of this heterogeneity are measurable, many are not. For example, while driver acceleration/deceleration behavior may be considered an important element of driving behavior, it is generally challenging to explicitly capture behavioral differences among drivers, which are often influenced by many unobserved factors (such as the characteristics of surrounding vehicles and drivers, and external environmental conditions), all of which could have a significant effect on discretionary lane changing. For example, large vehicles are often expected to make fewer discretionary lane changes compared with smaller vehicles because of their physical size and limited acceleration/deceleration capabilities ( 30 ). Yet some large vehicles may still have comparatively high probabilities of making discretionary lane changes because of unobserved factors relating to individual driver decisions and variations in the acceleration and deceleration performance of specific large vehicles.
In relation to driving behaviors, drivers who accelerate/decelerate at high rates have been found to make more lane changes relative to those who do not ( 31 , 32 ). However, only a limited number of studies investigated driver heterogeneity and its role in lane changing. As examples, Yang and Koutsopoulos considered driver heterogeneity by including an error term in the lane-changing function, and Sun and Elefteriadou conducted group studies to obtain driver characteristics and then incorporated them into lane-changing models ( 33 , 34 ). As for vehicle heterogeneity, Moridpour et al. estimated a discretionary lane-changing model specific for heavy-duty vehicles alone ( 30 ). Overall, the review of past research reveals a clear need to study the role of vehicle-driver heterogeneity (observed and unobserved) in lane-changing behavior.
Motivated by the above discussion, this study estimates a random parameters binary logit model with heterogeneity in means and variances to study the role of observed and unobserved heterogeneity in discretionary lane-changing probabilities. This is a distinct methodological departure from previous research, which has generally applied a fixed-parameters approach, and it introduces a methodological approach that could form the basis for future empirical work ( 22 ).
The following section presents the estimation details of the random parameters binary logit model with heterogeneity in means and variances, followed by a description of the available data. Model estimation results are then presented and discussed, and the paper concludes with a summary and a discussion of directions for future research.
Methodological Approach
For a given highway segment, the discretionary lane-changing decision has two possible outcomes, executing discretionary lane changing (denoted by 1) or not (denoted by 0). To develop a statistical model of this lane-changing choice, the starting point is to define a function that determines the probability of a lane change as,

where Fn is a function determining the probability that the driver of vehicle n will change lanes,

where Pn is the probability that the driver of vehicle n makes a lane change. To account for possible unobserved heterogeneity in the data, the possibility that one or more parameter estimates may vary across vehicles is accounted for by rewriting Equation 2 ( 36 , 37 ),

where f(

where β is the mean parameter estimate across all vehicles,
During model estimation, numerous density functions were empirically evaluated for the term f(
Empirical Setting
The US101 trajectory dataset was collected by the Next Generation Simulation (NGSIM) program on the Hollywood Freeway, in Los Angeles, CA, on June 15, 2005. The study area, presented in Figure 1, was about 2,100 ft long and consisting of five mainline lanes, lane 1 (leftmost) to lane 5 (rightmost). An auxiliary lane (lane 6) exists between the on-ramp (lane 7) at Ventura Boulevard and the off-ramp (lane 8) at Cahuenga Boulevard. The precise vehicle location information was extracted from the video recorded by eight cameras located in the study area at a 0.1 s intervals. A total of 45 min of trajectory data were included in the US101 dataset, segmented into three periods: 7:50–8:05 a.m., 8:05–8:20 a.m., and 8:20–8:35 a.m.
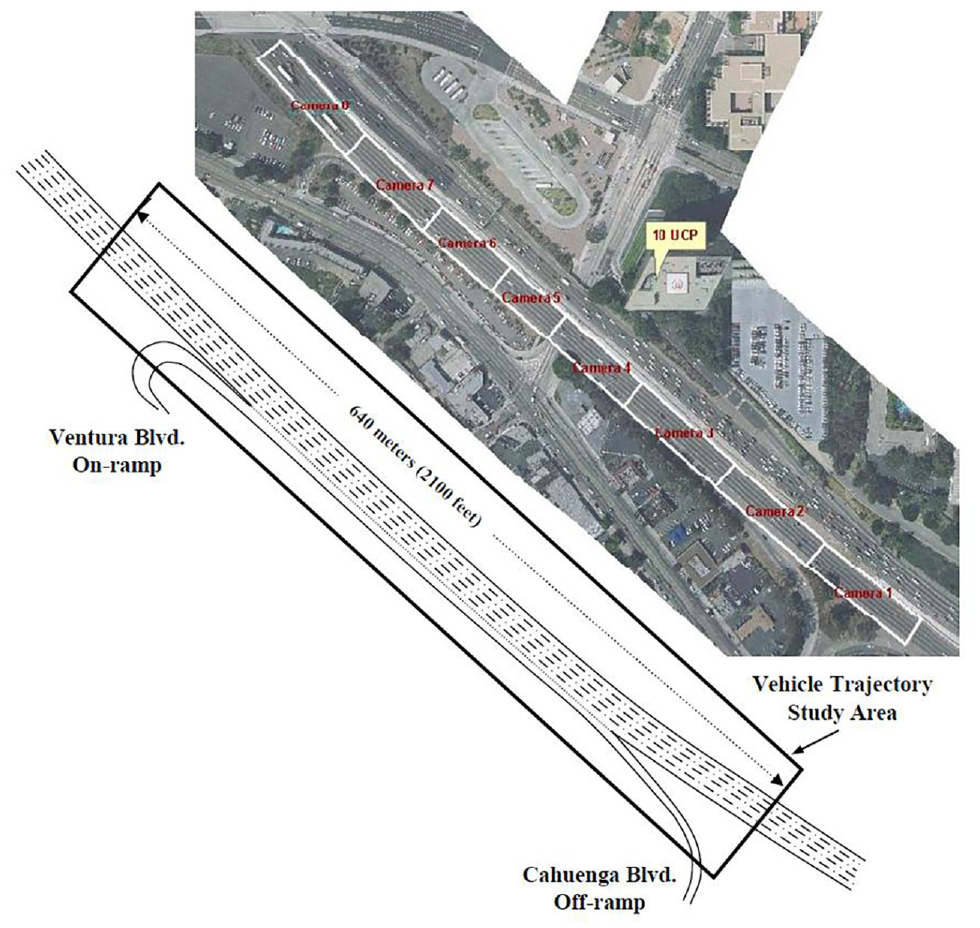
Study area (Next Generation Simulation [NGSIM]: https://www.fhwa.dot.gov/).
The following data-processing steps were conducted on the original dataset:
The on-ramp, off-ramp, and auxiliary lanes were excluded to identify discretionary lane changing.
Trajectories at lane 5 were also excluded since they were likely strongly influenced by mandatory lane changes. Thus, this study only focuses on lanes 1 to 4 where all lane changes were assumed to be discretionary and unlikely to be influenced by the mandatory lane changes associated with lanes 7 and 8.
Only vehicles that travel the entire highway segment were considered (again to remove the effects of mandatory lane changing).
Furthermore, because the (spacing) headway was included as an independent variable in the model, the downstream vehicles at the beginning of each time period that did not have any preceding vehicles running in front of them along the whole study road segment were excluded.
In addition, some vehicles with unusually large average headways (exceeding 200 ft; computed at 0.1 s intervals) were also excluded from the data, given that the focus is on congested traffic.
After above data processing, 3,492 vehicles were extracted for the three 15 min time periods mentioned above, with 1,441 vehicles in the first period (7:50–8:05 a.m.), 1,121 vehicles in the second period (8:05–8:20 a.m.), and 930 vehicles in the last period (8:20–8:35 a.m.). Then the corresponding explanatory variables included in the model (average headway, original lane identification, driver acceleration/deceleration behavior, and large vehicle indicator) were generated (detailed variable information is described later in Estimation Results).
To illustrate the resulting data, the observed vehicle trajectories are plotted in Figure 2. In this figure, the three time periods studied demonstrate the congestion build-up process, with the last period being the most congested one (as shown in the bottom sub-figure of Figure 2). The corresponding flow-density relationship is plotted in Figure 3.

Observation set trajectories.
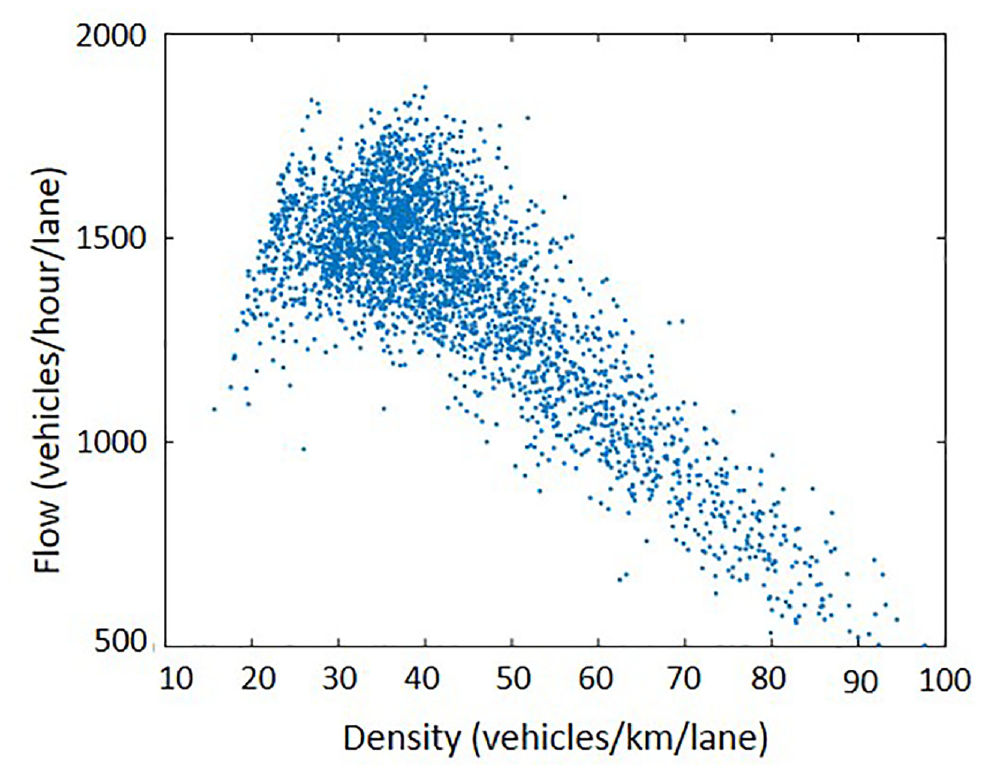
Observation set flow-density relationship.
Estimation Results
The summary statistics for the variables found to be statistically significant in model estimation are presented in Table 1. Driver acceleration/deceleration behavior is measured by the average absolute value, measured at 0.1 s increments, of vehicle acceleration (or deceleration) rates. This follows past research that showed that drivers who accelerate or decelerate abruptly (with a larger average absolute value of acceleration or deceleration) are usually considered more aggressive compared with others ( 40 ). The large vehicle indicator is defined by using the width and length to differentiate large vehicles from others, since vehicles of different sizes may have different flexibility (relating to size and acceleration/deceleration characteristics) when drivers make lane-changing choices. After extensive empirical testing, the thresholds used to define large vehicles was 7 ft for the width and 15 ft for the length.
Descriptive Statistics of Variables
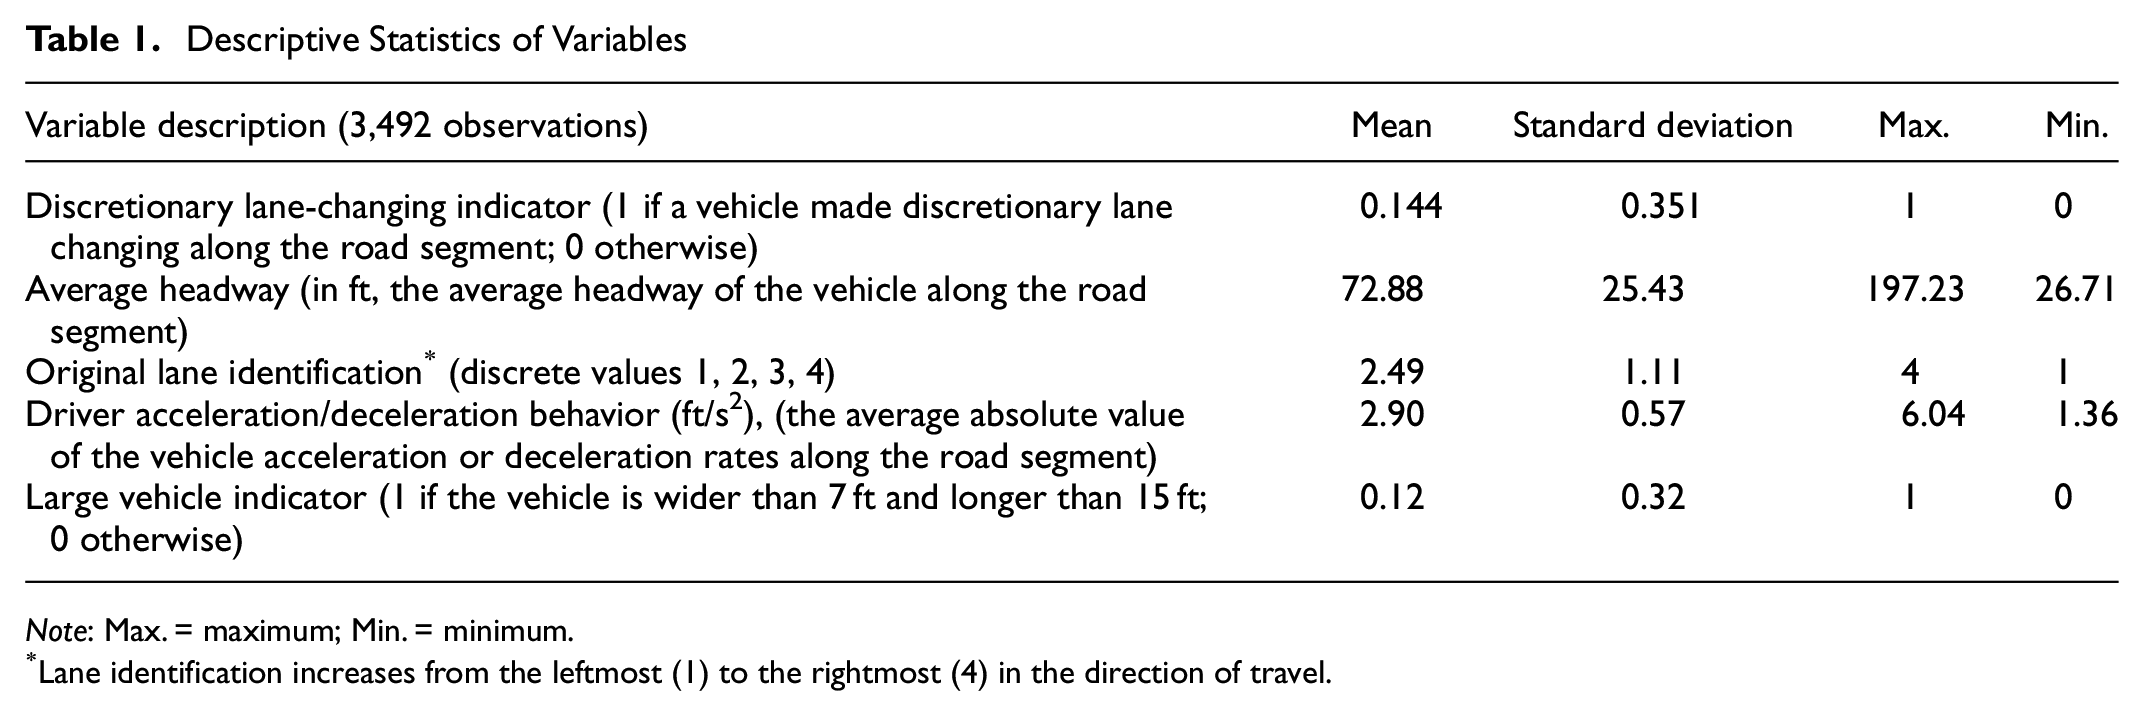
Note: Max. = maximum; Min. = minimum.
Lane identification increases from the leftmost (1) to the rightmost (4) in the direction of travel.
The detailed variable-distribution information for these variables is provided in Figure 4. Figure 4a shows that 504 out of 3,492 vehicles changed lanes during the study period. The average headway portion of this figure (the average of headways computed at 0.1 s intervals) shows that the majority of vehicles observed had an average headway less than 115 ft, which is reasonable given the congestion level of the traffic (see Figure 4b). Most drivers were moderate in their acceleration (or deceleration) rate, neither too large nor too small, as shown in Figure 4c. Originally, 24.5% of vehicles were in lane 1; 26.2% in lane 2; 25.1% in lane 3; and 24.2% in lane 4, as shown in Figure 4d. Around 12% were large vehicles with their width wider than 7 ft and length longer than 15 ft as illustrated in Figure 4e.
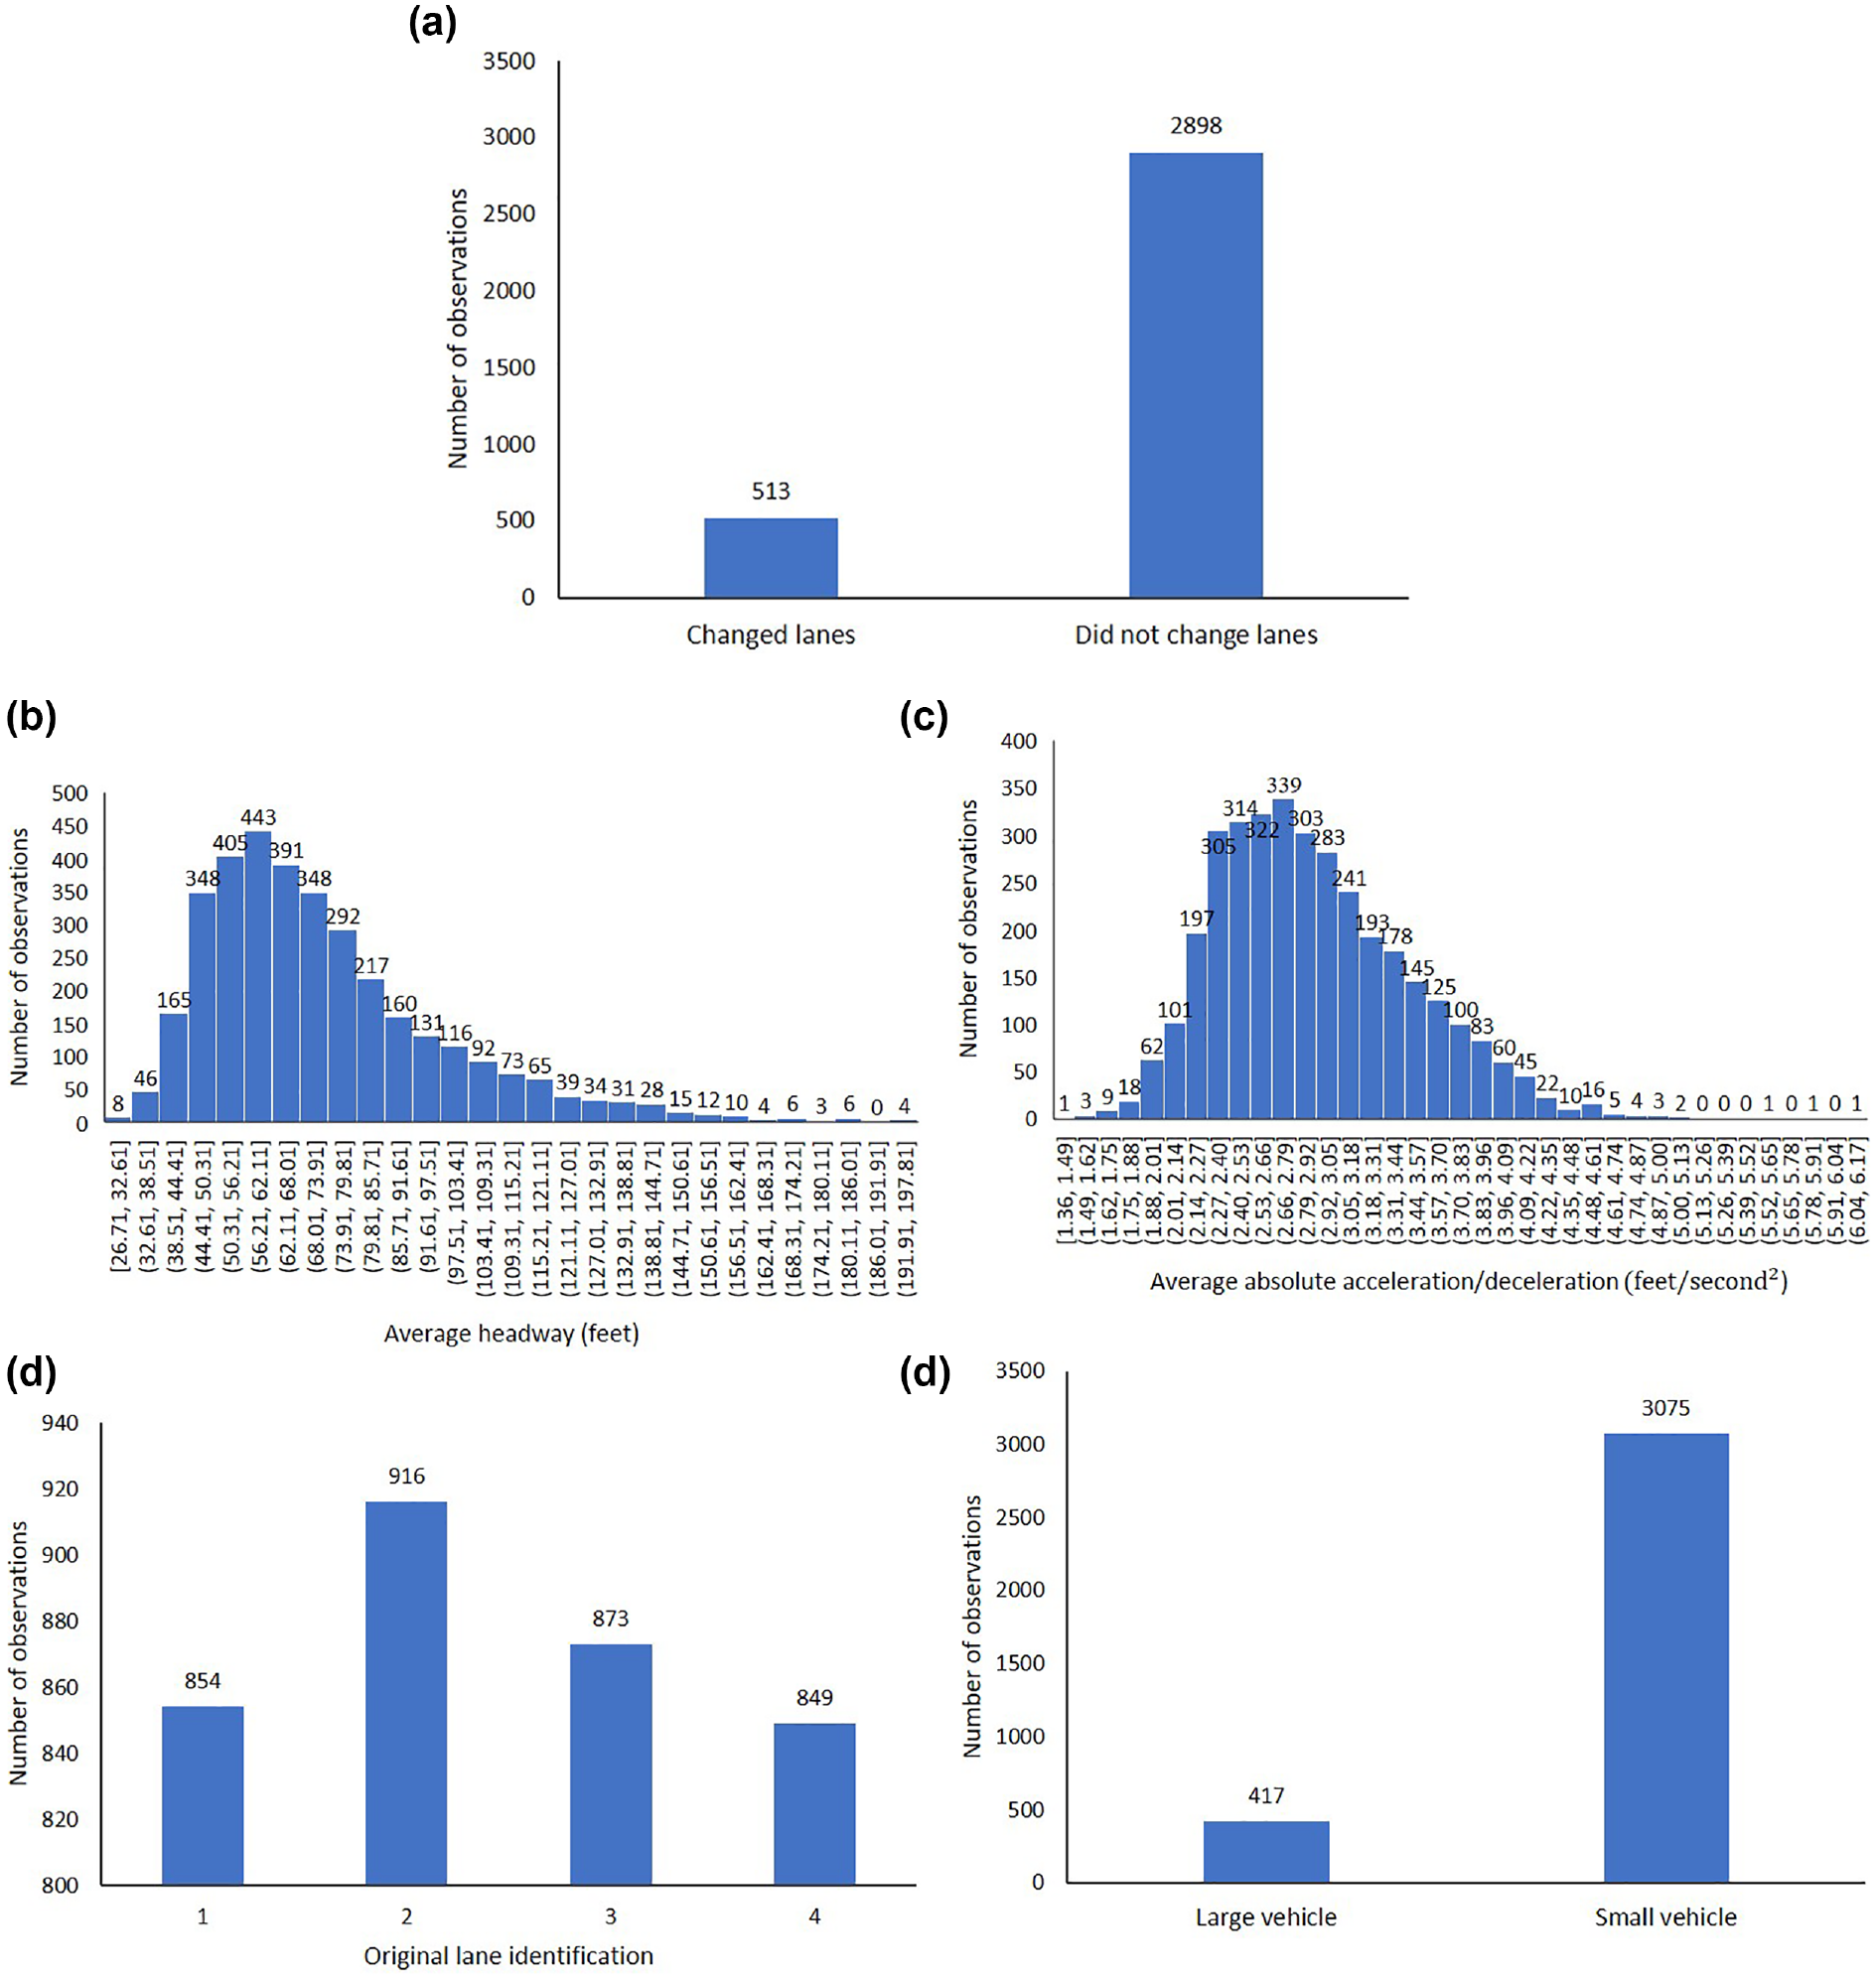
Distribution of variables used in model estimation: (a) Discretionary lane changing, (b) average headway, (c) driver acceleration/deceleration behavior, (d) original lane identification, and (e) vehicle size.
Final model estimation results are presented in Table 2. This table shows that all variables are of plausible sign and statistically significant, and that the overall model fit is quite good as indicated by the computed ρ 2 value of 0.43. In addition, the marginal effects (quantifying the impact of a one-unit change in an explanatory variable on the discretionary lane-changing probability) are of plausible magnitude. In addition, to validate the model across the data sample, several likelihood ratio tests were conducted where the data were split into subsets of data, both randomly and by time periods. In all of these tests, it was not possible to statistically reject the null hypothesis that the models estimated on the subsets of data were the same.
Random Parameters Binary Logit Model for the Discretionary Lane-Changing Probability
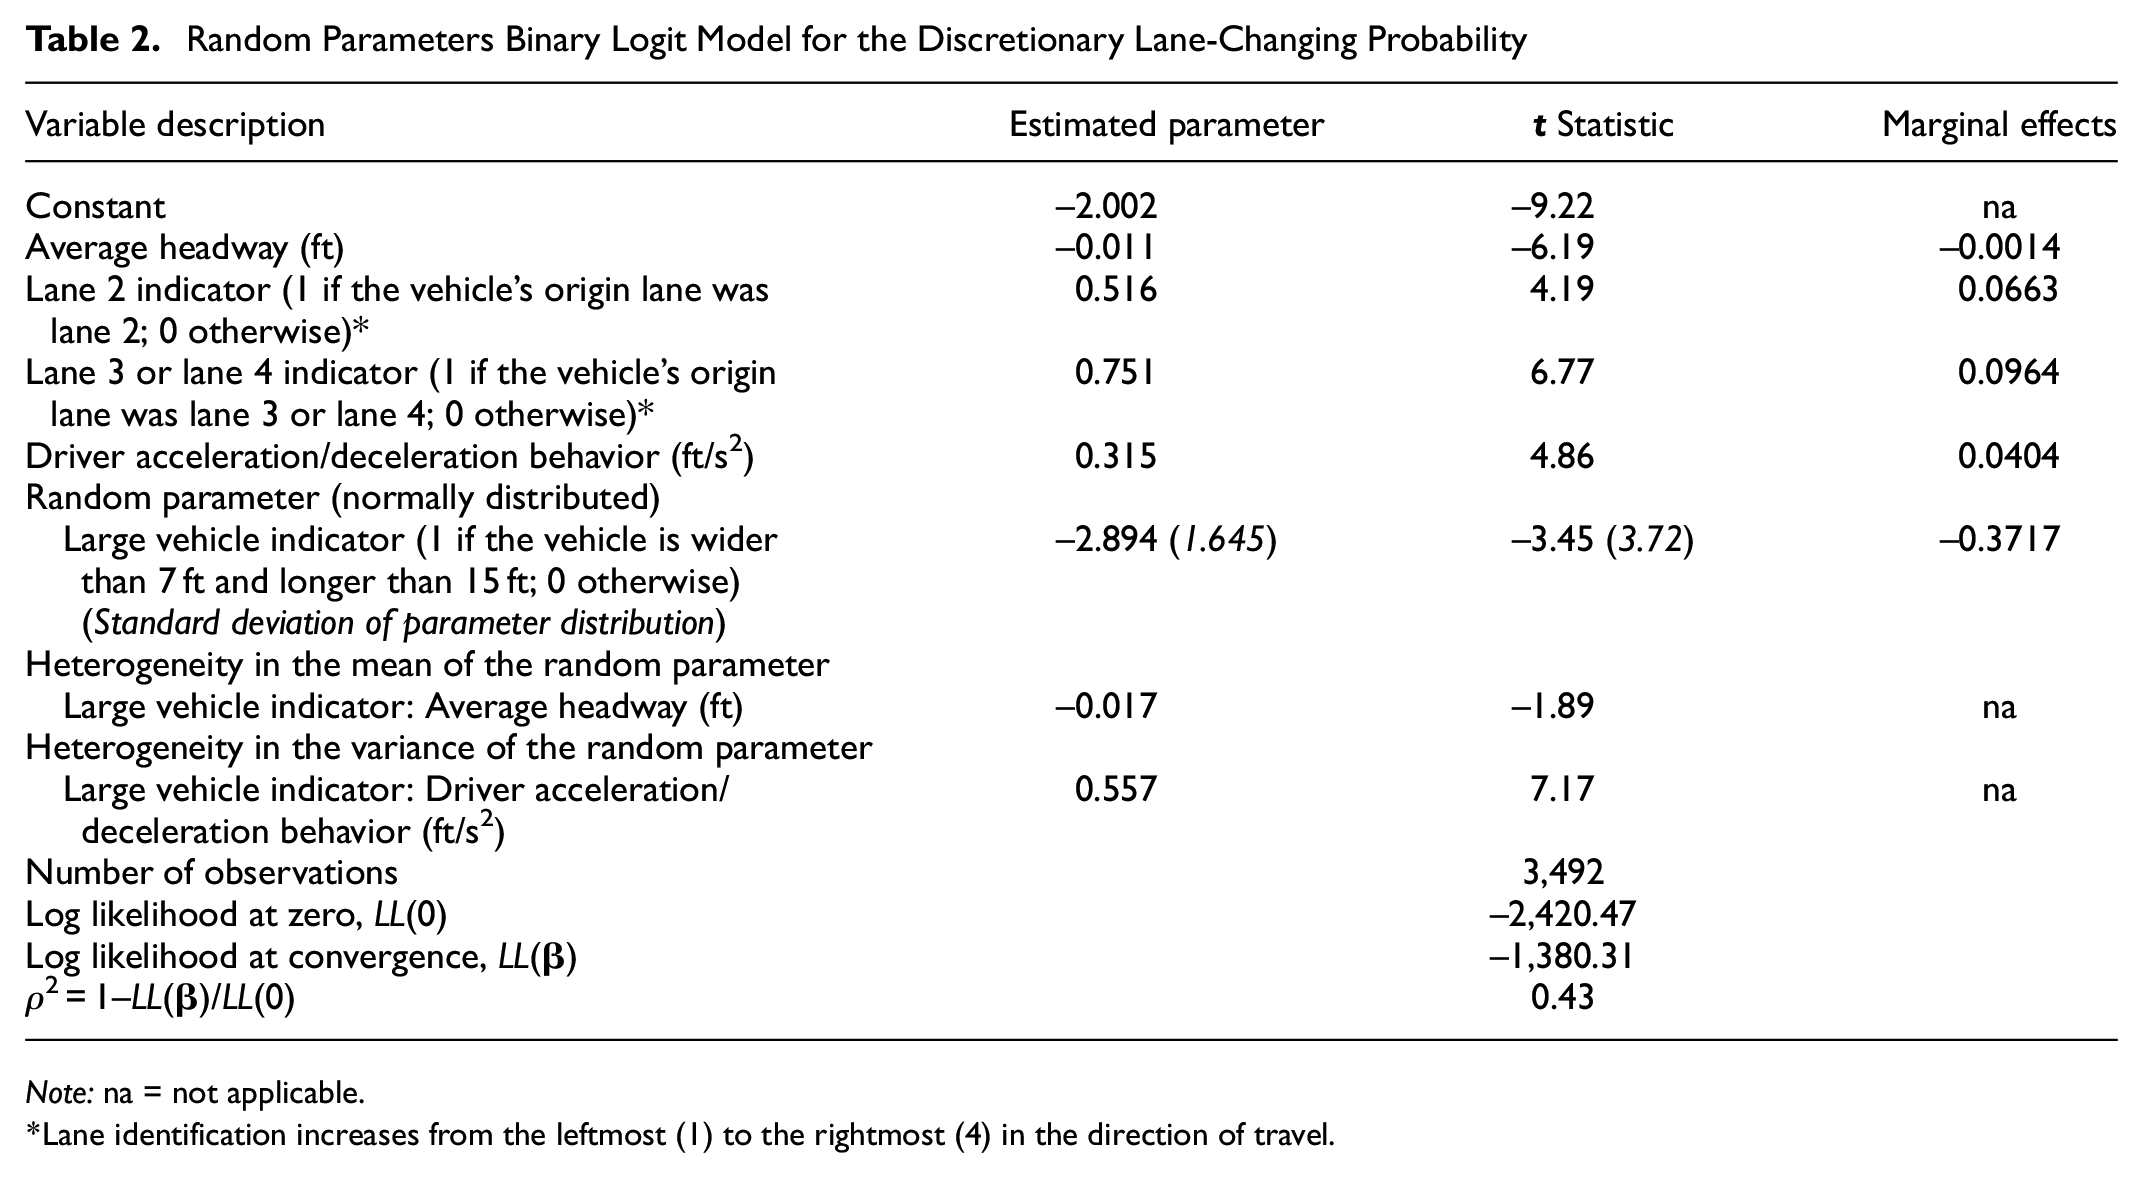
Note: na = not applicable.
Lane identification increases from the leftmost (1) to the rightmost (4) in the direction of travel.
Turning to the estimation results shown in Table 2, increases in average headways were found to decrease the probability of a lane change, which is an expected finding since a vehicle can improve its mobility by accelerating in its current lane when the headway is large enough, thus lowering the need for a lane change. The larger average headway can be also interpreted as a lower density which has been associated with lower lane-changing probabilities ( 28 ). The average marginal effect for this variable (Table 2) shows that a 1 ft increase in headway decreases the lane-change probability by 0.0014. With 14.4% of vehicles observed changing lanes, this implies that a 10 ft increase in headway would decrease the probability of changing lanes by roughly 10%, which is a finding consistent with existing literature ( 11 , 27 ).
Following on in Table 2, if a vehicle’s original lane was lane 2, the probability of this vehicle making discretionary lane changing was found to be 0.0663 higher than vehicles whose original lane was lane 1 (which is implicitly set at zero in the model estimation). And if a vehicle was originally in lane 3 or lane 4, the probability of it making discretionary lane-changing was found to be 0.0964 higher compared with vehicles traveling in lane 1 originally (again note that the lane identification increases from leftmost lane [lane 1] to rightmost lane [lane 4]). The reason for this (relative to lane 1) may be that vehicles were likely to make discretionary lane changing to gain the speed advantage provided by the leftmost lane, lane 1, and that once in this lane the lane-changing probabilities were understandably lower than other lanes ( 7 , 41 ).
As expected, higher values of driver acceleration/deceleration behavior (defined by the average absolute value, measured at 0.1 s increments, of vehicle acceleration [or deceleration] rates in ft/s2) were found to increase the likelihood of a lane change. This finding supports the earlier work of Goldbabaei who found higher speed deviations significantly increased lane-changing probabilities ( 32 ). The average marginal effect indicates that a 1 ft/s2 increase in the acceleration/deceleration resulted in a 0.0404 higher probability in the probability of a lane change.
Finally, the large vehicle indicator (a vehicle is classified as a large vehicle with a width wider than 7 ft and length longer than 15 ft) was found to decrease lane-changing probabilities, but the effects of this variable varied significantly across observations as indicated by the statistically significant random parameter. Statistically significant heterogeneity in the mean and variance were also found (Table 2). For heterogeneity in the mean, it was found that the mean of the parameter decreased with increasing headway, with each 1 ft increase in headway reducing the mean of the large vehicle indicator by 0.017 (which translates into a reduction in lane-changing probability of roughly 0.002 per ft of increased headway). This suggests that drivers of larger vehicles have a significantly lower probability than other drivers of making a lane change as the average headway increases. The heterogeneity in the variance of the large vehicle indicator parameter was found to increase with increasing driver acceleration/deceleration rates, indicating that driver behavior in large vehicles varies more as driver acceleration/deceleration rates increase. As shown in Table 2, the computed marginal effect (accounting for both heterogeneity in the mean and variance) indicates that drivers of large vehicles have, on average, a 0.3717 lower probability of a lane change relative to non-large-vehicle drivers.
Summary and Conclusion
Discretionary lane changing has been studied for decades as an essential part of traffic flow. Most existing studies model discretionary lane changing by assuming homogeneous vehicles and drivers. However, heterogeneity across vehicles and drivers clearly exists in real-world traffic flow, and much of this heterogeneity is not observed. To account for potential heterogeneity, this paper estimates a random parameters binary logit model, with heterogeneity in means and variance, using data on discretionary lane changing from US101 in California. The model estimation results show good overall statistical fit, and all explanatory variables produce statistically significant random parameters. Estimation results show that larger average headways decrease the likelihood of a lane change (less congested conditions make lane changing less likely, since improving mobility by changing lanes is less of a priority in uncongested conditions). It was also found that vehicles traveling in the right lanes (slower lanes) had a higher probability of making discretionary lane changes, presumably to improve their speed. Driver acceleration/deceleration behavior, measured as the mean absolute value of acceleration/deceleration, was found to increase the probability of lane changing. Finally, large vehicles were found to be less likely to change lanes on average (because of their size and inferior acceleration/deceleration characteristics). However, the estimated parameter of the large vehicle indicator was found to vary significantly across observations, with the mean of the parameter influenced by average headway and its variance influenced by driver acceleration/deceleration behavior. Overall, the model estimation results provide some interesting new insights in understanding discretionary lane changing, and the results provide a basis for future work.
In relation to future work, there are several fruitful directions. The most obvious would be having access to data that provided information on driver characteristics (such as age and gender), as well as information on road, lighting, and weather conditions. This expanded data would allow statistical models to more directly account for heterogeneity across vehicles, and thus reduce the reliance on mixing distributions (as shown in Equation 3) to account for unobserved heterogeneity.
There are also issues of spatial and temporal transferability that could be addressed in future work. That is, comparing model estimation results using data from different locations to determine if the results are spatially transferable, and using data from the same location in different time periods (perhaps a year apart) to study if lane-changing behavior is temporally stable, or if drivers are changing their behavior in response to changes in vehicle technologies and other factors, which has been shown to be an important issue in recent empirical studies ( 42 ).
Finally, there is the issue of the data used in this study being confined to the morning peak period. While the morning peak is clearly an important time to study lane-changing behavior, there is a body of literature that suggests that driver behavior may change by time of day ( 43 ). Thus, some caution should be used when applying the findings in this paper to other times of day, and exploring time-of-day effects on lane-changing behavior may be a fruitful direction for future research.
Footnotes
Author Contributions
The authors confirm contribution to the paper as follows: study conception and design: Qianwen Li, Xiaoepeng Li, Fred Mannering; data collection: Qianwen Li; analysis and interpretation of results: Qianwen Li, Xiaopeng Li, Fred Mannering; draft manuscript preparation: Qianwen Li, Xiaopeng Li, Fred Mannering. All authors reviewed the results and approved the final version of the manuscript.
Declaration of Conflicting Interests
The author(s) declared no potential conflicts of interest with respect to the research, authorship, and/or publication of this article.
Funding
The author(s) disclosed receipt of the following financial support for the research, authorship, and/or publication of this article: This study is supported by: the National Science Foundation through Grant No. CMMI #1558887; the Center for Teaching Old Models New Tricks (TOMNET), a University Transportation Center (UTC), sponsored by the U.S. Department of Transportation (U.S.DOT), through Grant No. 69A3551747116; and the Center for Transportation, Environment, and Community Health (CTECH), a UTC sponsored by U.S.DOT, through Grant No. 69A3551747119.