




Abstract
Research has consistently demonstrated that seatbelt use is critically important in reducing the likelihood of fatal and serious injuries resulting from traffic crashes. However, after years of nationwide increases in seatbelt use, these rates have largely plateaued, motivating the need for research to better understand those circumstances under which seatbelt use remains relatively low. At an aggregate level, research has shown that occupants in the same vehicle tend to exhibit correlation in seatbelt use or non-use. This suggests that social dynamics may play a role in occupants’ decisions as to whether or not to wear a seatbelt. To that end, this study examines trends in seatbelt use among pairs of drivers and front-seat passengers using data from direct observation roadside surveys. Bivariate probit models are estimated to examine the relationship between seatbelt use and various demographic, vehicle, and site-specific factors. The bivariate framework is also able to account for correlation among important unobserved factors associated with seatbelt use. The results show significantly better fit as compared with independent univariate probit models. The results also suggest both direct and indirect relationships between seatbelt use and various demographic, vehicle, and site characteristics. Seatbelt use rates are found to vary based on occupants’ age, gender, and race. Furthermore, seatbelt use by both the driver and front-seat passenger is also shown to vary based on the other occupant’s age. Heterogeneity is also shown across various geographic regions and roadway functional classes.
Research on road safety continues to attract considerable interest because of the heavy societal toll resulting from traffic crashes, including lost productivity and associated healthcare costs ( 1 ). In the United States, traffic crashes are the third leading cause of death among persons between 1 and 44 years of age ( 2 ). In 2018, 22,697 (62.1%) traffic fatalities occurred among occupants of passenger vehicles and light trucks. Among these fatally injured occupants, 9,778 (43.1%) were unrestrained at the time of the crashes ( 3 ). These statistics are troubling as traffic safety research has conclusively demonstrated that the use of seatbelts is perhaps the single most effective means of reducing fatal and non-fatal injuries in traffic crashes ( 4 ). Research indicates that the use of seatbelts reduces the risk of fatal injury to front-seat occupants by 45% in passenger cars and 60% in light trucks. Seatbelt use also reduces the risk of moderate to critical injury by 50% and 65% among occupants of these same vehicle types, respectively ( 5 ). In 2017, the use of seatbelts in passenger vehicles saved an estimated 14,955 lives of occupants aged 5 years and older ( 6 ). An additional 2,549 lives could have been saved only in 2017 if all unrestrained passenger vehicle occupants 5 years and older involved in fatal crashes had worn their seatbelts ( 6 ).
According to the National Occupant Protection Use Survey (NOPUS) ( 7 ), seatbelt use rate has increased from 83.1% in 2008 to 90.9% in 2019 across the United States ( 8 ). While substantial efforts have been made to increase seatbelt use, nearly 10% of drivers and front-seat passengers continue to travel unrestrained. These seatbelt use rates vary significantly across states with these differences being at least partially attributable to whether a state has a primary or secondary seatbelt law. In states with primary laws, a driver can be stopped and cited solely for not wearing a seatbelt. In contrast, secondary law states require a driver to be stopped for a reason other than non-seatbelt use. The most recent national statistics show that states with primary laws exhibit an average seatbelt use rate of 92.0%, which is significantly higher than the 86.2% seatbelt use rate among states with secondary laws ( 8 ). Michigan is a primary law state and its 2019 seatbelt use rate was 94.4%, making it one of 27 states with seatbelt use rates higher than 90% ( 9 ).
Given the compelling evidence as to the efficacy of seatbelt use, identifying those factors related to non-seatbelt use is critical to the development of policies and programs to further increase seatbelt use rates. Recent research suggests that part-time seatbelt users can be heavily influenced by the seat seatbelt status of their traveling companions, with seatbelt use rates also varying depending on the occupant’s gender and the type of vehicle ( 10 ). Further research is warranted to better understand potential social dynamics that may influence seatbelt use.
To that end, this study examines the factors that are associated with seatbelt use among drivers and front-seat passengers. An analytical framework is applied that allows for discerning differences in seatbelt use rates among front-seat occupants in the same motor vehicle while simultaneously accounting for unobserved heterogeneity in use rates because of important unobserved factors that may affect the seatbelt use decision of the driver, front-seat passenger, or both parties. The results further our understanding of how seatbelt use rates vary across occupants in consideration of both observed and unobserved factors.
Literature Review
Previous research indicates various sociodemographic (e.g., age, race, gender), environmental (e.g., roadway type), and vehicle (e.g., type, use) characteristics are associated with the likelihood of an occupant using a seatbelt (11–13). An early study on seatbelt use and other health-related behaviors involved the collection of data through a state-based surveillance system, the Behavioral Risk Factor Surveys (BRFS) ( 14 ). With technical assistance from the Centers for Disease Control and Prevention, data were collected from over 22,000 adults across 28 states and the District of Columbia between 1981 and 1983 ( 15 ). Analyses of these data showed that men, African Americans, individuals aged between 18 and 24 years, and persons with high school education or lower are less likely to use seatbelts ( 16 ). Several subsequent studies confirm that gender plays a role in seatbelt use and that female drivers and passengers are more likely to be belted as compared with their male counterparts (17–19).
Prior research also shows that persons in their teens and early twenties have the lowest seatbelt use rates as compared with other age groups, while older persons have the highest seatbelt use rate (17, 20, 21). A study based on a national field survey in Greece found that the lowest rates of seatbelt use among drivers were observed among younger (16–24 years old) men, but also among older men (55 years and above). Passengers were also less likely to wear seatbelts compared with drivers ( 22 ). Other studies have shown that African Americans are less likely to use seatbelts than persons of other races (18, 19, 23). According to the NOPUS, the seatbelt use rate was approximately 8% lower for African American occupants compared with that for Caucasians ( 19 ). A prior Michigan study found that drivers aged between 16 and 29 years, as well as drivers of pickup trucks, were the least likely to use seatbelts, as were drivers of commercial vehicles and those in rural counties ( 24 ). On the other hand, drivers traveling with either younger (less than 15 years) or older (60 years and above) passengers, female drivers, and Caucasian drivers were found to be more likely to use seatbelts. Seatbelt use in commercial vehicles, regardless of the vehicle size, is observed to be generally lower than in non-commercial vehicles, as confirmed by several prior studies (24, 25). This may be because trips in such vehicles may require frequent stops or passenger assistance (24, 26). Seatbelt use for occupants traveling in light commercial vehicles is also generally lower than that of non-commercial motorists ( 27 ).
Studies also indicate that drivers of pickup trucks were less likely to use seatbelts as compared with the drivers of other vehicle types (18, 28). Direct observation studies typically found the seatbelt use rate to be approximately 10% to 12% lower for these motorists (19, 29). Analysis of data from the National Highway Traffic Safety Administration (NHTSA) Fatality Analysis Reporting System (FARS) ( 30 ) indicates that policies and law enforcement should focus on pickup trucks, rural roads, passengers (as opposed to drivers), and male and young (16–25 years old) motor vehicle occupants ( 25 ). Another study found lower seatbelt use by pickup truck drivers, who were primarily middle-aged (30–39 years) males, have higher household incomes, and lower educational levels ( 31 ).
The driving context is also important as studies show that motorists traveling in rural areas have lower seatbelt use rates than those in suburban or urban areas (17, 19, 29). This lower seatbelt use, in particularly rural areas, is of concern because such areas are also prone to higher rates of fatal and severe injury traffic crashes ( 32 ). Using the data from the BRFS, a study showed that persons in the most densely populated metropolitan areas were significantly more likely to report always wearing their seatbelts compared with more sparsely populated rural areas. In most urban counties with a population of more than one million, the difference in seatbelt use rate between areas with primary laws and those with secondary laws was 6.9%. However, in most rural counties, this difference increased to 17.2%. This could also be attributed, in part, because pickup trucks are more common in rural areas and seatbelt use is lower among occupants of such vehicles ( 28 ).
Studies have also shown interesting dynamics with respect to the seatbelt use rates of occupants in the same vehicle. Comparisons of seatbelt use rates in different metropolitan areas showed that driver use rates are consistently higher than those of passengers (22, 33). These differences are particularly pronounced in developing countries, such as Ghana, where one study found that drivers were approximately 3.6 times more likely to wear seatbelts than front-seat passengers ( 33 ). Overall seatbelt use rates were only 17.6% among drivers and only 4.9% among passengers, which the authors attribute to ignorance of the benefits of seatbelt use, as well as low levels of enforcement ( 33 ). Within the same vehicle, seatbelt use rates tended to be correlated between drivers and front-seat passengers, a finding that has been shown by additional studies in both the U.S. (18, 34, 35) and abroad ( 36 ).
Additionally, the interaction effects have also been shown with respect to the age of occupants of the same vehicle. For example, seat seatbelt use among teenage drivers was shown to be higher when they were accompanied by older adults and lower when the passenger was of similar age ( 37 ). The same study showed that the seatbelt use rates among teenage drivers decreased with increasing number of passengers, while the opposite trend was exhibited by older drivers. These interrelationships are particularly pronounced at night as the odds of a front-seat passenger being unbelted was shown to be 14 times higher if the driver was also unbelted ( 10 ). Several other studies have shown correlation in seatbelt use rates between drivers and front-seat passengers (18, 34, 35), with these differences.
To summarize, numerous prior studies have been conducted to identify different underlying factors that affect seatbelt use by motor vehicle occupants. Overall, attributes including age, gender, race, education, and the income level of the occupants, type and use of vehicles, and site characteristics have been recognized to be associated with the decision to use seatbelts. However, additional research is warranted to better understand patterns of seatbelt use rates among occupants in the same vehicle.
Data
Data Collection
Data for this study were collected through a series of annual direct observation surveys from 2013 through 2017. The surveys were designed in compliance with the Uniform Criteria for State Observational Surveys of Seat Belt Use ( 38 ) established by the NHTSA. These surveys were conducted at 200 roadside locations in counties that comprise 85% of all passenger vehicle fatalities in Michigan. In total, 33 out of all 83 counties in Michigan were selected to be included in the survey.
The counties were stratified into four groups according to the historical seatbelt use rates. These strata were constructed such that the annual vehicle miles traveled (VMT) were approximately balanced across each of the four groups. Stratum 1 consists of counties that historically have higher seatbelt use rates, while stratum 4 has shown the lowest seatbelt use rates. The counties in stratum 1 are generally associated with higher education and income levels. Stratum 2 contains a mix of urban or suburban and some rural counties, while stratum 3 consists mostly of rural counties.
Within each seatbelt use strata, a total of 50 road segments were selected from interchanges and intersections controlled by stop signs or traffic signals. These segments consisted of 15 primary roads, 30 secondary roads, and five local roads in each stratum. Rural local roads in counties not within Metropolitan Statistical Areas (MSAs), other non-public roads, unnamed roads, unpaved roads, vehicular trails, access ramps, cul-de-sacs, traffic circles, and service drives were excluded from the dataset. Figure 1 shows the counties chosen in Michigan for the site selection, classified by their respective stratum.

Selected counties for direct observation seatbelt use surveys.
The surveys were conducted for exactly 60 min at each site during between 7:00 a.m. and 7:00 p.m. The day of week for each survey was randomly determined after the sites were clustered to minimize travel costs. All passenger vehicles weighing less than 10,000 lb were eligible for observation. Only one direction of traffic was observed at any given site. The observed categories for the seatbelt use included belted correctly, not belted correctly, and unknown seatbelt use. The only front-seat occupants excluded from this study were children seated in child seats with harness straps. Additional data were collected for each observed front-seat occupant including occupant’s age, gender, and race, as well as vehicle type and use information. Traffic volume was also counted with a hand-held tally device through the observed lanes during the 60-min observation period, regardless of whether a seatbelt observation was performed. This volume count was then used during the seatbelt use weighting process. Additional roadway-related data, including the posted speed limit and the number of lanes on each road was determined from the Google aerial photography ( 39 ). Moreover, the National Functional Classification (NFC) ( 40 ) of each road was determined from a website maintained by the Michigan Department of Transportation (DOT) ( 41 ). Overall, a total of 230,219 motor vehicles occupied by 230,219 drivers and 57,776 front-seat passengers were observed excluding the unknown observations during the five-year analysis period.
Data Summary
Descriptive statistics for variables associated with the drivers, front-seat passengers, vehicles, and sites included in this study are presented in Table 1. This includes the frequency with which each category of these variables was observed, as well as the percentage of the total sample that each category accounts for.
Summary Statistics from Observational Surveys (n = 57,776)

Note: SUV = sport utility vehicle.
As can be seen from Table 1, approximately 95% of drivers and 93% of front-seat passengers were belted. Both of these figures are higher than the comparable national seatbelt use rates reported by NHTSA ( 8 ). While females account for only 34.3% of the drivers, they represent 63.2% of all passengers. The largest proportion of both drivers and passengers were middle-aged (30–59 years), followed by the young occupants (16–29 years) in both populations. Passenger cars were the most common vehicle type (39.7%), followed by sport utility vehicles (SUVs) (31.5%), pickup trucks (15.5%), and vans or minivans (13.3%). Approximately 3.7% of vehicles were classified as commercial in nature (e.g., delivery drivers, landscaping personnel, taxi drivers). Roughly 75% of the observations occurred upstream of signalized intersections with the balance occurring upstream of stop-controlled locations. The vast majority of the observation sites included either one or two lanes in the observation direction. The posted speed limits of these roads ranged from 25 to 75 mph. For the most part, data collection occurred under clear weather conditions, with some observations under light rain or fog. Data collection events were not conducted if the weather conditions significantly inhibited visibility. In such instances, observation periods were rescheduled for the same day and time during the subsequent week.
Statistical Methods
This study analyzes the factors that are associated with seatbelt use among both drivers and front-seat passengers. Because the dependent variables consist of binary indicators (i.e., the driver or passenger was either belted or not), discrete outcome models are an appropriate analysis framework. Given concerns as to potential correlation in seatbelt use among the front-seat occupants in the same vehicle, bivariate probit models are well suited to the context of this study.
Before estimating the bivariate models, a series of univariate probit models were estimated separately for drivers and front-seat passengers. These models were used to identify variables that were associated with seatbelt use among either party, before estimating the bivariate models, which are more computationally intensive. The primary advantage of the bivariate probit models is that it is able to account for the common unobserved factors that are associated with the seatbelt use among drivers and passengers in the same vehicle ( 42 ). This results in more efficient parameter estimates as compared with the estimation of univariate models ( 43 ). The generic form of a bivariate probit model can be expressed as:


where
The correlation in these error terms is quantified by ρ, which represents the correlation in seatbelt use rates after accounting for the measurable characteristics. Dependent variables


The parameters of the bivariate probit can be estimated by maximum likelihood with the log-likelihood function expressed as ( 44 ):

where (
Results and Discussion
For the purposes of this study, observations were included only where both a driver and a front-seat passenger were present in the vehicle. Ultimately, the total sample included 57,776 such observations after removing those observations with unknown or missing data. Once these data were compiled, separate univariate probit models were estimated for both driver and front-seat passenger seatbelt use. If a variable was found to be statistically significant at a level of α = 0.1, then the variable was included in the bivariate probit model that was subsequently estimated.
Table 2 presents the results of the final bivariate probit model for driver and front-seat passenger seatbelt use. These results include parameter estimates, standard errors, t-statistics, and p-values for each variable of interest. As noted previously, the dependent (seatbelt use) variables are binary indicators, which are equal to one for cases where the occupant was belted and zero when they were unbelted. As such, when interpreting the parameter estimates, a positive parameter is indicative of a factor that is associated with higher seatbelt use rates while a negative parameter is reflective of lower use rates of the front-seat occupants.
Results of Bivariate Probit Model for Driver and Front-Seat Passenger Seatbelt Use

Note: na = not applicable. These categories correspond to baseline conditions for each variable. Each of the other categories is compared against this baseline condition.
After estimating the bivariate model, likelihood ratio tests (LRT) were conducted to compare the goodness-of-fit between the bivariate and univariate models. This LRT statistic is calculated as twice the difference in the log-likelihoods between the bivariate model (LL = –23,932.92) and the sum of the log-likelihoods for the univariate models (–25,219,60). The resulting test statistic is equal to 2573.36, which is distributed as chi-squared with degrees of freedom equal to the difference in the number of parameters between the bivariate model and the total parameters in the univariate models (df = 15). Consequently, the bivariate model shows significantly better fit (p-value < 0.001).
The correlation parameter, ρ, is equal to 0.615, which suggests a strong positive correlation (p-value < 0.001) in seatbelt use rates between the two occupants, even after controlling for the effects as captured by the explanatory variables. This suggests the presence of common unobserved factors that affect both the driver’s and front-seat passenger’s proclivity toward wearing a seatbelt. This may include factors such as income or education level, degree of risk aversion, or factors related to the vehicle such as warning systems for non-seatbelt use. Identifying the nature of such variables may provide useful insights that could be used in campaigns or programs targeted at increasing seatbelt use rates.
The remainder of this section provides a discussion of how seatbelt use varies across front-seat occupants while controlling for the effects of important occupant- and site-specific factors. In addition to these variables, several additional parameters of interest were also investigated, but were not found to be statistically significant. This included the weather conditions and the type of traffic control at each site. Several additional variables were investigated at the census-tract level, including the level of educational attainment, household income, and family size. However, these variables also did not show any meaningful trends, and it should be noted that the degree to which such tract-level statistics would be reflective of front-seat occupants who are observed in these same geographic areas in unclear.
Prior research has shown that seatbelt use rates vary depending on whether a passenger is present and the magnitude and direction of these effects also depend on the ages of the respective drivers and passengers. Consequently, as a part of this analysis, all 12 combinations of driver and front-seat passenger ages were explicitly considered (i.e., 3 driver age groups × 4 passenger age groups). In cases where the seatbelt use rates were not significantly different from one another, these groups were combined in the final empirical model.
For comparison’s sake, Figure 2 displays the marginal mean seatbelt use rates for each of these age combinations. These mean seatbelt use rates are calculated while holding all other variables at their average values. It is interesting to note that, in all cases, the seatbelt use rates among drivers are higher than those of the front-seat passengers. Furthermore, the driver and passenger seatbelt use rates increase (or decrease) consistently. When the use rates between drivers and front-seat passengers are compared, the age group combinations show that the seatbelt use rates are higher by 2% to 3% among drivers for all age combinations.
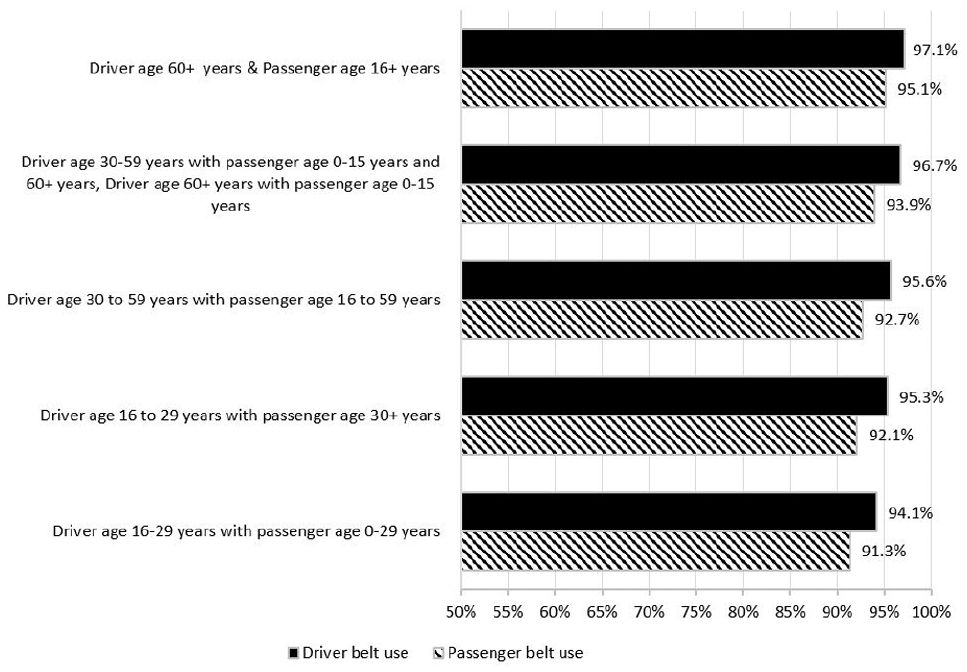
Average seatbelt use rates among drivers and front-seat passengers by age groups.
Results also reveal that the seatbelt use rates are the highest among vehicles where the driver is 60 years old or above. The highest seatbelt use rates occurred in vehicles in which the driver was 60 years old or above and the front-seat passengers were 16 years old and above. Old drivers (60 years and above) showed an average seatbelt use rate of 97.1%, which was marginally higher than the seatbelt use rate for these same drivers when their passengers were in the youngest group (age less than 16 years). These findings are reflective of the broader research literature (17, 21, 23) and may be attributed to greater risk aversion or more cautious driving habits among this oldest and most experienced group of drivers.
It is interesting to note that seatbelt use rates were slightly lower among the oldest group of drivers when their passengers were in the youngest age group (less than 16 years of age). These use rates were lower among both the drivers (96.7%) and front-seat passengers (93.9%). It is unclear what the reasons are for these differences, though prior research has shown that older drivers tend to feel more anxious, with higher tension and stress levels, when driving with young passengers (e.g., grandchildren) in the vehicle ( 45 ).
Also consistent with the broader literature, seatbelt use rates were consistently lower among the youngest group of drivers (ages 16–29 years). The seatbelt use rates tended to be lowest when these young drivers were accompanied by younger passengers (ages 0–29 years) as these groups exhibited seatbelt use rates of 94.1% and 91.3%, respectively. As with the oldest group of drivers, it is somewhat surprising to see lower seatbelt use rates when children were present as front-seat passengers. In fact, only the middle age group (ages 30–59 years) of drivers showed higher use rates when front-seat passengers were in the youngest age group. This reinforces prior research that suggests drivers are more risk-averse when they have the responsibility of passengers, especially when the general well-being of the passengers is important to the drivers (e.g., old parents or young children) ( 24 ).
With respect to the other demographic variables, significant differences emerge with respect to gender and race. Females showed higher seatbelt use rates as both drivers and passengers, while males showed lower use rates as has been shown in the existing literature (17, 18). An interesting side note here is that the front-seat passengers of male drivers also tended to exhibit lower seatbelt use rates (and passengers of female drivers showed higher use rates). No such effect was observed with respect to the gender of the passenger (i.e., passenger gender had no influence on driver seatbelt use).
Turning to race, black drivers were less likely to wear seatbelts than drivers of other races, as were black passengers, findings that were also consistent with previous studies (18, 23). As in the case of gender, indirect effects were also observed here as passengers of black drivers and drivers with black passengers both tended to show lower seatbelt use rates when compared with other groups of races. Collectively, the findings with respect to demographic characteristics suggest that intervention campaigns focused on younger drivers, male drivers, and black drivers are likely to have the greatest potential for increasing seatbelt use rates.
Seatbelt use was also shown to be correlated with the type of vehicle. As compared with the occupants of passenger cars, those in sport utility vehicles and, particularly, vans or minivans were more likely to wear seatbelts. Conversely, seatbelt use rates were markedly lower among both drivers and passengers in pickup trucks. This group continues to exhibit lower seatbelt use rates and, relatedly, higher fatality rates (18, 28).
Differences also emerged with respect to contextual factors. Seatbelt use rates continue to be the highest in strata 1 and 2 as compared with strata 3 and 4. Compared with the historical seatbelt use rates, these gaps have decreased over time ( 24 ), though these differences still persist. Generally speaking, stratum 3 is comprised of rural locations while stratum 4 includes the City of Detroit and several adjacent locales. In contrast, strata 1 and 2 are comprised of counties with higher incomes and education levels, in addition to being more suburban in nature. Similarly, occupants who were observed in vehicles traveling on local roads were less likely to wear their seatbelts. This may be partially because such roads generally accommodate shorter trips and lower travel speeds. As such, there may be less of a perceived need to wear seatbelts.
Summary and Conclusion
This study examines trends in seatbelt use among pairs of drivers and front-seat passengers in the same vehicle using data from 200 sites across 33 counties in Michigan. Data were collected through a series of annual direct observation roadside surveys from 2013 through 2017. Vehicle type and use were observed for each observation, along with each front-seat occupant’s seatbelt use, age, gender, and race. Overall, a total of 57,776 observations were analyzed in which both a driver and a front-seat passenger were present in a motor vehicle, using bivariate probit models.
Ultimately, the results provide important insights to aid in programs aimed at improving seatbelt use rates. The findings provide general support for the research literature, in addition to identifying some interesting trends in seatbelt use among occupants of the same vehicles. The results also improve our understanding of specific subgroups where seatbelt use lags behind. The primary findings from this study are briefly summarized here:
The results show seatbelt use rates to be the lowest among occupants who are young, male, or African American. This finding is largely consistent with prior research and these groups represent demographic groups who can be targeted by subsequent public awareness campaigns.
There was strong positive correlation in seatbelt use rates among front-seat occupants of the same motor vehicle. That is, if a driver or passenger is belted, the other occupant of the same vehicle tends to be belted, as well. This finding suggests potential social norms where occupants adjust their behavior based on the behaviors and expectations of others in the vehicle.
Seatbelt use rates tended to increase consistently with age among both drivers and front-seat passengers. Interestingly, while seatbelt use tended to be lowest among the youngest occupants, these rates tended to be higher when these occupants shared the vehicle with another older driver or passenger. Similarly, use rates in the vehicle tended to be lowest when both passengers were in the youngest age groups.
This correlation in seatbelt use rates among front-seat occupants of the same motor vehicle exists even when accounting for the relationships with respect to the demographic characteristics of the driver and front-seat passenger.
The results show bivariate probit models to provide an appealing analytical framework for the analysis of seatbelt use data. This model structure shows improved efficiency as compared with a series of univariate probit models and also allows for estimation of the correlation in the seatbelt use decisions among occupants of the same vehicle.
As the data in this study were collected via direct observation surveys, it will be challenging to provide additional insights into what unobserved factors may contribute to this correlation. This is because of practical limitations as to the amount of data that can be accurately collected through roadside surveys.
Future research is warranted in several areas. First, it would be interesting to explore how the interaction in seatbelt use decisions among occupants of the same vehicle translates to other areas both in the United States and abroad. For example, it is anticipated that similar trends would be observed in states that are most similar to Michigan in relation to socioeconomic and demographic characteristics, as well as traffic laws. To this end, an area of particular concern would be the degree to which these trends hold in states with secondary seatbelt enforcement laws as Michigan is a primary law state ( 9 ). Generally speaking, use rates continue to be quite high across the U.S., with some exceptions such as Native American reservations, though research has also shown improvements in these areas ( 46 ).
Internationally, rates have been lower in various countries, with these differences being attributed to various factors such as a higher acceptability of risky behavior ( 47 ), a general lack of awareness of safety and the benefits of restraint use, and limited enforcement ( 48 ). A lack of resources and general delays in introducing mandatory seatbelt use laws have been recognized as particular issues in low- and middle-income countries ( 49 ).
Follow-up research is also warranted that uses alternative approaches, such as interventional or case control studies, supplemental surveys, or focus groups, which would allow for an exploration of differences due across demographic attributes and the consideration of psychological factors. Alternately, naturalistic driving study data present a promising approach that can integrate data from real-world driving events with rich information characterizing the demographic characteristics, background, and experiences of the study participants.
In addition to the alternative means for data collection, other methodological approaches may allow for the identification of additional relationships that help to explain decisions as to seatbelt use. For example, random parameter models and latent class models present alternative frameworks that can accommodate the unobserved heterogeneity that is common in such studies.
Lastly, this study has several important limitations that must be stated. First, the data are collected from the roadside upstream of signalized and stop-controlled intersections. While the data collectors attempt to remain inconspicuous and are instructed to observe moving vehicles on the approach to the intersection (as opposed to stopped vehicles), it is unclear how well these trends may reflect travel on other portions of the roadway network. It is also important to note that seatbelt use, as well as all other variables of interest, are collected by trained observers. As such, errors are to be expected with respect to the data collection process, particularly for variables that require careful judgment such as age or race. While all data collectors undergo extensive training or repeatability and reliability, there may be some error that is necessarily introduced as a consequence of the data collection method. This is another area where naturalistic driving data may provide some advantages given the availability of cameras both outside and within the motor vehicle during normal travel.
Footnotes
Author Contributions
The authors confirm contribution to the paper as follows: study conception and design: P. Savolainen, T. Gates; data collection: P. Savolainen, T. Gates; analysis and interpretation of results: M. Chakraborty, H. Singh, P. Savolainen; draft manuscript preparation: M. Chakraborty, H. Singh, P. Savolainen. All authors reviewed the results and approved.
Declaration of Conflicting Interests
The author(s) declared no potential conflicts of interest with respect to the research, authorship, and/or publication of this article.
Funding
The author(s) disclosed receipt of the following financial support for the research, authorship, and/or publication of this article: The study used the data collected for a project supported and funded by the Michigan Office of Highway Safety Planning (OHSP).
OHSP disclaims any liability, of any kind, or for any reason, that might otherwise arise out of any use of this publication or the information or data provided in the publication.