
Abstract
In multiple U.S. cities, school districts and transit providers collaborate to provide students free public transit access, either replacing or supplementing the yellow school bus service. Although practitioners widely acknowledge these programs as a promising and innovative solution to absenteeism, there is no empirical research evidence to date confirming the benefits of these programs to individual students’ school attendance. We respond to this research gap by investigating the impacts of the Minneapolis Go-To Student Pass Program—a transportation program that began to provide student access to public transit in August 2013—on individual student school attendance. Using Poisson regression, we estimate both the traditional Difference-in-differences models and Two-Way Fixed Effects models to quantify effects of pass use and pass eligibility on student attendance. We find that student-reported pass use and pass eligibility reduce excused absences by 11.5% and 27.5%, respectively. Restricting our sample to students living in the School Walk Zone—the area within 2 mi of one’s school—we find that these effects are even more substantial, with pass use and pass eligibility reducing excused absences by 30.5% and 37.6% respectively. These findings imply that providing free access to public transit is broadly useful to improve student attendance, even for students who live within walking distance of the school and may not use transit passes regularly.
In August 2013, Minneapolis Public Schools (MPS) replaced its traditional yellow school bus program with the Go-To Student Pass program. The program, a partnership of Metro Transit and MPS, enables students to take unlimited rides on regular route buses and light rail lines from 5 a.m. to 10 p.m. daily during the school year. The Go-To Student Pass program in Minneapolis is not a novel concept. School districts across the United States have implemented similar programs to bypass challenges associated with increasingly complicated and expensive student transportation. These challenges include (but are not limited to): altering logistics to accommodate expanded school choice and open enrollment policies; rising contracting and fuel costs; increasing safety and emission regulations for buses; and strict state and federal mandates for student transportation (1–3). Collaboration between school districts and transit providers to provide student transportation via public transit services has been widely acknowledged as a promising and innovative solution to the increasingly complex school transportation policy environment.
Besides Minneapolis, MN, other cities have implemented cross-sector programs to provide student access to public transit. These include: Boston, MA; Seattle, WA; Portland, OR; Oakland, CA; Lakeland, FL; Washington, DC; Baltimore, MD; Philadelphia, PA; San Francisco, CA; and Columbus, OH. Anecdotal evidence from these cities suggests that using public transit for student transportation is associated with benefits such as expanded school and after-school academic program access, increased transit ridership, and fleet operation and maintenance cost savings for school districts (4, 5).
Besides direct educational and economic benefits, these programs are expected to have broader societal impacts. First, increased student transportation on public transit could reduce traffic congestion by limiting yellow school buses on the roads. In the long term, more student use of public transit may shape attitudes toward transit and attract new transit users, leading to reduced vehicle emissions and environmental benefits. Further, increased student transportation via public transit could improve quality of life for parents who save time otherwise spent transporting children. Finally, from an equity perspective, such programs may expand transportation opportunities for students from under-resourced families whose parents are less able to provide transportation for their children because of limited time availability or limited transportation options. These families may include low-income families, families of color, single parent households, and others (5, 6).
While studies have examined the impact of student transit passes on overall school-level attendance rates (7, 8), there is little research examining how school transit passes affect individual student outcomes. To address this literature gap, we implemented an in-class student survey in Spring 2015 at eight MPS high schools to assess the impact of the Go-To Student Pass program on student attendance. We linked student survey data with MPS academic attendance data before and after implementation of the Student Pass program. Using the combined survey and MPS data, we specify Difference-in-differences (DID) models and Two-Way Fixed Effects (TWFE) models to estimate the effect of pass use and pass eligibility on students’ school attendance. We find that both pass use and pass eligibility decreased excused absences, but not unexcused absences. We also find that these effects are even more substantial when looking at students living within the School Walk Zone (SWZ)—the 2-mi radius surrounding each school.
The rest of the paper is laid out as follows. In the next section, we survey existing literature. Following that, we examine the Minneapolis Go-To Student Pass program and discuss its institutional and demographic context. We then turn to an analysis of our data and econometric specifications before providing results. Finally, we discuss results and conclude.
Existing Research
Although multiple cities in the U.S. have implemented programs providing student access to public transit, evaluation of these programs has been limited and anecdotal (4, 6, 7). Patnode et al. ( 9 ) found little research on the role of transportation options to school and its effect on students, noting that attendance plays an important role in student performance and lifetime achievement. An Urban Institute ( 10 ) report notes that the lack of research on student transportation prevents a full understanding of its policy and academic implications. Despite showing survey findings that parents tend to factor in student transportation when deciding where to send their kids to attend school, the report did not evaluate any student transit programs.
In our review of the literature, we found two studies that included detailed empirical evaluation of a student transportation program. One is from the San Francisco Bay Area in California ( 7 ) and another is from Denver, Colorado ( 8 ). Both studies used school-level analyses—with outcomes aggregated across schools—and were unable to examine the program impact on individual students.
More specifically, McDonald et al. ( 7 ) used a before-and-after group-level comparison approach. They evaluated a free bus pass program serving low-income (based on free/reduced lunch eligibility) middle and high school students in the West Contra Costa school district in the San Francisco Bay Area that began in August 2002. Although McDonald et al. ( 7 ) presented in-depth focus groups and interviews that confirmed individual cases of improved attendance, their quantitative analyses were not able to follow the individual students before and after the program implementation. Instead, they compared the same schools between the 2001/2002 and 2002/2003 school years to examine the before-and-after impact of the free bus pass program at the school level. Their comparison did not show any quantitative evidence that the program increased overall school-level attendance or academic achievement. They indicated that the short evaluation time and limited scope of the bus pass policy might be the reasons for the lack of evidence. However, it is also possible that their results were inconclusive because their school-level comparisons did not account for differences in student socio-demographics. Results from McDonald et al. ( 7 ) may be subject to aggregation bias and ecological fallacy, meaning they cannot shed light on the student-level impacts of the program on school attendance and academic achievement.
By contrast, Ely and Teske ( 8 ) used a cross-sectional group-level comparison approach. The study evaluated the Denver Public Schools Success Express Shuttle program. Begun in August 2011, the program operates similarly to a circular public transit route, picking up students at each stop three times. Ely and Teske ( 8 ) compared 172 schools that participated in the program to 43 schools that did not. Although they found that the program was associated with slightly higher attendance and slightly lower truancy, their analysis did not control for attendance and truancy rates before the program. It is possible that the participating schools had higher attendance rates and lower truancy rates before August 2011. Further, their cross-sectional analysis at the school level does not disaggregate student-level impacts.
Some research is beginning to illustrate a negative relationship between public transportation reliance and student attendance (11, 12). However, these studies do not compare programs that provide student access to public transit with the traditional yellow school bus program. They focused on examining the impact of public transit service quality on school attendance when students relied on public transportation to travel to and from school.
Specifically, Stein and Grigg ( 11 ) find that student absences increase in Baltimore, MD when trips on public transit become longer or more complicated because of additional transfers. They compared students’ attendance records as they transitioned from eighth to ninth grade, as students change schools and often change trip routes. They only analyzed students that remained at the same home address for both grade years and stayed at the same school throughout the duration of each grade year. Increased trip complexity led to a 10% to 13% increase in the number of absent days, while every 10 min added to the average commute time led to an additional one-third day absence ( 11 ). Similarly, Gross and Denice ( 12 ) conclude that transit networks insufficiently connect under-resourced students with good schools in Denver, CO—a finding that reflects residential segregation and the design of transit networks to bring workers into downtown areas. These studies contribute to the education resource distribution policy discussion and illustrate limitations of current public transit systems in overcoming inequities.
This paper adds to the limited literature on how student access to public transit can affect student performance. Compared with McDonald et al. ( 7 ) and Ely and Teske ( 8 )—the only two empirical studies to date evaluating alternative student transportation programs—this paper features a retrospective, individual-level causal before-and-after analysis that accounts for socio-demographic attributes.
Study Area and Policy Background
Minneapolis is Minnesota’s largest city with an estimated 2017 population of 411,452 people. About 20% of that population is under the age 18. The race and ethnicity breakdown of the whole city is 50.9% white, 18.6% black or African American, 6% Asian or Pacific Islander, 1% American Indian or Alaskan Native, 4.5% multiracial, and 9.8% Hispanic or Latino. The 2017 estimated median household income is $55,720 ( 13 ). Minneapolis Public Schools (MPS) had 9,273 high school students in August 2019. The race and ethnicity breakdown for the school district is 35.4% white, 35.3% black or African American, 5% Asian American, 3.8% multiracial, 3% Native American or Alaskan Native, and 17.4% Hispanic or Latino, reflecting a disproportionately minority public school student body ( 14 ).
In August 2013, the Go-To Student Pass program officially began at all MPS high schools, completely replacing the yellow bus service. Under the program, eligible high school students are offered unlimited rides on regular route bus and light rail services from 5 a.m. to 10 p.m. daily during the school year (i.e., excluding the summer break). Go-To student passes are purchased by MPS for eligible students either for the whole year ($300) or by quarter ($75) and are conveniently combined with student identification cards. To be eligible for the program, students need to fall into one of the following categories:
Transportation eligible: All students who live within a school’s attendance area and outside the SWZ—defined as 2 mi from the school.
Free/reduced lunch (FRL) eligible students who live within the SWZ (i.e., are not transportation eligible). FRL students’ families earn under an income threshold typically set by state and federal agencies.
All students enrolled in a city-wide program. These programs are tailored to specific students and include language, demographic, specialty, and advanced placement specific programs.
Students who are not eligible for the program can personally purchase a Go-To Student Pass at the same rate as schools. MPS manages the Student Pass program through an existing department called Check and Connect. In addition to monitoring attendance and truancy, Check and Connect manages day-to-day support activities for the Go-To Student Pass program, including pass distribution and replacement, coordination with Metro Transit, and student and parent program-related communications.
To accommodate student transit demand, Metro Transit added new bus trips and increased service frequency over certain portions of regular routes during mornings and afternoons—when students travel to and from school. In Fall 2014, Metro Transit was operating 103 additional bus trips per day as a result of the program. At the end of the 2013/2014 school year, 6,484 students had enrolled in the program. Collectively, they had taken 3.5 million rides on public transit ( 5 ).
Figure 1 illustrates the locations of the eight MPS high schools and their general transit accessibility. Each school is serviced by multiple transit routes within a half-mile radius. The Blue Line Light Rail Transit (LRT) operates every 10 to 15 min throughout the day. High frequency bus routes operate every 15 min during morning commutes, at mid-day, and during evening commute along designated high frequency portions. The urban radial bus routes run every 20 to 30 min during the day with increased service during peak travel times. Finally, the urban crosstown circulator buses run consistently every 30 min during the week. Data was sourced from the Metropolitan Council ( 15 ) and MPS ( 16 ).

Locations of Minneapolis Public Schools (MPS) high schools and public transit services in Minneapolis, MN.
Data and Variables
Data used in this paper come from two principal sources:
An originally designed in-class student survey conducted in the Spring of 2015 that collected data from 2,453 high school students on their Go-To Student Pass usage, behavior, and experience.
Records from MPS on student demographics and school attendance in the Spring 2013 semester (before the Go-To Student Pass program implementation) and the Fall 2014 semester (the most recent after-program semester at the time of the 2015 survey).
The in-class student survey was conducted at MPS high schools between May 12 and June 5, 2015. Of the 8,228 students enrolled in MPS high schools in Spring 2015, 2,453 (30%) participated in the survey. The survey was implemented using the web-based survey tool Qualtrics. It was self-administered, available only in English, and completed in-class using laptop computers, tablets, or smartphones. Based on the availability of devices to access the online survey, most surveys were conducted in Social Studies classes (every Social Studies class at MPS has laptops and tablets available for students). Students completed surveys during school and at varied times to minimize disruptions to events such as tests. A small proportion of surveys (1%) at North High School were completed on paper as online survey completion was not a possibility. Over 40% of the survey sample included students in 9th grade, reflecting greater ease reaching younger students who were less busy and not dealing with graduation or more rigorous college preparation tests or final examinations. The survey primarily included pass usage questions.
MPS provided anonymized student-level school attendance data for the 2,453 surveyed students. The individual-level survey data were linked to individual school attendance data using student ID. In the school attendance data, absences are classified as excused or unexcused, allowing us to create three separate measures of attendance: excused absences, unexcused absences, and total absences. An excused absence of a student under the age of 18 must be communicated to a school by a student 18 years or older or by a parent or guardian. Additionally, it must meet approved circumstances detailed by MPS regulations, including illness, religious observance, district-recognized cultural observance, family emergency, transportation problems, and extreme weather conditions ( 17 ). Unexcused absences are any absences that do not fit these criteria. Total absences are the sum of excused and unexcused absences.
By repeating school attendance observations on the same students (Spring 2013 and Fall 2014), this data effectively takes a two-period panel structure. Students who only have one semester of school attendance data or whose eligibility criteria changed over time periods were removed from the panel to ensure balance, which reduced the sample size from 2,453 to 1,549 students. Because the supplemental MPS data did not include information on city program enrollment, we define eligibility according to the first two criteria listed in the Study Area and Policy Background sections. Thus, our sample includes only students who received a pass because of these two observed eligibility criteria or did not receive a pass at all. We remove students who purchased student passes so all students in the sample either were automatically provided a pass or did not receive one. The final sample for data analysis includes 1,433 students.
Within the final sample of 1,433 students, we construct a secondary sample of only students living within the 2-mi SWZ, which includes 433 students. We pay special attention to these students for two reasons. First, the effect of transit passes may be different for students who live relatively close to their school. Second, all students who were automatically enrolled in the Go-To Student Pass program within the SWZ were students who received FRL. This is because FRL-ineligible students must have resided outside the SWZ to receive a free Go-To Student Pass. Thus, within the subsample SWZ, all treated students received FRL and all untreated students did not. By contrast, within the full sample both students who lived outside SWZ and FRL-eligible students who lived inside SWZ were eligible to receive passes. Table 1 gives summary statistics of both the full sample (n = 1,433) and the SWZ subsample (n = 433).
Summary Statistics of Student Characteristics
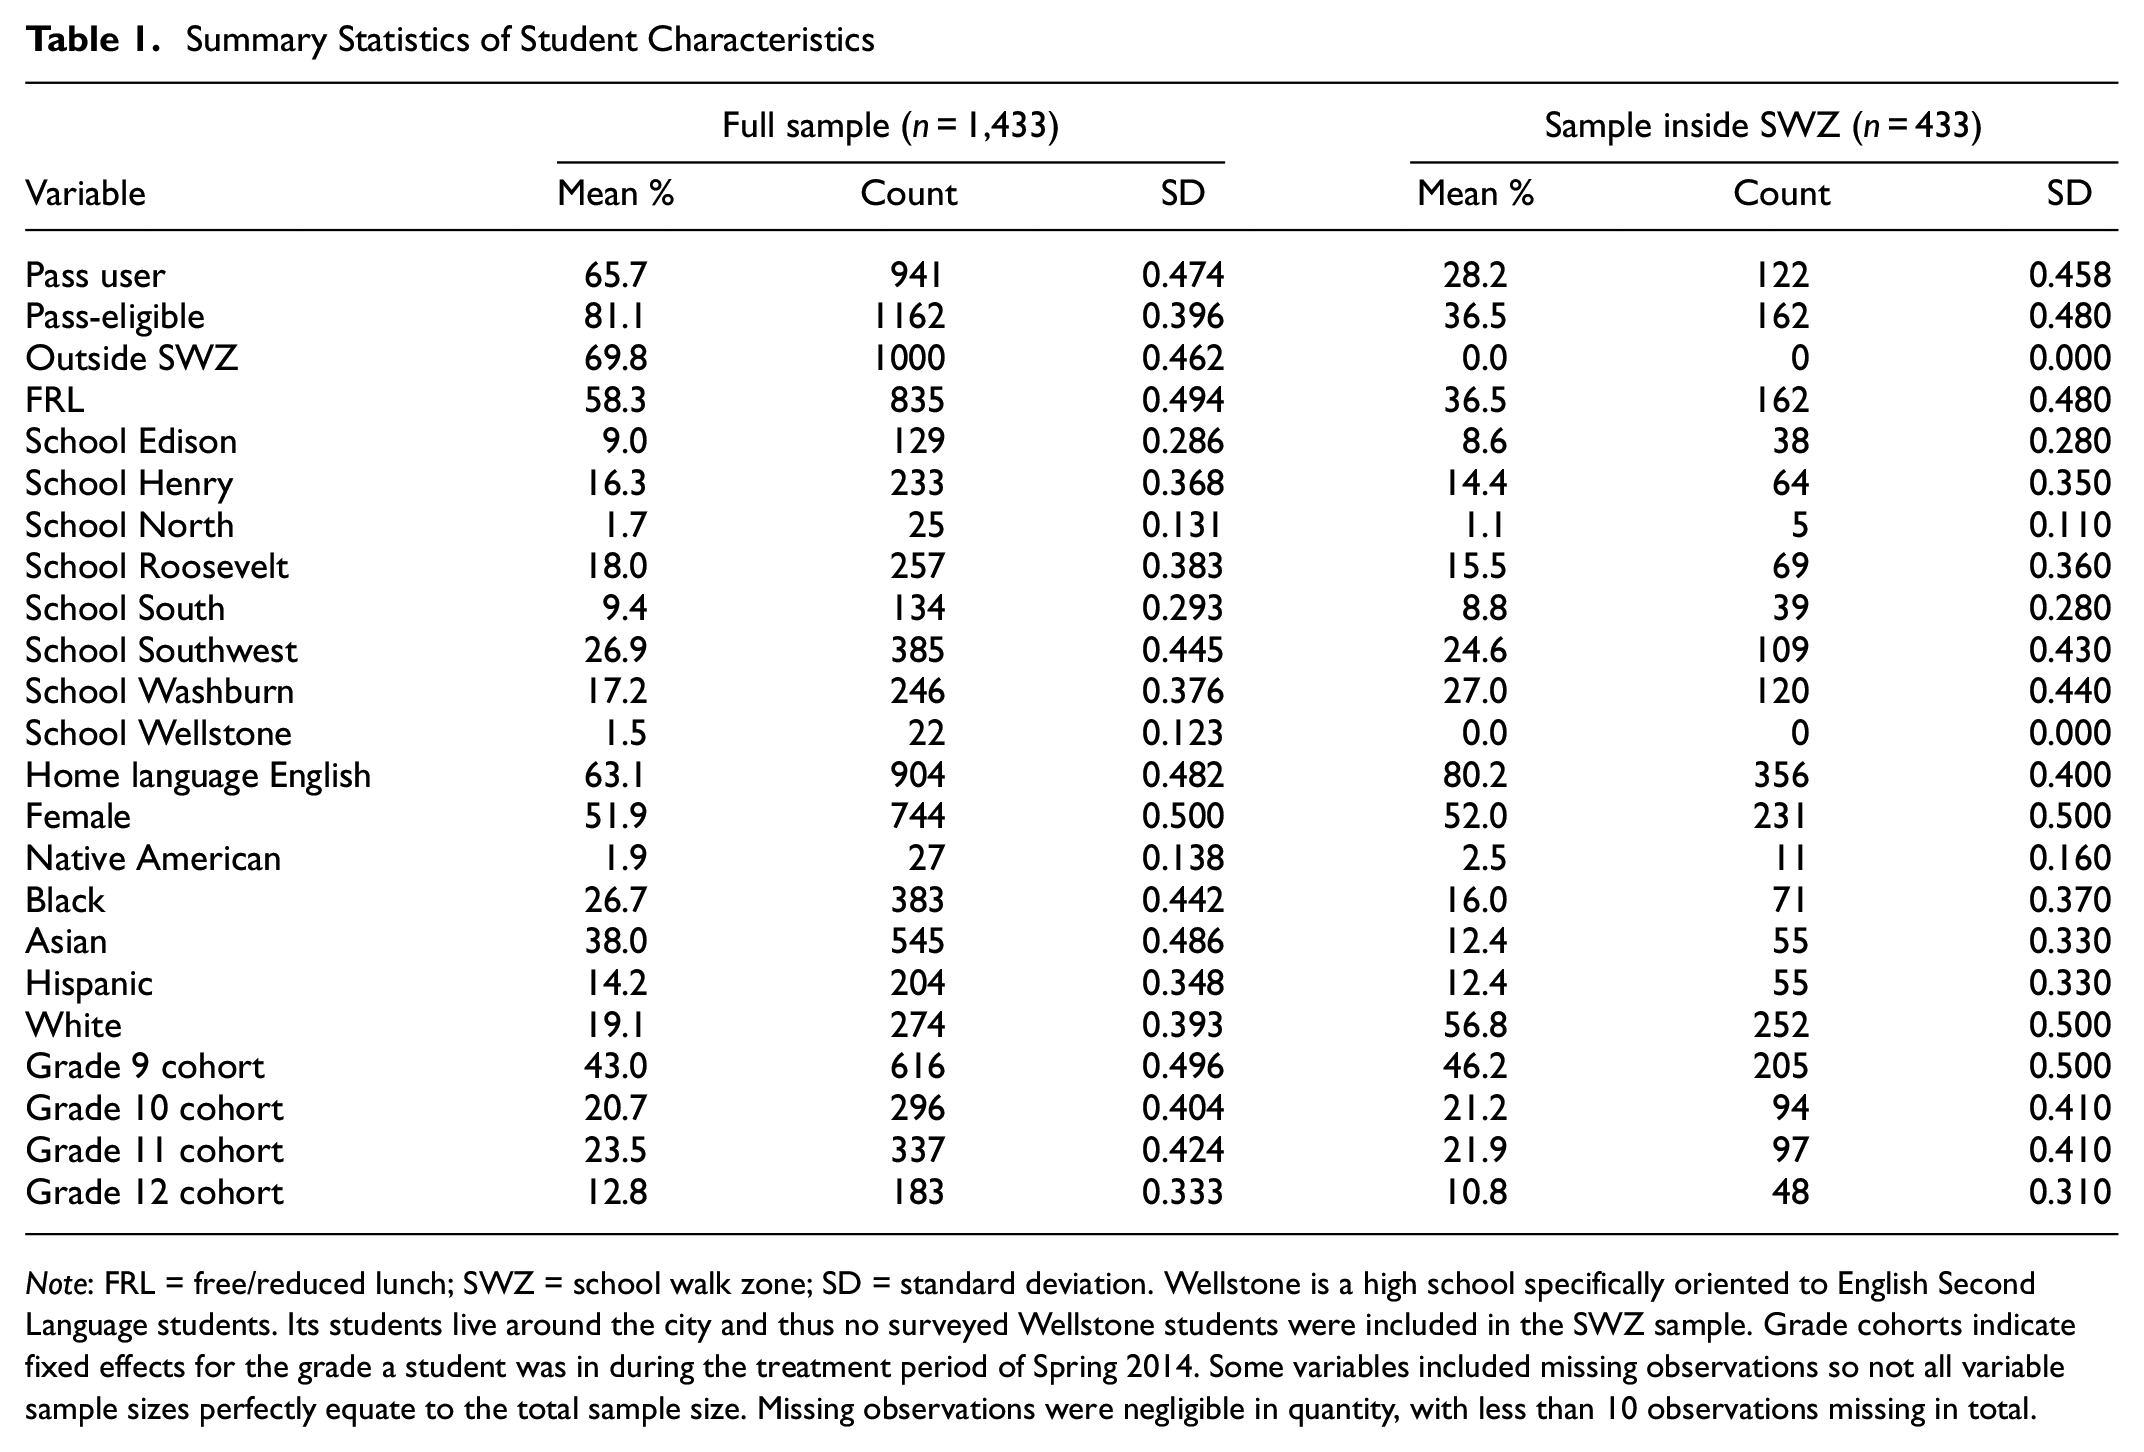
Note: FRL = free/reduced lunch; SWZ = school walk zone; SD = standard deviation. Wellstone is a high school specifically oriented to English Second Language students. Its students live around the city and thus no surveyed Wellstone students were included in the SWZ sample. Grade cohorts indicate fixed effects for the grade a student was in during the treatment period of Spring 2014. Some variables included missing observations so not all variable sample sizes perfectly equate to the total sample size. Missing observations were negligible in quantity, with less than 10 observations missing in total.
We use two nested definitions of treatment. First, we examine all students who self-identified as “pass users” in the 2015 survey, meaning that they responded “Yes” to a question “Do you currently use a Go-To Student Pass, provided by your school or purchased at your own expense?” Because of the sample restrictions described above, this pass user group is nested within the group of students made eligible for treatment—defined as students living outside the SWZ and FRL students—as students who purchased a pass are excluded from analysis.
Our main dependent variables are counts of total, excused, and unexcused absences. Table 2 summarizes these absence counts by pass eligibility and pass usage across both study periods and study samples. Some maximum counts indicate the presence of half-day absences. According to Table 2, pass-eligible students and pass users respectively had lower total attendance rates than pass-ineligible and pass non-users before the beginning of the program. This gap was driven primarily by unexcused absences, while excused absences were slightly lower among both treatment groups (i.e., the pass user and pass-eligible groups), compared with their respective comparison groups. Treatment notably changed outcomes, with total and excused absences dropping among the treated groups, compared with their respective comparison groups. We empirically test this exploratory observation using the approach outlined in the next section.
Summary Statistics for Dependent Variables by Pass Eligibility, Pass Usage, and Period
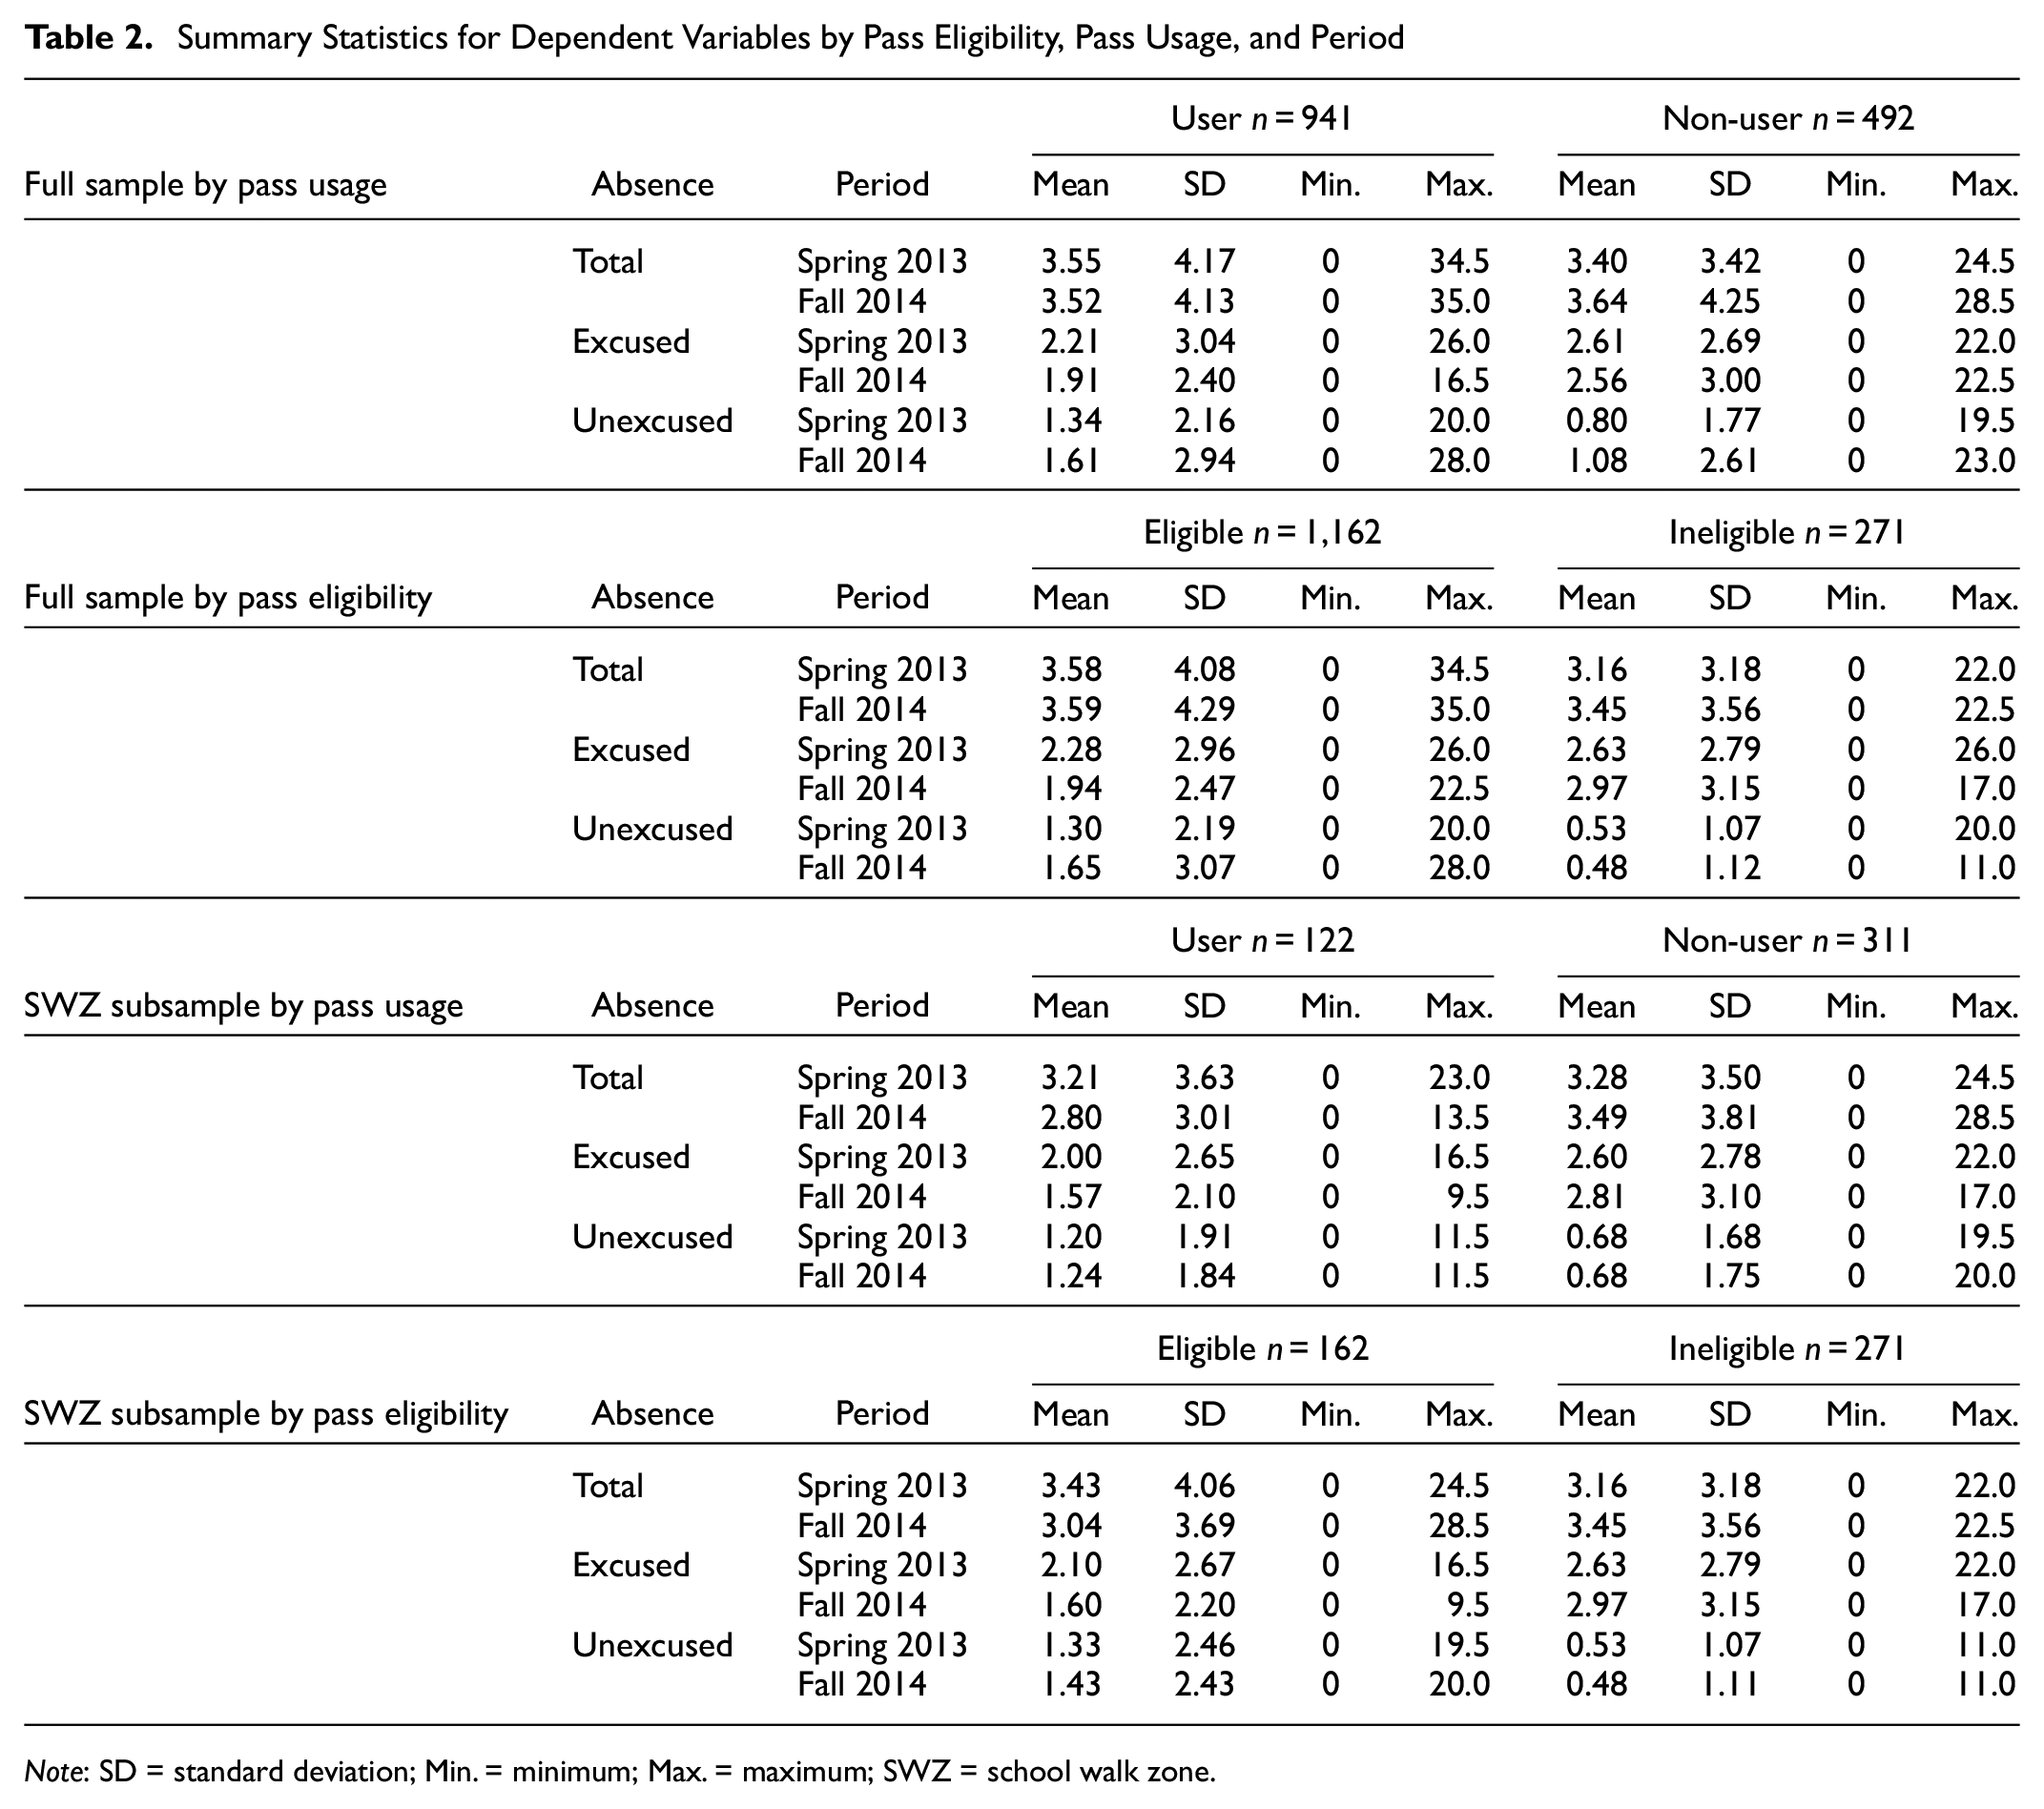
Note: SD = standard deviation; Min. = minimum; Max. = maximum; SWZ = school walk zone.
Econometric Specification
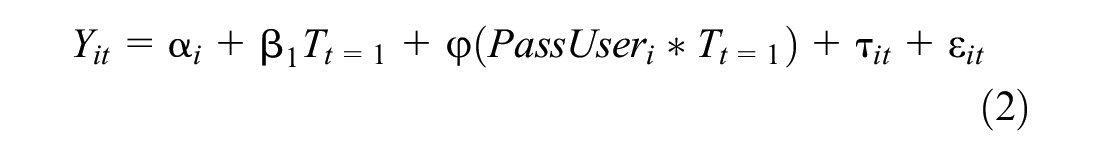
We employ several DID models to estimate both the effect of pass usage and the effect of pass eligibility. Equations 1 and 2 use traditional “two-by-two” DID specifications to capture the effect of free passes specifically on those who used them. In Equation 1, this model regresses Yit on a binary variable PassUseri indicating whether one used a pass, a binary variable Tt=1 indicating treatment year, and the interaction term of the two. The coefficient on this interaction term—labeled
Additionally, Equation 1 includes a vector
Equation 2 re-estimates the model using a TWFE model, substituting PassUseri for a full set of student fixed effects

These models plausibly uphold the primary assumptions necessary for DID to estimate consistent treatment effects. Because we condition on time and group fixed effects (or individual fixed effects in the TWFE specification) and grade level it is plausible that confounders between the two groups are time-invariant and that unobserved time-invariant factors are determined independently of treatment ( 19 ). Further, consistent estimation of these models relies on two assumptions related to our use of the Spring 2015 survey to define the time-invariant group of pass users. First, we assume that the students who self-reported pass use in Spring 2015 also used a pass during the previous (Fall 2014) semester. The second assumption is particularly necessary to consistent DID estimation. For DID to work, we must assume that pass users are a well-defined group, who would have used passes had they been available before program implementation. When the second assumption is met, conditioning on time-invariant differences between this group of students and their non-pass-using peers allows for consistent DID modeling. However, it is a strong assumption because there may be unobserved factors that could lead to composition changes in the pass user group over time.
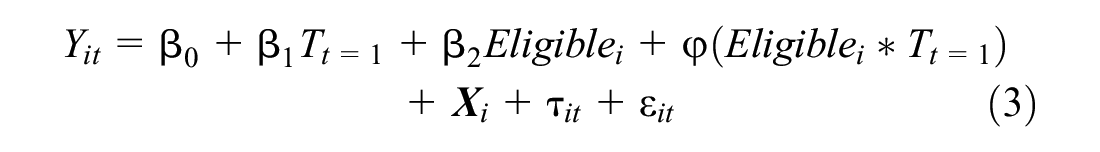
Thus, Equations 3 and 4 feature an alternative set of specifications which redefine the treated group and represent traditional DID and TWFE specifications of this approach respectively. The treated group now includes all program-eligible students—defined by FRL eligibility and residency distance from school—instead of all pass users. While this group is substantially more stable and well-defined than the treatment groups of Equations 1 and 2, we are unable to infer anything based on whether a student actually used the pass, instead only testing for the effect of the pass being made freely available. For analysis of the SWZ subsample, only FRL-eligible students are included in the eligible treatment group.

Because of a high concentration of zero values in the dependent variable, we use Poisson regression to estimate both models. Poisson regression—with robust standard errors—estimates unbiased and consistent coefficient estimates ( 20 ). Although Poisson regression is typically used for integer count data, the presence of some half-day absence counts does not invalidate its use here.
Results
Tables 3 to 6 display results of Poisson DID and TWFE regressions corresponding to the four equations presented above. In each table, robust standard errors are displayed in parentheses. Panel A always includes results from DID specifications, while Panel B displays TWFE results. Standard errors in Panel B are typically lower because of the full set of student fixed effects included in the TWFE specification. Thus, some effects that are not significant in Panel A are significant in Panel B, despite little change to point estimates.
Full Sample—Pass User Treated Group
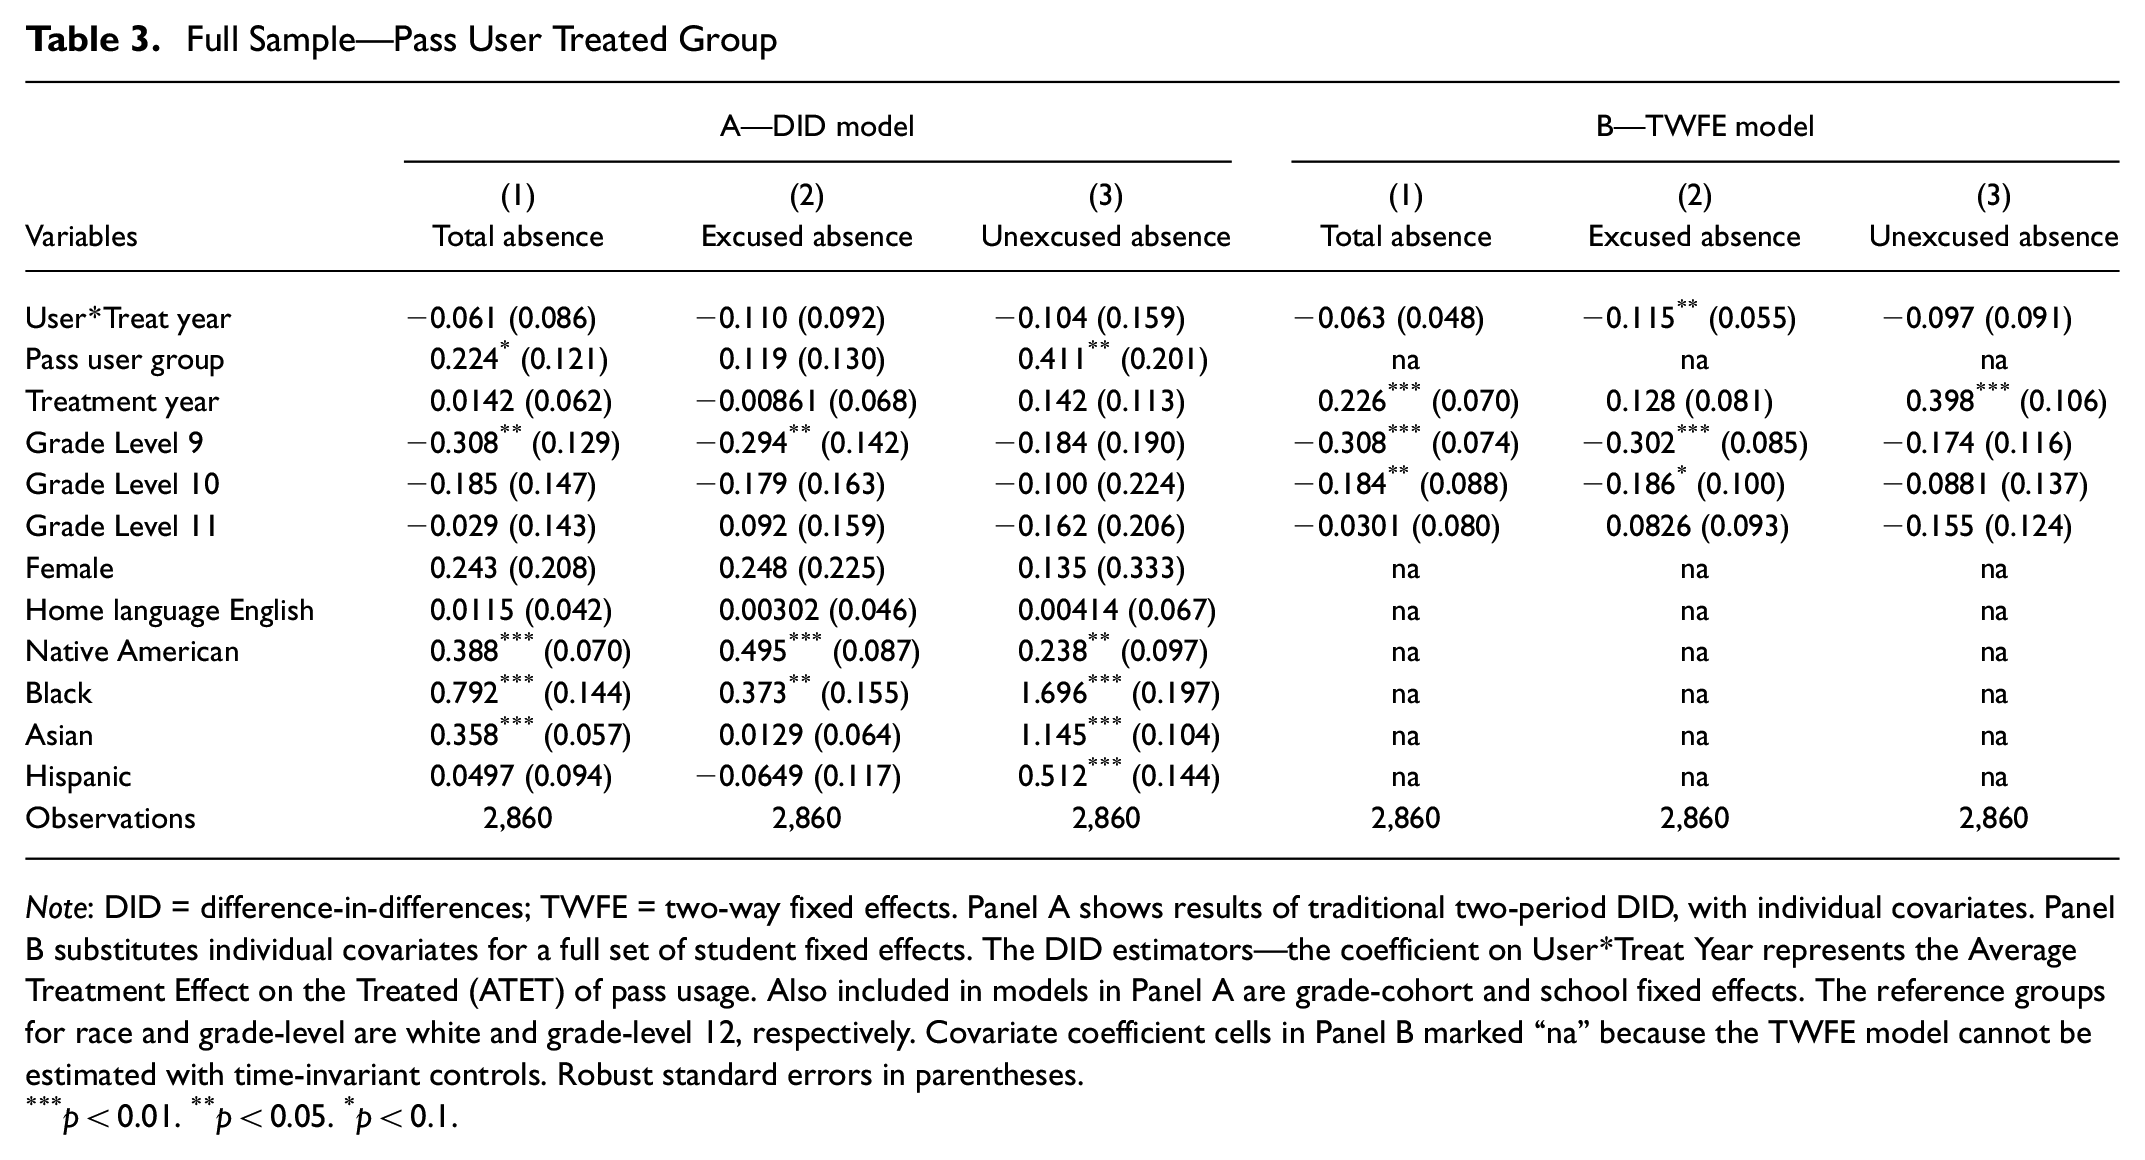
Note: DID = difference-in-differences; TWFE = two-way fixed effects. Panel A shows results of traditional two-period DID, with individual covariates. Panel B substitutes individual covariates for a full set of student fixed effects. The DID estimators—the coefficient on User*Treat Year represents the Average Treatment Effect on the Treated (ATET) of pass usage. Also included in models in Panel A are grade-cohort and school fixed effects. The reference groups for race and grade-level are white and grade-level 12, respectively. Covariate coefficient cells in Panel B marked “na” because the TWFE model cannot be estimated with time-invariant controls. Robust standard errors in parentheses.
p < 0.01. **p < 0.05. *p < 0.1.
Table 3 displays results from Equations 1 and 2 on each dependent variable, displayed in Columns A and B, respectively. These equations specify a treatment group that includes all students who used the Pass in Spring 2015. While the DID estimator for excused absences is statistically insignificant for the traditional DID model, at 95% confidence, the TWFE model estimates that pass usage reduced excused absences by 11.5%.
Table 4 presents results of Equations 3 and 4 using data from the full sample. When the treatment group is redefined as pass-eligible students instead of pass users, the DID estimate shifts. First, the DID and TWFE models respectively estimate statistically significant (99% confidence) reductions in excused absences of 27.8% and 27.5%. Additionally, the TWFE model estimates a significant positive effect on unexcused absences of about 32.3%. This effect is found only when treatment is defined as eligibility. Perhaps some students who were automatically enrolled in the pass program but did not consider themselves pass users occasionally used their pass to skip—rather than attend—school.
Full Sample—Pass-Eligible Treated Group

Note: DID = difference-in-differences; TWFE = two-way fixed effects. Panel A shows results of traditional two-period DID, with individual covariates. Panel B substitutes individual covariates for a full set of student fixed effects. The DID estimators—the coefficient on Eligible*Treat Year represents the Average Treatment Effect on the Treated (ATET) of pass eligibility. Also included in models in Panel A are grade-cohort and school fixed effects. The reference groups for race and grade-level are white and grade-level 12, respectively. Covariate coefficient cells in Panel B marked “na” because the TWFE model cannot be estimated with time-invariant controls. Robust standard errors in parentheses.
p < 0.01. **p < 0.05. *p < 0.1.
Table 5 displays results of Equations 1 and 2, this time regressed only on the SWZ subsample. The treated group for this model was pass users living within 2 mi of school. For students who live within the SWZ, only FRL-eligible students are eligible to receive free transit passes. Thus, all pass users were FRL-eligible but not all FRL-eligible students used passes. The comparison group is comprised of all students residing within the SWZ who did not report using a pass in 2015, regardless of pass or FRL eligibility. According to Table 5, even within the SWZ, pass users had better attendance once passes were available. The DID estimators for excused absences for both the DID and TWFE specifications indicate reductions of 30.9% and 30.5%, significant at 90% confidence and 99% confidence, respectively. Additionally, the TWFE model estimates a drop by about 18.5% in total absences for the Pass User group, a finding significant at 95% confidence. The treatment effect magnitude is lower for total absences than for excused absences because unexcused absences remain unchanged. Notably, effects within the SWZ subsample are more pronounced than those in the general sample.
School Walk Zone Sample—Pass User Treated Group
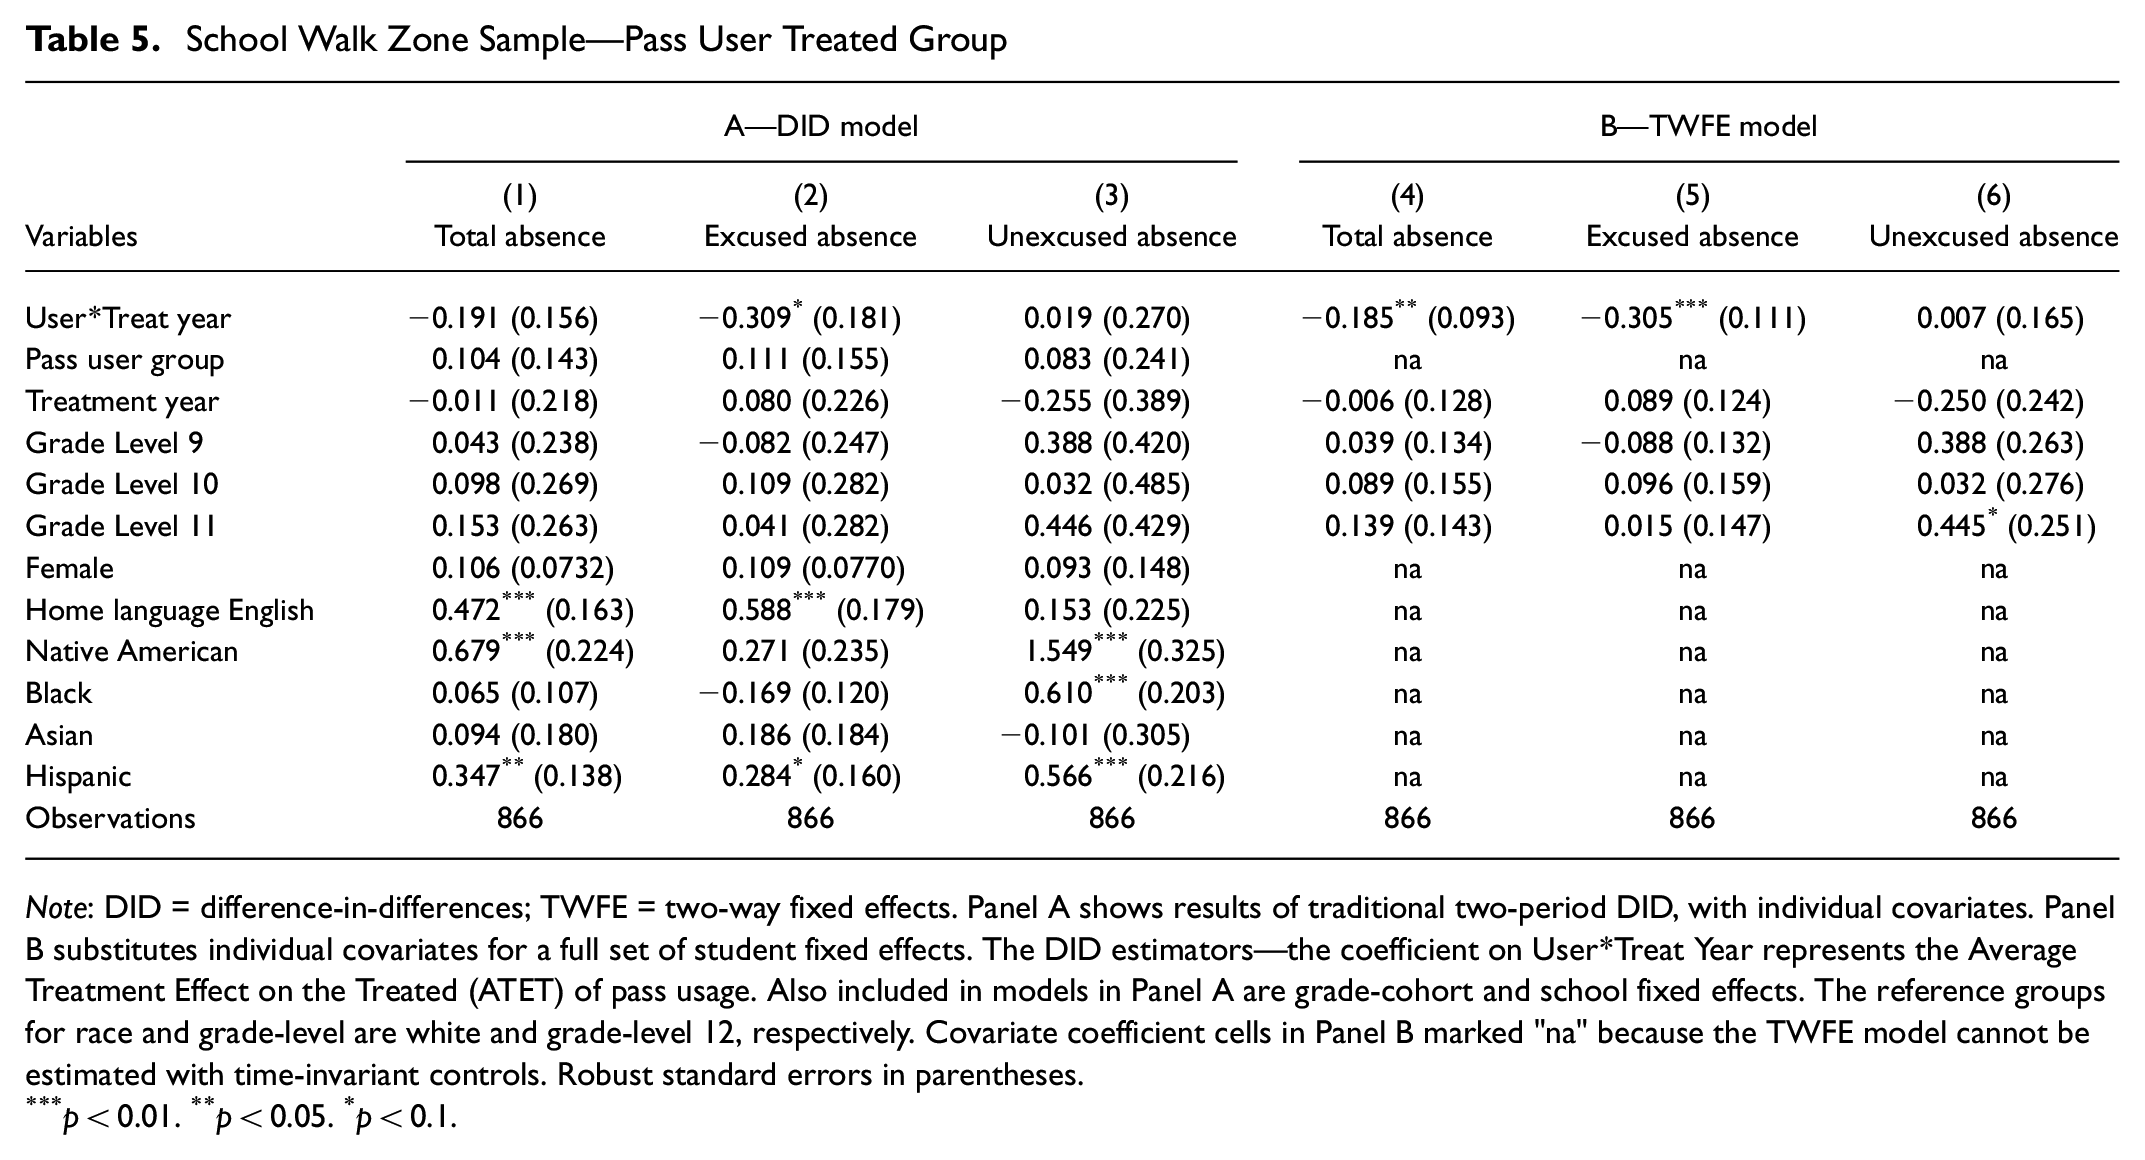
Note: DID = difference-in-differences; TWFE = two-way fixed effects. Panel A shows results of traditional two-period DID, with individual covariates. Panel B substitutes individual covariates for a full set of student fixed effects. The DID estimators—the coefficient on User*Treat Year represents the Average Treatment Effect on the Treated (ATET) of pass usage. Also included in models in Panel A are grade-cohort and school fixed effects. The reference groups for race and grade-level are white and grade-level 12, respectively. Covariate coefficient cells in Panel B marked "na" because the TWFE model cannot be estimated with time-invariant controls. Robust standard errors in parentheses.
p < 0.01. **p < 0.05. *p < 0.1.
Table 6 displays results from Equations 3 and 4, regressed only on the SWZ subsample. For these models, the treatment group is defined as students eligible for Go-To passes because of FRL status. According to traditional DID estimates in Panel A, student passes significantly reduced excused absences by 37.5%. In Panel B, pass eligibility significantly reduced total absences by 19.9%. Treatment insignificantly affects unexcused absences in both panels. This series of equations estimates the highest magnitude treatment effects, implying that FRL-eligible students within the SWZ particularly benefited from the program. Unexcused absences remain unaffected in both specifications.
School Walk Zone Sample—Pass-Eligible Treated Group
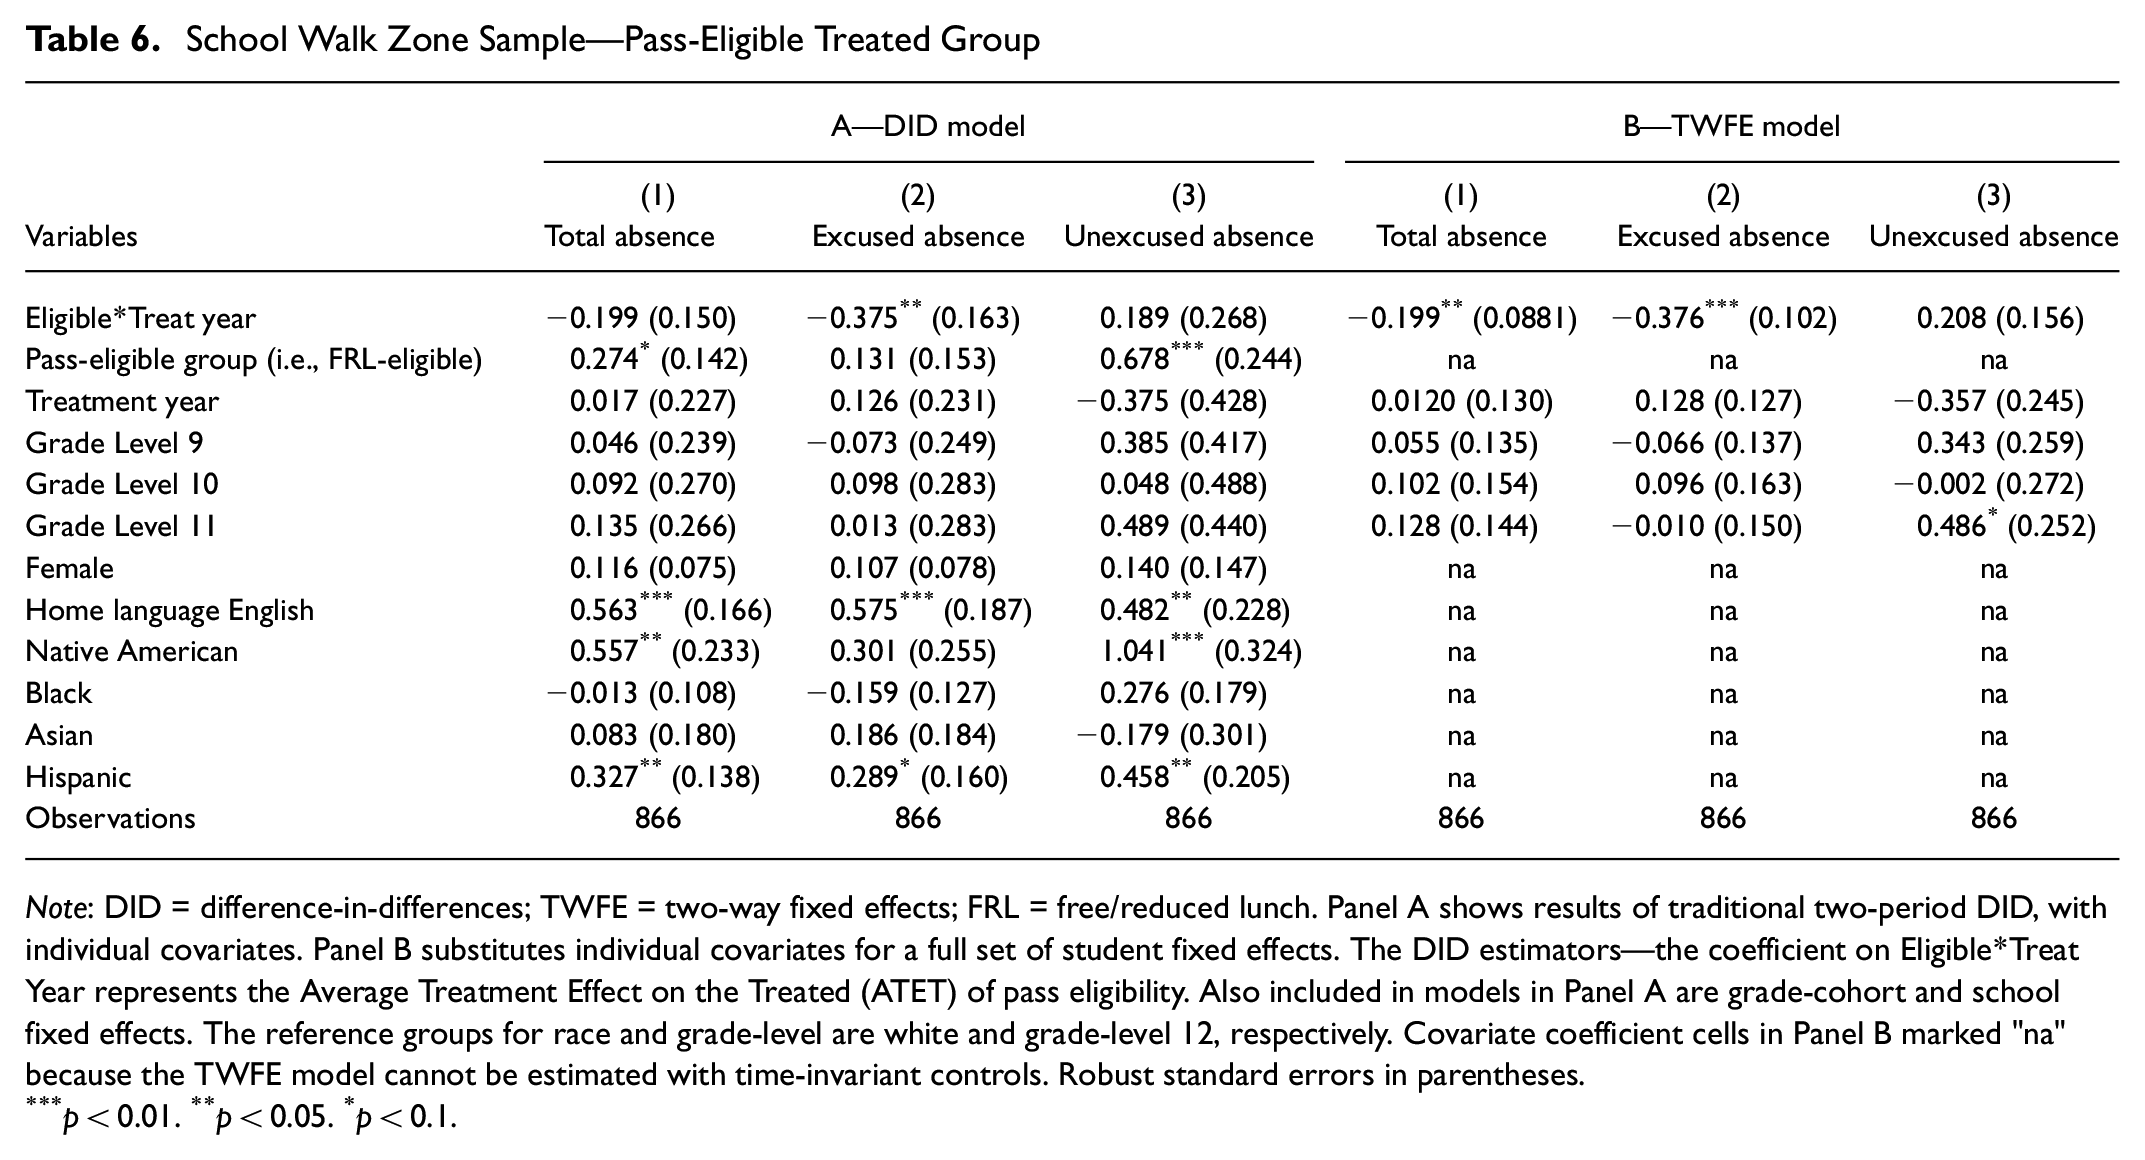
Note: DID = difference-in-differences; TWFE = two-way fixed effects; FRL = free/reduced lunch. Panel A shows results of traditional two-period DID, with individual covariates. Panel B substitutes individual covariates for a full set of student fixed effects. The DID estimators—the coefficient on Eligible*Treat Year represents the Average Treatment Effect on the Treated (ATET) of pass eligibility. Also included in models in Panel A are grade-cohort and school fixed effects. The reference groups for race and grade-level are white and grade-level 12, respectively. Covariate coefficient cells in Panel B marked "na" because the TWFE model cannot be estimated with time-invariant controls. Robust standard errors in parentheses.
p < 0.01. **p < 0.05. *p < 0.1.
Figures 2 and 3 visually illustrate effects of treatment on each absence count. Specifically, they both present plots of fitted regression lines of mean absences over time. Figure 2 shows results comparing the pass user treatment group to non-user students, while Figure 3 shows comparisons of eligible students to ineligible students. Outcomes for the treated group are plotted by orange and blue dashed lines in Figures 2 and 3, respectively.
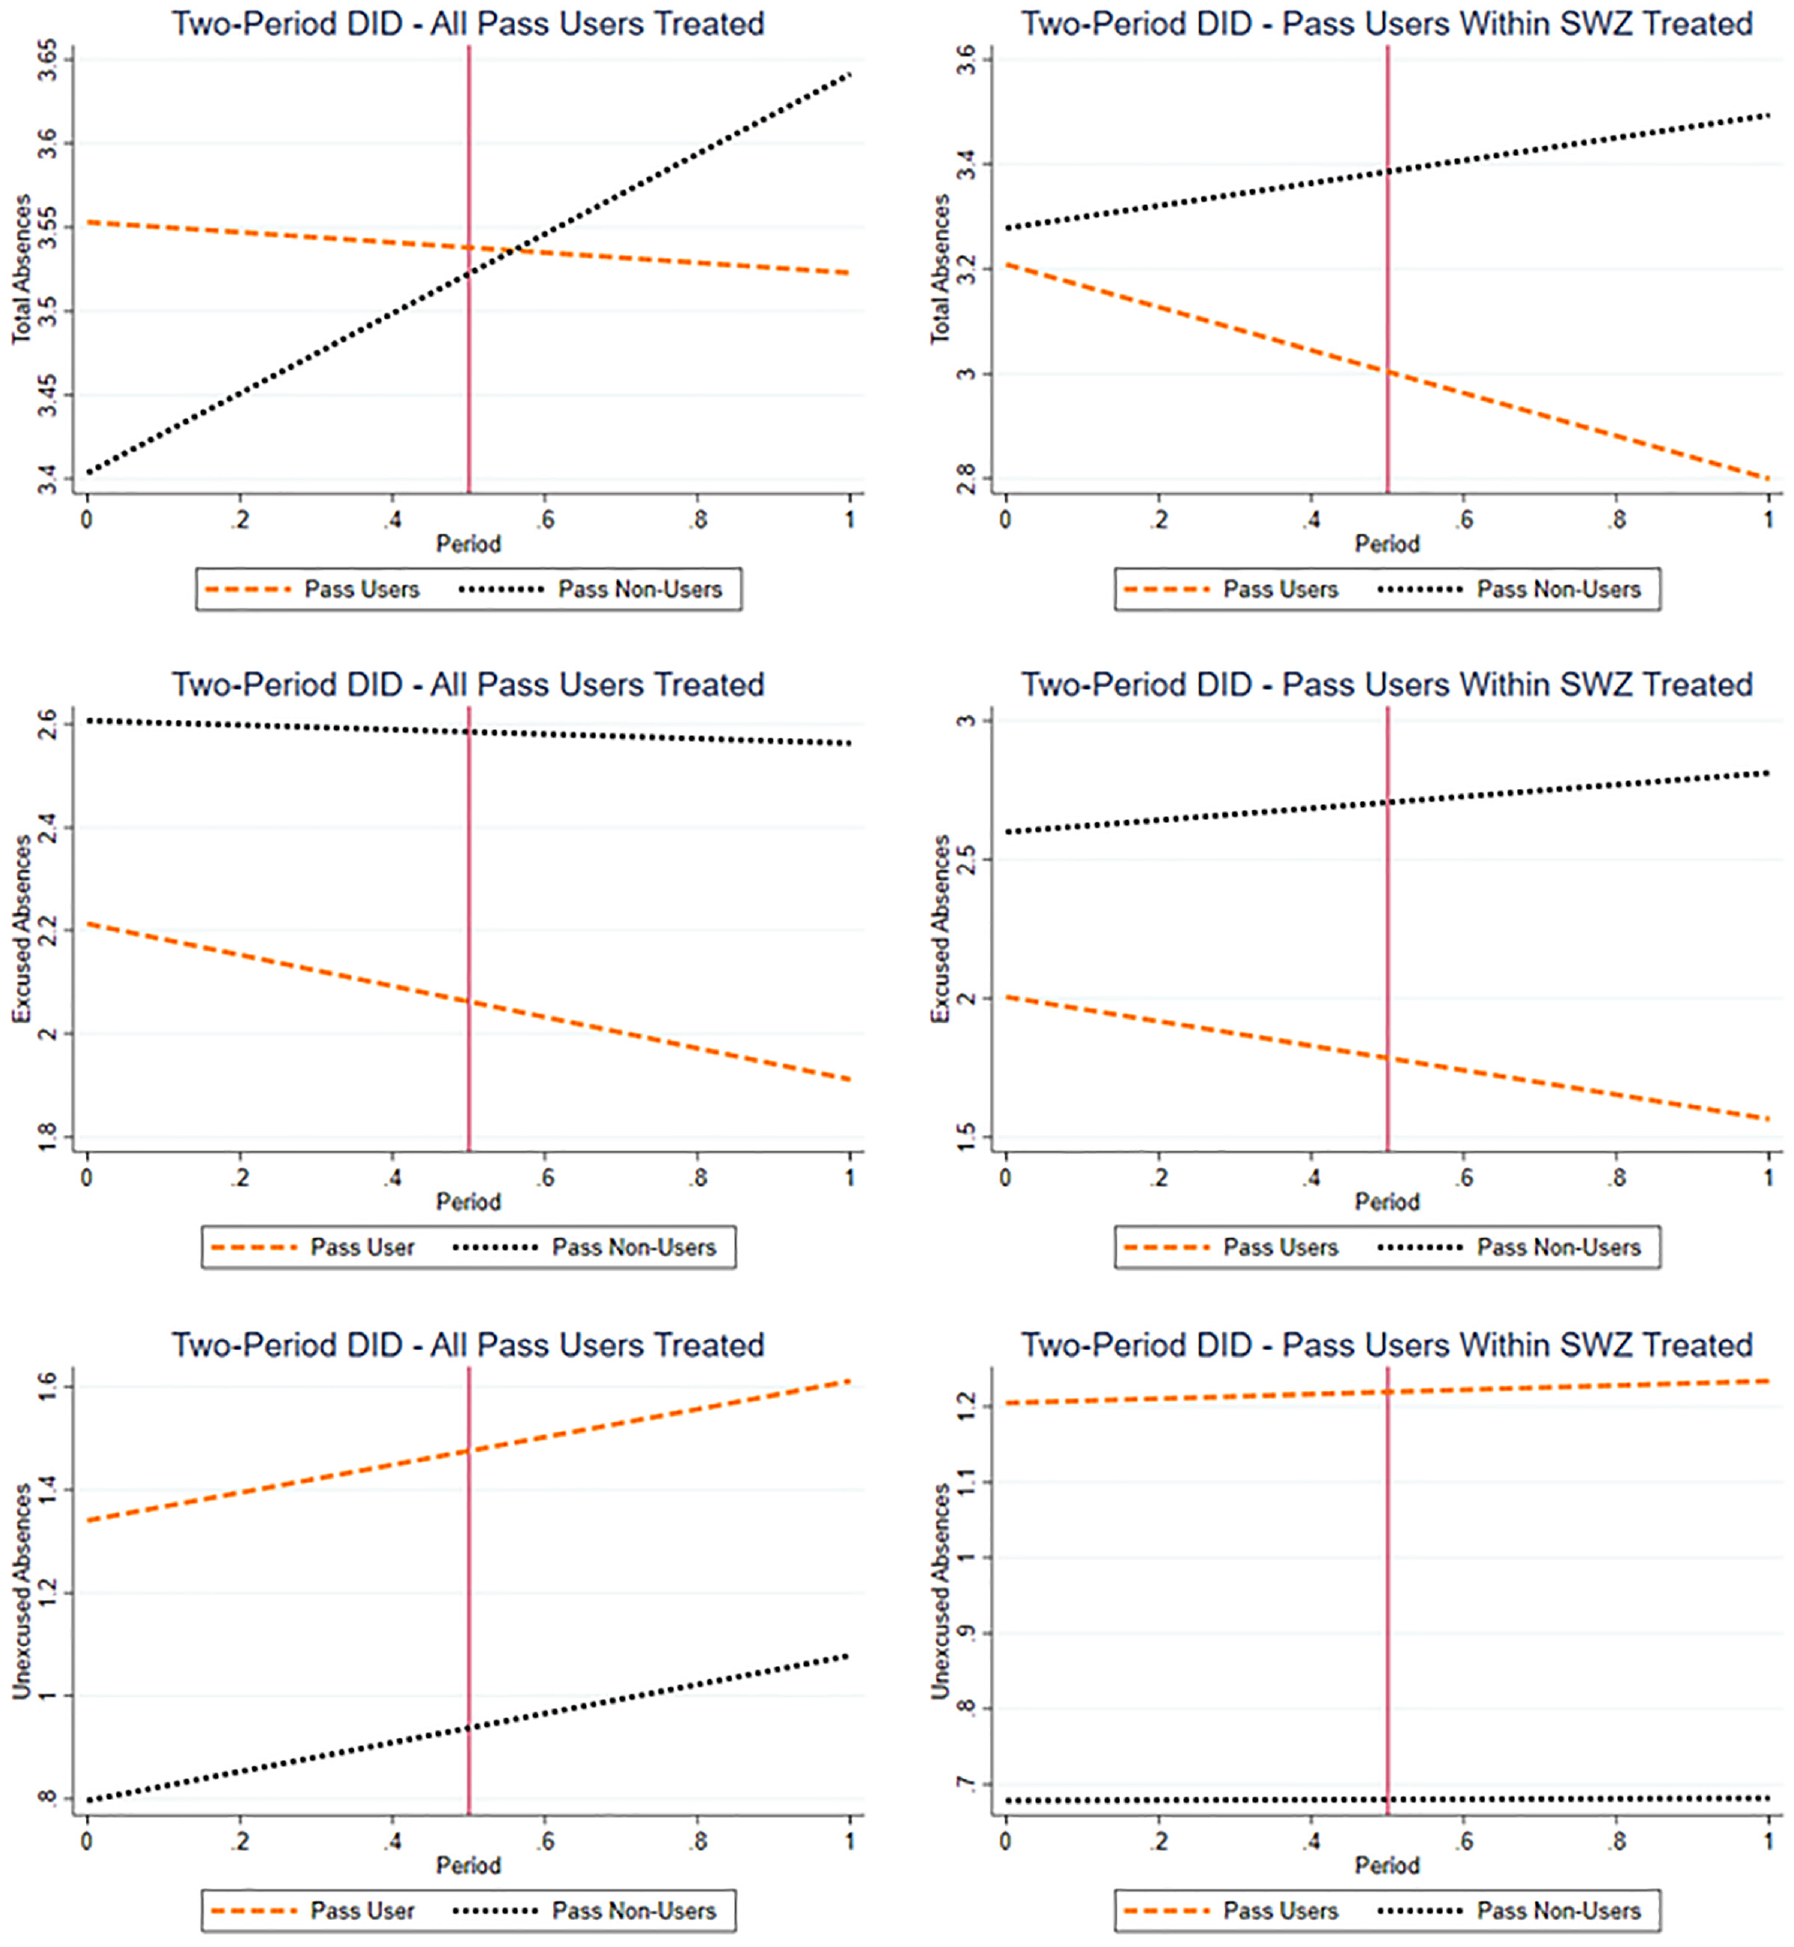
Fitted trends of absence counts over time—pass user treatment group.

Fitted trends of absence counts over time—eligible treatment group.
The lines in Figures 2 and 3 present visual evidence of how the gaps in absences between treatment and comparison groups changed with treatment. The presence of two parallel lines indicates little to no treatment effect, as present in most models of unexcused absences. However, for models with significant treatment effects, gaps either narrow or are reversed, as visible in most models on excused absences. When comparing Figures 2 and 3—although the two figures largely mirror results—the treatment effects are more noticeable in Figure 3 when the treatment group is defined as eligible students instead of pass users, reflecting the stronger and more significant treatment effects presented in Tables 4 and 6.
Discussion
Results indicate that both pass use and pass eligibility reduce excused absences. Transportation problems are cited as a viable excuse for student absences ( 15 ). It is plausible that by providing low-income students (eligible because of FRL) and students living more than 2 mi from the school with transit passes, MPS reduced the likelihood of excused absences associated with yellow bus problems or difficulty walking to school.
By contrast, unexcused absences largely remained unchanged after the Go-To Student Pass program was implemented. This implies that unexcused absences may be explained by factors unrelated to transportation. For example, a high count of unexcused absences could indicate family problems or a lack of student motivation. Additionally, when examining the effect of pass eligibility on the entire sample, we recover a positive treatment effect on unexcused absences—an effect not present when the treatment group was defined as pass users. This indicates that there may be some deleterious effects of free student passes. Some students may use newfound mobility to skip school.
Additionally, it is important to consider the findings of our second set of models—those that specifically examined effects on FRL-eligible students living within the SWZ. Both pass use and pass eligibility were associated with improved excused and total attendance for FRL-eligible students living within a 2-mi radius of their school, with higher estimated treatment effects than those of the general sample. This implies that FRL-eligible students may have found more benefit than students who became eligible through the distance criteria. It is likely that FRL students had fewer transportation options before the beginning of the program. Additionally, these results imply that student passes are useful even for students who live close to school. This finding could also be explained by the relative convenience of taking public transit within a 2-mi radius of one’s destination—a concept that recalls the conclusions of Stein and Grigg ( 11 ) and Gross and Denice ( 12 ). Alternatively, this finding may be particularly unique to Minneapolis or other cold-weather cities where taking transit is preferable to even a short walk during the winter and early spring. Future research could examine the impacts of student transit pass programs in other U.S. cities to account for weather-related and other contextual factors.
Finally, there are a few potential reasons why the estimated treatment effect is stronger when the treatment group is defined as eligible students rather than pass users. First, it is possible that some students who did not self-identify as pass users used Go-To passes in emergencies when no other transportation options were available, thereby avoiding absences that would otherwise be excused because of transportation problems. The second reason may be the timing of the survey and data collection. Students may have been regular pass users in the actual Fall 2014 treatment semester but not in Spring 2015, when pass use was gauged. Future research could use actual pass usage data from the public transit agencies rather than self-reported usage data from the student survey, given availability and cooperation with the relevant public agencies.
Another possibility for future research is a longer-term longitudinal study. The two-year time frame could be expanded both backwards and forwards in time so that a longer panel of data is analyzed with a similar economic approach. This would provide more robust results than the two-period approach used here. Additionally, further research could explore how student passes affected the GPA or standardized test scores of FRL-eligible students.
Conclusions
This study is one of the first studies to examine individual-level treatment effects of alternative student transportation programs. It contributes to the limited literature on student transportation by providing an individual-level analysis of the impacts while accounting for before-program school attendance and socio-demographics of the student. Findings from this research challenge some of the previous findings that demonstrate weak or no attendance effects of providing student transportation via public transit. This study provides solid evidence that the provision of free transit passes can reduce unexcused absence. This evidence is not only strong, but also consistent across alternative samples and modeling approaches. As a result, this study provides granular individual-level quantitative evidence that is stronger than the school-level analysis findings in McDonald et al. ( 7 ) and Ely and Teske ( 8 ).
In addition to providing insight into the effects of student transit passes on individual attendance rates, this study illustrates how transit passes can affect school transportation within the so-called SWZ. In our study context, free student passes were automatically provided to all students living more than 2 mi from their school as well as low-income students who are FRL-eligible regardless of whether they live inside or outside the SWZ. We find that the transit pass program strongly improved attendance among the small group of FRL-eligible students living within the SWZ. This suggests that the decision to automatically enroll FRL-eligible students in the Go-To Student Pass program had notable equity effects, reducing the MPS’ attendance gap between low-income students and their higher socioeconomic-status classmates. Expanding the free Go-To Pass program to all students regardless of their distance from school may further improve attendance.
Footnotes
Acknowledgements
We wish to acknowledge those who made this research possible. The study was funded by the Twin Cities Metropolitan Council. The implementation of this study was guided by the Technical Advisory Group at the Transitways Impacts Research Program at the University of Minnesota. In addition, we would like to acknowledge the efforts of Rachel Dungca, Project Manager- Strategic Initiatives at Metro Transit; Robert Gibbons, Retired Director of Customer Services and PR at Metro Transit; Jon Ledeboer, Go-To Pass Coordinator at Minneapolis Public Schools; and the staff at both these organizations who helped significantly with data collection efforts.
Author Contributions
The authors confirm contribution to the paper as follows: study conception and design: Y. Fan; data collection: Y. Fan and K. Das; data analysis and interpretation of results: N. Wexler and Y. Fan; draft manuscript preparation: Y. Fan, N. Wexler, G. Ryan, and K. Das. All authors reviewed the results and approved the final version of the manuscript.
Declaration of Conflicting Interests
The author(s) declared no potential conflicts of interest with respect to the research, authorship, and/or publication of this article.
Funding
The author(s) disclosed receipt of the following financial support for the research, authorship, and/or publication of this article: This work was supported by the Metropolitan Council (Contract No. 14I026).
Data Accessibility Statement
Data will be shared on request subject to IRB approval. Please email the corresponding author Dr. Yingling Fan at