



Abstract
Investment in road infrastructure is an integral part of the development strategy of any country. The challenge for policy makers, road planners, and engineers is to provide roads that meet their functional and structural requirements in a cost-effective way. The spectrum of options ranges from earth to gravel, to low-cost surface treatments, to full paving with asphalt or concrete. The key question is, which roads to pave and which ones not to pave. Standard practice in rural road project evaluation is based on an economic analysis that uses a discounted comparison of the costs and benefits of paving versus nonpaving solutions over the project life cycle. The benefits identified are usually related to travel time and vehicle operating cost savings, and fail to capture important but hard-to-quantify benefits such as climate resilience, dust avoidance, land value improvements, benefits to nonmotorized transport users, and the reliability of the road in the rainy season. This paper presents a paradigm shift and introduces the Systematic PAving DEcision model—SPADE—which considers variables under a multicriteria analysis that affects the paving decision in a systematic and holistic way, while maintaining economic justification.
Keywords
Investments in road infrastructure to enhance access and mobility are critical to the economic development agenda. Bridging the road infrastructure gap is essential because inadequate road infrastructure retards economic growth potential by undermining the export competitiveness of agricultural produce and other manufactured goods; it curtails opportunities for employment and business development, and impedes human development efforts in health and education. For rural roads in particular, the direct benefits of travel time-savings and vehicle operating cost (VOC) reductions from the provision of infrastructure decrease the costs of transport access to markets, jobs, schools, hospitals, and other social, economic, and administrative services.
There have long been significant efforts made by governments and development partners to increase road-sector revenues to secure the sustainability of investment and maintenance in the transport sector. However, available resources for road development and maintenance are always limited and must therefore be deployed to their best use. The challenge for policy makers, road planners, and engineers is to provide roads that meet their functional and structural requirements in a cost-effective way. To do this, the spectrum of options ranges from providing an earth surface to gravel, to low-cost surface treatments, to full paving comprising asphalt or concrete surfaces. Other critical improvements may also be needed for drainage, climate resilience, crossing structures, or road safety enhancements. Standard practice in rural road project evaluations is based on a traditional economic analysis using a discounted comparison of the costs and benefits of paving versus nonpaving solutions over the project life cycle. This analysis is also hinged on the premise that roads will receive adequate maintenance following the initial intervention. Benefits are usually related to travel time- and VOC savings, which rely on traffic volumes as the critical underlying factor.
At the same time, rural roads are becoming increasingly more vulnerable to the extreme effects and more frequent climate change events with cyclones, floods, landslides, and heat waves often causing significant damage to road networks. Resilience elements must therefore be built into the road infrastructure so that these valuable assets can withstand the climatic forces and effects that they will be subjected to over their life cycle.
Many beneficiaries, if given the choice, would prefer to have their roads paved. However, with scarce resources, not all roads can be paved. Although a one-size-fits-all solution is unfeasible, the need to standardize and systematize the paving decision process is pressing. A tool that could do this would be expected to help policy makers and other stakeholders consider the paving question in a holistic way. This would result in significant savings of public resources spent on the road sector over the long term, while achieving and balancing various development objectives.
This study proposes an alternative approach to the traditional economic analysis, which considers the various variables that affect decisions about paving in a systematic and holistic way, while providing economic justification. The approach presents a systematic decision framework that road authorities and development practitioners can use to help them decide whether to pave or not to pave a road or set of roads, and recommends alternative options.
Literature Review
There are primarily three approaches to the pavement decision-making process: a pure economic analysis (PEA) that uses a cost–benefit analysis (CBA); a cost-effectiveness analysis (CEA); and a multicriteria analysis (MCA). Given the preponderance of factors that impinge on paving decisions, the MCA approach offers the greatest potential for a meaningful and workable solution to the paving decision problem. However, as this approach fails to yield an economic parameter—that is, a net present value, or an economic internal rate of return—it needs to be supplemented by either a CBA or a CEA, for a more comprehensive solution.
Cost–Benefit Analysis
There are several different economic and engineering models that carry out CBAs; some of the most common are the Highway Development and Management Model (HDM-4), which estimates over time the deterioration of paved and unsealed roads, and the resulting agency and user costs to perform a CBA of various alternatives; the Roads Economic Decision model (RED), an Excel model customized for the economic evaluation of low-volume roads (LVRs). RED performs a simplified CBA for road projects, based on HDM-4 principles. The CBA of a road intervention depends on a confluence of factors. These include the evaluation period and discount rate adopted; the project road terrain, condition, and traffic; the paving characteristics and costs; vehicle fleet characteristics; the expected normal traffic growth rate, and generated and/or induced traffic; and the assumptions made about the cost of road maintenance—with and without the project—over the evaluation period.
Examples traditional PEA use include the following. In one study ( 1 ), LVR surface types were analyzed using a pavement management system created for the United States Forest Service’s LVR network. Three pavement types were considered: aggregate (gravel), surface treatment (chip-sealed), and hot mix asphalt (HMA). Total life-cycle costs (LCC) for each surface type were estimated based on various traffic mixes and volumes. The results showed that the gravel and chip-sealed roads became more expensive than HMA-surfaced roads as traffic increased, owing to higher maintenance and rehabilitation costs. A study by Kerali et al. involved determining the economic viability of upgrading LVRs using the HDMIII model ( 2 ). They found that the crossover point to pave a road depends on the discount rate. At a discount rate of 5%, the crossover point was just above 100 vehicles per day (vpd). At a discount rate of 10%, it was around 200 vpd. Kerali et al. also found that of the factors beyond traffic, only rainfall and high vertical alignment (topography) had significant effects on the break-even point. They established that in mountainous areas with high rainfall, the break-even point for upgrading from gravel to sealed road ranged from 50 to 150 vpd, a lower threshold than in more typical environments. Rukashaza-Mukome et al. examined when it was economically advantageous to upgrade and pave roads ( 3 ). The researchers concluded that once average annual daily traffic (AADT) is between 100 and 200 vpd an upgrade to a gravel road should be considered.
Cost-Effectiveness Analysis
CEA compares the costs of an intervention with its expected impacts on the target beneficiaries. It is more generally applicable when the focus is on poverty or other social impacts of an intervention rather than a pure economic impact. It is also appropriate when benefits cannot easily be quantified in monetary terms. In short, it is an attempt to find the least costly way of delivering the stated objectives. A cost-effectiveness indicator (CEI) is calculated for each road link based on the following formula:

The CEI is then used to prioritize proposed rural road improvements. The highest priority is assigned to the road links that present the best CEI, that is, the lowest ratio of per capita capital investment. Fiscal constraints can also determine where the cutoff point is on the CEI. Given the existing resource constraints, a suitable threshold must be established. For example, it might be decided that no road project should exceed $1,000 per inhabitant, considering, for example, a gross national income per capita threshold in a low-income country context.
Multicriteria Analysis
MCA is a practical solution for balancing the factors that impinge on paving decisions, and thus helps to determine the priority roads for upgrading. Under an MCA, points are given to criteria that are thought to be important to the paving decision; then weights are applied to each of the criteria in a predetermined manner. Each road link is allocated several points corresponding to the fulfillment of the criteria, and the corresponding weights are applied. The sum of the weighted points provides a measure of the rank for that road link in the investment decision. Using this approach, it is important for policy planners and evaluators to have a clear understanding of the most critical factors, and how to justify the weights that are assigned, so as not to bias the final decision.
One study by Benchmark Engineers ( 4 ) proposes an interesting approach that combines traditional PEA with a quantification of other noneconomic factors; most of this work is based on a study by Zimmerman and Wolters ( 5 ). Benchmark Engineers undertook a detailed study to advise Laramie County in Wyoming using data from the experience of other jurisdictions in the country, proposing a step-by-step procedure for making this difficult decision based on both economic and noneconomic factors. In 2006, researchers developed the Three-Step Surfacing Alternative Decision Framework ( 6 ). The main factors considered are topography, climate/soil condition, nonmotorized traffic demand, motorized traffic volume, potential impact of dust, community impact, traffic increase after sealing, and availability of quality materials. A study by Dissanayake and Patel developed gravel road paving guidelines based on research in the state of Kansas using the MCA method ( 7 ). They identified the key factors in the decision-making process as agency cost, safety, VOCs, traffic volume, purpose of road usage, and public preference. Equations were formulated to carry out an LCC analysis along with a present worth evaluation, which provided flexibility for calculating agency costs while considering local conditions. In a study from Rwanda ( 8 ), eight criteria were selected to gauge the effects and benefits of feeder road improvements. Weights were based on the overriding policy objectives, and the socioeconomic and technical features of the area that were traversed by the roads under evaluation. Reliance of an evaluation/prioritization will depend on the quality of the socioeconomic data used in the exercise.
Challenges With the Traditional Approaches
Traditional approaches present several challenges: (i) they fail to capture important, hard-to-quantify social and other economic benefits, such as land value improvements, attracting business opportunities, health benefits from reduced dust, and considerations for nonmotorized transport users; instead, focusing exclusively on savings in road agency costs, VOCs, and travel time-savings for vehicle users; (ii) they bias investment toward more prosperous areas where vehicular traffic demand levels are already more established owing to higher motorization, thus, discriminating against investment in poorer areas; (iii) they are more suited to dealing with high- than low-traffic roads; yet many rural roads are characterized by lower levels of traffic volume; and (iv) they fail to factor in important climate change considerations and other externalities such as ever-increasing extreme weather events, and fail to properly quantify other externalities like road safety, and greenhouse gas (GHG) emissions from transport. As a result, such approaches usually yield regravelling as the solution in most rural LVR contexts, since the calculated benefits of travel time-savings and reduced operating costs are insufficient to justify the higher costs associated with bringing the road to some form of paved standard. Researchers have found that for rural road investment decision-making, the PEA approach is unsatisfactory because there is a potentially sizable share of benefits that these roads bring that cannot easily be measured in monetary terms, or aggregated in a consistent manner with the monetary values arising from the other costs and benefits ( 9 ). As a result, although traditional road project assessment tools are well-equipped to consider several parameters based on strong engineering equations and economic principles, there are other important factors that are not easily monetized, but are highly relevant and need to be considered.
Key Factors for a Systematic Paving Decision
There are seven key considerations that a systematic model needs to consider to develop a more defensible paving decision than one derived from a pure traditional economic analysis:
(i) Fiscal and distributional constraints. Competing sector demands, competing regional demands, capital versus recurrent expenditures, budget constraints, consistency, and reliability of funding;
(ii) Economic and strategic imperatives. VOCs, travel time, poverty, agricultural production, other economic or strategic reasons (tourism, security, cultural, functional classification of the road);
(iii) Institutional, network, and system dynamics. Institutional setup and responsibility for rural roads, road asset management, life-cycle considerations, connectivity, network planning, technical standards, and specifications;
(iv) The differentiated needs of various road users and target beneficiaries. Women, children, men, the elderly, people with disabilities, pedestrians; other nonmotorized transport users including cyclists, animal-drawn cart users; motorcyclists, commercial transporters, and public transport users all have varied needs;
(v) Engineering concerns. Material availability, material quality, haulage distances, axle and other traffic loading concerns, the effects of wind and rainfall, drainage, structures connectivity, slope stability, soil erosion, maintenance, subgrade quality, road condition;
(vi) Climate change considerations. With the ever-increasing frequency of extreme weather events (hurricanes, cyclones, floods, landslides, extreme heat), and the lock-in effect of the provision of transport infrastructure, the long-lasting effects of climate change on the infrastructure of the road over its life cycle need to be properly taken into consideration during the planning, design, and implementation phases; and
(vii) Other Externalities. Road safety, community and occupational health and safety, GHG emissions, the health impact of dusty unpaved roads, depletion of borrow pits, climate change considerations, environmental sensitivities.
Ignoring these factors and concentrating solely or primarily on an economic evaluation driven by vehicular traffic volume that focuses the design on the needs of vehicles rather than the needs of all users could lead to a road being left unpaved, with a variety of negative consequences for its intended beneficiaries.
As discussed, among the three approaches—CBA, CEA, and MCA—given the preponderance of factors that impinge on paving decisions, the MCA approach offers the best hope of a meaningful and workable solution to the paving decision problem. This paper presents a novel systematic model that provides a decision framework for paving rural LVRs, based on a hybrid of MCA, CBA, and CEA: the SPADE-PLUS approach, which can be justified economically, technically, socially, and environmentally.
The Systematic Paving Decision (SPADE) Model
As several road intervention benefits are hard to quantify and are not typically captured in a traditional economic analysis, a systematic framework for deciding whether or not to pave a road was required. SPADE considers a range of variables that affect the paving decision in a holistic way, while maintaining economic justification. By internalizing difficult-to-quantify benefits that are normally not considered in conventional methods, this proposed model offers a paradigm shift. In this framework, there is a move away from designing projects based solely on economic evaluations that prioritize the needs of vehicles, to a more people-centered approach that caters for the needs of all users. The new model also elevates the importance of climate resilience in the context of rural connectivity.
In the literature, several factors recur as being most critical in the decision of whether or not to pave a road. These can be categorized into five groups: country context, regional context, operational environment, road context, and engineering context. The matrix of these categories, and their subfactors, form the framework for the SPADE model using an Excel nonproprietary workbook, as summarized in the following:
▪ A1: Country gross domestic product (GDP) per capita (USD)
▪ A2: Annual funds available for the rural road network
▪ A3: Country Rural Accessibility Index
▪ A4: Share of population (rural)
▪ A5: Percentage of paved roads in the country
▪ A6: Country disaster risk exposure
▪ B1: Agricultural production
▪ B2: Other economic or strategic purpose (tourism, industrial, security, cultural)
▪ B3: Poverty incidence
▪ C1: Maintenance practices: Is continuous routine maintenance for the road network available, and is adequate and timely allocation made for both routine and periodic maintenance?
▪ C2: Rural roads policy, strategy, and plan: Do these documents exist to guide the planning and investment process?
▪ C3: Asset management system (AMS): Is there an AMS for the area of interest that includes a road inventory, condition, and prioritization framework?
▪ C4: Design standards: Are geometric and pavement design standards for rural roads in place?
▪ C5: Materials specifications: Are materials specifications available to guide quality material selection and construction?
▪ D1: Traffic (nonmotorized): Number of Non-Motorized-Transport (NMT) users per day on road: low < 50, medium 50 to 200, high > 200
▪ D2: Public transport: Public transport vehicles per day (any public transport vehicles, not just buses): low < 5, medium 5 to 20, high > 20
▪ D3: Commercial transport (vehicles carrying goods or produce for commercial purposes): low < 20, high > 20
▪ D4: Population served: Number of people served by the road within a 2-km buffer: low < 1,000, medium 1,000 to 5,000, high > 5,000
▪ D5: Schools (within 5-km buffer of road)
▪ D6: Hospitals/health Centers (within 5-km buffer of road)
▪ D7: Markets (within 5-km buffer of road): low 1 or less, medium 2 to 5, high > 5
▪ D8: Administration centers (within 5-km buffer of road)
▪ D9: Dust nuisance to road users and roadside properties (How severe is the dust issue in the dry season for road users and roadside properties?)
▪ D10: Road connectivity (to higher-level classification roads)
▪ D11: Redundancy (If a major link is disrupted, is this road one of the viable alternatives?)
▪ D12: Are women and girls carrying loads on their heads along the project road during a normal day?
▪ D13: Road safety (Have the most likely increased crash risks [from higher speeds] been identified? Have plans been made for how to mitigate these risks through adequate infrastructure protection for road users [including vulnerable ones]?)
▪ D14: Environmental sensitivity (park/reserve, flora, fauna; Does the road cross or is it within a 2-km buffer of sensitive ecological areas?)
▪ D15: Functional classification of the road (primary, secondary, tertiary)
▪ D16: Public preference (Has the road section been identified as among the priority sections for paving by the local population and authorities?)
▪ E1: Drainage (Is proper drainage provided, or will it be easily integrated into the design?)
▪ E2: Structures for connectivity (Will there be a need for crossings or hydrological structures?)
▪ E3: Materials availability (Are quality gravel materials available within a reasonable hauling distance [<10 km]?)
▪ E4: Climate (low rainfall < 500 mm/year, medium 500 to 1,500 mm/year, high > 1,500 mm/year)
▪ E5: Flooding risk from low-lying road/plain/embankment
▪ E6: Traffic (motorized; low < 50 vpd, medium 50 to 200 vpd, high > 200 vpd)
▪ E7: Prevailing terrain, that is, the majority classification (flat, rolling, mountainous; cross-slope: flat 0 to 10%, rolling 10% to 25%, mountainous >25%)
▪ E8: Right of way (RoW) issues (Is land for road construction available without RoW issues?)
▪ E9: Existing subgrade (quality of existing subgrade; weak California Bearing Ration (CBR) < 15, fair CBR 15 to 25, good CBR > 25)
▪ E10: Condition of the road (poor IRI > 10, fair IRI 5 to 9, good International Roughness Index (IRI) < 5)
▪ E11: Estimated paving cost as a multiple of the cost of gravel.
The above elements are all factored into the SPADE decision process. Scores are assigned for each of the factors in the SPADE model using the scales provided, with each being noted as normal (single weighting), critical (triple weighting), or super-critical (quintuple weighting). The model then combines the scores from the five groups for a total weighted score, with scaled percentages assigned, respectively, 10%, 10%, 10%, 40%, and 30%. Total weighted scores are thus obtained to generate what is termed the paving priority score (PPS). The model was calibrated and validated for these weightings, as discussed in the “Case Studies for the SPADE Model” section.
For a PPS below 50, there is no compelling justification to pave the road under evaluation. The recommendation is “Do nothing,” or explore cost-effective alternatives like spot regravelling or drainage improvements.
For a PPS between 51 and 70, low-cost paving options like chip seals, Otta seals, cobblestones, or similar surfaces should be evaluated.
For a PPS between 71 and 100, there is a compelling justification to pave, and the full menu of paving options should be considered.
The SPADE-PLUS Approach
SPADE-PLUS is a two-stage, sequential approach that combines the SPADE model and either the RED model or a CEA in Stage 2 (see Figure 1). It allows for handling very complex variables in a simple manner. A sequential approach is preferred to a one-stage approach because it enables decision makers to weigh the merits of paving a road from an MCA approach. This is important given that some factors are not easily quantifiable in monetary terms. In essence, the first stage provides the paving decision (no justification to pave, medium justification to pave, and high justification to pave). The second stage provides the economic justification using the traditionally accepted CBA or CEA approaches.
After the SPADE model has been run as discussed previously, a check is made on the total weighted scores (the PPS), to determine the way forward on the paving decision. For roads with low scores (an overall PPS at or below 50%), there is no compelling justification to pave the road under evaluation. The recommendation in such cases is to do nothing, or to explore other simple alternatives like spot regravelling or drainage improvements. For roads with a medium score (a PPS between 51 and 70%), low-cost paving options like double bituminous surface treatment or Otta seals should be evaluated. For roads with a high score (a PPS over 70%), there is a compelling justification to pave, and the full menu of paving options should be considered.
An economic analysis is carried out for roads that have passed the SPADE for prioritization for paving with a medium or high priority rating, using either a RED model analysis or a CEA to complete the economic justification exercise. The objective here is not to undermine the comprehensive work done at the MCA stage, but rather to complement it. In this economic evaluation, the proposed bifurcation is to use the RED model for higher-traffic roads (>200 AADT) and the CEA for lower-traffic roads (<200 AADT). This AADT threshold has been adopted based on an extensive review of the literature that suggests that below this threshold, economic analysis models that heavily depend on VOCs and travel time-saving benefits tend to yield negative results. It is worth noting that 200 AADT is not a threshold put forward for paving decisions, it is used to define which economic justification tool is to be used in the decision-making process. It is designed to steer the economic evaluation of roads below the threshold to a CEA approach, and those above the threshold to a more traditional CBA approach. It is highly unlikely that an economic evaluation will fail for any road that has successfully passed Stage 1. In the remote event that a road fails under Stage 2, an exception could conceivably be provided by the preparation team, using the results of the MCA assigned in Stage 1 to justify moving forward. Therefore, the economic justification stage under the SPADE-PLUS approach is useful primarily for validation purposes. For this reason, it is not recommended that road ranking and prioritization decisions be made based on Stage 2, but rather the Stage 1 results.
Undertaking the traditional economic approach without making use of the SPADE model outlined in Stage 1 will result in running into the same challenges that have been fully described previously. On the other hand, undertaking the SPADE model analysis on its own, without the second step of economic justification using either the RED model or CEA, will result in an incomplete economic evaluation exercise.
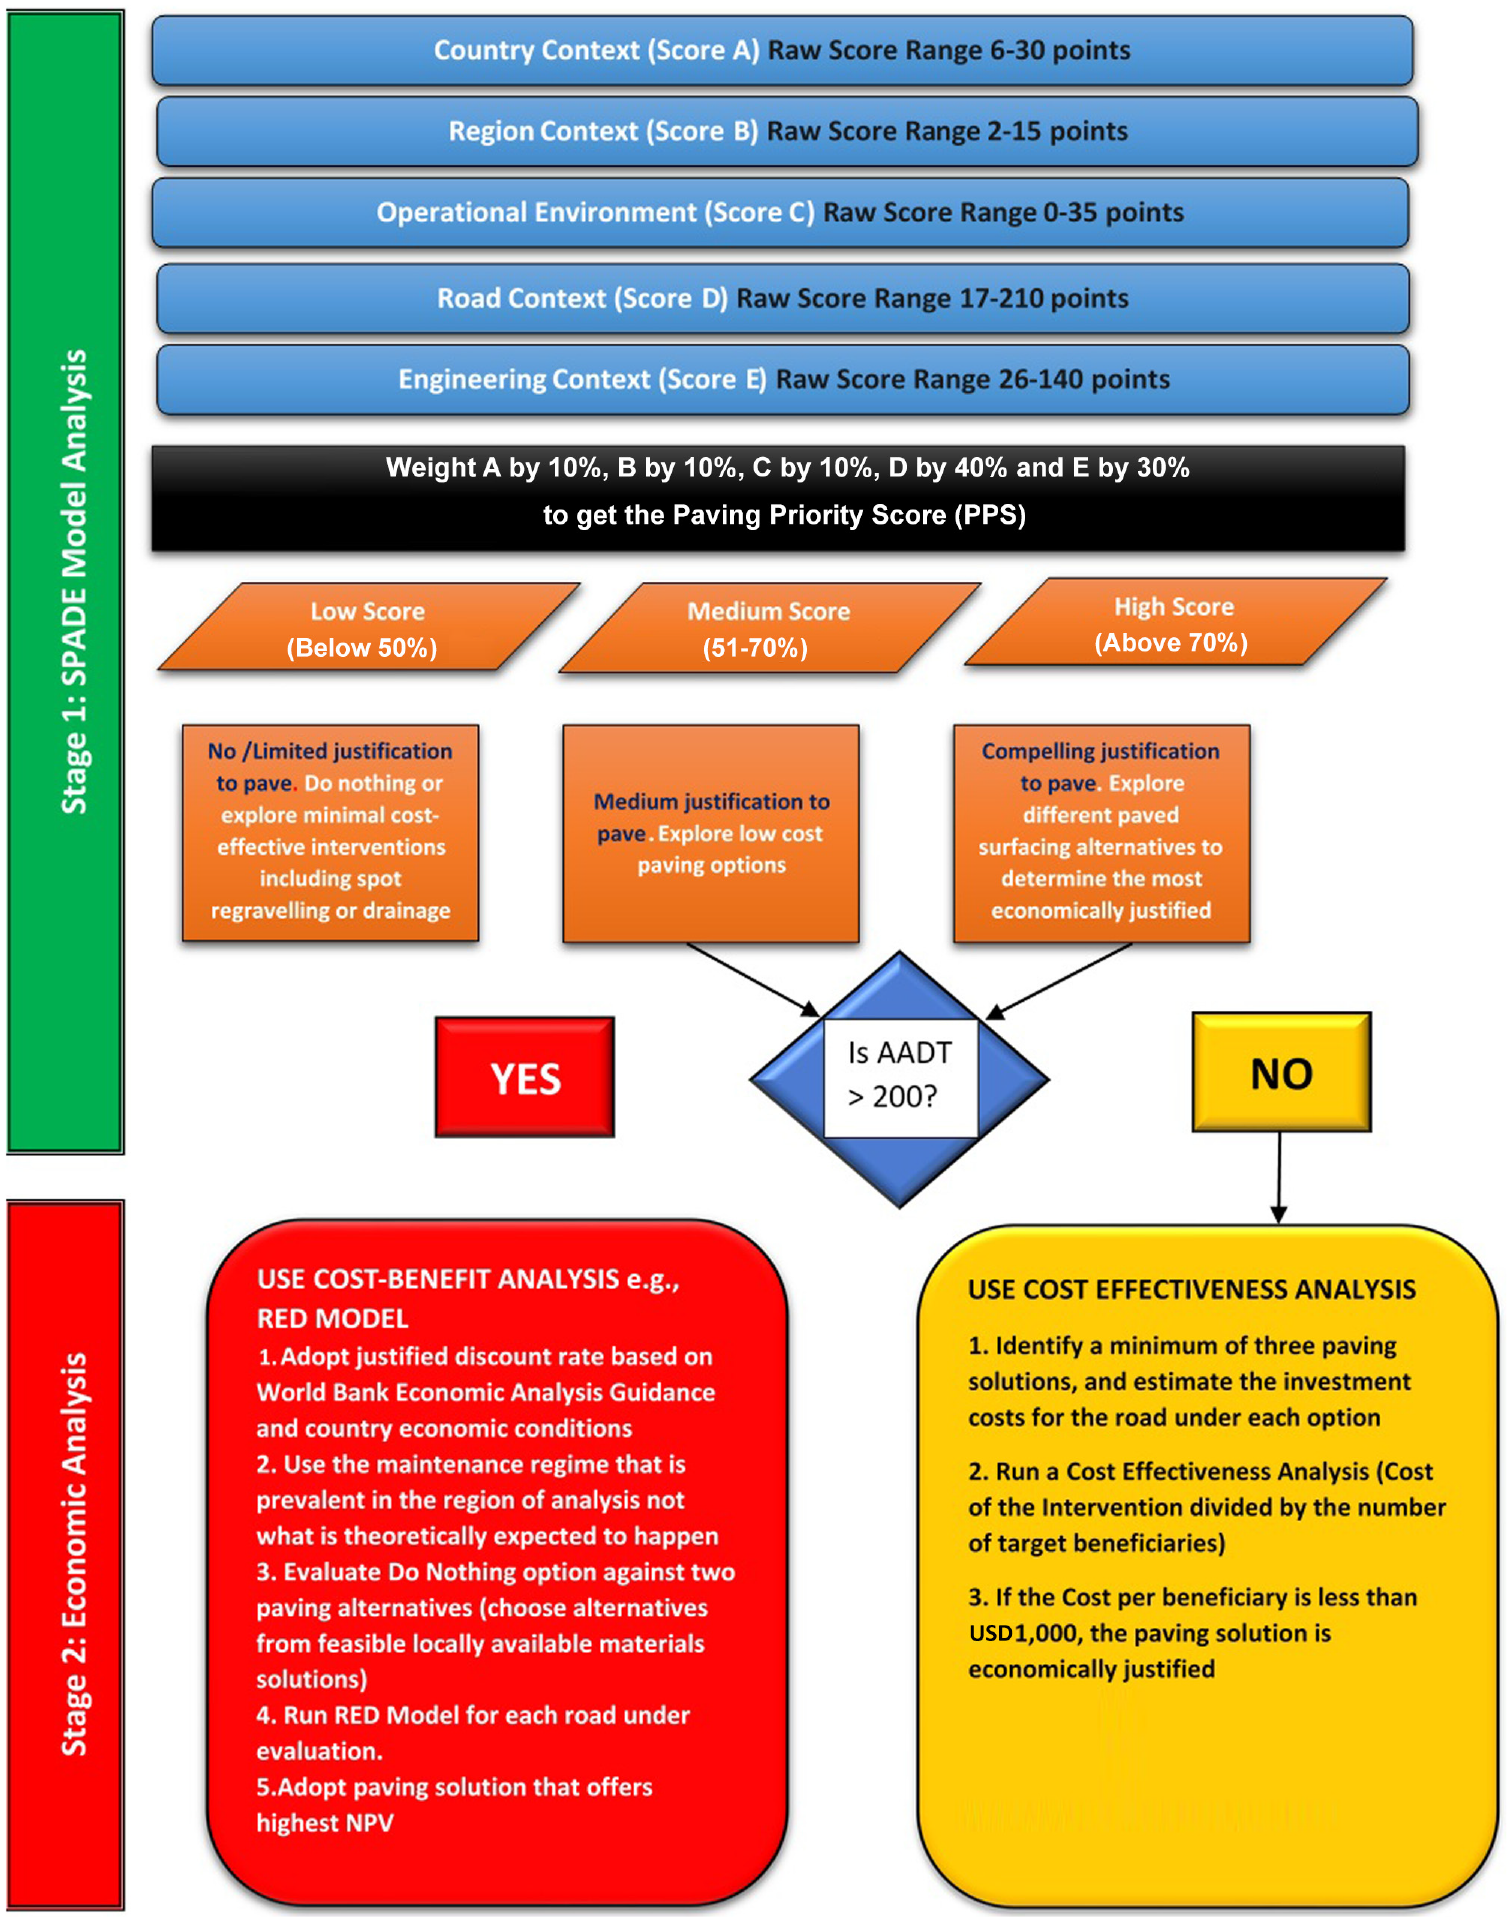
SPADE-PLUS framework.
Case Studies for the SPADE Model
The SPADE-PLUS approach has been calibrated and validated with case studies from six countries in three continents (Ethiopia, Mozambique, Rwanda, and Tanzania in Africa; Laos in Asia; and Nicaragua in South America). A total of 54 sample rural roads from different programs were selected for testing, and evaluated using input data drawn from available feasibility studies. The traffic distribution in the case study roads was 20% with an AADT above 400, 60% with an AADT between 50 and 400, and 11% with an AADT below 50.
The SPADE PPS ranged from 49% to 84% over the 54 selected roads, with a mean score of 68, a median score of 68, and a standard deviation of 9. The SPADE model recommended that 53 of the 54 case study roads be paved (98%). The distribution was as follows: 1 road (2%) low priority (with a recommendation not to pave); 32 roads (59%) medium priority (low-cost paving solution recommended); and 21 roads (39%) high priority (all paving solutions possible). For the 45 roads that also ran a traditional RED model analysis at a 12% discount rate, the SPADE model recommended that all 45 roads be paved (100%), whereas the traditional RED model recommended that only 38 out of the 45 be paved (84%).
To further validate the SPADE model, a worst-case scenario was also investigated, in which a hypothetical road was envisaged, to test the lower boundary. This hypothetical road bears the following features: the road is in a country with a relatively high GDP, a high Rural Accessibility Index (RAI), a relatively low share of rural population, where most of the paved roads have a low disaster risk. This road is not in an agriculture zone, has a low level of strategic purpose, and there is no rural road policy or manual in place. This road was envisaged as low volume, not connected to markets/schools/hospitals, and located in an unfriendly engineering environment. The hypothetical run yielded a PPS of 25%, with a recommendation of “no paving” provided by SPADE. This case study helps to demonstrate the credibility of the proposed SPADE model, and the thresholds that have been set.
The test results and case studies described soundly validated the satisfactory performance of the SPADE-PLUS approach proposed; it was found to work efficiently as a user-friendly screening, prioritization, and guidance tool, with data inputs that were relatively easy to obtain. The RED model, in conjunction with CEA, which could also be used depending on the traffic levels, was found to be a suitable economic justification tool that worked well with the SPADE model, for the more comprehensive SPADE-PLUS approach. Given the SPADE model’s ability to capture social, economic, and environmental factors, the paving recommendations provided by SPADE offered a more comprehensive perspective than the traditional economic considerations when it came to the question of whether or not to pave a road.
Key Lessons From the Case Studies
If a traditional CBA approach were to be used, 16% of the roads considered in these case studies would not be justified for paving, but they would be justified for paving under the SPADE-PLUS approach.
Using the SPADE-PLUS approach enables more roads to be paved, which is a good outcome considering climate change, since a paved surface is better able to withstand the erosive and abrasive forces of water, wind, and traffic than a gravel road surface.
The SPADE-PLUS approach enables both the policy maker and the road practitioner to provide a comprehensive explanation for why they are making the recommendation to pave a road or not, in a way that is transparent and can be easily understood by everyone, including nontechnical persons.
The SPADE model has been built in such a way that all variables are known, for the sole purpose of aiding the paving decision-making process to proceed in a holistic way.
Because of the need to standardize the model for application on a broader scale, the parameters that have been chosen, and the weightings applied to them individually, as well as to the broader grouping buckets have been preset. This does not preclude a government agency or road authority that has very specific policy objectives from using the default SPADE model as a template and customizing it according to their needs.
The case studies confirmed the a priori hypothesis that traditional approaches tend to overlook critical social, environmental, and economic variables that are relevant at the time of paving. The SPADE model approach yielded a higher percentage of roads recommended for paving than traditional approaches, but remained robust and defensible since it rejected roads that did not have ample social, economic, or other justifications. The majority of cases lent themselves to a solution of “medium priority to pave,” which means using low-cost paving solutions like Otta seals, surface dressing (single or double bituminous treatments), or other stone dressings. A small sample of roads had a “high priority to pave” recommendation, which allows for all paving options including asphalt and concrete solutions. Some roads despite the new approach would still remain unjustified for paving.
Conclusion
The provision of a rural road needs to be publicly desired, politically supported, socially acceptable, economically justified, safely designed, environmentally sustainable, technologically appropriate, and locally contextualized. The SPADE model underscores the need to address all these critical factors in a paving decision rather than rely on simplistic parameters hinged primarily on AADT.
This approach fills an important knowledge gap in relation to how to overcome the limitations of the traditional cost–benefit economic evaluation approach used in rural road operations. The approach is simple, robust, defensible, and amenable for application over a wide swathe of countries and local contexts.
The SPADE-PLUS (SPADE + RED + CEA) approach was presented and justified as the next frontier in rural road prioritization and evaluation, and its improvements over current approaches were showcased (10). The proposed approach is a two-stage process that introduces a novel model: the SPADE model, which takes into account an MCA of the prevailing macro and micro contexts in the first step, before the RED model analysis or a CEA can be undertaken in the next stages. The SPADE model considers the country context, the regional context, the operational environment, and the specific road context to make a preliminary decision about which roads have either no justification, or limited justification for paving; which have moderate justification for paving; and which have high justification for paving. Whether to use RED or CEA hinges on current traffic levels (for AADT over 200, the RED model is recommended, whereas for AADT under 200, CEA is recommended). The SPADE-PLUS approach has been developed and tested as fit-for-purpose.
There is enormous value to be gained from using this SPADE-PLUS approach in supporting more transparent allocation of resources for paving decisions. By design, the SPADE model balances several critical paving considerations, and therefore equips road practitioners and transport policy makers with qualitative and policy arguments in support of attracting resources to rural road challenges. It also equips transport practitioners with elements to communicate to nontransport specialists who, in most cases, are the ones allocating scarce public resources.
Footnotes
Acknowledgements
The authors acknowledge the contributions of all World Bank staff and consultants that contributed to this work, and that are mentioned in the World Bank published report ( 10 ).
Author Contributions
The authors confirm contribution to the paper as follows: study conception and design: S. Muzira, W. Qiao; data collection: S. Muzira, W. Qiao; analysis and interpretation of results: S. Muzira, W. Qiao; draft manuscript preparation: S. Muzira, W. Qiao. All authors reviewed the results and approved the final version of the manuscript.
Declaration of Conflicting Interests
The authors declared no potential conflicts of interest with respect to the research, authorship, and/or publication of this article.
Funding
The authors received no financial support for the research, authorship, and/or publication of this article.
