



Abstract
The purpose of this research is to provide a comprehensive evaluation of the effects of a solid pelletized plastomeric polymer on asphalt mixtures’ properties and performance with respect to different distresses. Five asphalt mixtures—a control mixture (no polymer); asphalt mixtures with 2.5%, 5.0%, and 7.5% polymer content; and a mixture with 5% polymer and lower asphalt binder content—were evaluated. The laboratory testing campaign included complex modulus, direct tension cyclic fatigue, semi-circular bending, disk-shaped compact tension, and asphalt pavement analyzer tests. Advanced performance-based simulation programs—MnPAVETM, FlexPAVETM, and ILLITC—were utilized to predict mixture performance in the context of pavement structure and local traffic and climatic conditions. In addition, four field test sections were constructed for all but the mixture with the reduced binder content and falling weight deflectometer (FWD) testing was conducted on the test sections. Based on the results of laboratory testing and performance simulation it can be concluded that the study modifier significantly improved the rutting performance and slightly improved the mixture fatigue performance. The study modifier did not show a considerable positive or negative effect on the thermal cracking performance. Based on the FWD results, solid polymer is potentially a good option to increase the stiffness of the asphalt concrete (AC) layer.
Keywords
Because of the increase in the number of vehicles and traffic loads in recent decades, significant improvements in production and construction technologies of asphalt mixtures have been made and implemented to reduce the potential for distress in pavements. Asphalt mixture modification has gained much attention as an effective method to improve pavement properties. Considerable research efforts have been conducted by highway agencies and researchers to investigate the effects of different types of modifiers on asphalt mixture properties, and a wide range of materials has been studied ( 1 ). One of the most common forms of modification is polymer modification of the asphalt binder. Most common polymer modifiers are either blended in as liquids or at elevated temperatures to melt and disperse them into liquid binder. Polymers, such as styrene-butadiene-styrene (SBS), styrene-butadiene rubber (SBR), and ethylene-vinyl acetate (EVA), have been commonly used and shown to improve the performance of asphalt mixtures, including an increase in stiffness at high temperatures to prevent rutting, and increase in flexibility at intermediate and low temperatures to minimize fatigue cracking, thermal cracking, and frost-heave-related cracking. Researchers have also shown that polymer modification is particularly useful in cold climate regions as it allows for the use of a soft base binder to prevent thermal cracking while providing stiffness at high temperatures to prevent rutting ( 2 ).
Mirzaiyan et al. investigated the rheological and physical properties of asphalt binders modified with SBS ( 3 ). They claimed that asphalt binders modified with SBS are less susceptible to temperature variability and that SBS could improve the rheological and mechanical properties of the asphalt binders.
Newman utilized the bending beam fatigue test to evaluate the effect of SBS and SBR on airfield mixtures performance ( 4 ). The results showed significant improvement in asphalt mixture fatigue properties and that the polymer modification can also improve asphalt mixture thermal cracking performance. Isacsson and Zeng used a thermal restrained specimen test to assess the effect of five polymer modifiers in three asphalt-mix designs ( 5 ). The results showed that all of the modifiers improved low-temperature thermal cracking resistance; however, the effectiveness of the modification is heavily dependent on the polymer type, mixture volumetrics, and aging level ( 5 ). While polymer modification has been widely used to improve asphalt mixtures’ performance, it is not without its challenges. All three commonly used polymers modification systems (EVA, SBS, and SBR) require a binder blending facility to add and fully activate the polymer within the binder through a series of chemical reactions. Another concern with using polymer modified binders is that they require controlled storage environments (e.g., specialized storage tanks and heaters) for proper handling; this is challenging, especially in remote regions where temporary plants, without specialized equipment, are used.
Use of polymer modification is a challenge when considering rapid deployment and construction, where blending and storage facilities may not be readily available. To address this issue, recent work has led to the development of a new type of polymer known as “solid polymer,” which can be added to the mixture through a dry mixing process ( 6 ). Solid polymers are introduced into the pugmill or drum mixer at the asphalt plant instead of being mixed into the binder, forgoing the need for any specialized equipment in the standard asphalt mixture production procedures. Another advantage of solid polymers is that they can be stored dry in bags or containers so that they are always available and ready for quick deployment in remote regions. Despite the benefits of the solid polymer, there has been a limited amount of research conducted on these materials in the laboratory and at asphalt production and pavement scales ( 7 ).
The objective of this study is to perform a comprehensive evaluation of the feasibility and benefits of using solid polymer as an additive to improve the pavement performance with respect to different distresses. This paper presents a comprehensive performance-based laboratory testing program coupled with the use of advanced performance prediction software, and also includes in situ evaluation of field sections using a falling weight deflectometer (FWD).
Materials
Laboratory Specimens
Five plant-produced asphalt mixtures containing various dosages of a solid polymer product were used. Mixture types include a control material without added polymer and mixtures with 2.5%, 5%, and 7.5% polymer by weight of binder. An additional 5% polymer mixture was also produced whereby the added weight of polymer was compensated for by removing the same amount of binder from the mixture (5% minus). Modification doses were selected based on the manufacturer recommendation and, since the intent of this study is to evaluate various dosages of modifier, the certain binders performance grade (PG) were not targeted. The detailed mixture information for these five mixtures is shown in Table 1:
Mixture Design Information

Note: PG = performance grade; NMAS = nominal maximum aggregate size.
Construction of Test Sections
As part of this study, four field test sections were constructed in June 2019 to evaluate the performance of the polymer-modified mixtures over time. The reduced binder content mix was not included in the field study because the purpose of test section evaluation was to investigate the solid polymer effect on asphalt mixture performance without changing the original mix design. The site chosen for this work was a low-volume road in New Hampshire, U.S., where the average winter low temperature is −27°C with 30 to 60 annual freeze–thaw cycles. The test sections were designed as a 5.08 cm (2 in.) overlay over an existing pavement. The existing pavement is a conventional asphalt pavement with a 7.62 cm (3 in.) asphalt surface, and 20.32 cm (8 in.) full-depth reclamation base material, all of which is constructed on an A-2-4 silty sand subgrade. Figure 1 shows the pavement cross-section schematic for the constructed test sections. The most prominent distress in the existing pavement was transverse cracking at moderate severity spaced approximately every 9.1 m (30 ft). Four sections were set up as pairs in the adjacent lanes of the low-volume road as shown in Figure 2. The target length for each test section was set as 152.4 m (500 ft) with 4.572 (15 ft) transition zones at the beginning, the end, and in-between the test sections to facilitate paving operations and allow smooth transitions between test sections. Before paving of the test sections, the existing transverse cracks were sealed with a mastic-based crack sealant, and an RS-1 rapid-setting emulsion tack coat was applied at a residual rate of 0.226 l/m2 (0.05 gal/yd 2 ).
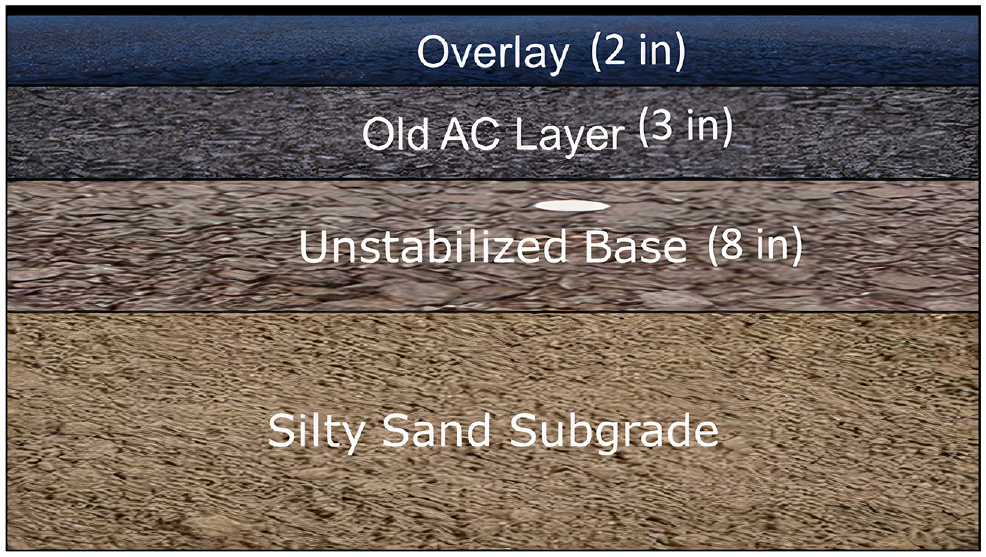
Pavement cross-section.

Test sections layout.
Testing and Analysis Methods
Mixture Laboratory Testing
The experimental campaign included complex modulus, direct tension cyclic fatigue (DTCF), semi-circular bend (SCB), disk-shaped compact tension (DCT), and asphalt pavement analyzer (APA) tests.
Complex modulus testing was carried out on asphalt mixtures in accordance with AASHTO T 342, standard method of test for determining dynamic modulus of hot mix asphalt (HMA) ( 8 ). Three cylindrical specimens were tested for each mixture at different temperatures (4.4°C, 21.1°C, and 37.8°C) and frequencies (25, 10, 5.0, 1.0, 0.5, and 0.1 Hz) to capture the rheological behavior of asphalt mixtures. Asphalt mixture performance tester (AMPT) equipment was used to conduct the test. Dynamic modulus and phase angle were calculated as test outputs and RHEA® software was used to construct the master curves based on the time-temperature superposition principle.
To investigate the damage characteristics of asphalt mixtures, DTCF fatigue testing was performed on specimens in accordance with AASHTO TP 107, standard method of test for determining the damage characteristic curve and failure criterion using the AMPT cyclic fatigue ( 9 ). At least three replicates were tested for each mixture. Test temperature of 18°C was selected based on the performance grade of the asphalt binder. The tests were conducted at 200 microstrain, 250 microstrain, and 300 microstrain peak to peak on specimen strain levels to obtain a range of number of cycles to failure (Nf). The test was conducted by applying sinusoidal tensile loading at a frequency of 10 Hz in crosshead-controlled mode until failure.
The simplified viscoelastic continuum damage (S-VECD) approach was used to analyze the fatigue test results using data acquired during complex modulus and fatigue tests. Four parameters have been used to investigate the fatigue performance of asphalt mixtures:
G R is the rate of the average reduction in material integrity and can be computed through Equation 1. The number of load cycles at GR = 100 is usually used to rank mixtures with respect to expected fatigue performance. The higher the GR, the better the fatigue resistance of the mixture ( 10 ).
DR is the amount of average drop in material integrity (1-C), per load cycle until failure. The DR value can be measured using Equation 2. Mixtures with a higher DR value would be expected to have better fatigue resistance ( 11 ).
Sapp can consider the effects of both modulus and toughness to determine asphalt mixture resistance to fatigue damage. Sapp is defined as the amount of damage accumulation (S) when pseudo-stiffness equals 1-DR and can be measured through Equation 3. A higher amount of Sapp indicates that the mixture has better fatigue performance ( 12 ).




where
Nf = number of load cycles to failure,
C = pseudo stiffness,
C 11, C12 = model coefficients of the damage characteristic curve (C-S curve) that can be defined as follows: C11 = 10(intercept), C12 = slope,
Sf = accumulated damage at failure,
m = unit correction factor set to 103 to increase the order of magnitude of the
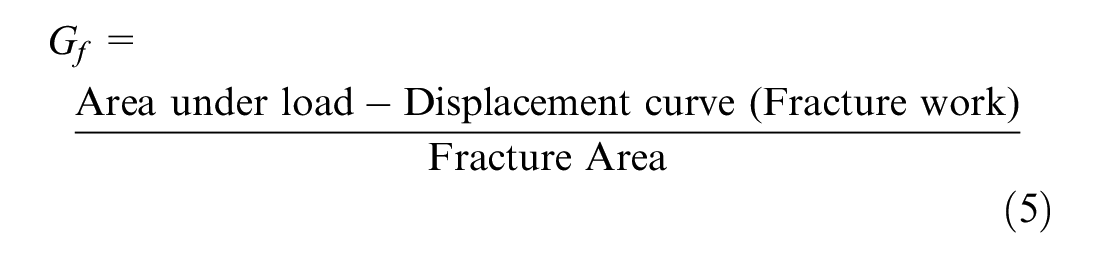
To evaluate the fracture properties of the asphalt mixtures at intermediate temperatures, the SCB test was conducted following the test procedure in AASHTO TP 124 standard method of test for determining the fracture potential of asphalt mixtures using the Illinois flexibility index test (I-FIT) ( 14 ). The test was performed using the line-load displacement method with monotonic loading with a rate of 50 mm/min at 25°C. The fracture energy (Gf) and the flexibility index (FI) were calculated from the SCB test. The Gf indicates the material’s overall capacity to resist cracking (Equation 5). The FI (Equation 6) is calculated from the post-peak slope of the load-displacement curve in the fracture test and Gf. Generally, the FI provides means to rank cracking resistance. Higher the Gf and FI values indicate better expected cracking resistance of a mixture ( 15 ). The current recommended threshold value for FI to distinguish asphalt mixtures with good performance from mixtures with bad performance is eight ( 16 ).

The DCT test was carried out in accordance with ASTM D7313 to investigate the fracture properties of asphalt mixtures at low temperatures ( 17 ). Crack mouth opening displacement (CMOD) was utilized to measure displacements (with a rate of 1 mm/min) on the sample under monotonic load. The DCT testing temperature was determined based on the in-service location (10°C+ performance grade low temperature (PGLT)) using the MERRA climatic data source in InfoPave LTPP program. Since the road is a local road with a low amount of traffic, a 50% reliability level was used, resulting in a continuous PGLT of −25.7°C for the location. This resulted in the DCT test temperature of −15.7°C. Three replicates were tested for each asphalt mixture using the UTM. Gf and fracture strain tolerance (FST) (Equations 7 and 8) were determined from the DCT test to evaluate the cracking resistance of asphalt mixtures at low temperatures ( 18 ). Based on literature, a proposed threshold value for fracture energy is 400 J/m2 ( 19 ). Asphalt mixtures with fracture energy higher than 400 J/m2 are expected to have minimal thermal cracking as compared with mixtures with fracture energies below the threshold.


where
Pmax = the peak load at DCT test,
w = specimen width, and
a = ligament length.
An APA test was performed in accordance with AASHTO T 340-10, standard method of test for determining the rutting susceptibility of hot mix asphalt using the APA ( 20 ). Four test specimens for each mixture were tested at 64°C (the high PG temperature of the virgin/base binder) and rut depth (mm) was measured at the end of 8,000 wheel loading pass to evaluate rutting susceptibility of asphalt mixtures.
In Situ Evaluation of Test Sections
The test sections were visited periodically after construction to conduct distress surveys and FWD testing. A Dynatest 8000 FWD setup with a 300 mm diameter loading plate was used to measure the deflection of the pavement surface on the mid lane and outer wheel path in the direction of travel following LTPP protocol ( 21 ). FWD tests were conducted every 7 m for about 152 m in length for all four sections. FWD tests were conducted four times: 2 months, 5 months, 12 months, and 16 months after construction.
Pavement-layer thickness: The thickness of the asphalt concrete (AC) overlay layer, the old existing AC layer, and the base layer of four sections were determined from the field cores shown in Figure 1.
Seed moduli of the pavement layers:
Asphalt Layer: the seed modulus value for the asphalt overlay layer was determined from the laboratory dynamic modulus curve at 21.1°C and frequency of 10 Hz, and was considered to be 4,500 MPa. The seed value for the old asphalt layer was determined from the FWD test conducted on the existing pavement (without an overlay) next to the overlay sections. The FWD deflection data was then backcalculated to determine the backcalculation moduli of the old AC layer and was found to be 4,850 MPa.
Base Layer: The seed modulus value for the FDR layer was assumed to be 413 MPa according to mechanistic emperical pavemnet design guide (MEPDG).
Subgrade Layer: The resilient modulus of the subgrade at the time of the FWD measurements was determined from the measured moisture content.
The measured FWD deflections at the four drops of the 40 kN load in the outer wheel path were utilized for the backcalualtion analysis. The reason for selecting the FWD deflection data measured in the outer wheel path is that the pavement distress usually occurs in the wheel path. The measured mid-depth temperature of the asphalt overlay layer was considered as the effective temperature to represent the asphalt layer temperature at the time of the FWD measurement. The backcalculated moduli of AC overlay layers were corrected to the standard temperature of 20°C using the asphalt temperature adjustment factor (ATAF) presented in Lukanen et al. for a better comparison amongst test sections to determine whether there is an impact from the solid polymer ( 22 ).
Pavement Performance Prediction
Advanced performance prediction software programs FlexPAVETM, MnPAVETM, and IlliTC were used in this study to investigate the expected field performance of the study mixtures with respect to different distresses.
MnPAVETM
MnPAVETM is a program for pavement design under specific climatic conditions, expected traffic, and given pavement structure and material properties. This software was developed by the Minnesota Department of Transportation (MnDOT) and the University of Minnesota, and implements layered elastic analysis to estimate pavement life, damage factor, layer thickness, and so forth, using a mechanistic-empirical pavement analysis and design approach. MnPAVETM takes into account the variability of inputs such as modulus and thickness using the coefficient of variation (COV). Three levels of design—basic, intermediate, and advanced—can be utilized in MnPAVETM ( 23 , 24 ). In this study, MnPAVETM was selected for simulation of the rutting and fatigue performance of the different study mixtures in the context of pavement structure, and local climatic and traffic conditions. The advanced level was used to investigate the damage factor within the pavement section with respect to fatigue cracking and rutting. Input data have been selected as described below.
Climate Data
Climate data were collected from the National Oceanic and Atmospheric Administration (NOAA) website for the project location ( 25 ). Monthly climate data were then categorized into five seasons to determine the effects of seasonal variation on material properties. Table 2 shows the different season durations and mean air temperature for each season. Seasonal durations were selected based on the mean monthly air temperature. Equation 9 is used in MnPAVETM to calculate pavement temperature at different depths based on average seasonal air temperature.
Seasonal Durations and Temperatures


where
TP = average seasonal pavement temperature (°F),
TA = average seasonal air temperature (°F), and
Z = depth at which temperature is predicted (in.)
Traffic Data
Local traffic data for the project location (Corbin Road) was collected from the New Hampshire transportation data management system ( 26 ). This route was designed as a 2-way rural collector road with total annual average daily traffic (AADT) of 588. Percentage of business commercial (truck) and annual growth rate were found to be 9% and 1%, respectively. The equivalent single axle loads (ESALs) was determined to be 2.03 million ESALs for 20 years design life. Since cold region distresses are largely dominated by environmental distresses, a section with low traffic level was selected intentionally to limit the amount of traffic damage to the road as much as possible/practical.
Material Properties
The pavement structure has been modeled in the software as it was constructed in the field. The old existing AC modulus, base modulus, and subgrade modulus were obtained from FWD back-calculation analysis ( 27 ). The maximum value for the base layer modulus in the MnPAVETM simulation was considered to be 50 kips per square inch because of the software limitations. The modulus of overlays were determined based on dynamic modulus results for the corresponding mixtures. Equation 10 was used for the conversion of dynamic modulus to resilient modulus with respect to traffic velocity (14.31 m/s [mph]) and average tire radius (0.22 m). This resulted in selection of dynamic modulus at a frequency of 5.37 Hz at 21.1°C.

where
s = traffic speed (m/s), and
a = average tire radius (m).
The as-build layer thickness was obtained from the field cores that were taken after construction. Although based on field cores (overlay thicknesses in the field vary at different sections) all sections have been considered with the same thickness (2 in.) in simulations for more direct comparison between different mixtures with different laboratory-measured properties.
To simulate the rutting performance of the asphalt pavement with HMA overlay, MnPAVETM calculates rutting from the layer beneath the overlay (old AC layer). Consequently, the results of rutting damage may not be reliable. To achieve accurate results, the equivalent thickness concept was used to combine the overlay and the old AC layer for rutting analysis. Equation 11 was used for this purpose and the results are shown in Table 3. It should be mentioned that there is not a field test section for the mixture of 5% modifier and reduced binder content; however, the same cross-section as the 5% modified mixture was used for the 5% minus mixture in performance prediction for comparison purposes. Allowable repetitions for fatigue and rutting were determined for the study mixtures in the context of pavement structure.
Equivalent Thickness Based on Old AC Layer Modulus

Note: AC = asphalt concrete.

where
HB = thickness of bottom layer,
HT = thickness of top layer,
EB = modulus of bottom layer,
ET = modulus of top layer,
µB = Poisson’s ratio of bottom layer, and
µT = Poisson’s ratio of top layer.
FlexPAVETM
FlexPAVETM is a mechanistic-empirical (M-E) pavement structural modeling software developed by North Carolina State University (NCSU). It implements a finite-element-based (continuum damage) model in a 3D layered system to capture mechanistic properties of mixtures (i.e., strains and stresses) under traffic load and different climatic conditions. FlexPAVETM uses a cumulative damage model based on Miner’s law to investigate accumulated damage in the pavement cross-section with respect to fatigue performance of asphalt pavement resulting from repeated loading condition ( 28 ). In this study, damage evolution was determined for each cross-section under different traffic loads for a 20-year design life.
Results of complex modulus and DTCF tests for the study mixtures were used as the inputs in FlexPAVETM along with local climatic and traffic conditions. Similar to the MnPAVETM analysis, backcalculated layer thicknesses and modulus for the old AC layer, base layer, and subgrade layer from the FWD test were used as inputs for the performance simulations in FlexPAVETM. The city of Manchester in New Hampshire was selected in the Enhanced Integrated Climatic Model (EICM) database as the closest station to the project location to represent the local climatic conditions. Three traffic levels were chosen based on Superpave volumetric mix design ASSHTO standard to determine the effect of different traffic volumes on the fatigue performance evaluations ( 29 ). Since FlexPAVETM takes into account the viscoelastic properties of asphalt mixture to predict pavement performance, the fatigue performance results were considered to be more reliable as compared with MnPAVETM. Therefore, higher traffic levels were selected in FlexPAVETM software for comparison purposes and to determine how different amounts of solid polymer affect asphalt mixtures’ fatigue performance as traffic level increases. The average value of design ESALs at each traffic level was assumed to be a representative traffic volume for the analysis conducted in this study (shown in Table 4).
Equivalent Single Axle Load (ESAL) Data for Different Traffic Levels

IlliTC
IlliTC is a 2D finite element-based approach that incorporates the cohesive zone model (CZM) to determine thermal cracking potential in the asphalt pavement. The system includes a two-step analysis approach. First, it employs a pre-analyzer to reduce computational time resulting from the nonlinear finite element model (CZM). In the first step of the analysis, thermal stress is calculated at the surface of the pavement using thermal and viscoelastic properties of asphalt mixtures. Then, critical cracking events are determined whenever the thermal stress in the pavement exceeds 80% of the tensile strength of the mixture. As the second step of the analysis, finite element analysis with a cohesive zone fracture model is implemented to analyze the critical events to simulate quasi-brittle and ductile crack propagation (damage) within the pavement. Several research studies have shown that CZM can be utilized as a reliable method to simulate crack propagation in asphalt mixtures ( 30 – 32 ).
Creep compliance data at three temperatures (−10°C, 0°C, and 10°C), the mixtures’ tensile strength and fracture energy, and the mixtures’ physical properties such as VMA% and coefficient of thermal expansion (calculated by IlliTC software based on void in mineral aggregate (VMA)% for each mixture) were used to evaluate the thermal cracking properties of study mixtures. Several predefined locations have been accommodated in the IlliTC software with three different climatic groups (cold, intermediate, and warm) and the user can select among them based on the project. In this study, the cold climatic group in Minnesota has been intentionally selected as the environmental condition for the IlliTC simulation to make sure that the analysis temperature is cold enough for study mixtures to experience thermal cracking, and further compare and differentiate the low-temperature performance of different mixtures. The air temperatures within the analysis period (5 years) are shown in Figure 3. Currently, IlliTC can only conduct the simulation for 5 years because of the graphical interface limitation.
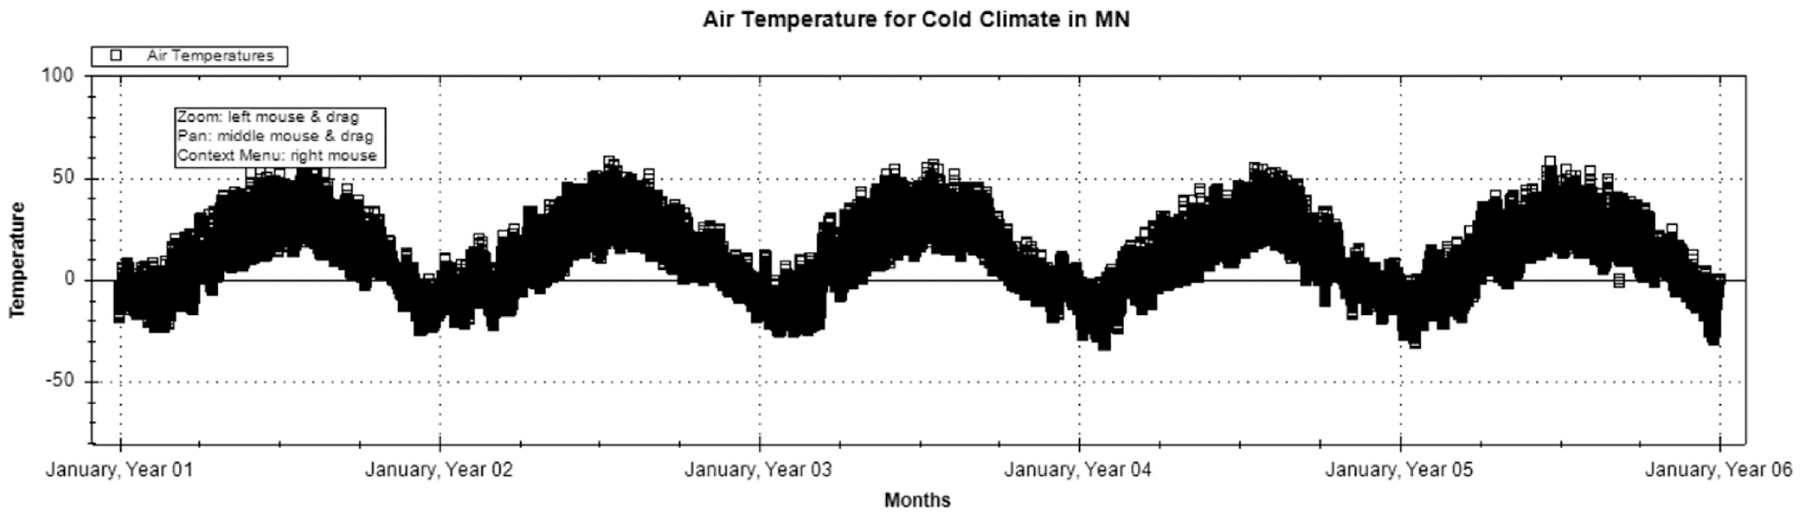
Air temperature for cold climatic group at Minnesota (MN) for 5-year analysis period.
Results and Discussion
Laboratory Tests Results
Complex Modulus Test
The results are shown as an average value of the three replicates. Figure 4a shows a comparison of the dynamic modulus master curves for the four modified asphalt mixtures and the control mix. Based on analysis of variance (ANOVA) at 95% confidence level, all mixtures have statistically similar behavior except the mixture with 5% modifier and reduced binder content. The difference is more pronounced in the lower-frequency range (less than 1 Hz). In this low-frequency range (corresponding to the high-test temperature), the mixture with 5% modifier and reduced binder has higher stiffness (modulus) as compared with others. Figure 4b shows the phase angle master curves. Similar to the dynamic modulus trend, the 5% modifier and reduced binder mixture shows different performance with lower phase angle values in the low-frequency range as compared with other mixtures, indicating lower relaxation capability. Based on the ANOVA at 95% confidence level, other mixtures have comparable phase angle results.
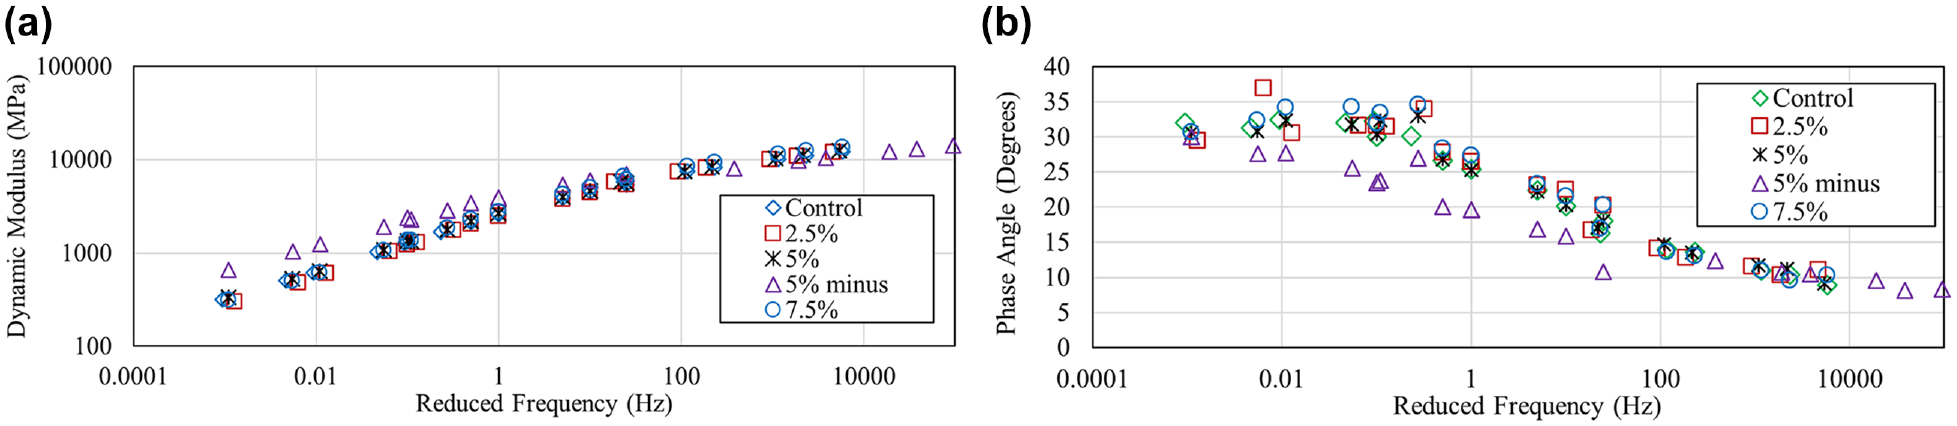
(a) Dynamic modulus mastercurves at 21.1°C reference temperature and (b) phase angle mastercurves at 21.1°C reference temperature.
Direct Tension Cyclic Fatigue (DTCF) Test
Figure 5, a and b, show the Nf corresponding to GR of 100 (Nf at GR = 100) and the DR values for the five study mixtures, respectively. The error bars represent one standard deviation interval from the mean. Similar trends can be seen for both fatigue parameters. According to the results, the presence of modifier improves the fatigue properties of these asphalt mixtures. The mixture with 5% modifier has the best properties followed by the mixture with 5% modifier and reduced binder. The control mixture generally shows the worst fatigue properties as compared with other mixtures. According to the Sapp values shown in Figure 5c, the mixture with 5% modifier and reduced binder shows the best fatigue properties followed by the mixture with 7.5% modifier, while the mixtures modified with 2.5% and 5% modifier have comparable results with the control mixture. It is surprising that the Sapp value for the mixture with 5% modifier and reduced binder is almost 40% higher than the mixture with 5% modifier. It might be because of the selected test temperature that the test does not capture the impact of solid polymer. The test temperature was selected according to the recommended protocol, but the protocol does not include types of modified mixes which could be brittle ( 33 ). The other possible reason could be the addition of polymer did not really contribute to the improvement of mixture resistance with respect to fatigue. Figure 5d shows the number of cycles to failure at CS Nf = 100 for five study mixtures; the mixture with 5% modifier and reduced binder shows the best fatigue properties among all mixtures, followed by the mixture with 7.5% modifier, while the control mixture has the worst fatigue properties. The DTCF test results emphasizes that mixtures’ fatigue resistance cannot be decoupled from the pavement structure, and laboratory testing cannot be solely used to fully capture mixtures’ fatigue resistance.
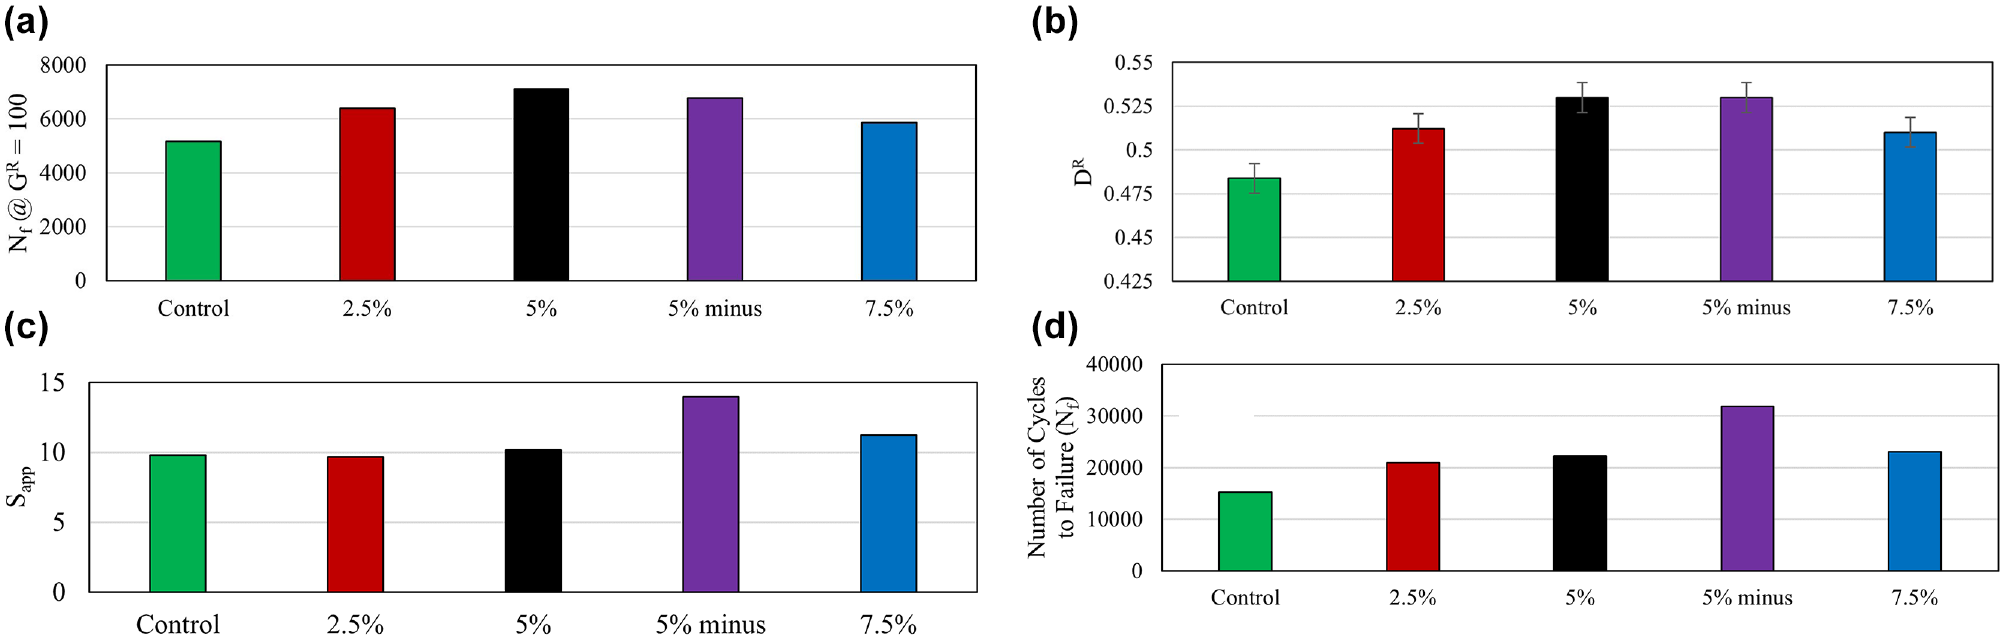
(a) number of load cycle at GR = 100, (b) DR values, (c) Sapp, and (d) number of load cycles at CS Nf = 100.
SCB Test
Figure 6, a and b, show the average Gf and the FI parameter for each mixture with error bars showing one standard deviation interval. As shown in the figures, fracture energy and FI show similar trends. Generally, the presence of modifier can improve the intermediate temperature fracture properties of asphalt mixtures. Mixtures with 2.5% and 7.5% modifier contents typically show the best cracking resistance at intermediate temperature and they increased control mixture fracture energy by more than 18% and 22%, respectively. The mixture with 5% modifier and reduced asphalt content has the worst cracking resistance and reduced the control mixture fracture energy by 3% as measured by the SCB test. Based on Figure 6b, the FI results captured the drop in binder content between the mixture modified with 5% modifier and the mixture modified with 5% modifier and reduced binder. Comparing the FI results with Sapp values shows the DTCF test temperature might not be appropriate, and it needs adjustment for modified mixtures. According to Figure 6b, all mixtures failed to meet the FI value threshold. It should be noted that the threshold value was determined based on different loading and temperature conditions for various types of asphalt mixtures in Illinois, and there is a potential that the same threshold may not be appropriate for other types of asphalt mixtures at other locations.
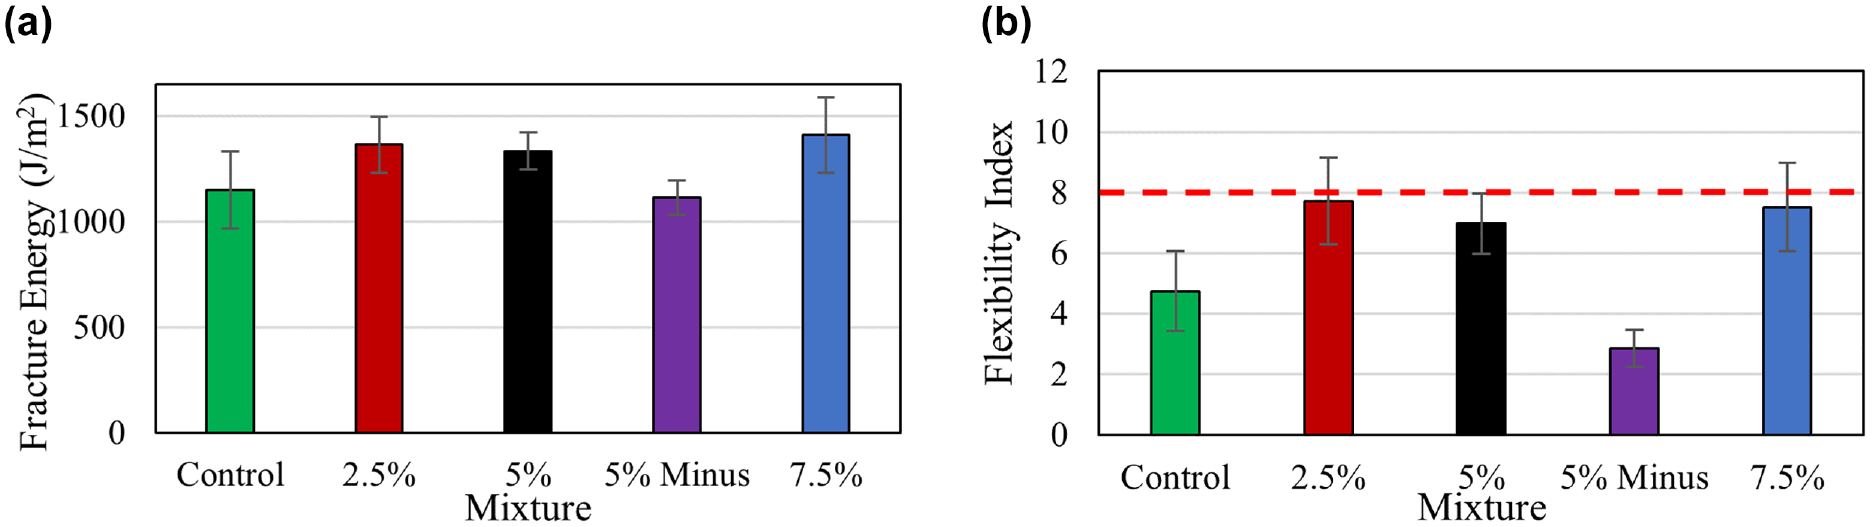
(a) Fracture energy for asphalt mixtures measured from semi-circular bend (SCB) test and (b) flexibility index (FI) measured from SCB test (dashed line represent the threshold value).
DCT Test
Figure 7, a and b, show the average Gf and average FST for the study mixtures. Error bars indicate the standard deviation of three replicates for each mixture. Based on the results, the asphalt mixture with 2.5% modifier has the greatest cracking resistance at low temperatures among all five mixtures as measured by the DCT test, which is also observed from the SCB test based on the FI results. Increasing the percentages of modifier to higher than 2.5% and reducing binder content do not show any substantial effect on asphalt mixture low-temperature cracking properties. All asphalt mixtures evaluated in this study exceed this threshold.
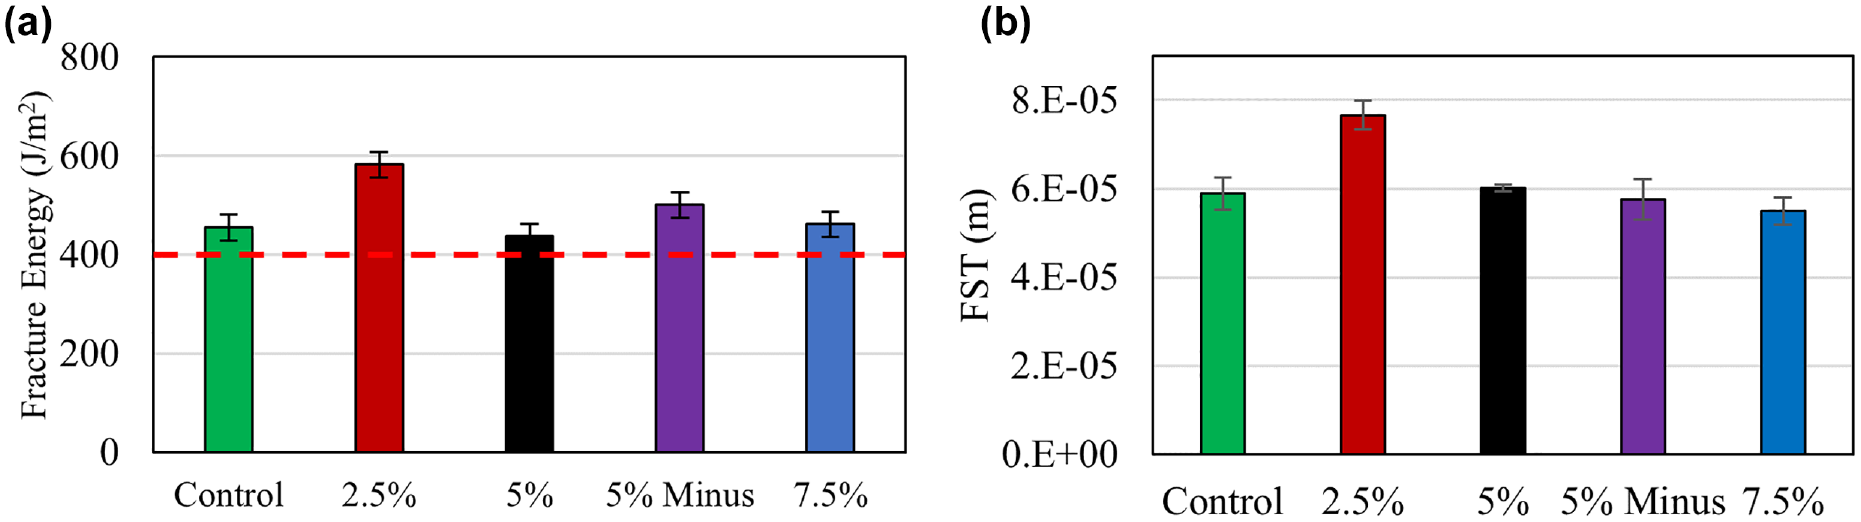
(a) Fracture energy and (b) fracture strain tolerance (FST) for asphalt mixtures measured from disk-shaped compact tension (DCT) test.
APA test
Figure 8 shows the average of rut depths up to 8,000 loading cycles for the study mixtures. Based on the results, solid polymer modification has a significant effect on the rutting properties of asphalt mixtures. Rut depth typically decreases as the amount of modifier increases up to 5%. The improvements are very pronounced for 2.5% and 5% modifier amounts, and the results are comparable for asphalt mixture modified with 5% modifier, mixture modified with 5% modifier and reduced binder content, and mixture modified with 7.5% modifier.

Average of rut depths up to 8,000 loading cycles.
Pavement Performance Prediction Results
Rutting and Fatigue Performance Simulation by MnPAVETM
Figure 9, a and b, show the simulation results from MnPAVETM in relation to fatigue cracking and rutting performance for a 20-year analysis period, respectively. Similar trends are observed for both fatigue cracking and rutting simulations. The mixture with 5% modifier and reduced binder has the best performance (both fatigue and rutting), while the control mixture consistently shows the worst performance followed by the mixture with 2.5% modifier. This is not unexpected, since MnPAVETM, like most flexible pavement M-E design approaches, utilizes layered elastic analysis to determine critical pavement responses. The mixture with 5% modifier and reduced binder has the highest stiffness and thus it is possible to predict lower critical responses (stresses and strains), which then translate to better pavement life through the use of fatigue and rutting transfer functions.
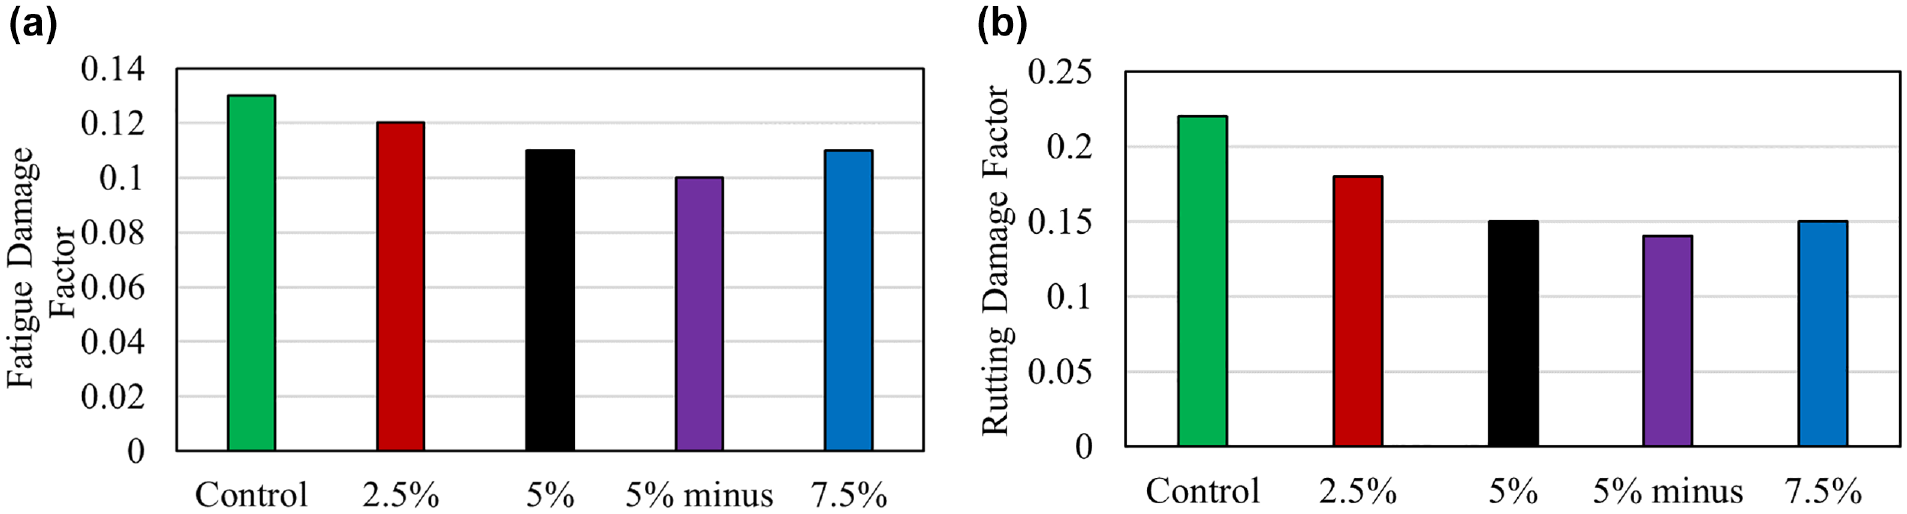
Induced damage for: (a) fatigue cracking and (b) rutting.
Fatigue Performance Simulation by FlexPAVETM
Figure 10, a–c , show the calculated percent damage (provided as percent of asphalt layer cross-section that has reached a damage level of 1.0 using DR parameter) for the different study mixtures at different traffic levels from FlexPAVETM simulations. The mixture with 5% modifier and reduced binder has lower percent damage as compared with other mixtures under all three traffic levels, which is consistent with the results from the fatigue performance analysis using MnPAVETM. The 5% modified mixture has the highest amount of predicted damage at low level of traffic, while the control mixture shows the highest percent damage values with increased traffic levels. Under high traffic, the higher percentages of modifier improve predicted performance.
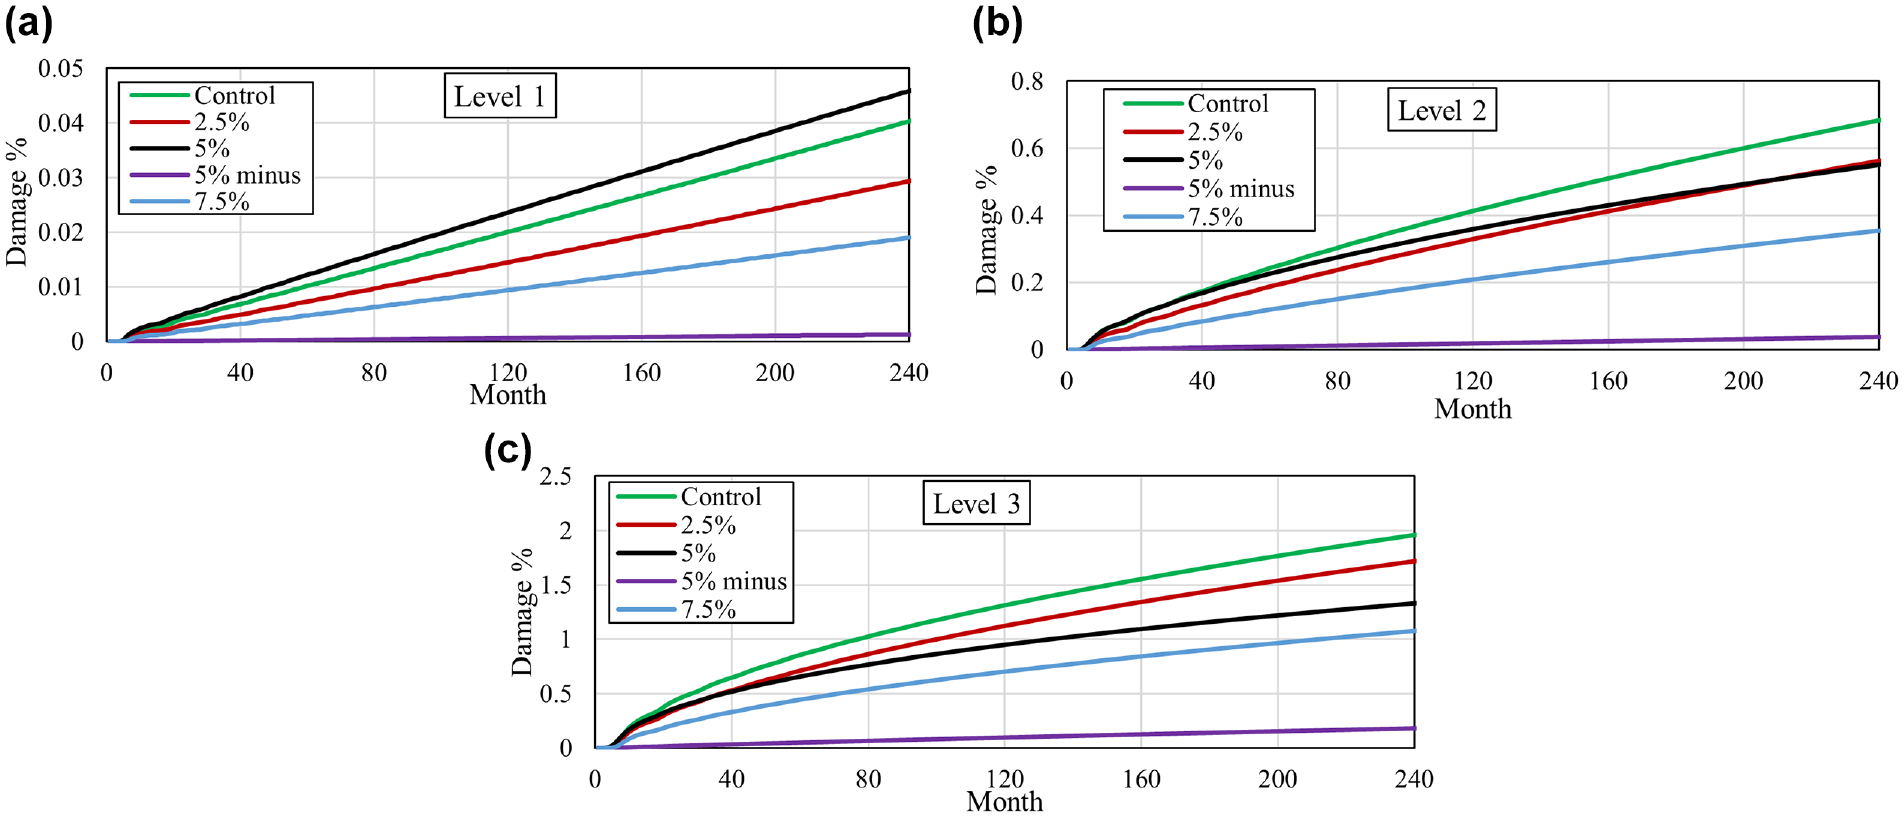
Damage percentage for: (a) level 1 traffic, (b) level 2 traffic, and (c) level 3 traffic.
The mixture with the highest stiffness (dynamic modulus) showed the lowest amount of damage with respect to cracking. The overall ranking of mixture fatigue performance from the simulations is different than that from the fatigue performance indices (GR, DR, Sapp, and CNfS). This indicates that using current fatigue indices determined only from laboratory fatigue testing may be insufficient to fully capture differences in mixture performance in the field. As a result, a combination of laboratory-measured properties with the field (service) conditions (e.g., pavement structure, and local and regional climatic and traffic conditions) is important for more reliable and appropriate evaluation of the expected fatigue performance of study mixtures.
Thermal Cracking Simulation and Prediction from IlliTC
Table 5 shows the simulation results based on IlliTC software for all study mixtures. Based on the simulation results, all sections underwent terminal cracking level (corresponding to 200 m of transverse cracking per 500 m length of each pavement lane) during the critical cracking event that was predicted to be during the second winter of the simulated period. While this is the case, the critical pavement surface temperatures at which sections experienced terminal cracking level did vary between different mixtures. Critical temperature represents the pavement surface temperature corresponding to a fully formed thermal crack in the finite element simulation. Generally, all mixtures have comparable critical temperatures except for the mixture with 5% modifier and reduced binder. This mixture has the highest (warmest) critical temperature value indicating the highest susceptibility for thermal cracking. In addition, this mixture was also found to show the highest number of critical cracking conditions detected over the analysis period (5 years). These can be attributed to the higher coefficient of thermal expansion and contraction value for the mixture arising from substantially different volumetric properties, and, more importantly, the lower binder content in this mixture likely contributes to its higher thermal cracking potential.
Results of Simulation for Mixture Thermal Cracking Performance After 5 Years

Field Testing Results
FWD Test
Figure 11 shows the corrected backcalculated moduli of the AC overlay for each test section at various times over 1.5 years of service. The backcalculated moduli were corrected to a reference temperature of 20°C to give a meaningful comparison of the change of stiffness over time amongst test sections. The figure showed that the climate season and the dosage of solid polymer affected the AC overlay stiffness over time, where the sections modified with pelletized polymer exhibited an increase in AC overlay stiffness compared to the control section. To elaborate more, the corrected backcalculated moduli of the AC overlay 2 months after construction (i.e., before one winter season) were on average 1.87 times higher in the section with 5% polymer and 1.23 times higher in the section with 2.5% polymer than in the control section. On the other hand, the section modified with 7.5% polymer exhibited similar stiffness to the control section. This suggests that the dosage of 2.5% polymer increased the asphalt overlay layer’s stiffness by 23%, and 86% for the 5% polymer dosage. It worth noting that the rest of the layers (old AC layer, base, and subgrade) revealed similar backcalculated moduli amongst test sections. Thus, this time measurement was considered a baseline for a reliable comparison of AC overlay stiffness amongst test sections as it excluded the impact of heavy loading and environmental conditions.
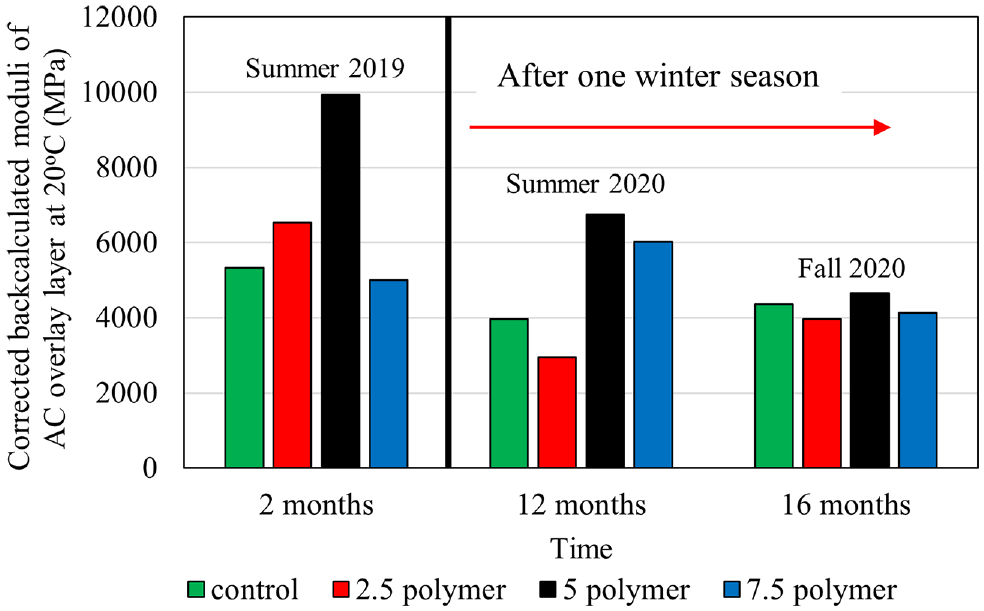
Corrected backcalculated moduli of AC overlay layer for the four test sections.
Looking at the AC overlay stiffness progression over time, the measurements taken after one winter season revealed slightly different findings to those taken right after construction. For instance, the 5% polymer-modified section still exhibited an increase in the AC overlay stiffness compared with the control section (70% increase in the AC overlay’s stiffness) for the measurement taken after spring thaw time. On the other hand, the 2.5% and 7.5% polymer sections showed an opposite trend to those before the winter. The observed trend was because of the underlying layers’ contribution, where depicted lower modulus than observed after construction as a result of higher moisture contents accumulated in the base layer after spring thaw time, which adversely influenced the stiffness of the upper layer. Similar AC overlay stiffness values were observed amongst test sections for the FWD measurements taken over 16 months of service. However, each test section’s underlying layers’ stiffness is slightly different when comparing them amongst test sections, making it a challenge to decide which section has a better performance.
In general, based on this preliminary evaluation, all test sections have shown some degree of degradation over 1.5 years, with the 2.5% and 5% polymer sections experiencing the most. One reason could be that the differences in the underlying layer stiffnesses adversely affected the upper layer stiffness. For that reason, the measurements taken 2 months after construction were considered for a preliminary conclusion on which AC overlay layer or polymer dosage has better performance, because of the similarities of the underlying layers’ stiffness amongst test sections. This primary evaluation of these sections revealed that the 5% solid polymer dosage gave the highest enhancement to the AC layer’s stiffness regardless of the time measurement. However, further field monitoring under different loading and environmental conditions is still needed for a definitive conclusion as to whether this type of polymer can enhance the short- and long-term performance of the asphalt layer. In addition, it is necessary to monitor the surface distresses among test sections for a significant period before adopting this type of polymer.
It is worth mentioning that test sections have been monitored periodically and no distress was observed to date.
Summary and Conclusion
Different laboratory-performance-based tests and performance prediction models were employed to assess the effect of solid pelletized polymer on asphalt mixtures’ properties and the corresponding performance with respect to different distresses. Five asphalt mixtures—a control mixture, mixtures with 2.5%, 5.0%, and 7.5% polymer content, and a mixture with 5% polymer but lower asphalt binder content—have been evaluated. Laboratory tests including complex modulus, DTCF, SCB, DCT, and APA tests were conducted to investigate mixture properties. MnPAVETM, FlexPAVETM, and IlliTC software were utilized to predict mixtures’ performance with respect to different distresses. Four field test sections were constructed and FWD testing was conducted on test sections. Based on the obtained results, the following observations can be made from laboratory testing, performance simulation and prediction, and in situ evaluations:
Laboratory Testing
The complex modulus testing indicated that the mixture with 5% modifier and reduced binder has higher stiffness and lower relaxation capability as compared with the other mixtures.
Based on the results of the DTCF test, the fatigue properties parameters produce slightly different mixture rankings. However, the results do indicate that the study modifier improves the fatigue properties of mixtures.
Results of the SCB test showed that solid polymer modification slightly improved the fracture properties. However, none of the study mixtures met the recommended threshold for the FI value.
According to the DCT test results, 2.5% of the study modifier improves the fracture properties of asphalt mixtures at low temperature, while increasing the modifier dosage does not have any significant effect on fracture properties.
The APA rutting test indicated significant improvement to rutting properties with increase of modifier content.
Pavement Performance Simulation and Prediction
According to the results of MnPAVETM simulations, the study modifier (especially associated with the reduced binder content) can improve asphalt mixture performance with respect to both fatigue and rutting.
According to the fatigue performance simulations from FlexPAVETM, the rankings of mixtures slightly change with different applied traffic levels. Overall, the 5% modified mixture with reduced binder shows the best performance, while the 5% modified mixture and the control mixture typically have the worse fatigue performance. This observation indicates that the reduced binder content plays a more important role in improving the fatigue performance of the study mixtures as compared with the modifier dosages.
Based on the results of the IlliTC software, the 5% modified mixture with reduced binder has a much higher potential for thermal cracking than other mixtures, likely because of the lower binder content. The 2.5% modified mixture showed the lowest susceptibility to thermal cracking, which is consistent with the results of fracture energy measured from the DCT test.
Field Section Results
The results of the back-calculation analysis indicated that both climate season and dosage of solid polymer have an impact on the AC overlay stiffness over time. According to the results, solid polymer can improve asphalt mixture stiffness and 5% was found to have the highest impact on mixture stiffness among the dosages evaluated.
Overall, based on the laboratory testing, performance simulations, and field observation to date it can be concluded that the study modifier can significantly improve the rutting performance of asphalt mixtures, especially when associated with the reduced designed binder content. It can also slightly modify the mixture fatigue performance; however, the reduced binder content seems to produce more improvement to fatigue characteristics (crack initiation). However it causes lowering of fracture resistance (crack propagation) as compared with the modifier dosage. In relation to thermal cracking, the study modifier did not have a considerable positive or negative effect, while reduced binder content results in deterioration of low temperature cracking properties.
Future Work
It should be noted that the test section will continue to be monitored and field distress data will be compared with laboratory test and performance prediction results in future work. Moreover, future work will focus on investigating asphalt mixtures’ performance with respect to different distresses at several aging levels. Performance-based laboratory tests, along with advance performance simulation programs such as FlexPAVETM, will be utilized to predict mixture performance with consideration of aging. In addition, several laboratory tests such as temperature and frequency sweep test, linear amplitude sweep (LAS) test, and multiple stress creep recovery (MSCR) test will be conducted on modified asphalt binder to investigate the effect of study modifier on binder properties, as well as to compare the properties of modified binder and modified asphalt mixtures.
Footnotes
Acknowledgements
The tests described and the resulting data presented here, unless otherwise noted, are based on work supported by the U.S. Army ERDC under PE 0603119a, Project T26 “Military Engineering Applied Research”, Task “Innovative Construction Materials for the Arctic.” Permission was granted by the Director, Cold Regions Research and Engineering Laboratory, to publish this information.
Author Contributions
The authors confirm contribution to the paper as follows: study conception and design: C. DeCarlo, M. Elshaer, E. Dave, J. Sias; data collection: D. Mirzaiyanrajeh, M. Elshaer, R. Zhang; analysis and interpretation of results: D. Mirzaiyanrajeh, C. DeCarlo, M. Elshaer, E. Dave, J. Sias, R. Zhang; draft manuscript preparation: D. Mirzaiyanrajeh, C. DeCarlo, M. Elshaer. All authors reviewed the results and approved the final version of the manuscript.
Declaration of Conflicting Interests
The author(s) declared no potential conflicts of interest with respect to the research, authorship, and/or publication of this article.
Funding
The author(s) disclosed receipt of the following financial support for the research, authorship, and/or publication of this article: The experiments described and the resulting data presented in the article, unless otherwise noted, were funded under PE 0603119a, Project T26 “Military Engineering Applied Research,” Task “Innovative Construction Materials for the Arctic” under Contract W913E519P0023, managed by the U.S. Army Engineer Research and Development Center (ERDC).

Data Accessibility Statement
The data used in this study may be made available on reasonable request to the corresponding author.
The use of trade, product, or firm names in this document is for descriptive purposes only and does not imply endorsement by the U.S. Government. The findings of this paper are not to be construed as an official Department of the Army position unless so designated by other authorized documents.