



Abstract
In this study, new performance measures are proposed for hotspot identification in urban intersections. These measures reflect severity factor weights, which are determined based on data mining. To estimate the severity factor weights of crashes at urban intersections, the study utilizes tree-based random forest (RF) and extreme gradient boosting (XGB) methods. The importance of variables in the severity classification model is standardized and utilized for calculating the score of each crash, which is aggregated into intersections. The aggregated score is used as a dependent variable for the safety performance functions (SPFs) in the network screening process. To illustrate the under-dispersed severity score aggregation data, SPFs that follow the COM-Poisson distribution as well as the negative binomial (NB) are developed. Independent variables in SPFs set up intersection geometry elements that can be collected from online GIS services. Four additional performance measures are proposed, each reflecting a severity weight. Data about a total of 42,513 intersection crashes from 2017 to 2018 in South Korea were collected for crash injury severity analysis. Hotspot identification was performed on 81 intersections, and three consistency tests were conducted to validate the four measures. Tests show that the RF-based weighted
The Highway Safety Manual (HSM) presents the network screening process used to identify sites that are expected to benefit most from implementing road safety improvement projects ( 1 ). Identified sites are commonly referred to as “hotspots” (or “black spots” or “high crash locations”). First, populations and sample groups for statistical analysis must be established to identify hotspots. Subsequently, collectable data are reviewed. Based on this review, analytical performance measures can be selected. Typical performance measures include average crash frequency and crash rate. In the HSM, measures using the empirical Bayes (EB) method, which is widely used for safety evaluations, are also detailed in the calculation procedure ( 1 ). The equivalent property damage only (EPDO) average crash frequency also reflects injury severity with weights based on crash cost. The EPDO measure can identify sites where there are a relatively large number of serious crashes.
According to the hotspot identification procedure, sites that are counted as having frequent crashes can be identified. However, human factors, environmental factors, and vehicle factors that might be fundamental to the occurrence of crashes are not considered in the hotspot identification process. Thus, in this study, various existing studies were considered to compensate for these shortcomings. First, studies using performance measures presented by the HSM and related to hotspot identification were reviewed. In addition, studies considering both crash severity factors and crash frequency for hotspot identification were reviewed. The latest research trends in traffic safety related to hotspot identification were analzyed considering predictive models and safety analysis studies using safety performance functions (SPFs). Finally, research related to validation of performance measures used for hotspot identification has been compiled.
First, studies related to hotspot identification were considered. Relevant studies on a variety of topics have been conducted in the past, and some studies have established performance measures that consider severity (2–15). Wang et al. used and compared the crash frequency, EPDO, relative severity index, and excess predicted average crash frequency using the method of moments, a cross-sectional analysis, considering the situation in which traffic data were not collected ( 6 ). Gross et al. performed hotspot identification using four performance measures: crash frequency, network screening, expected crash frequency with EB, and excess expected crash frequency with EB ( 16 ). The performance measures of most hotspot identification studies, including the previous two, are based on the content of the HSM, and this study also considered the development of new measures based on the HSM ( 1 ). Because hotspot identification studies use crash-frequency-based methods, there is a limit to reflecting the severity of the crash. Despite these shortcomings, however, there have been attempts to incorporate the severity of crashes into frequency. Afghari et al. proposed a crash count and crash severity joint model for hotspot identification ( 14 ). Unobserved heterogeneity in the crash severity data is not explained, so the authors wanted to improve these shortcomings using a joint model. In a similar approach, Yasmin and Eluru used a joint model that combines crash severity in the development of crash count prediction models ( 15 ). Their analysis demonstrates that a model reflecting the severity in relation to statistical suitability is superior to existing crash count prediction models. These two studies show that it is difficult to prove statistical significance because severity data have an uncertainty distribution. Thus, in most studies, step-by-step joint modeling was performed for accurate modeling and to capture the uncertainty distribution of severity data ( 17 ). These studies performed additional severity analysis separately from frequency-based hotspot identification. In other words, it is not intuitive as a study that performed additional severity analysis rather than identifying hotspot as a severity indicator. Therefore, in this study, new performance measures were developed to integrate severity analysis into the hotspot identification procedure. In addition, a modeling procedure for developing measures was established in consideration of the uncertainty of the severity data based on the considered content.
Finally, related studies were considered for validation of consistency for new performance measures proposed in this study. Cheng and Washington proposed consistency assessment criteria for hotspot identification methods ( 5 ). The authors presented five tests to validate performance measures in Site, method units. They determined that EB-based methods are the best. Guo et al. also proposed generalized criteria for evaluating hotspot identification methods ( 18 ). Their evaluation method was designed by generalizing the target, such as by increasing the duration compared with the evaluation method proposed by Cheng and Washington. This study was designed to reflect the test methods used in the previous study so that the test can be performed to analyze consistency.
The purpose of this study is to: (1) propose performance measures that reflect factors affecting crash severity as weights, (2) derive major factors of intersection crashes in South Korea and identify hotspots, and (3) conduct consistency tests to determine if they are suitable for hotspot identification. The research framework is presented in Figure 1 to help describe the composition of the study.
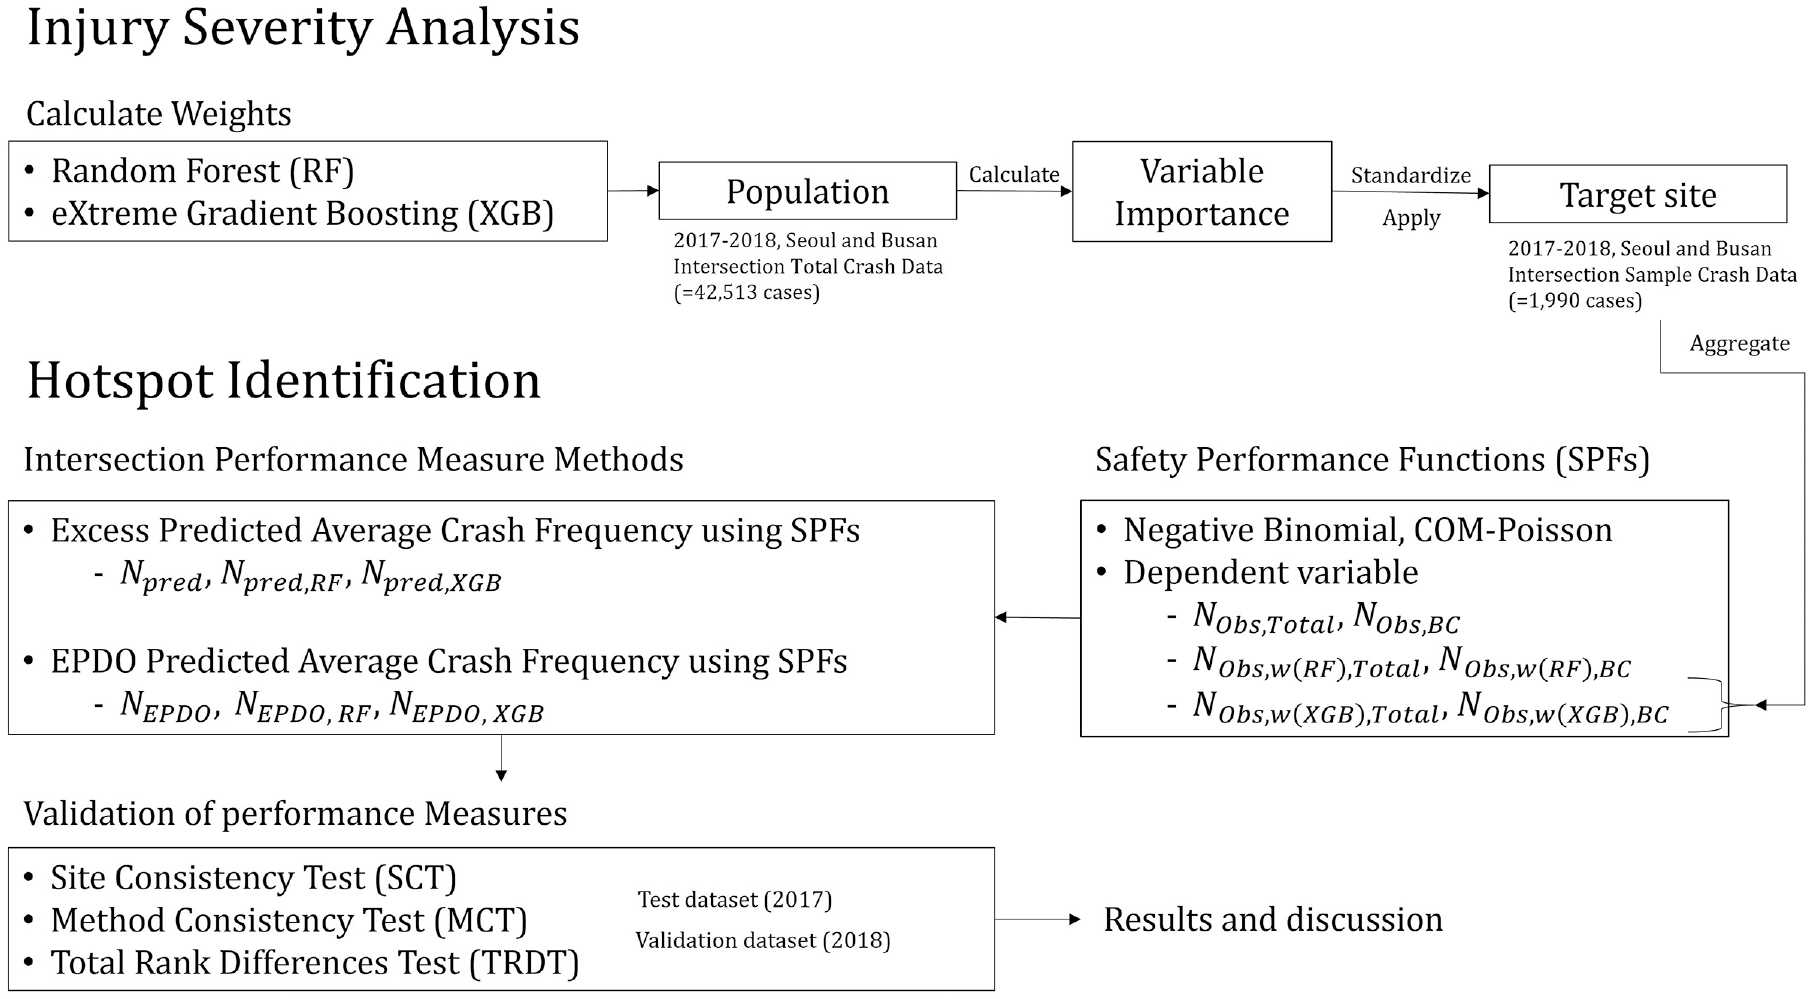
Research framework.
Methodology
Network Screening
Safety Performance Functions (SPFs)
SPFs can be used as a predictive model for estimating the number of crashes at a location. In the HSM, there are SPF-based performance measures that can be used for intersection network screening. In this study, an SPF-based performance measure suggested by the HSM was used to identify intersection hotspots.
Various studies have been conducted to develop SPFs at intersections (1, 19–23). Crash data have an over-dispersion problem where the variance is greater than the average. Therefore, in most studies, a negative binomial (NB) regression model that can solve the problem of over-dispersion is used ( 1 ). However, with some data, low sample means result in under-dispersion during the data collection and modeling process. The NB model has limitations in modeling these under-dispersed data ( 24 ). The analysis area in this study consists of 81 intersections in South Korea, with relatively small samples. Additionally, over-dispersion parameters cannot be produced in the model because they are under-dispersed because of the application of severity weights. Therefore, SPFs that follow a Conway-Maxwell-Poisson (CMP or COM-Poisson) distribution that can account for under-dispersion were developed. The COM-Poisson distribution is a discrete probability distribution that can capture several variance types (21, 25–27). Therefore, it can be used as an alternative in situations where the NB model cannot be applied because of under-dispersion ( 24 ). The probability density function of COM-Poisson can be defined as follows (Equations 1 and 2):


where
The centering parameter
Guikema and Goffelt proposed a COM-Poisson distribution to replace


The COM-Poisson model can model both over-dispersed and under-dispersed datasets ( 26 ). The link functions are as follows (Equations 5 and 6):


where
It is assumed that there are p covariates used in the centering link function and q covariates used in the shape link function. This is similar to the varying dispersion parameters of the Poisson-gamma (NB) model (28, 29). Lord et al. modified the existing formula by removing Equation 6 and estimating a single shape parameter
EPDO Weights by Crash Cost in South Korea
The EPDO method of calculating EPDO scores on a per-intersection basis is utilized. In this study, EPDO scores as a performance measure suggested in HSM’s network screening procedure is used (Equivalent Property Damage Only [EPDO] Average Crash Frequency using SPFs) ( 1 ). The weighting factors are calculated relative to property damage only (PDO) crashes. Additionally, the proportions of crashes are calculated from the reference population to calculate the EPDO measure. Weights corresponding to severity KA and BC (KABCO injury scale) can be obtained by multiplying the calculated proposition by the EPDO weighting factors. These equations are as follows (Equations 7 and 9):



where
In this study,
Equivalent Property Damage Only (EPDO) Weights by Crash Cost Standards of South Korea

In this study, the following six performance measures were proposed, including measures reflecting the importance of severity factors based on RF and XGB: excess predicted average crash frequency using SPFs:
Injury Severity Analysis Based on Data Mining Techniques
Previous research tried to reflect severity indicators in the hotspot identification process in various ways (14, 15, 17, 32). In this study, severity classification models based on the data mining method were developed. The importance of variables derived from the model were translated into weights through standardization and defined as new performance measures. The tree-based model, random forest (RF), and extreme gradient boosting (XGB) methods were used to derive severity factor weights (33–35). The models perform well by efficiently constructing trees to operate in parallel and can be used to solve classification and regression problems (36, 37).
Random Forest (RF)
The RF method proposed by Breiman is one of the high-performance machine learning methods ( 33 ). Each tree that makes up an RF is created based on randomly selected samples and tree characteristics. Finally, the optimal model is determined by the voting method in the tree. It is known to effectively overcome local optimization and overfitting problems of single classifier decision trees. The RF method extends the tree classifier collection using bootstrap sampling. The results of the tree can then be used to evaluate the importance of the variables used in tree modeling. With bootstrap sampling, RFs are also measured to have fewer Gini impurities in their child nodes than in their parent nodes by applying the Gini impurity criterion. The Gini reduction for each individual variable is aggregated for all trees in the forest and used to produce variable importance measurements. Indicators of the importance of variables in RF’s classification model, derived through these procedures, are mean decrease accuracy (MDA) and mean decrease Gini (MDG). According to existing research, RF is widely used in traffic safety, especially in the classification of accident severity and in solving prediction problems (37–41). In this study, the values were standardized and weighted to use the importance of the variables. Subsequently, the intersection SPFs were developed by aggregating weighted reflection scores.
Extreme Gradient Boosting (XGB)
XGB is an improved algorithm based on gradient boosting (34, 35). It performs well by efficiently constructing trees to operate in parallel, and is used to solve classification and regression problems (36, 37). In XGB, there are three variable importance indicators: gain, cover, and frequency. First, gain is an indicator that defines the relative contribution of the model, which is calculated by considering the extent to which each variable contributes to the random tree. The higher the value, the more important it can be compared with the values of other variables. Cover is the number of observations in the tree and node where the variable is associated with the model construction. Because all variables are calculated, they are expressed as percentages and presented as relative values. Finally, frequency is the ratio that a particular variable represents by weighting the relative time of the segmentation induced in the tree. This value is also translated as a percentage of weights for all weights, so the sum of the frequency values for all variables is one. While all three variables have a significant effect on the determination of importance, gain is known as the most important indicator of interpretation of relative importance. Therefore, in this study, only gain was used to determine the intersection characteristic analysis indicators in the XGB model.
Calculation of Crash Severity Weights for Each Crash Score
Standardization procedures are designed for giving weights of variable importance, as derived from the injury severity model. Gain, which represents the relative importance in XGB, does not require a separate standardization procedure because the sum of the total variable values is 1. However, the gain of RF is calculated because the sum of the total values exceeds 1. The standardized variable importance values are weighted and applied to individual crashes. The applied values are defined as


where
Data Collection and Preparation
In this study, the analysis was conducted with crash data from 2017 to 2018 at urban intersections in Seoul and Busan in South Korea. Injury severity analysis was performed for a total of 42,513 crashes, of which hotspot identification was performed using 1,990 crashes at 81 signal intersections.
The crash data were collected from KoROAD, which is the traffic crash analysis system in South Korea. The data include crash characteristics such as human factors, environmental factors, and vehicle factors, as well as variable definitions and detailed descriptions for injury severity analysis, as given in Table 2. The injury severity group, which is set as the dependent variable, is defined as K, A, B, or C, except for PDO crashes. In South Korea, crashes that are not reported to the police are not counted because the police aggregate crash data. Because of the characteristics of the insurance system in South Korea, even small crashes, such as PDO crashes, are accompanied by simple hospital care to claim insurance money. As a result, most crashes are recorded as at least a possible injury crash. Thus, fewer than 10 PDO crashes identified in this study were considered outliers and excluded. Finally, injury severity is classified into four categories: possible injury (severity C class), non-incapacitating injury (severity B class), incapacitating injury (severity A class), and fatal injury (severity K class).
Variable Definitions and Descriptions for Crash Injury Severity Analysis

Results of Injury Severity Analysis
In this study, injury severity analyses based on RF and XGB models were performed. The importance of the variables was converted into weights and applied to individual crashes, and the calculated individual crash severity scores are reflected in the performance measurement (
Statistics Summaries of Injury Severity Analysis Results
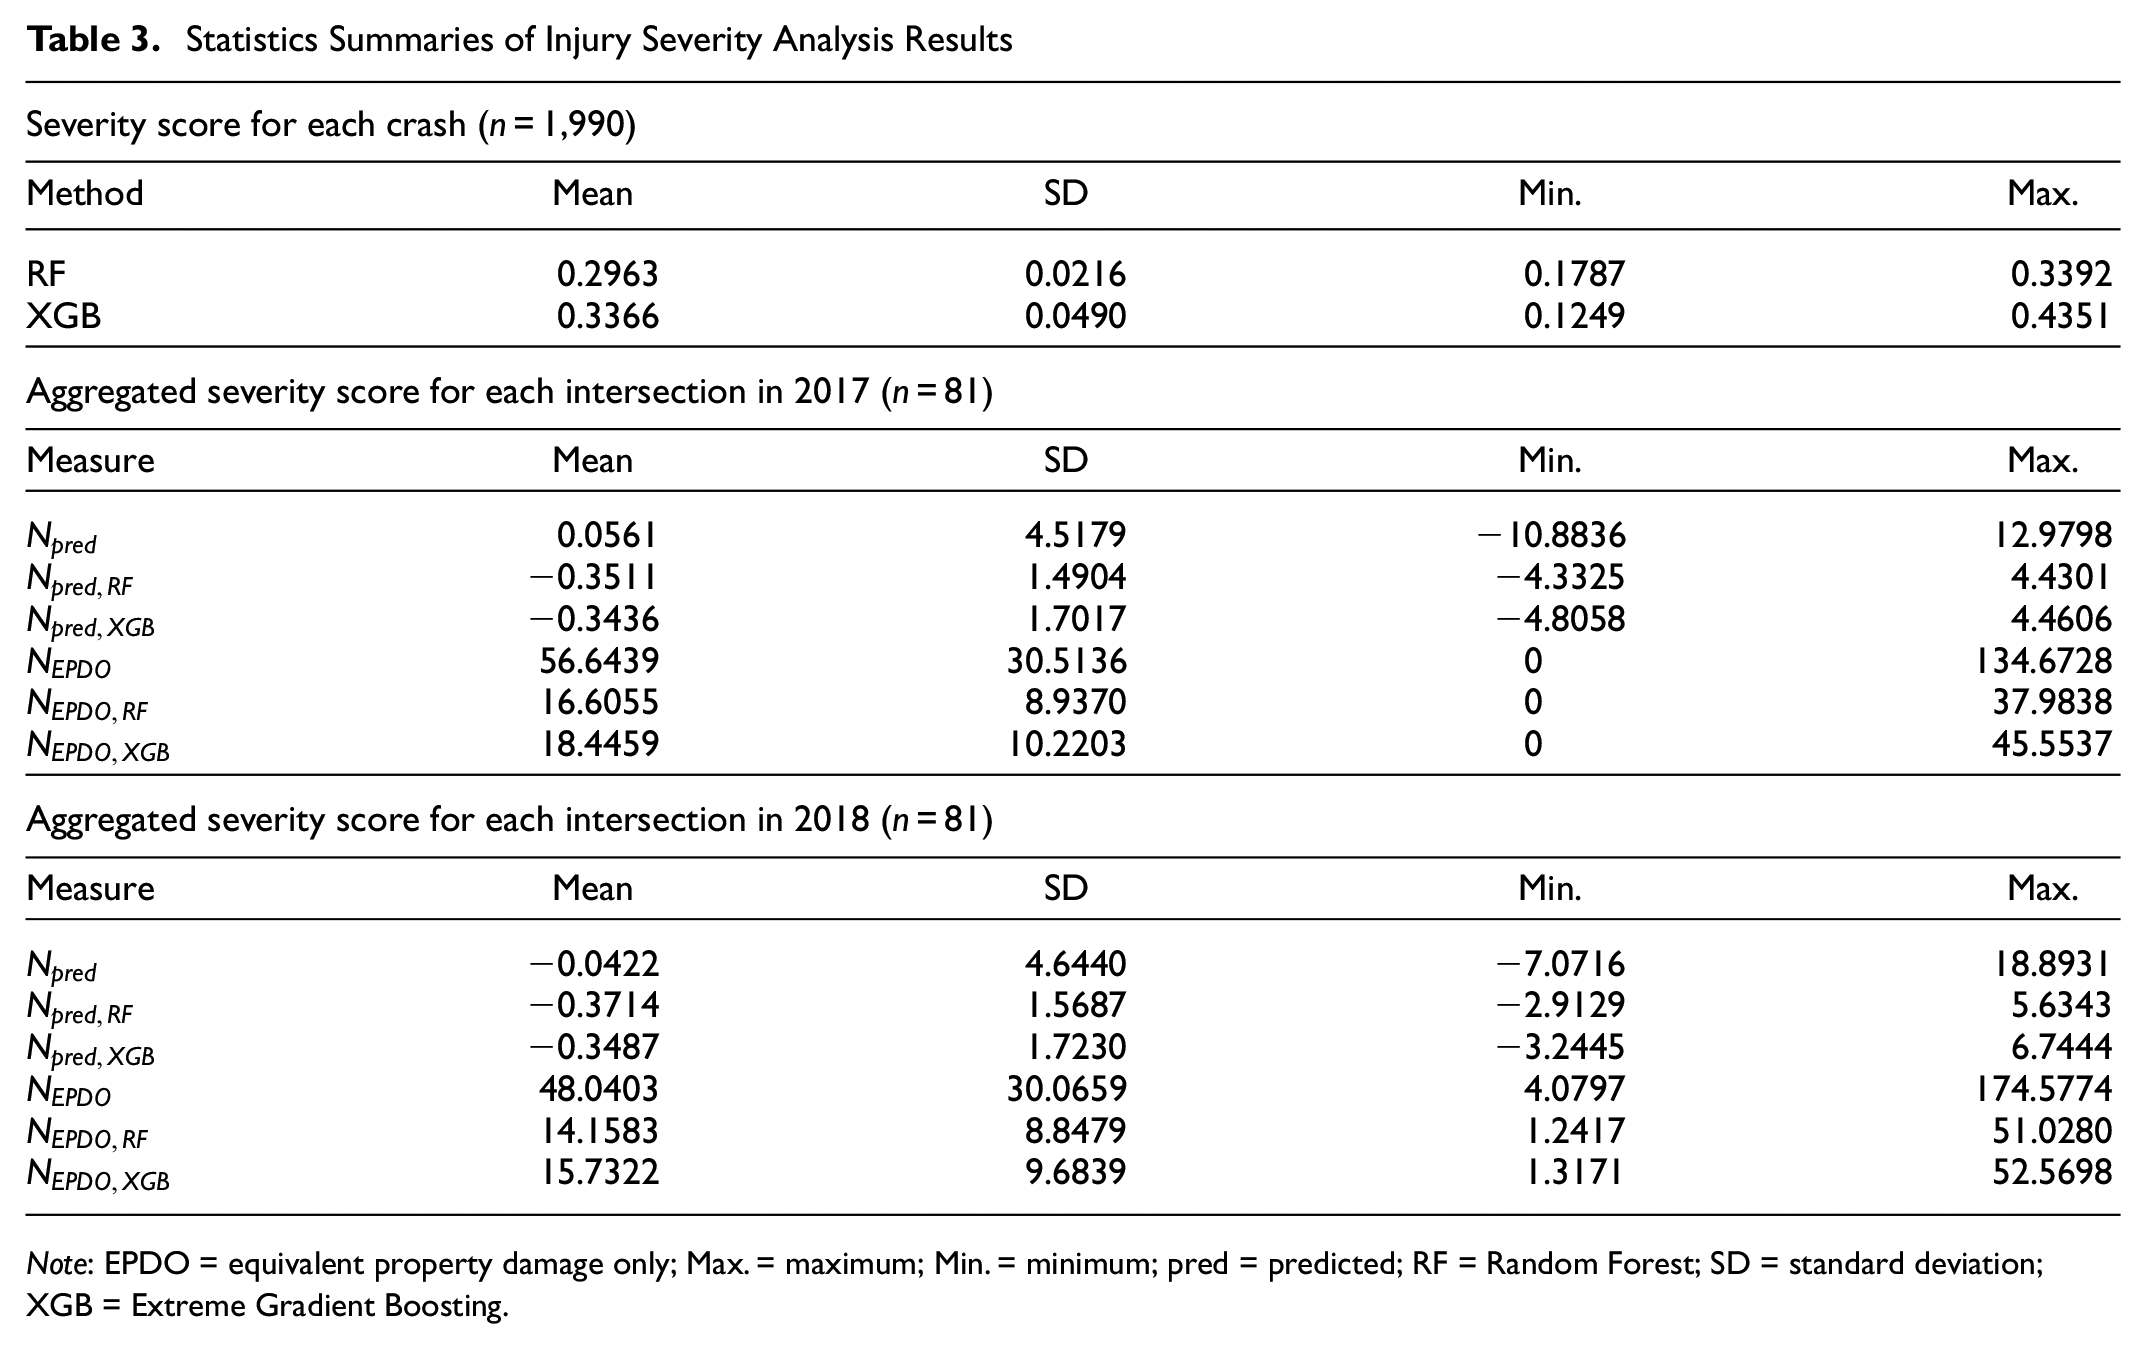
Note: EPDO = equivalent property damage only; Max. = maximum; Min. = minimum; pred = predicted; RF = Random Forest; SD = standard deviation; XGB = Extreme Gradient Boosting.
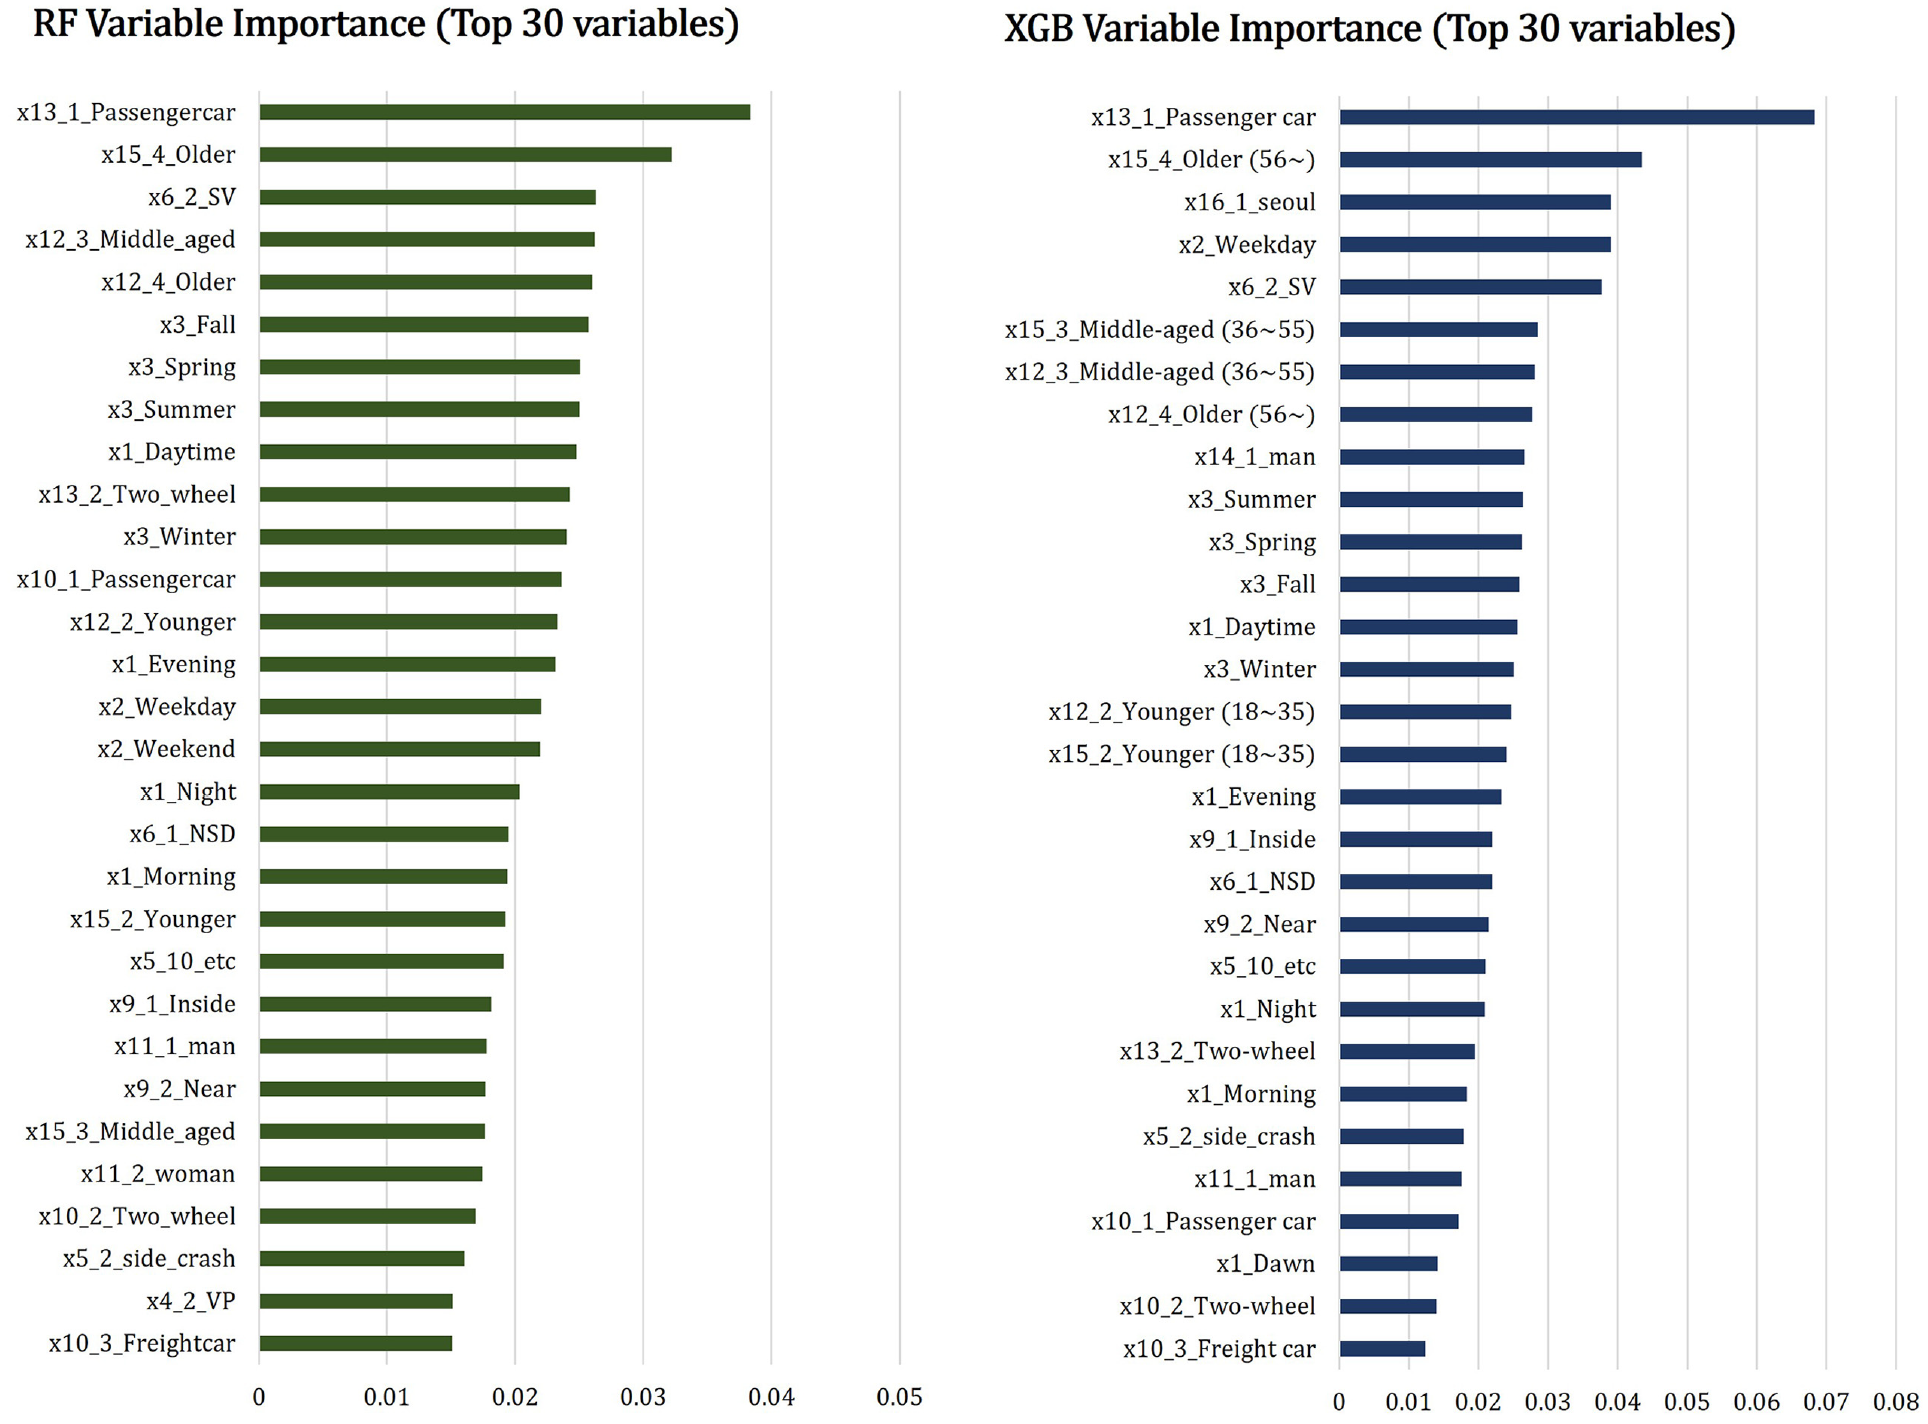
Results of variable importance by random forest (RF) and extreme gradient boosting (XGB) (top 30 of 82 variables).
SPFs for Urban Intersections by Crash Severity Level
In this study, SPFs are developed to yield the predicted crash frequency of the performance measure presented by the HSM. With RF- and XGB-based severity-weighted applications, datasets representing under-dispersion are developed as COM-Poisson models. Basic datasets without severity weights are developed as models that follow an NB distribution. The development of SPFs used the COUNTREG (COM-Poisson) and GENMOD (NB) procedures in SAS 9.4. SPFs were developed only for urban signal intersections. Annual average daily traffic (AADT) in major roads and minor roads was collected from ViewT 3.0 (provided by the Korea Transportation Institute), and intersection geometric and operational data were collected from online GIS services, Kakao map, and Google maps. The collected geometric and operational data were used to develop the model by selecting variables that appeared to be significant in the analysis process. A total of 12 continuous variables was considered as inputs: AADT (major road), AADT (minor road), number of lanes (major road), number of lanes (minor road), number of left turn lanes (major road), number of right turn lanes (major road), number of channelization right turns (major road), number of medians (major road), number of left turn lanes (minor road), number of right turn lanes (minor road), number of channelization right turns (minor road), and number of medians (minor road). A total of 11 categorical variables was considered: presence of turn lane (major road), type of median in major road (island, closed, open), presence of parking (major road), speed limit (major road), presence of turn lane (minor road), type of median in minor road (island, closed, open), presence of parking (minor road), speed limit (minor road), skewed intersection, size of intersection, and region (Seoul or Busan).
Values of
Safety Performance Functions (SPFs) for Identifying Intersection Hotspots
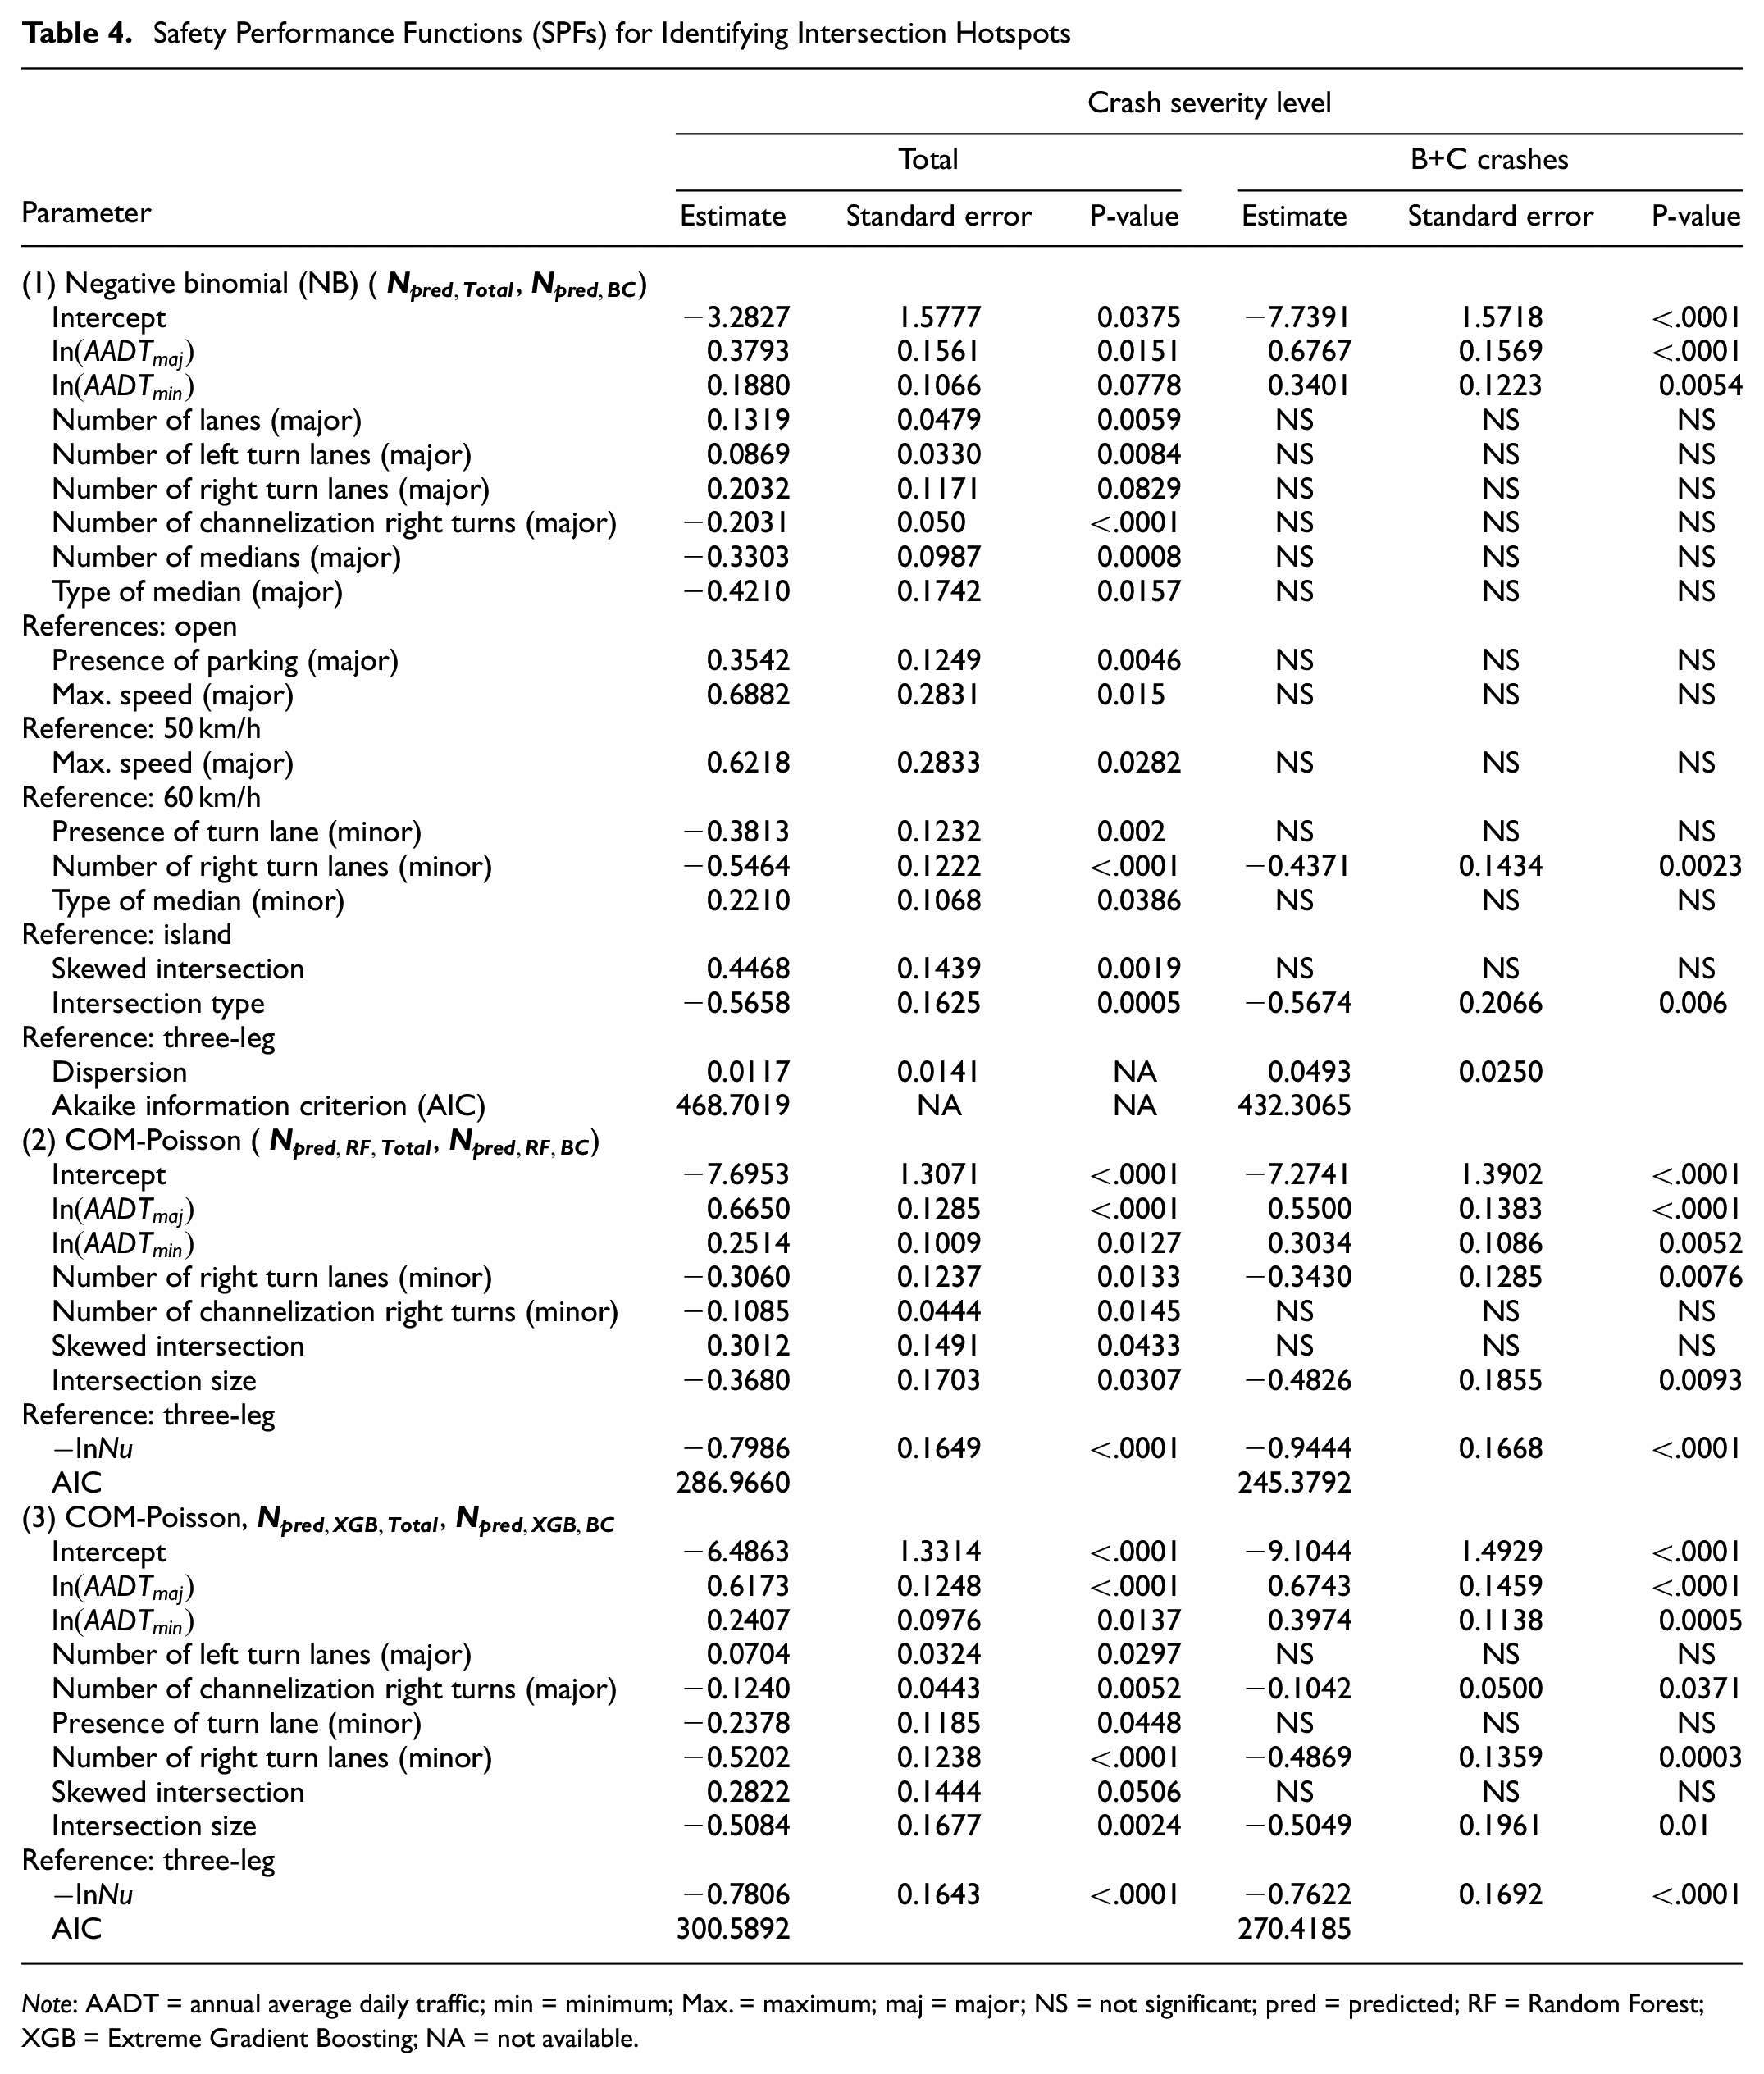
Note: AADT = annual average daily traffic; min = minimum; Max. = maximum; maj = major; NS = not significant; pred = predicted; RF = Random Forest; XGB = Extreme Gradient Boosting; NA = not available.
Results and Discussion
Results of Hotspot Identification
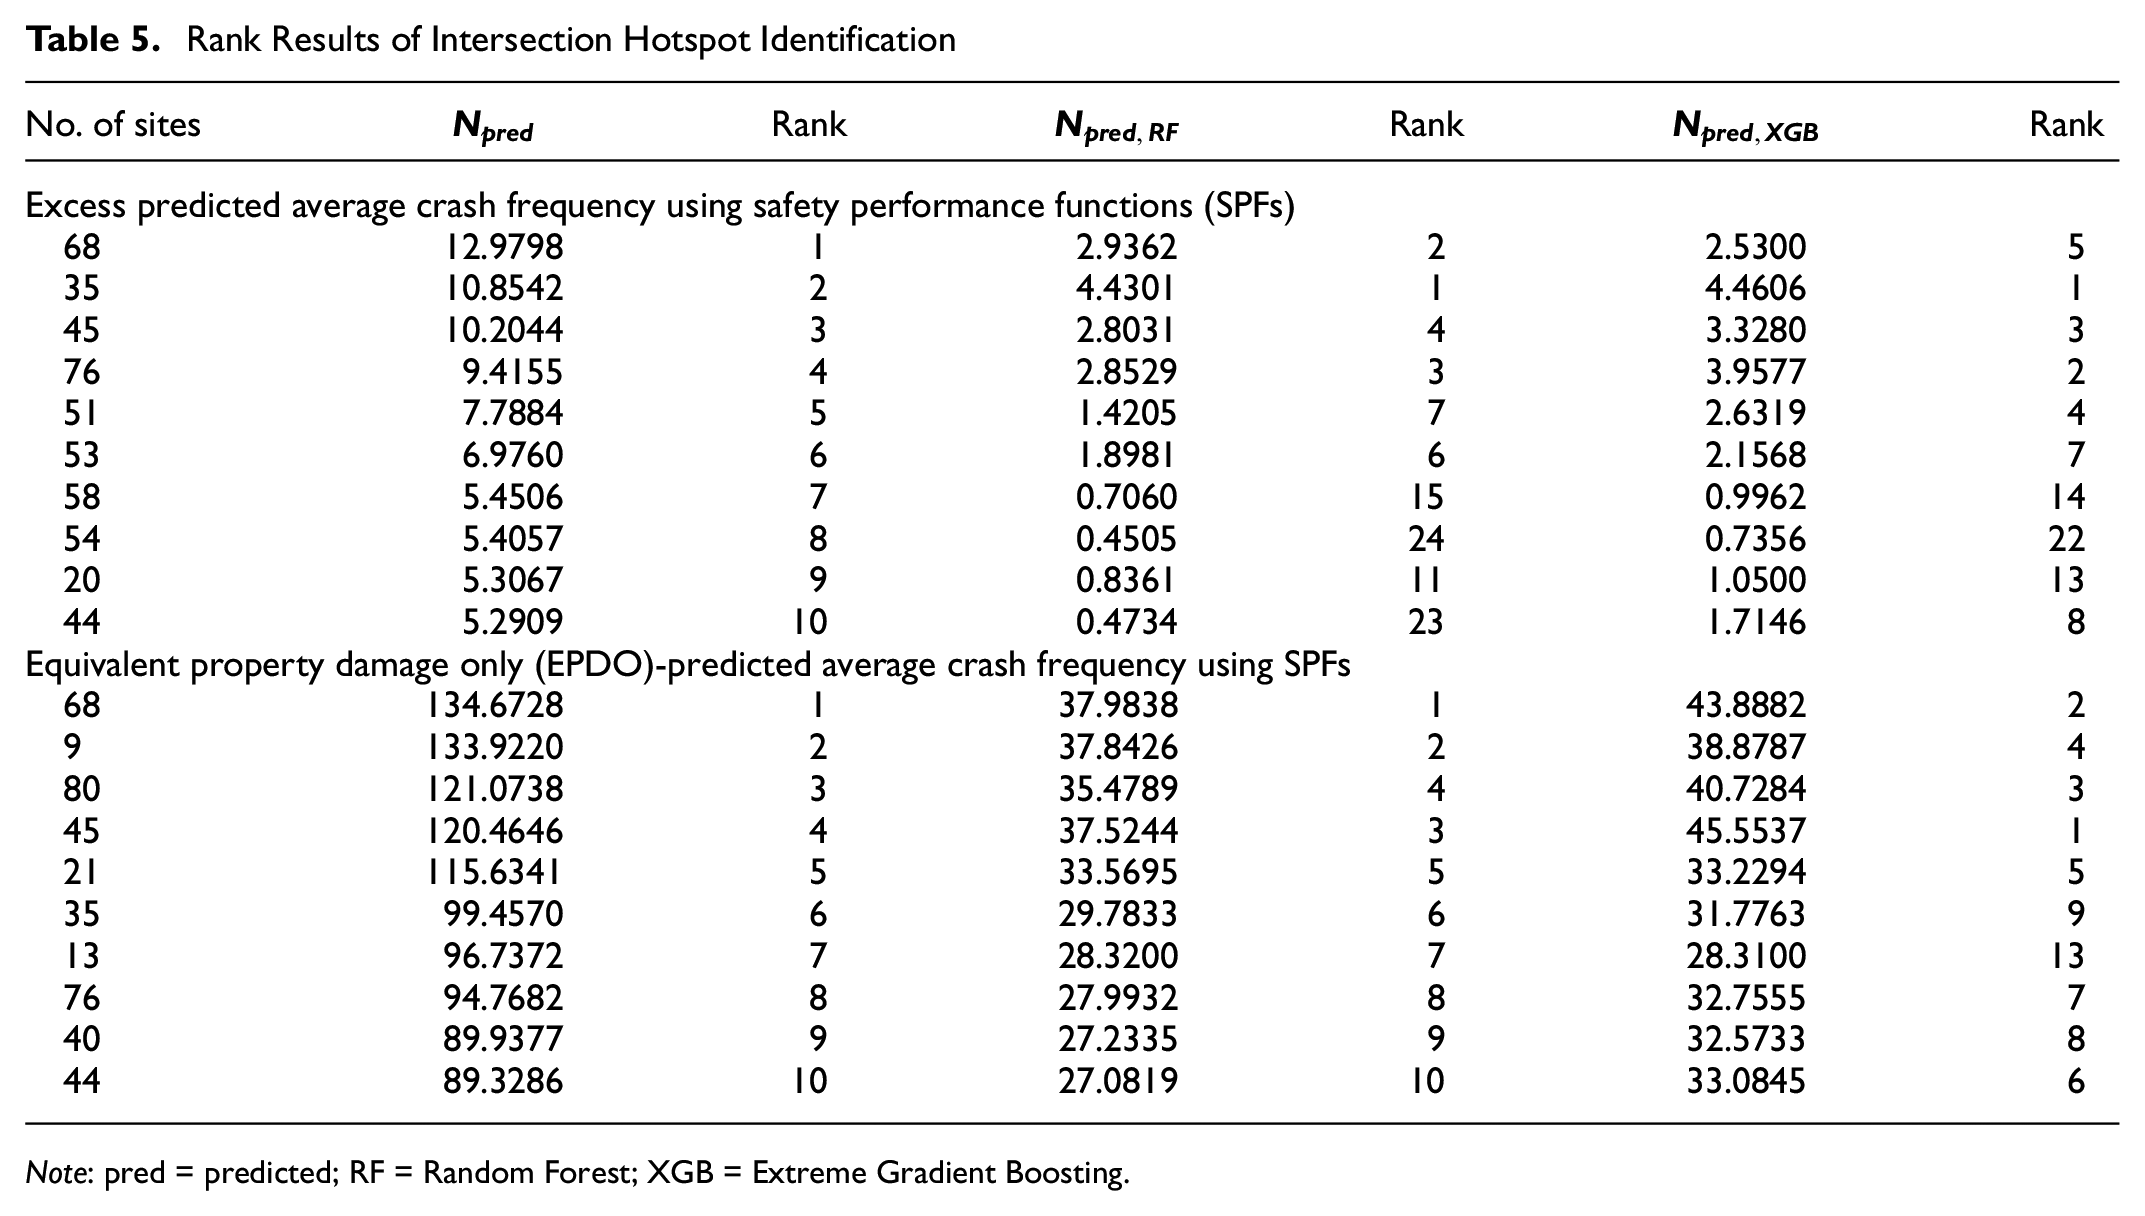
A total of six indicators, including the four previously proposed indicators, was used to identify intersection hotspots. The rank results were largely divided according to “excess predicted average crash frequency using SPFs” and “EPDO-predicted average crash frequency using SPFs.” The results are presented in Table 5.
Rank Results of Intersection Hotspot Identification
Note: pred = predicted; RF = Random Forest; XGB = Extreme Gradient Boosting.
According to the results, hotspots not identified in the results of the base indicator (
Validation of Consistency for New Performance Measures
Consistency tests were performed to verify that the proposed performance measures can play a significant role as hotspot identification measures by conducting similar evaluations “before” and “after.” Three consistency tests were constructed to validate the six performance measures: the site consistency test (SCT), the method consistency test (MCT), and the total rank difference test (TRDT) ( 5 ). The hotspot rank was derived according to measure. For the consistency test, the data were divided into a test set (before period, 2017) and a validation set (after period, 2018).
Site Consistency Test (SCT)
SCT is a test that compares the sum of the observed crash frequency during the after period of the hotspot intersection identified in the test set (before period). Comparisons are made between performance measures for the top 10% (

where
m(3) = XGB measure).
Method Consistency Test (MCT)
As with SCT, the number of hotspots corresponding to the top 10% and 5% are compared between “before” and “after” according to the performance measure. The results are presented as proportions, and the formula for this test is as follows (Equation 13):

Total Rank Difference Test (TRDT)
The previously described MCT can verify consistency between “before” and “after” by identifying the top hotspots according to the top percentage. TRDT compares the sum of errors for hotspots in the top percentage group using the same concept as for MCT, comparing “before” and “after.” The formula for this test is as follows (Equation 14):

where
Validation Results
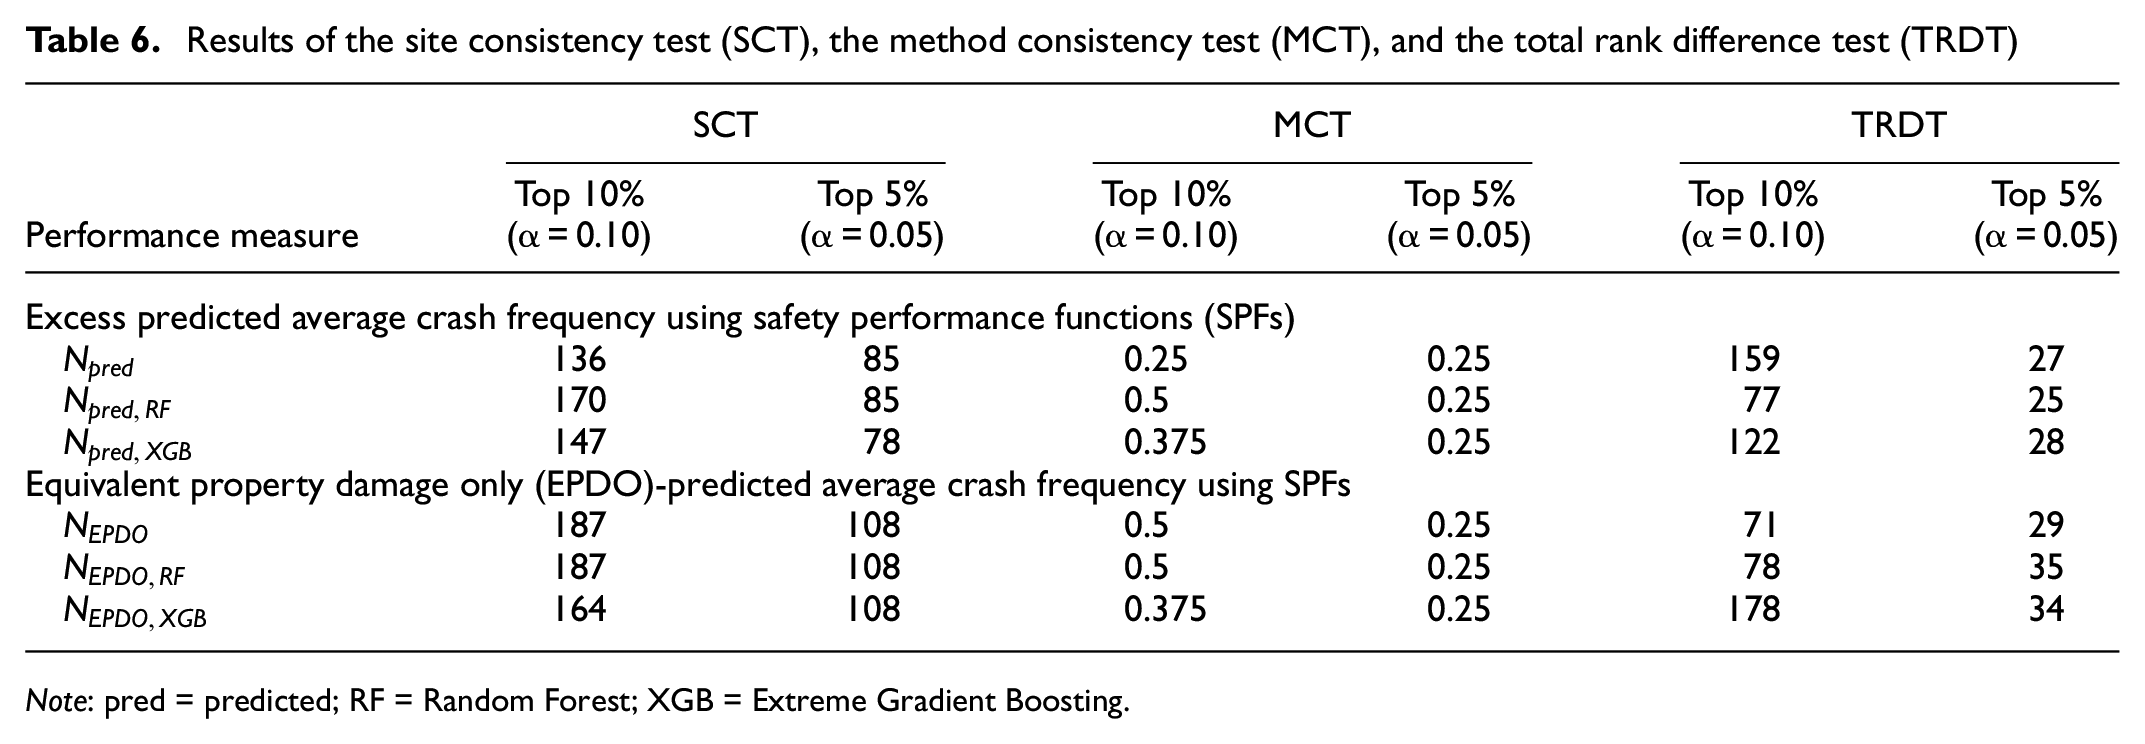
SCT, MCT, and TRDT were performed to validate the performance measure. The rank was derived according to the performance measurement for 81 intersections in Seoul and Busan, South Korea, and the verification was based on the rank results and values. Validation results are presented in Table 6.
Results of the site consistency test (SCT), the method consistency test (MCT), and the total rank difference test (TRDT)
Note: pred = predicted; RF = Random Forest; XGB = Extreme Gradient Boosting.
From the SCT results, in the top 10% (
From the MCT results, in the top 10% (
From the TRDT results, in groups identified as hotspots in the top 10% (
In this study, the performance of six measures, including four based on proposed severity weights, was validated. Three hotspot identification validation methods were used for verification: SCT, MCT, and TRDT. The results of the validation method showed that EPDO measures were superior to excess predicted measures and EPDO measures. Comparing the six measures,
Conclusions and Recommendations
In the past, various hotspot identification methods and performance measures have been used in network screening to identify vulnerable intersections. A representative method used in intersection hotspot identification is the EB method, and commonly used performance measures include the crash frequency, crash rate, and so forth. (1, 5, 28). However, research using both crash frequency and severity factors of each crash in hotspot identification is lacking. Therefore, this study proposes new performance measures that reflect individual crash severity factor weights for more detailed hotspot identification. The excess predicted average crash frequency using SPFs and EPDO average crash frequency using SPFs, presented by the HSM, were set as default performance measures, and four new measures (
As a result of identifying hotspots using the four proposed measures and two base measures, hotspots not identified with the basic indicators were partially identified in ranks reflecting severity weights. This means that the new hotspots were identified as a result of the severity weights, and these hotspots can be interpreted from a different perspective.
In addition, consistency testing (SCT, MCT, and TRDT) was performed to verify that the proposed measures could play a significant role as hotspot identification measures. According to the test results, compared with the base measures, none of the four proposed measures showed consistency problems when identifying hotspots. This means that not only can the proposed method provide performance measures based on the crash frequency, but it also applies a detailed analysis that reflects the characteristics of each crash occurring at intersections.
Research cases of other countries were reviewed for methodological verification of measure proposed in this study (6, 42, 43). However, few hotspot studies were conducted on intersections, and most of them were conducted on segments, and, as in this study, performance measures suggested by HSM were used. Among them, the measures using the EB method were found to have the best consistency. Consistency verification is used to evaluate whether it is appropriate to use the proposed indicators as a measure of hotspot identification. Therefore, since the consistency test result does not mean that the performance is excellent, it should only be referred to. Nevertheless, the EB method is known to have predictive performance and can reflect various elements of the section in the analysis, so it can be considered good enough. Unlike this study, it is difficult to directly compare existing studies because they did not target intersections, but EPDO and excess predicted crash frequency measures using SPFs proposed in this study can be expanded to the EB method if they solve future sample issues. In addition, since the consistency analysis results showed that there was no problem, it was judged that the possibility of utilization was sufficient. Finally, the biggest advantage of the proposed measures is that it reflects the severity analysis weight, so it is not reasonable to evaluate the proposed measures as a result of a simple consistency test. If this indicator is applied to overseas intersections in the future, it will be a good basis for verification.
In this study, new performance measures reflecting severity factor weights were proposed. However, there are several limitations to this study. More work is needed to increase the usability of these measures. First, a sufficient sample size is needed for validation. Data from a total of 42,513 incidents were learned for severity analysis. However, validation relied on data from 1,990 cases at 81 intersections. The analysis period was 2 years, which is insufficient compared with previous studies. Verification will be more reliable if the temporal and spatial ranges of data are expanded in the future. Second, on-site verification of the hotspot identification and crash analysis that occurred in the intersection are required. Hotspots identified by indicators reflecting severity weights can provide new insights for intersections, but it is impossible to judge whether the identification is right or wrong. Therefore, it is necessary to verify the analysis results through additional field analysis for some intersections. Finally, application of different variables in the intersection safety evaluation study is required. In this study, only data that can be collected from online GIS services were used as geometric variables because of the limited number of available variables. According to previous studies, variables such as signal sequence, number of conflicts, and walking traffic were also used (10, 22, 44–47). These variables can be used as input variables of SPFs, which can then be used to calculate performance measures.
Using the new performance measures proposed in this study for hotspot identification, safety managers can track crash severity factors that were not identified with the original method. It is also expected to be possible to design a countermeasure suitable for each intersection based on the factors tracked in this study.
Footnotes
Author Contributions
The authors confirm contributions to the paper as follows: study conception and design: S. Son, J. Park, G. Lee, M. Abdel-Aty; data collection: S. Son; analysis and interpretation of results: S. Son, J. Park; draft manuscript preparation: S. Son, J. Park, G. Lee, M. Abdel-Aty. All authors reviewed the results and approved the final version of the manuscript.
Declaration of Conflicting Interests
The author(s) declared no potential conflicts of interest with respect to the research, authorship, and/or publication of this article.
Funding
The author(s) disclosed receipt of the following financial support for the research, authorship, and/or publication of this article: This research was supported by the Basic Science Research Program through the National Research Foundation of Korea (NRF) funded by the Ministry of Science, ICT, and Future Planning (2019R1G1A1010209).

Data Accessibility Statement
Some or all data, models, or code that support the findings of this study are available from the corresponding author on reasonable request.