



Abstract
The durability of permanent pavement markings (PPMs) on roadways is important for drivers’ safety. There are two primary mechanical failure modes: cohesive failure that occurs internally in PPMs through small defects, such as internal pores, and adhesive failure that occurs along the interface between PPMs and road surfaces. Thus, it is critical to characterize the intrinsic mechanical properties of PPMs as well as the adhesion of PPMs on road surfaces to understand their mechanical performance and, ultimately, the durability of PPMs. In this study, the flexural modulus and strength of PPMs were characterized via three-point bend testing, while fracture toughness was determined with single edge notch bend testing. To analyze the adhesive performance of PPMs on asphalt, a shear adhesion testing approach was developed to measure the apparent debonding energy of PPM specimens on asphalt. The shear adhesion test was performed on asphalt road surfaces and cut surfaces to investigate the chemical and mechanical interfacial effects on adhesion. Two commercial thermoplastic PPMs with different mechanical properties were investigated to study how various factors directly affect the adhesion of PPMs on asphalt surfaces. Through mechanical tests, the relationships between the intrinsic materials properties and the mechanical performance of PPMs on asphalt were studied. A PPM material that had lower modulus and higher deformation energy exhibited greater adhesion performance on asphalt, especially when the PPM material was applied at higher asphalt surface temperatures on rough asphalt surfaces.
Permanent pavement markings (PPMs) are utilized on roadways to provide clear pathways and traffic information to road users. To enhance driver safety, PPMs must be highly visible and durable on roadways. Understanding the mechanical properties and adhesion of PPMs is critical to predicting the PPM’s service lifecycle, which could prevent dangerous confusion on roadways resulting from missing pavement markings. However, there have been widespread issues in which PPMs have become abraded, cracked, and have peeled over time (1, 2). Various external factors, including the condition of the roadway surface, traffic volume, and environmental conditions, can result in adhesive and cohesive failures of PPMs (3, 4). PPM adhesion is affected by the type of pavement (material and grade) as well as the condition of the pavement (age, dryness, temperature) that it is applied to (5, 6). PPMs can also be significantly damaged through snowplowing and salt/aggregate use in winter ( 7 ). Internal factors also influence the performance of PPMs on different roadways, including the intrinsic material properties of the PPM (elastic modulus, tensile strength, hardness) and how these properties change in response to environmental conditions, such as variation in temperature and humidity (8–10). However, several previous studies have focused on evaluating the retroreflectivity or the durability of PPMs based on ASTM standards using image analysis before and after a wear test (7, 11–13). There is a lack of understanding of how the mechanical and intrinsic materials properties of PPMs affect their mechanical performance on road surfaces.
In this study, various testing methods were utilized to quantitatively assess the mechanical performance of PPMs on asphalt using thermoplastic materials. PPM thermoplastic is known to be one of the most durable pavement markings, and the second most widely used PPM in the United States ( 14 ). PPM thermoplastic materials behave mechanically in several different ways and often debond from roads by cracking and then flaking off from the surface. Thus, the ability to resist crack propagation could be a critical factor in evaluating the durability of PPM thermoplastics. Single edge notch bend (SENB) testing was performed to determine the fracture toughness and the cohesive fracture energy of PPMs. Three-point bend (3PB) testing was also employed to measure the flexural modulus and strength of PPMs. To evaluate the adhesive performance of PPMs on asphalt, an adhesion test was developed in this study based on a Mode II in-plane shear failure. The shear adhesion test can measure the total mechanical energy, including elastic and plastic deformation in the thermoplastic PPM, required to induce the adhesive or cohesive failure of PPMs on asphalt. The performance of PPM thermoplastic is known to be sensitive to environmental conditions, such as the asphalt surface temperature at which PPM thermoplastic is applied ( 5 ). Thus, measuring the fracture energy of PPMs on asphalt as a function of asphalt surface application temperatures could validate the new methodology as well as improve our understanding of the relationship between the intrinsic properties of PPMs and their mechanical performance on asphalt.
Materials and Methods
Two commercially available PPM thermoplastics, labeled PPM-1 and PPM-2, were provided by Ennis-Flint, Inc. and used in this study as-received. Both PPM thermoplastic materials comprised approximately 80 wt% ceramic materials (calcium carbonate titanium dioxide and glass beads) in 20 wt% polymer resin. 3PB- and SENB testing were utilized to characterize the intrinsic mechanical properties of both PPMs. The new methodology proposed in this study to evaluate the performance of PPMs on asphalt was the shear adhesion test on asphalt surfaces. The sample preparation procedure was based on the manufacturer-recommended application instructions for each PPM. Five to six different specimens were used for each trial of all the mechanical tests to obtain representative data and determine sample to sample variation.
Three-Point Bend Test and Single Edge Notch Bend Test
The 3PB test was performed to measure the flexural modulus and the strength of PPMs using a universal testing machine (ADMET).


where
F = load,
L = span,
w = width,
d = thickness of the specimen, and
D = deflection ( 15 ).
The flexural stress,
The SENB test was conducted to determine the fracture toughness (KIC) and the cohesive fracture energy (Gf). Fracture toughness indicates a material’s resistance to crack propagation. The load was applied to a notched specimen, with a 3-mm precrack length of the total 6-mm thick sample, in the 3PB fixture. KIC was calculated by Equation 3 when the specimen fractured,

where the crack shape factor is defined as

where
S = span length,
t = thickness,
w = width, and
a = precrack length of the sample ( 16 ).
The cohesive fracture energy, Gf, was determined by Equation 5 based on the load-deflection graph,

where
The
Shear Adhesion Test
To evaluate the performance of PPMs on asphalt, a shear adhesion test was developed as illustrated in Figure 1. When applying the PPM specimens on asphalt, the asphalt core surface temperatures were variously controlled at 15°C, 25°C, 35°C, and 40°C using a hot plate or a freezer. Each thermoplastic sample was heated for 10 min in a mold 20 mm wide × 20 mm long × 5 mm deep in an oven at the manufacturer-recommended application temperatures. For PPM-2, the sample was manually agitated on a hot plate at the application temperature before being transferred into the mold and heated in the oven. When removing the molded thermoplastic from the oven, the surface-temperature-controlled asphalt core was placed on the melted thermoplastic and inverted, as shown in Figure 2.
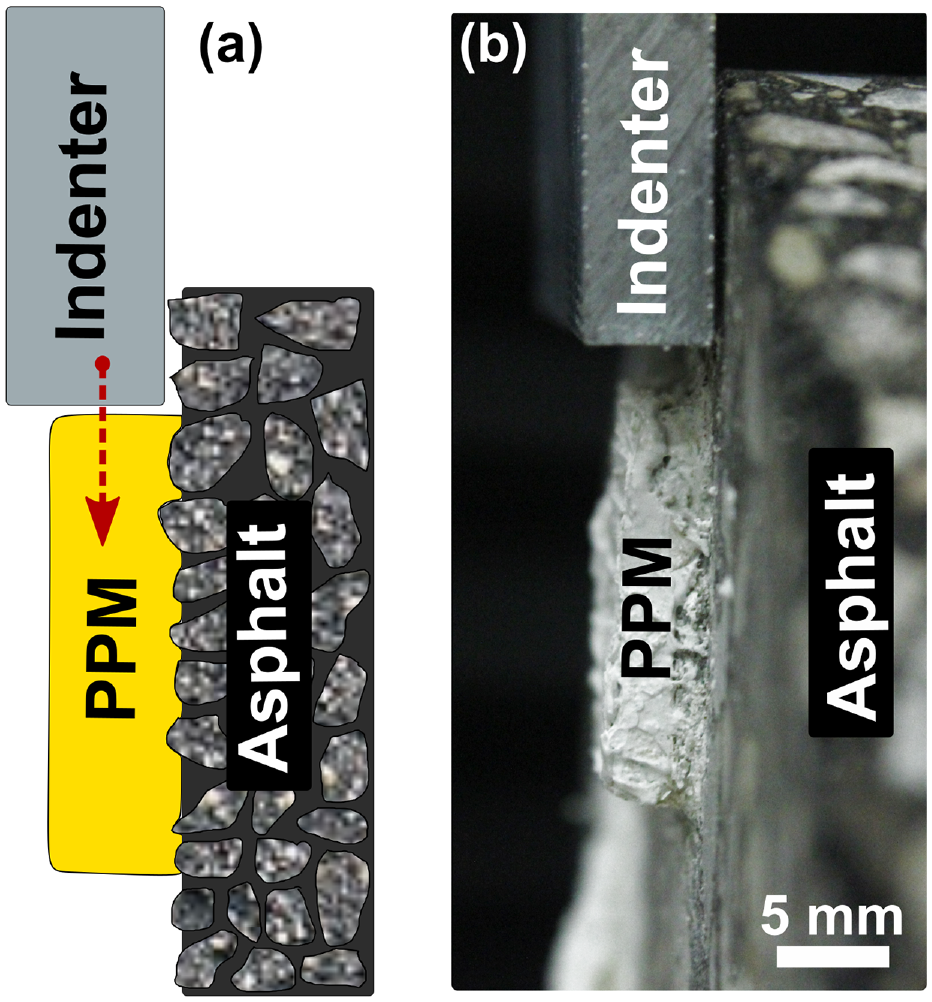
(a) Schematic and (b) photograph of the shear adhesion test developed.

Schematic of permanent pavement marking (PPM) sample preparation procedure showing: (a) sample in mold before and after thermal processing and (b) application of PPM to asphalt surfaces.
A soldering iron was additionally used to locally remelt each thermoplastic specimen to fill any visible pores and remove excess thermoplastic on the asphalt core. To evaluate the effect of surface roughness, thermoplastic PPM specimens applied to both smooth (cut) asphalt surfaces, and rough (road) asphalt surfaces were investigated. For the shear adhesion test, asphalt cores were vertically fixed on the universal testing machine (ADMET) and shear force was applied at a crosshead speed of 0.1 mm/s by a flat indenter to the top of the thermoplastic specimens, as shown in Figure 1, until fracture was observed. The apparent fracture energy was calculated by integrating the area under the load-displacement curve. Here, the displacement is defined as the distance traveled by the indenter. In the case that a specimen failed cohesively, the area until the maximum load at which the specimen fractured was taken as the fracture energy.
Results and Discussion
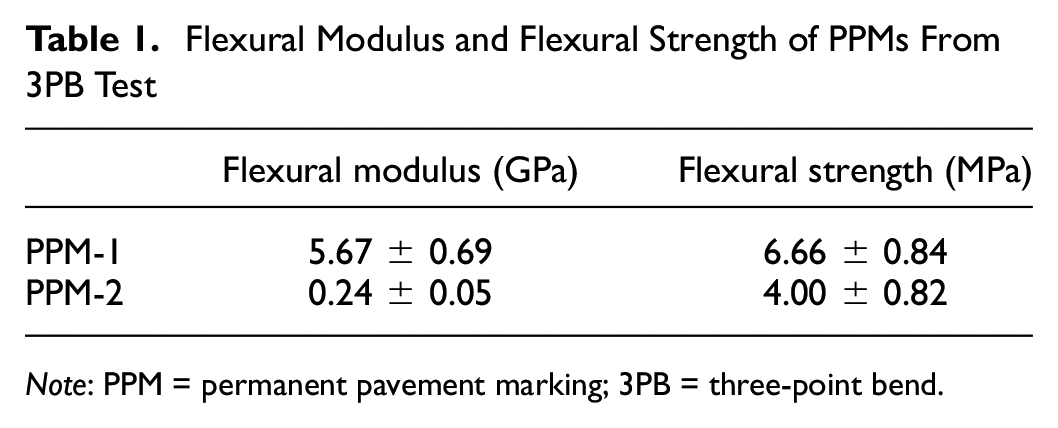
Figure 3b shows representative flexural stress versus flexural strain curves for PPM-1 and PPM-2 measured from the 3PB test. Flexural moduli were determined from the linear slopes of the 3PB test curves in the low strain range from 0 to 0.0005 for PPM-1, and from 0 to 0.001 for PPM-2, owing to the significantly different mechanical properties and subsequent elastic deformation regimes. Flexural modulus and strength values are reported in Table 1. Notably, the flexural modulus of PPM-1 was approximately 24 times greater than that of PPM-2, whereas their flexural strength values were similar in magnitude. PPM-1 exhibited brittle fracture behavior with a high resistance to bending deformation, since the PPM-1 specimen fractured at the maximum stress with little nonlinear deformation as shown in the inset graph in Figure 3b. Alternatively, PPM-2 displayed a yield point followed by plastic deformation and ultimately failed at a lower stress but much higher strain value than PPM-1. It was mainly found that the mechanical properties were significantly different; PPM-1 was brittle whereas PPM-2 was compliant having a high capacity for stress absorption and energy dissipation before fracture.
Flexural Modulus and Flexural Strength of PPMs From 3PB Test
Note: PPM = permanent pavement marking; 3PB = three-point bend.
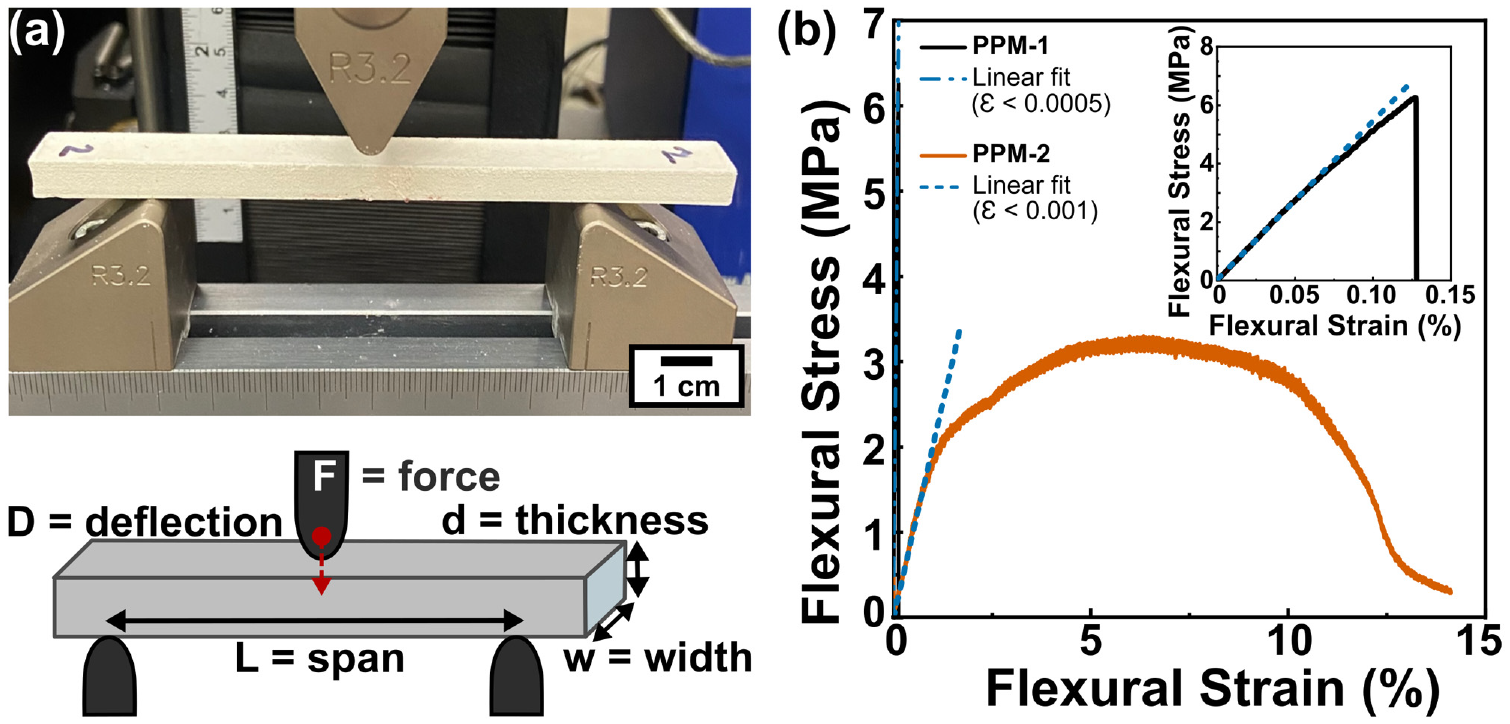
Photographic and schematic images (a) illustrating the three-point bend (3PB) test with key geometric parameters of the testing sample labeled and (b) flexural stress versus flexural strain curves show the comparison of 3PB test results for the two permanent pavement markings (PPMs). The inset in (b) shows the PPM-1 result in greater detail.
The load versus displacement curve obtained from the SENB test is shown in Figure 4b. The fracture toughness and the cohesive fracture energy values are indicated in Table 2. The fracture toughness value is a function of the maximum load and the geometry of the specimen. KIC values of PPM-1 and PPM-2 were within the experimental error since there was no significant difference between their maximum load values as shown in Figure 4b. For the cohesive fracture energy, it can be calculated by dividing the integrated area under the load-displacement graph by the fracture area of the specimen, assuming that there is no plastic deformation (17, 18). The Gf value of PPM-1 was measured to be 0.03 ± 0.01 kN/m. However, since there was significant plastic deformation observed in PPM-2 specimens, straightforward calculation of Gf is impossible. Comparing SENB data in Figure 4, PPM-1 exhibited a brittle fracture behavior, since the crack propagation occurred immediately after the crack opening initiated ( 19 ). On the other hand, the PPM-2 specimen exhibited stable crack propagation until fracture since the plastic deformation took place at the crack tip ( 20 ). This result indicates that PPM-2 requires more energy than PPM-1 during the fracture process under the bending stress because of its higher resistance to crack propagation, as shown in Figure 4.
Fracture Toughness and Cohesive Fracture Energy of PPMs From SENB Test

Note: PPM = permanent pavement marking; SENB = single edge notch bend.
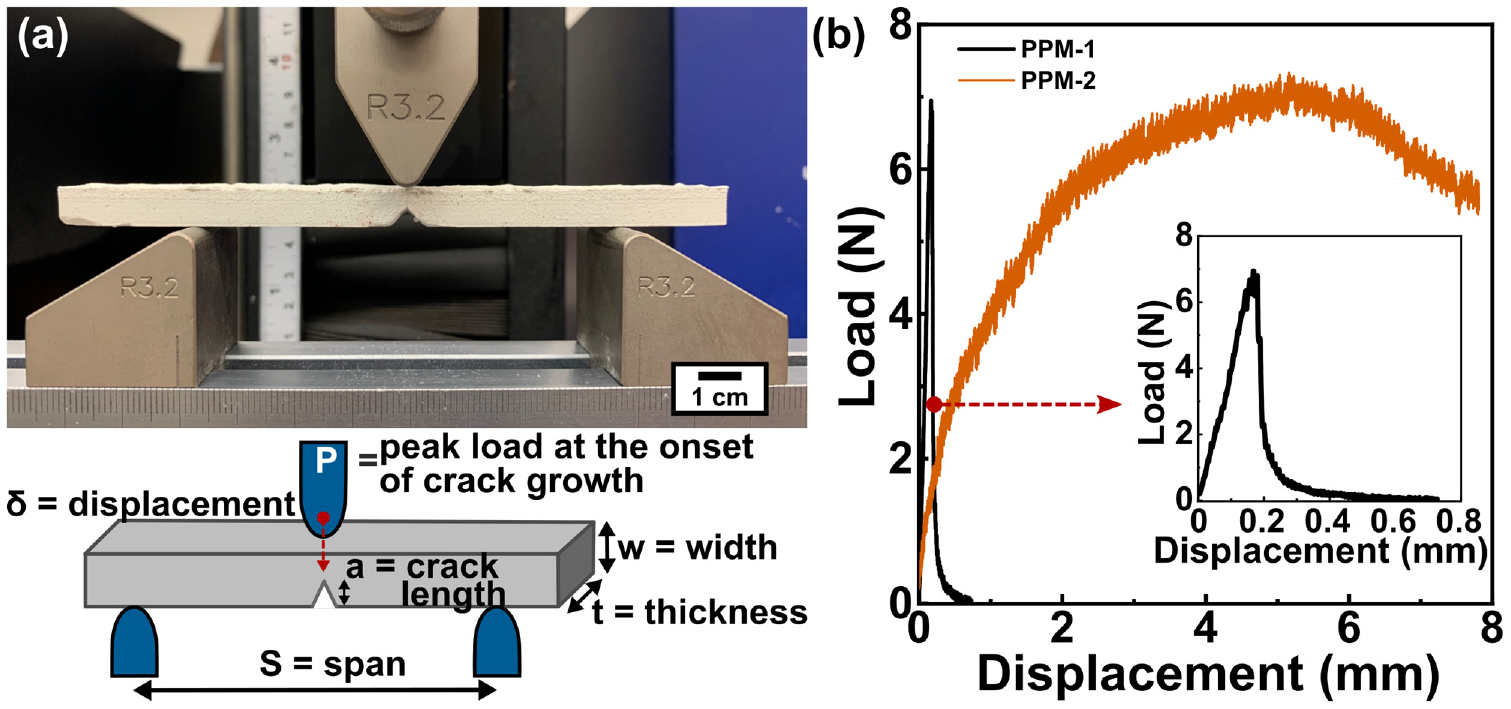
Photographic and schematic images (a) illustrating the single edge notch bend (SENB) test with key geometric parameters of the testing sample labeled and (b) displacement–load graph comparison for permanent pavement markings (PPMs) from the SENB test. Inset graph shows the result for PPM-1.
The shear adhesion test developed in this study determined the apparent work of debonding as the total energy required to fully remove PPM specimens from the asphalt surface. Three different failure modes resulted from the shear adhesion test: adhesive, cohesive, and mix-mode failure (shown in Figure 5a). In Figure 5b, the raw data for PPM specimens applied to rough surfaces is shown. At 15°C and 35°C, PPM-1 failed adhesively, while specimens applied at 25°C and 40°C failed cohesively. The slopes of graphs for PPM-1 specimens applied at 15°C and 35°C increased until they adhesively failed, indicating that PPM-1 exhibited the dynamic adhesive fracture behavior on asphalt. On the other hand, all PPM-2 specimens displayed in Figure 5c were adhesively failed. The slopes of the load versus displacement data for PPM-2 significantly increased once a displacement of approximately 2 mm was reached as the indenter came fully into contact with the top surface of the sample. As PPM-2 specimens yielded, the slopes decreased until they failed adhesively. This indicates that the PPM-2 specimens needed more energy to fracture including the elastic and plastic deformation energy, and the interfacial fracture energy.
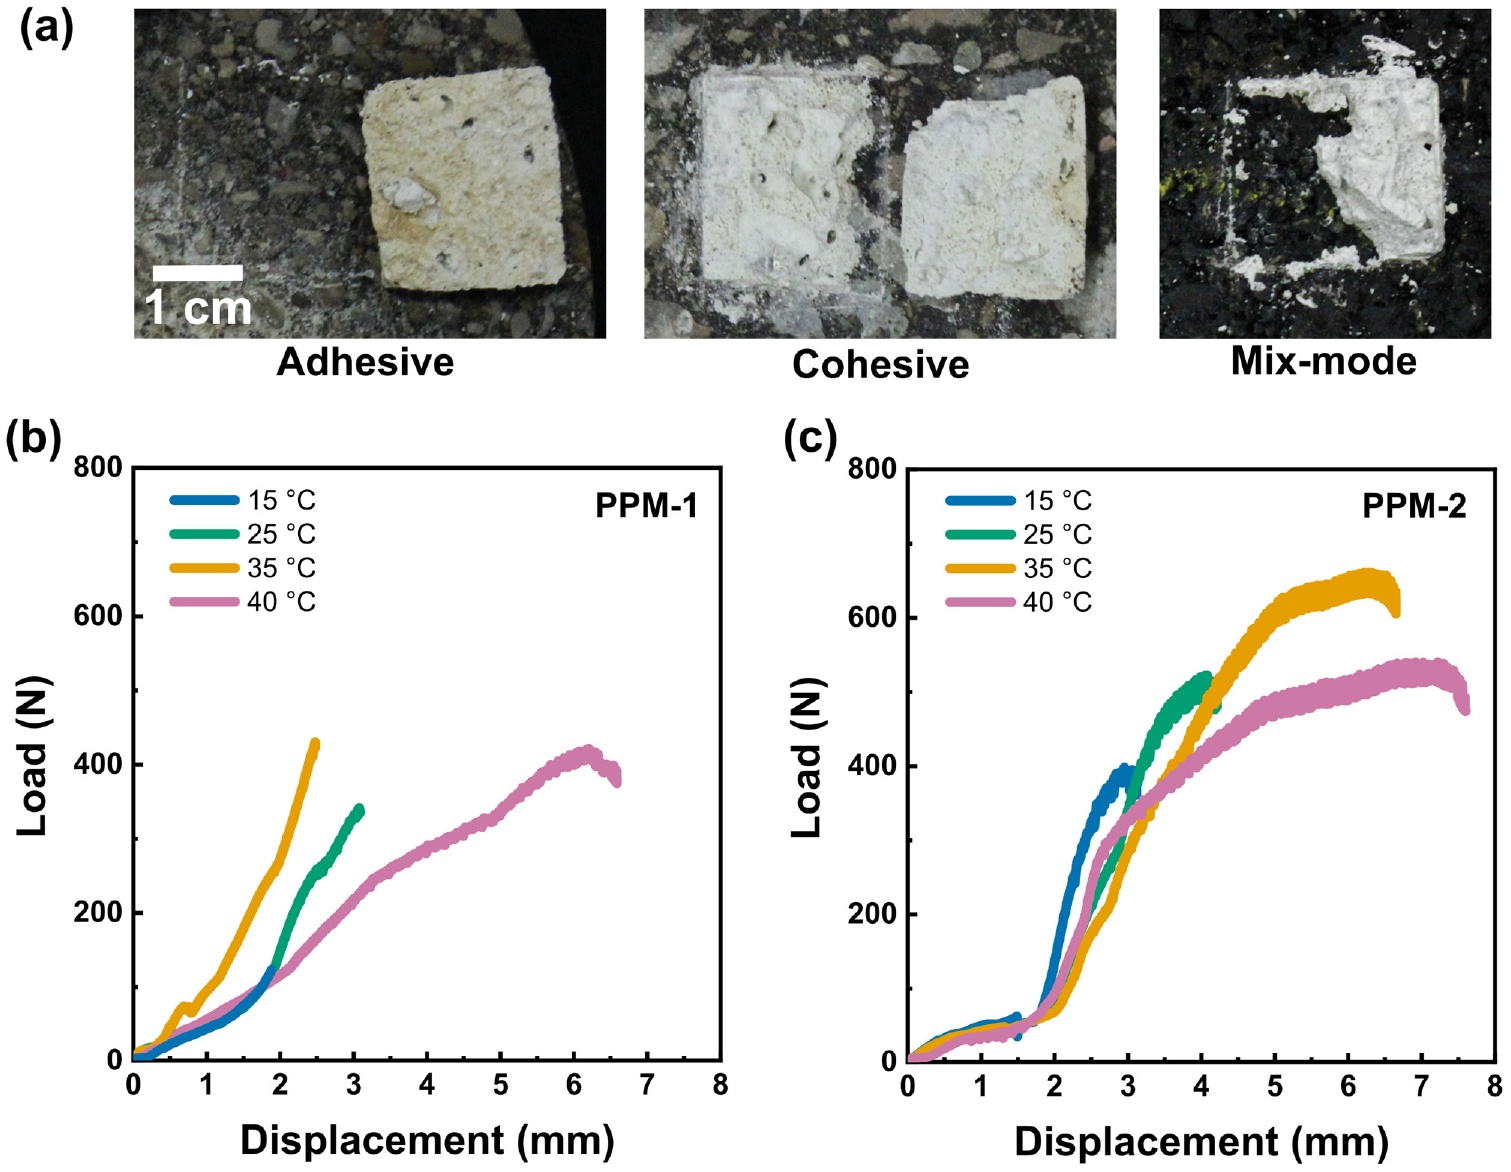
Photographic images (a) represent examples of fracture modes, adhesive, cohesive, and mix-mode, respectively. Shear adhesion test raw data of (b) PPM-1 and (c) PPM-2 performed on rough (road) asphalt surface at substrate application temperatures of 15°C, 25°C, 35°C, and 40°C, as an example.
For PPM-1 specimens tested on the smooth asphalt surface (shown in Figure 6a), most specimens applied at 15°C and 25°C failed adhesively, whereas various failure modes including the cohesive- and mix-mode failure were observed for PPM-1 specimens applied at 35°C and 40°C. PPM-1 specimens on the rough asphalt surface (Figure 6b) also showed various failure modes and higher apparent fracture energy values than PPM-1 tested on smooth surfaces (Figure 6a). For PPM-2, all specimens failed adhesively on the smooth asphalt surfaces, and most specimens (except two samples applied at 40°C) also failed adhesively on the rough asphalt surface. On both smooth and rough asphalt surfaces, the fracture energies of PPM-1 and PPM-2 increased as the asphalt surface application temperature increased.
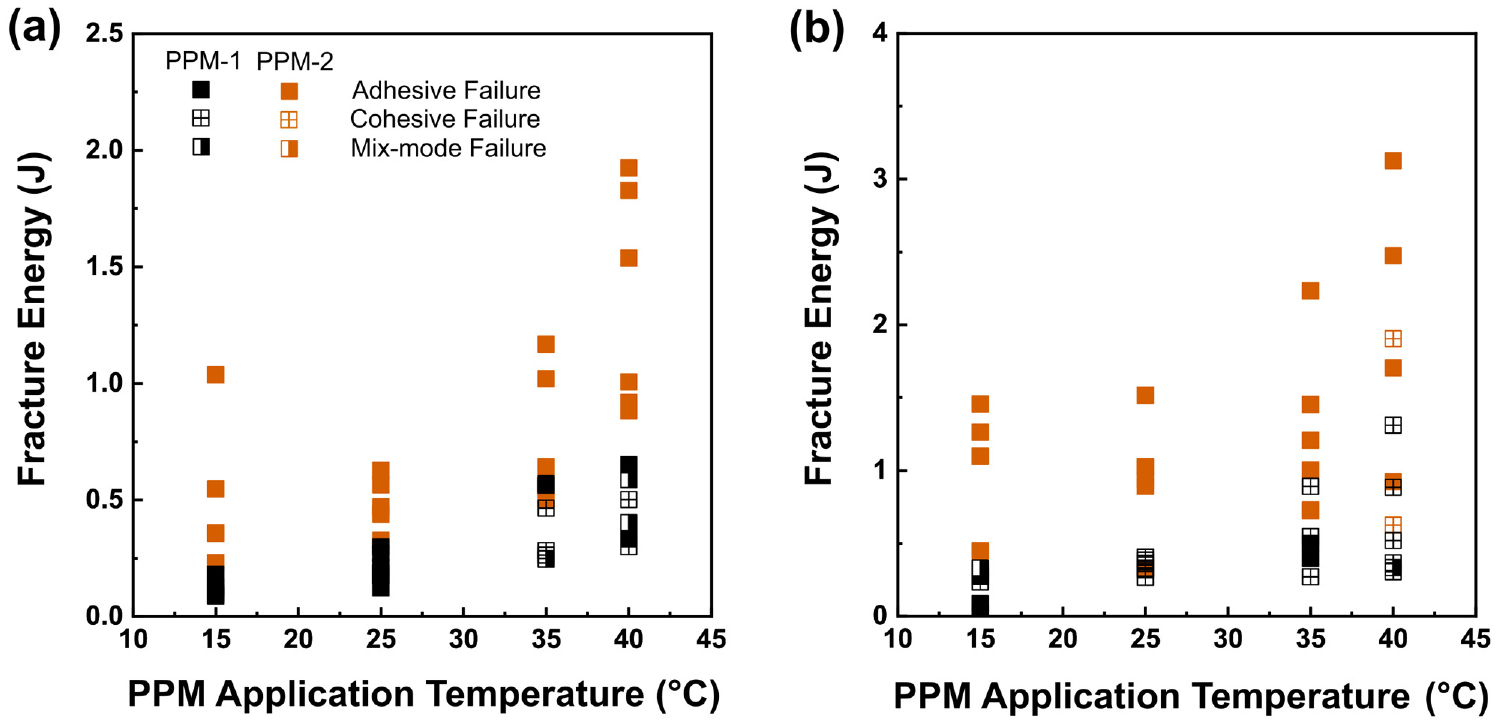
Comparison of shear adhesion test (a) on smooth (cut) asphalt surfaces and (b) rough (road) asphalt surfaces.
Comparing the rough and smooth asphalt surfaces, the fracture energy results and thus the adhesion strength from the smooth asphalt surfaces were considered to be dominated by chemical interactions between the asphalt and PPMs. Therefore, the results indicate that as the asphalt surface application temperature increased, a degree of mechanical interlocking between the asphalt and PPMs was more likely to occur, resulting in an increase in the apparent fracture energy (3, 6). For the shear adhesion tests on rough asphalt surfaces, since PPM specimens could more strongly mechanically interlock with the rough asphalt surfaces compared with the smooth, overall fracture energies on the rough asphalt surfaces were approximately 50% higher than analogous adhesion values on the smooth asphalt surfaces. Additionally, the results from the rough asphalt surfaces essentially reflected the mechanical interactions between PPMs and asphalt. Referring back to the bending measurements presented in Figure 4, PPM-2 was compliant enough to attain more plastic deformation, resulting in the higher fracture energy compared with PPM-1 ( 21 ). Through the shear adhesion test, the brittle PPM-1 would be expected to be cracked and mainly cohesively fractured whereas the more compliant PPM-2 would be expected to be plastically deformed and adhesively failed on asphalt surfaces.
Conclusions
A shear adhesion test was developed to quantify the debonding energy of thermoplastic PPMs on asphalt surfaces. It was shown that the shear adhesion test was sensitive to differences in the adhesive performance of PPMs applied at different asphalt surface temperatures. Through classical mechanical characterization, PPM-1 was found to exhibit a brittle fracture behavior in which rapid crack propagation took place. Notably, the dynamic, unstable fracture in PPM-1 was observed to initiate and propagate from small defects, such as internal pores, or along the interface between the glass beads and the polymer matrix. Similarly, from the shear adhesion test, PPM-1 exhibited an unstable fracture behavior on asphalt. In contrast, PPM-2, which has a relatively low flexural modulus compared with PPM-1, primarily displayed adhesive failure over the various asphalt surface application temperatures. Overall, when PPMs were able to interlock mechanically with the rough asphalt surfaces, cohesive fracture mechanisms dominated the shear adhesion failure, resulting in higher fracture energies. Additionally, it was found that the environmental temperature was a critical factor affecting the adhesion between the asphalt and PPMs since the apparent fracture energy increased as the asphalt surface application temperature increased. Future studies will examine the effects of extended temperature (high and low) and ultraviolet exposure on the shear adhesion performance of PPMs.
Footnotes
Author Contributions
The authors confirm contribution to the paper as follows: study conception and design: H. Jo, K. Erk, C. Davis; data collection: M. Giroux; analysis and interpretation of results: H. Jo, M. Giroux, C. Davis, K. Erk; draft manuscript preparation: H. Jo, C. Davis; All authors reviewed the results and approved the final version of the manuscript.
Declaration of Conflicting Interests
The authors declared no potential conflicts of interest with respect to the research, authorship, and/or publication of this article.
Funding
The authors disclosed receipt of the following financial support for the research, authorship, and/or publication of this article: This work was supported by the Joint Transportation Research Program administered by the Indiana Department of Transportation and Purdue University under Project Number SPR-4423.
The contents of this paper reflect the views of the authors, who are responsible for the facts and the accuracy of the data presented here and do not necessarily reflect the official views or policies of the sponsoring organizations. These contents do not constitute a standard, specification, or regulation.