
Abstract
We use data from an originally designed survey instrument administered in the Minneapolis–St. Paul metropolitan area to gauge general attitudes and design preferences for a hypothetical shared automated vehicle (SAV) system. Design considerations include seating, payment and booking logistics, security, and extra space and amenities. We pay particular attention to the role of gender, race, health, and income in shaping these attitudes and preferences. Specifically, we use multiple regression models to uncover general willingness-to-use SAV technology, finding that women are overall less comfortable with the technology, Black and Hispanic participants are more willing to pay for SAV technology and generally display lower magnitude preferences for design considerations. Although results are mixed in both sets of analysis for health status, higher income individuals display higher willingness to pay and higher magnitude preferences for design considerations.
Keywords
Shared automated vehicle (SAV) technology is a particularly beneficial application of driverless vehicle technology ( 1 ) that is characterized by vehicle sharing, multimodal connection to existing transportation networks, and demand responsive interdependent networks of vehicles ( 2 ). Because of their potential to reduce traffic, research suggests that SAVs (and automated vehicle [AV] technology in general) could improve safety and reduce emissions, highlighting the benefits of widespread SAV adoption ( 3 , 4 ). If SAV systems feature efficient connections to high-quality public transit, widespread community adoption could provide inexpensive mobility services to all people (including people with disabilities and the elderly), thereby improving family and community ties and boosting economic productivity and equity. On-demand SAV service could be more affordable than owning a personal AV, with the projected US$50,000 vehicle price absorbed across a platform funded by per-ride fares and likely public subsidization ( 5 , 6 ).
However, without careful design and planning, these new technologies may reinforce inequity and inefficiency issues plaguing existing transportation systems ( 7 – 10 ). Although on-demand service would likely be more affordable than owning and maintaining a personal vehicle, rides still may be cost-prohibitive for low-income communities ( 5 ). Further, if systems are designed around the needs of high-socioeconomic-status riders, intended transportation benefits may not be distributed equitably. The rollout of on-demand ride services in NYC exemplifies how new disruptive transportation technology can exacerbate inequity ( 11 ). Evidence suggests that these services were more concentrated in areas of wealth and that their high cost reduced their practical effect in low-income communities ( 11 ). Policies are required to guide an equitable access to AVs and prevent discrimination in the provision of services persistent in today’s shared mobility services ( 8 ). Despite this, few U.S. cities have plans in place guiding the deployment toward this positive future ( 12 ).
Using data from an originally designed survey of Minneapolis–St. Paul metropolitan area residents, this paper investigates sociodemographic differences in attitudes toward SAV technology, including the design considerations of the potential service (preferred wait-time, payment, vehicle design, safety considerations, etc.). After administering the survey during the Summer and Fall of 2020 and recruiting participants through social media advertisements and Qualtrics survey panels, we compiled a final sample of over 400 unique participant responses. With these data, we answer two specific research questions. First, what demographic and socioeconomic factors drive individual willingness to use SAV technology? We use three metrics of SAV use willingness: the maximum payment someone would pay to travel to a set location, the maximum wait time before pickup for that same trip, and a Likert scale of general comfort riding in a shared driverless vehicle. Second, how do design considerations differ by race, gender, income, and health? To answer this question, we use the conjoint survey analysis method to examine preferences for booking and payment systems, onboard space for personal items, onboard seating configurations, security features, and extra amenities.
We find that differences in general attitudes to SAV technology translate to differences in design consideration preferences. Specifically, we find that although gender does not affect maximum payment or wait times, women are on average less comfortable with SAV technology than men. Gender also affected design considerations, with women displaying significantly higher preferences for onboard security features than men. By contrast, Black and Hispanic participants reported higher willingness to pay (WTP) than White participants, yet other comfort measures were unassociated with participant race. However, White participants’ design consideration preferences were more pronounced than those of participants of color across all different feature categories. While reported health status does not affect any willingness-to-use variables, unhealthy and healthy participants report preferences of slightly different magnitudes across most categories of possible design features. Income drives only WTP yet is positively correlated with the magnitude of preferences for most additional features.
Ultimately, these findings can help practitioners guide awareness campaigns and better plan for the equitable rollout of SAV technology. Specifically, this study’s findings could advise policies intending to ameliorate discrimination in the provision of shared mobility services and evaluation measures and priority frameworks for equitable SAV resource allocation ( 8 , 13 ). Given demographic differences in attitudes and design preferences, policymakers and planners can design SAV systems to equitably attract different communities. In addition, we fill a gap in the literature, specifically quantifying public preferences, design preferences, and equity considerations around SAV technology, rather than personal AVs.
The rest of the paper is structured as follows. In the following section we provide a brief literature review on SAV technology and public attitudes and preferences. Then we provide a background of our survey methodology and data-gathering process. Next we summarize data gathered and used in our statistical analysis. After that we examine the results of models predicting general willingness to adopt SAV technology before turning to models that identify preferences among certain hypothetical features of SAV technology, splitting our sample by the four demographic indicators described previously. Finally, we discuss results and conclusions.
Literature Review
Although there is not much in the literature around public preferences and attitudes around SAV systems specifically, there have been several studies on the demand-side barriers to the widespread adoption of general AV technology. Specifically, research demonstrates that cost, travel time, and waiting time play an important role in predicting AV adoption ( 1 , 14 , 15 ). Kyriakidis et al. ( 14 ) found that 22% of respondents would only ride an AV if they could do so at no cost and highlighted concerns about data privacy, data issues, and safety. Further, Haboucha et al. ( 16 ) found that even if SAV services were available at no cost, only 75% of the respondents would use the service. This points to the need for awareness campaigns and peer-to-peer communication that can counteract low willingness to use AV technology among some demographics (11, 15, 17–19).
Much of the literature on AV adoption suggests the presence of gender and age gaps in attitudes toward AV technology. Both Moody et al. ( 20 ) and Abraham et al. ( 21 ) found that young, high-income, highly educated males were the most optimistic about AV safety. Hulse et al. ( 22 ) found that 43% of their survey participants had a positive attitude toward AV technology whereas 46% were uncertain and 10% expressed negative sentiment. Those who were significantly more likely to have a positive attitude toward autonomous vehicles were male and younger. Older participants were the most likely to have a negative attitude toward autonomous vehicles.
Many other papers found that women exhibit a lower preference for AV technology than men (17, 21, 23–26). However, most of this literature focuses on gender gaps in nonshared AVs. SAV technology relies on shared vehicles, which may further exacerbate women’s discomfort. Women are 10% more likely than men to feel unsafe in rail transit and 6% more likely to feel unsafe in buses, with women’s safety perceptions driving their overall satisfaction with public transit services ( 27 ). Hsu et al. ( 28 ) found that while attitudes toward environmental concerns related to transit use did not differ along gender lines, women had higher safety concerns than men.
Researchers have also examined the relationship between perceptions of AV technology and physical disability, finding mixed results. Hwang ( 29 ) found that the ability of AV technology to address current transportation service inequities for people with disabilities improved opinions toward the technology, particularly among those with negative views of public transit. However, Bennett et al. ( 18 ) identified a more negative perception of AV technology among physically disabled respondents compared with able-bodied respondents. Although we do not examine the role of disability in our study, we do examine the relationship between SAV perceptions and physical health, an understudied area.
Survey Background
Our examination of public perceptions and preferences about SAV technology uses a sample gathered from across the Twin Cities metro area. Specifically, we used various recruitment methods including using Facebook advertisements targeting Minneapolis and surrounding 15-mile radius as well as using the Double-Opt-In Market Research Panels at Qualtrics. The primary data source for this report was an originally designed survey instrument. The survey was administered through Qualtrics between July 3, 2020 and January 9, 2021.
We recruited survey participants through several methods. First, between July 3 and August 18, 2020, we ran a series of advertisements on Facebook and Instagram, targeted to users who resided in the seven-county (Hennepin, Ramsey, Anoka, Dakota, Carver, Scott, and Washington) metropolitan area. We ran ads during 2-week intervals and intermittently checked the composition of our sample to ensure that it was representative. After the first set of ads had run, our sample was overwhelmingly White and female, so we reset Facebook and Instagram ad targeting to emphasize majority-minority areas in South Minneapolis, North Minneapolis, and the Northwest first-ring suburbs, and Midway St. Paul. This improved sample representativeness slightly, so we readjusted our parameters after running another 2 weeks of ads, this time focusing on several groups that were less prominent in the sample: people who were parents, people who worked in service sector jobs, and people with lower levels of education.
After running these ads, we completed the sample by recruiting participants through Qualtrics. Qualtrics recruits paid panels of survey-takers intended to be representative of local area demographics. We recruited a Qualtrics panel primarily composed of people of color and skewed toward male participants to fully diversify our sample. We screened out Qualtrics panel participants who lived outside the seven-county metro area.
The survey opens with a page providing researcher contact information and information about the survey’s Institutional Research Board (IRB) approval. After participants provide their consent at the bottom of this page, they watch a minute-long introductory video created by the research team which describes SAVs and shows footage of SAV prototypes in action. See Figure 1 for a SAV prototype included in the video. The first section of the survey asks respondents to identify their level of comfort hypothetically riding an SAV such as those shown in the introduction video. Specifically, we asked participants “how comfortable would [they] be riding the automated vehicle technology shown in the video?” Responses along a five-point Likert scale ranged from “very uncomfortable” to “very comfortable,” with “neutral” in the middle. Participants were then asked to rank their comfort riding any vehicle with strangers (“people you do not know”), both at the current time and before the COVID-19 pandemic, using similarly worded five-point Likert scales. Following these comfort-related questions, we asked two questions intended to gauge respondents’ WTP for a single SAV ride from their home to downtown Minneapolis. The first of these questions captured economic WTP, asking respondents to identify their maximum price for such a ride. The next question captured temporal WTP, asking respondents to identify their maximum wait time for a SAV to pick them up for the same ride downtown. WTP for AV technology has been examined before using similar survey methods, so this approach fits with previous literature ( 23 ).
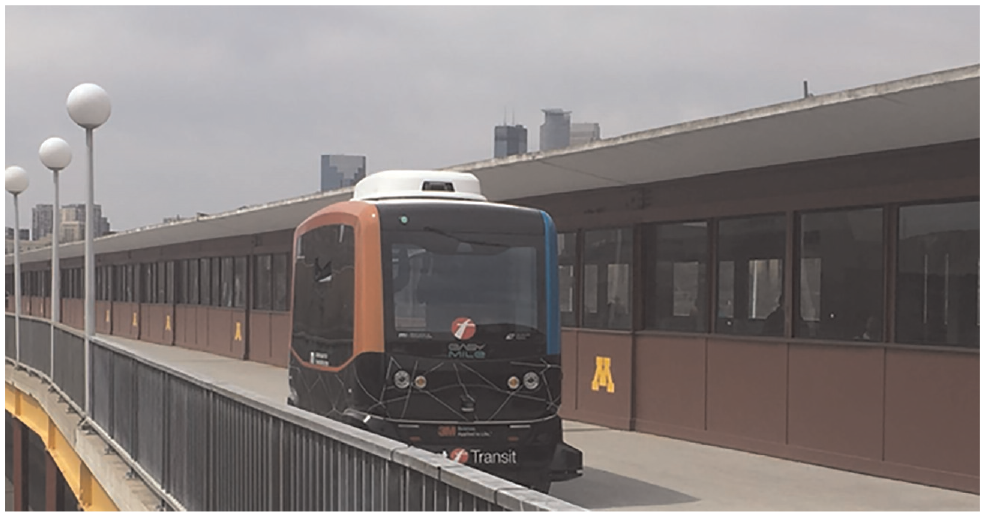
EasyMile shuttle in Minnesota in 2018.
Following the comfort and WTP questions, respondents were asked a series of demographic questions about their age, cohabitation/household structure, race/ethnicity, country of birth, gender, income bracket, and general health. In addition, a set of transportation access questions were included: whether participants had a valid driver license, how often respondents had access to an automobile, and how difficult it was to reach ten different areas within the Twin Cities metro area, including Downtown Minneapolis, Downtown St. Paul, and several first- and second-ring suburbs.
The next part of the survey relies on interactive participant mapping. Only a few questions from this section were used to generate the sample used in this paper. Specifically, we gather respondents’ home locations (as identified on a searchable map interface) and locations within the metro area that they travelled to during the 7 days before taking the survey. Participants were asked to identify if travelling to each location presented a hassle. We explain the control variables generated from these survey questions in the next section.
After participants finished the mapping section, they completed the final section of the survey. This section was composed of five questions asking respondents to select their preferred set of possible SAV features between two randomly generated sets. Because of its use of randomization, this conjoint survey analysis approach allows for more consistent causal inference in survey research ( 30 ). Sets were randomly populated with features from seven categories using self-designed computer algorithms. The seven categories and the associated features are outlined in Table 1. We conducted randomization such that at least two differences had to exist between the two competing sets and such that the same two sets could not reappear. Note that each category includes a baseline feature, considered the most basic possible specification for said category. Respondents then selected one of two randomly generated sets of features, with one feature per category appearing in each set. Figure 2 shows an example conjoint question from the survey.
Conjoint Survey Categories and Features
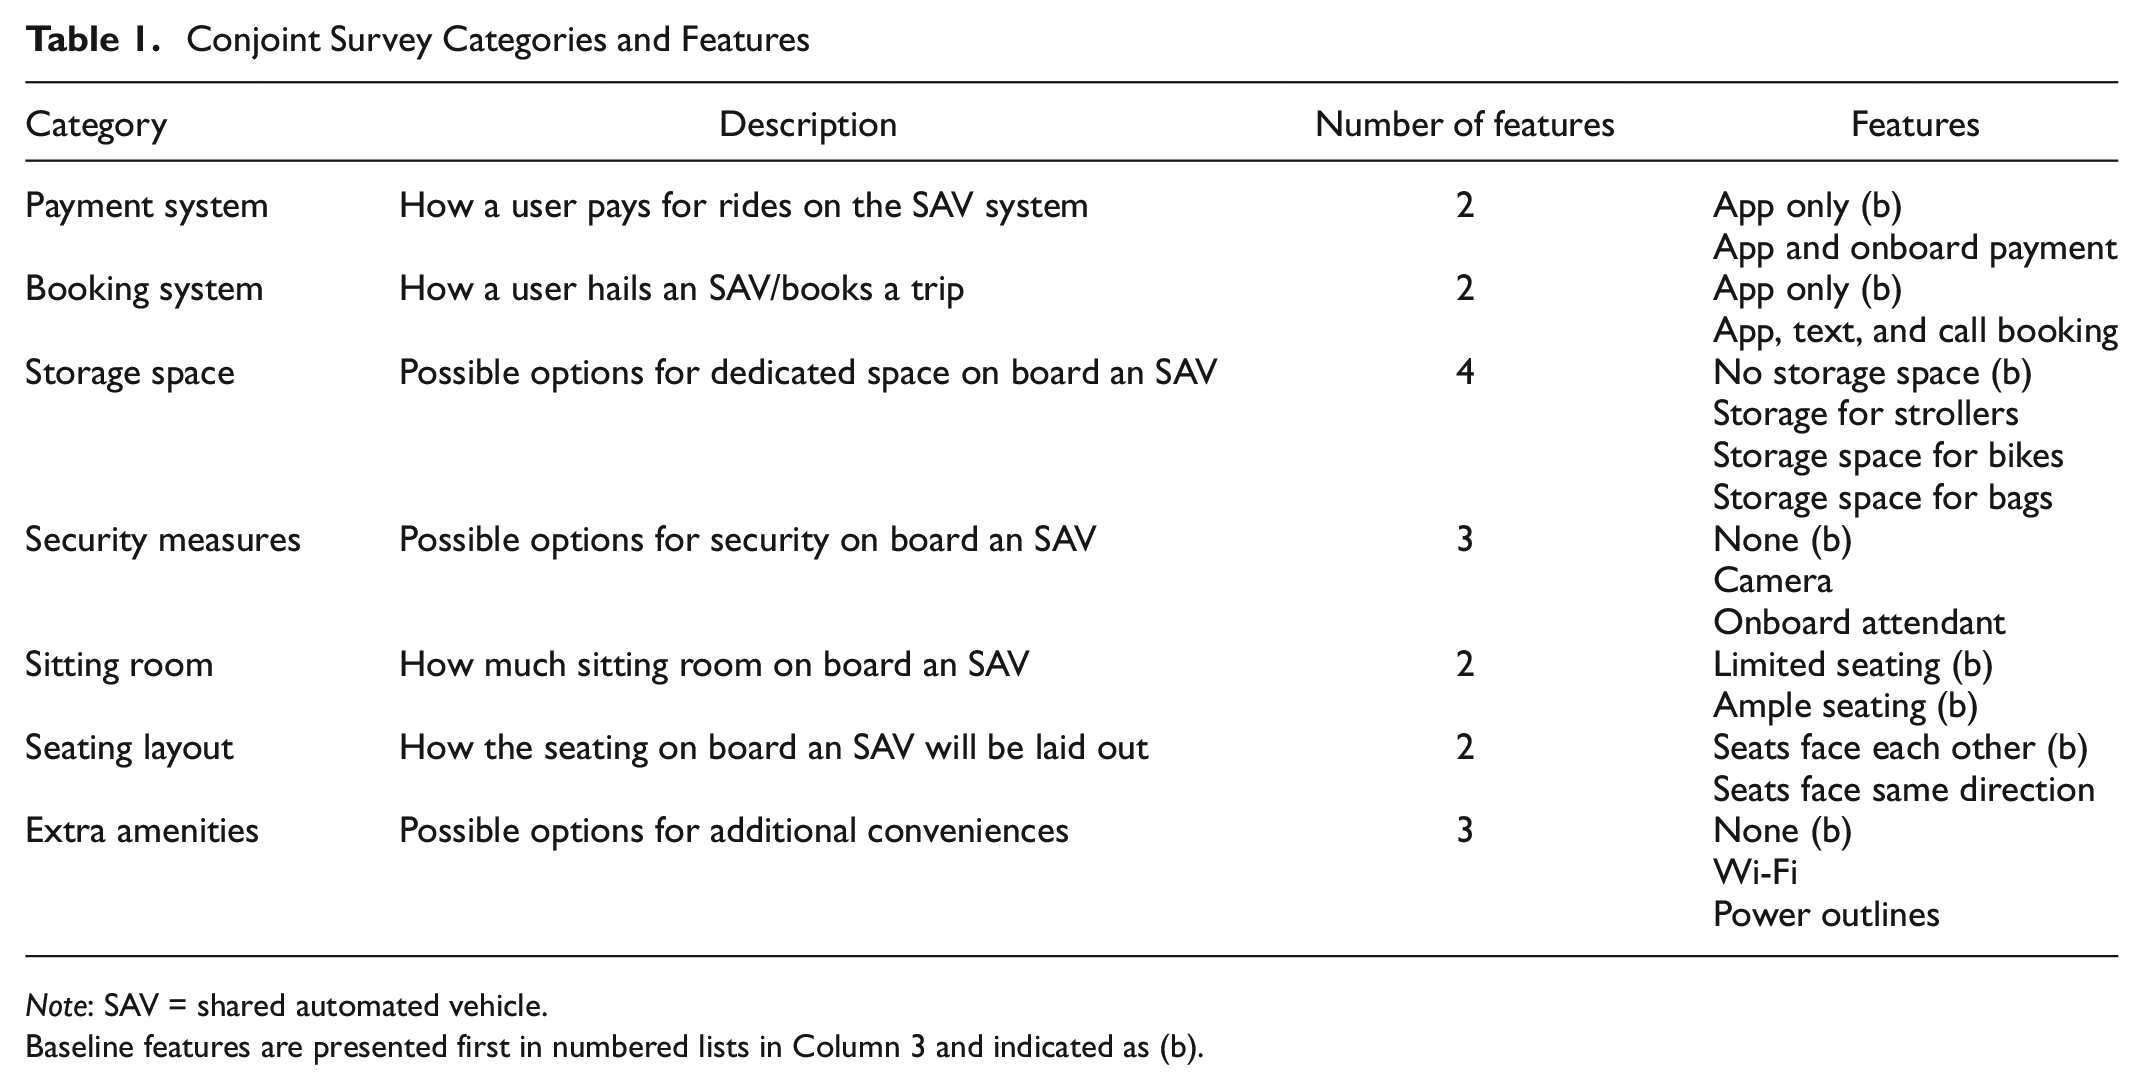
Note: SAV = shared automated vehicle.
Baseline features are presented first in numbered lists in Column 3 and indicated as (b).
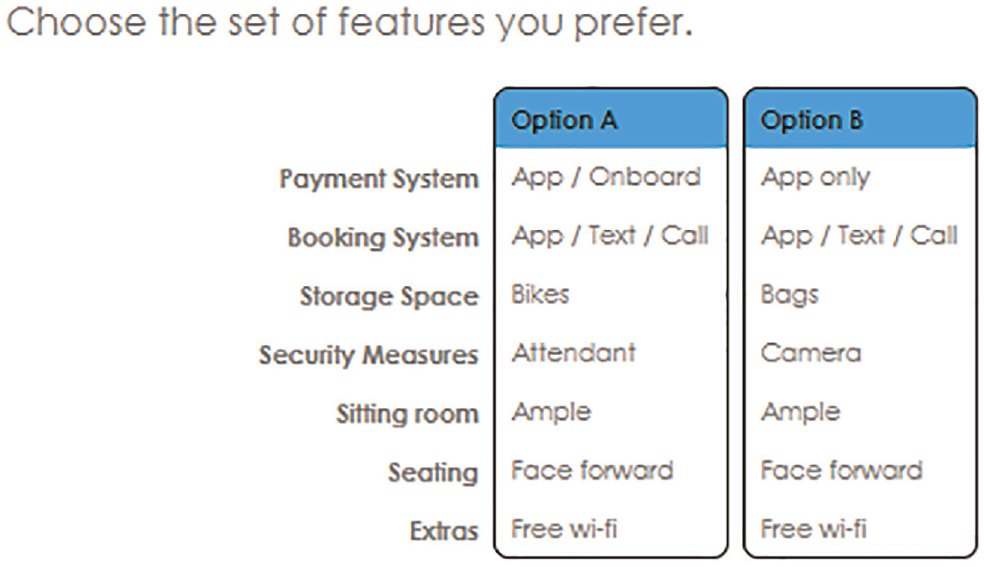
How feature bundles were shown to survey respondents.
Summary Statistics and Sample Geography
After survey administration completed, our data included 469 completed responses. We removed participants who did not live in the Twin Cities metro area or did not disclose a home location, leaving 413 remaining responses. Although some participants skipped a few questions or avoided disclosing certain demographic data, participant item-specific nonresponse occurred only for a few questions and never exceeded 5% of the total final sample.
The home locations of the 413 participants living in the seven-county area are shown in Figure 3, which also identifies the jurisdictions of Minneapolis and St. Paul, county boundaries, and major highways. We specifically identify Minneapolis and St. Paul in the map because as the central cities of the metro area, they have the most robust transit infrastructure and the densest urban form of any municipality in the region. Most participants live within Minneapolis or St. Paul or “first ring” suburbs such as St. Louis Park or Edina (shown in Figure 3 as the clusters of homes respectively to the west of central Minneapolis and south of Southwest Minneapolis).
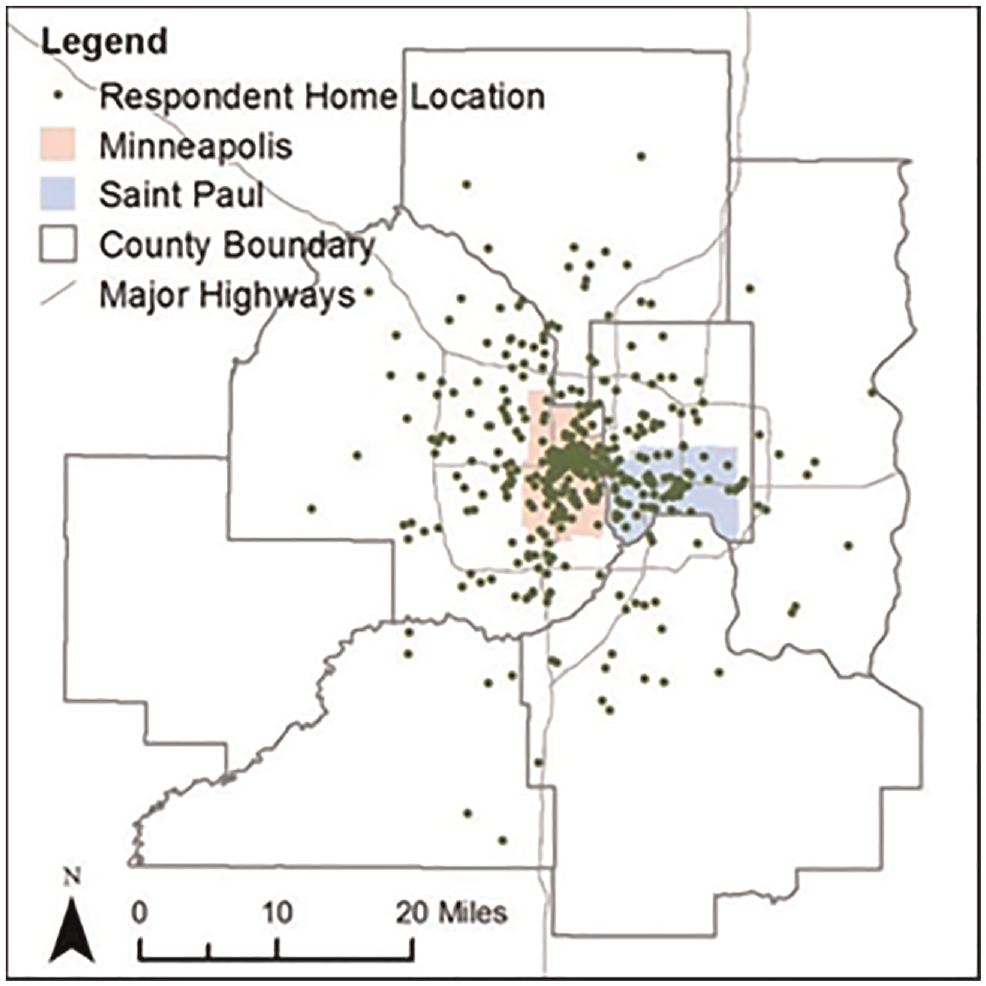
Map of home locations.
Table 2 lists summary statistics for both dependent and independent variables for all observations in the final sample. This includes continuous and binary variables. Notably, the sample is balanced across gender, and its racial breakdown generally reflects that of the entire seven-county Twin Cities metro area. The set of variables describing participant geography and travel patterns necessitates further explanation. The average participant listed 9.4 trips taken during the last week, including visits to the same location. The average activity space, defined by a participant’s minimum convex polygon bounding box of all listed locations surrounded by a 1-mile buffer, was about 102 square miles. In addition, nearly 54% of participants lived in Minneapolis or St. Paul. Finally, to gauge the extent to which travel presented hassles, we computed the Location Hassle Ratio: each participant’s raw ratio of the number of locations that induced any travel hassle to their total number of listed locations.
Summary Statistics of Dependent and Independent Variables

Note: SD = standard deviation; Min. = minimum; Max. = maximum; SAV = shared automated vehicle; PNS = preferred not to say (or participants who declined to disclose); na = not applicable.
Not all variables appear the same way in regressions as we make appropriate adjustments and transformations. Note that categorical variables are showing percentages, not means.
SAV Willingness-to-Adopt Analysis
To understand the determinants of the three measures of hypothetical SAV adoption, we regress each dependent variable on a full set of demographic and geographic indicators, according to the general equation:

where Y represents the exact recorded maximum payment in US dollars, maximum wait time in minutes, or a binary valued 1 if participants reported being comfortable or very comfortable with SAV technology (on the Likert Scale) and 0 otherwise. The right-hand side of the equation includes several vectors of variables (bolded in the equation) and an error term
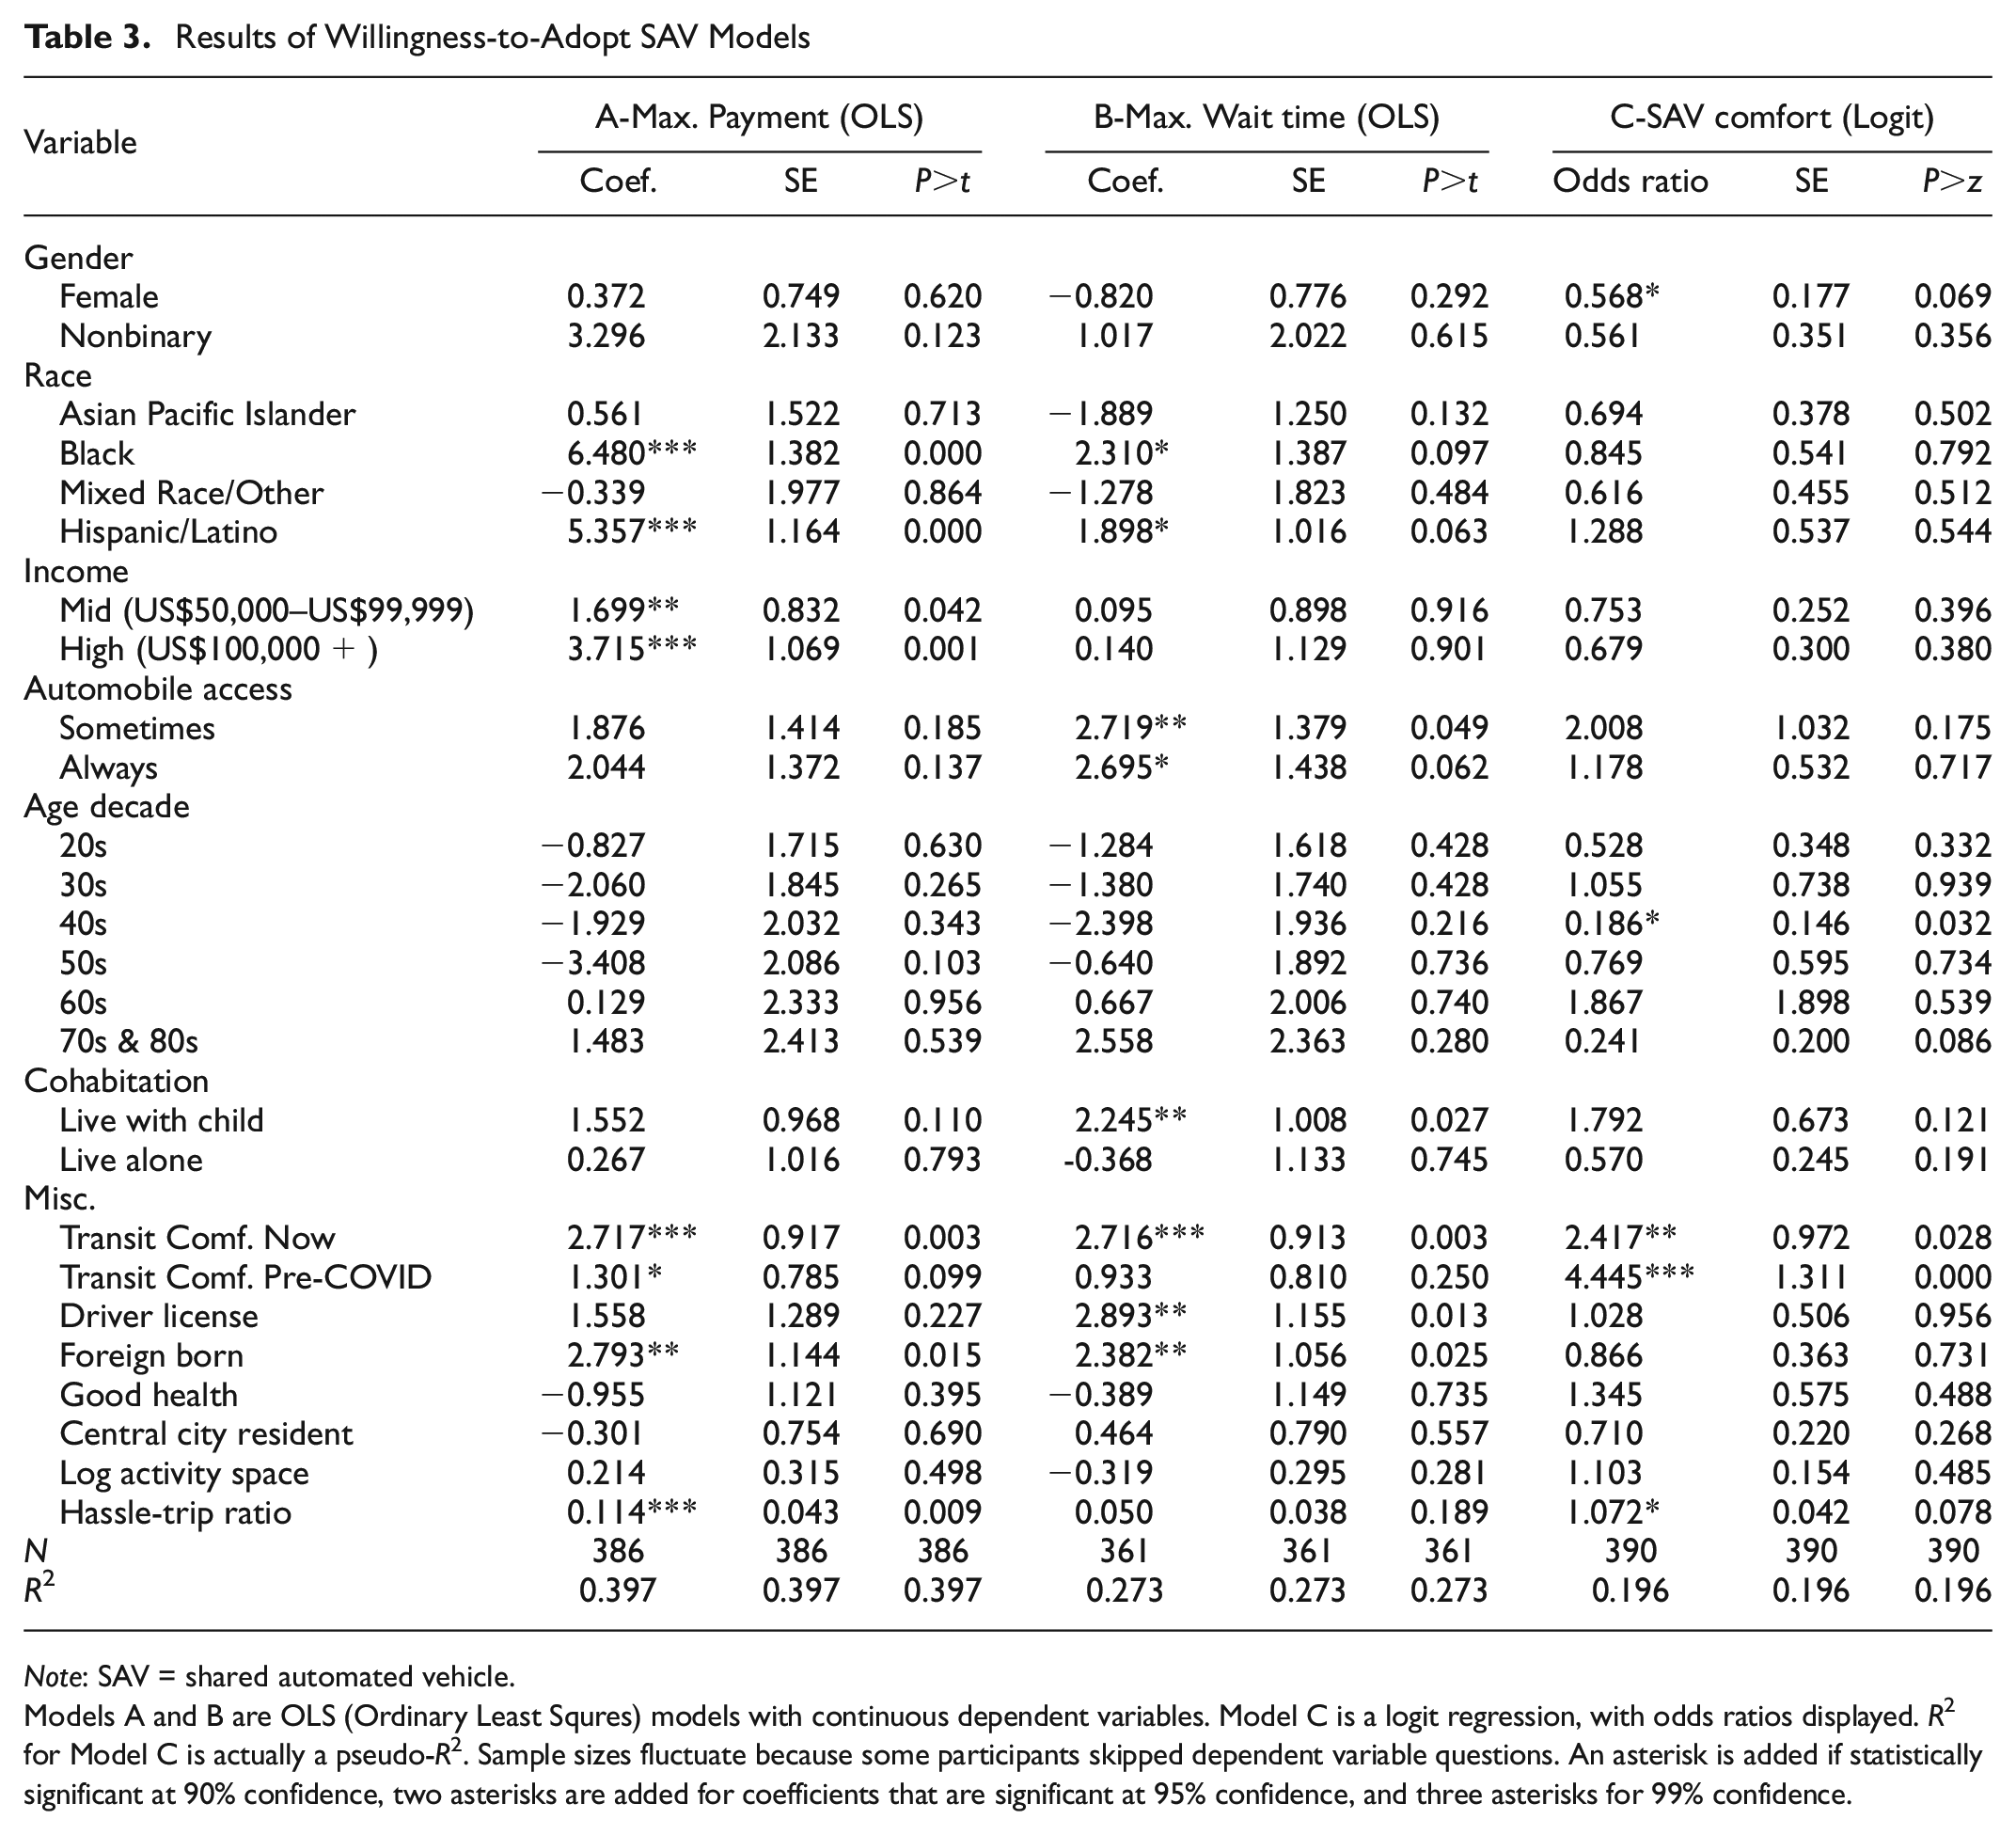
We use ordinary least squares (OLS) models to estimate the above equation for participants’ maximum payment and waiting time and logistic (logit) regression (reporting odds ratios) to examine the determinants of SAV comfort. Results of these three models are presented in Table 3, showing several important findings. Income affects WTP, with middle-income and high-income participants reporting average maximum payments respectively US$1.70 and US$3.70 higher than low-income participants. However, income was not associated with maximum wait time or general comfort. Good health status affected neither of the three dependent variables. For race, Black and Hispanic participants are willing to pay about US$6.50 and US$5.35 for a ride from their dwelling to downtown Minneapolis, controlling for their central city status and their income, compared with White participants. For gender, although women do not significantly differ from men in their maximum payment or wait times from men, they are about 50% less likely to report being somewhat or very comfortable with taking an SAV ride in Column C, a finding significant at 90% confidence. This aligns with findings of gendered perceptions toward SAV technology.
Results of Willingness-to-Adopt SAV Models
Note: SAV = shared automated vehicle.
Models A and B are OLS (Ordinary Least Squres) models with continuous dependent variables. Model C is a logit regression, with odds ratios displayed. R 2 for Model C is actually a pseudo-R 2. Sample sizes fluctuate because some participants skipped dependent variable questions. An asterisk is added if statistically significant at 90% confidence, two asterisks are added for coefficients that are significant at 95% confidence, and three asterisks for 99% confidence.
Transportation-related factors are also important. The ratio of hassles to total trips was positively correlated with WTP. This implies that as a potential solution to transportation problems, SAVs are valued by those who experience more difficulty in day-to-day transportation than those with relatively easy daily travel patterns. Although maximum wait time is positively correlated with participant automobile access, it is not significantly associated with other dependent variables. Similarly, having a driver’s license increases maximum wait time by about 3.5 min, but does not significantly affect the two other dependent variables. This suggests that holding all else constant, perhaps those who have reliable personal transportation options (in the form of a driver’s license and decent access to an automobile) may see SAVs as a novelty that would be worth waiting a few minutes for, not necessarily paying a lot of money for. Foreign born individuals and respondents who live with at least one child under 17 years of age also exhibit longer maximum wait times and higher payments, but membership in those groups is not significantly associated with general SAV comfort level. It is plausible that people with children value the convenience of travel associated with SAV technology and thus are more willing to wait longer and pay higher amounts for a trip. The next section explores potential explanations for some of these findings by examining differences in preferences for certain possible features of a hypothetical SAV, gauged by the conjoint section of the survey instrument.
SAV Design Consideration Analysis
We now examine preferences for SAV technology features, drawing data from the survey’s conjoint segment. To analyze the results of the conjoint survey segment of the online survey instrument, we run logistic regressions of the probability a collection of features was selected on indicators of the presence of each feature, omitting the baseline feature from each category. Thus, models capture the marginal effect of a given feature’s presence on the likelihood a collection is selected, specifically relative to the presence of the baseline feature within the relevant category.
Table 4 lists the details of the main model run on the full sample and separate models run for men and women separately. For the full model, most features significantly affect whether a collection of features is selected. The presence of more flexible options for payment and booking in a collection increase its likelihood of selection. Compared with the “no additional storage space” option, the bag storage space option increases the odds of selection by about 35% and the bike storage space option increases the odds of selection by 64%. By contrast, the presence of the stroller storage space option in a feature collection has no effect on selection. The presence of each security measure option approximately doubles a given collection’s chance of selection compared with a collection that included no security measure. On average, participants valued ample sitting room over limited sitting room and preferred to face forward rather than to face each other. For extra amenities, the presence of power outlets and free Wi-Fi increased a collection’s selection odds by about 50% and 97%, respectively. Partitioning the sample by gender shows notable difference in preferences between men and women. First, men do not exhibit any significant preferences for payment and booking flexibility, with women driving the effect found among the full sample. Although neither gender exhibits a significant preference for stroller storage, women’s preferences for bag storage and bike storage were slightly higher than those of men. Stark differences occur for security preference, with the options for camera security and attendant security increasing women’s likelihood to select a given collection by 130% and 140%, respectively. By contrast, those same features increased men’s likelihood to select a bucket by only 68% and 52%, suggesting that women value security measures more than men. Women exhibit slightly more distaste toward facing each other than men and slightly more of a preference for ample seating room. Finally, although the presence of power outlets in a collection increases selection odds by about 92% for women, it only increases men’s selection odds by about 25%. Although on-vehicle free Wi-Fi is strongly valued by both genders, women exhibit slightly higher preference for it.
Conjoint Analysis by Gender
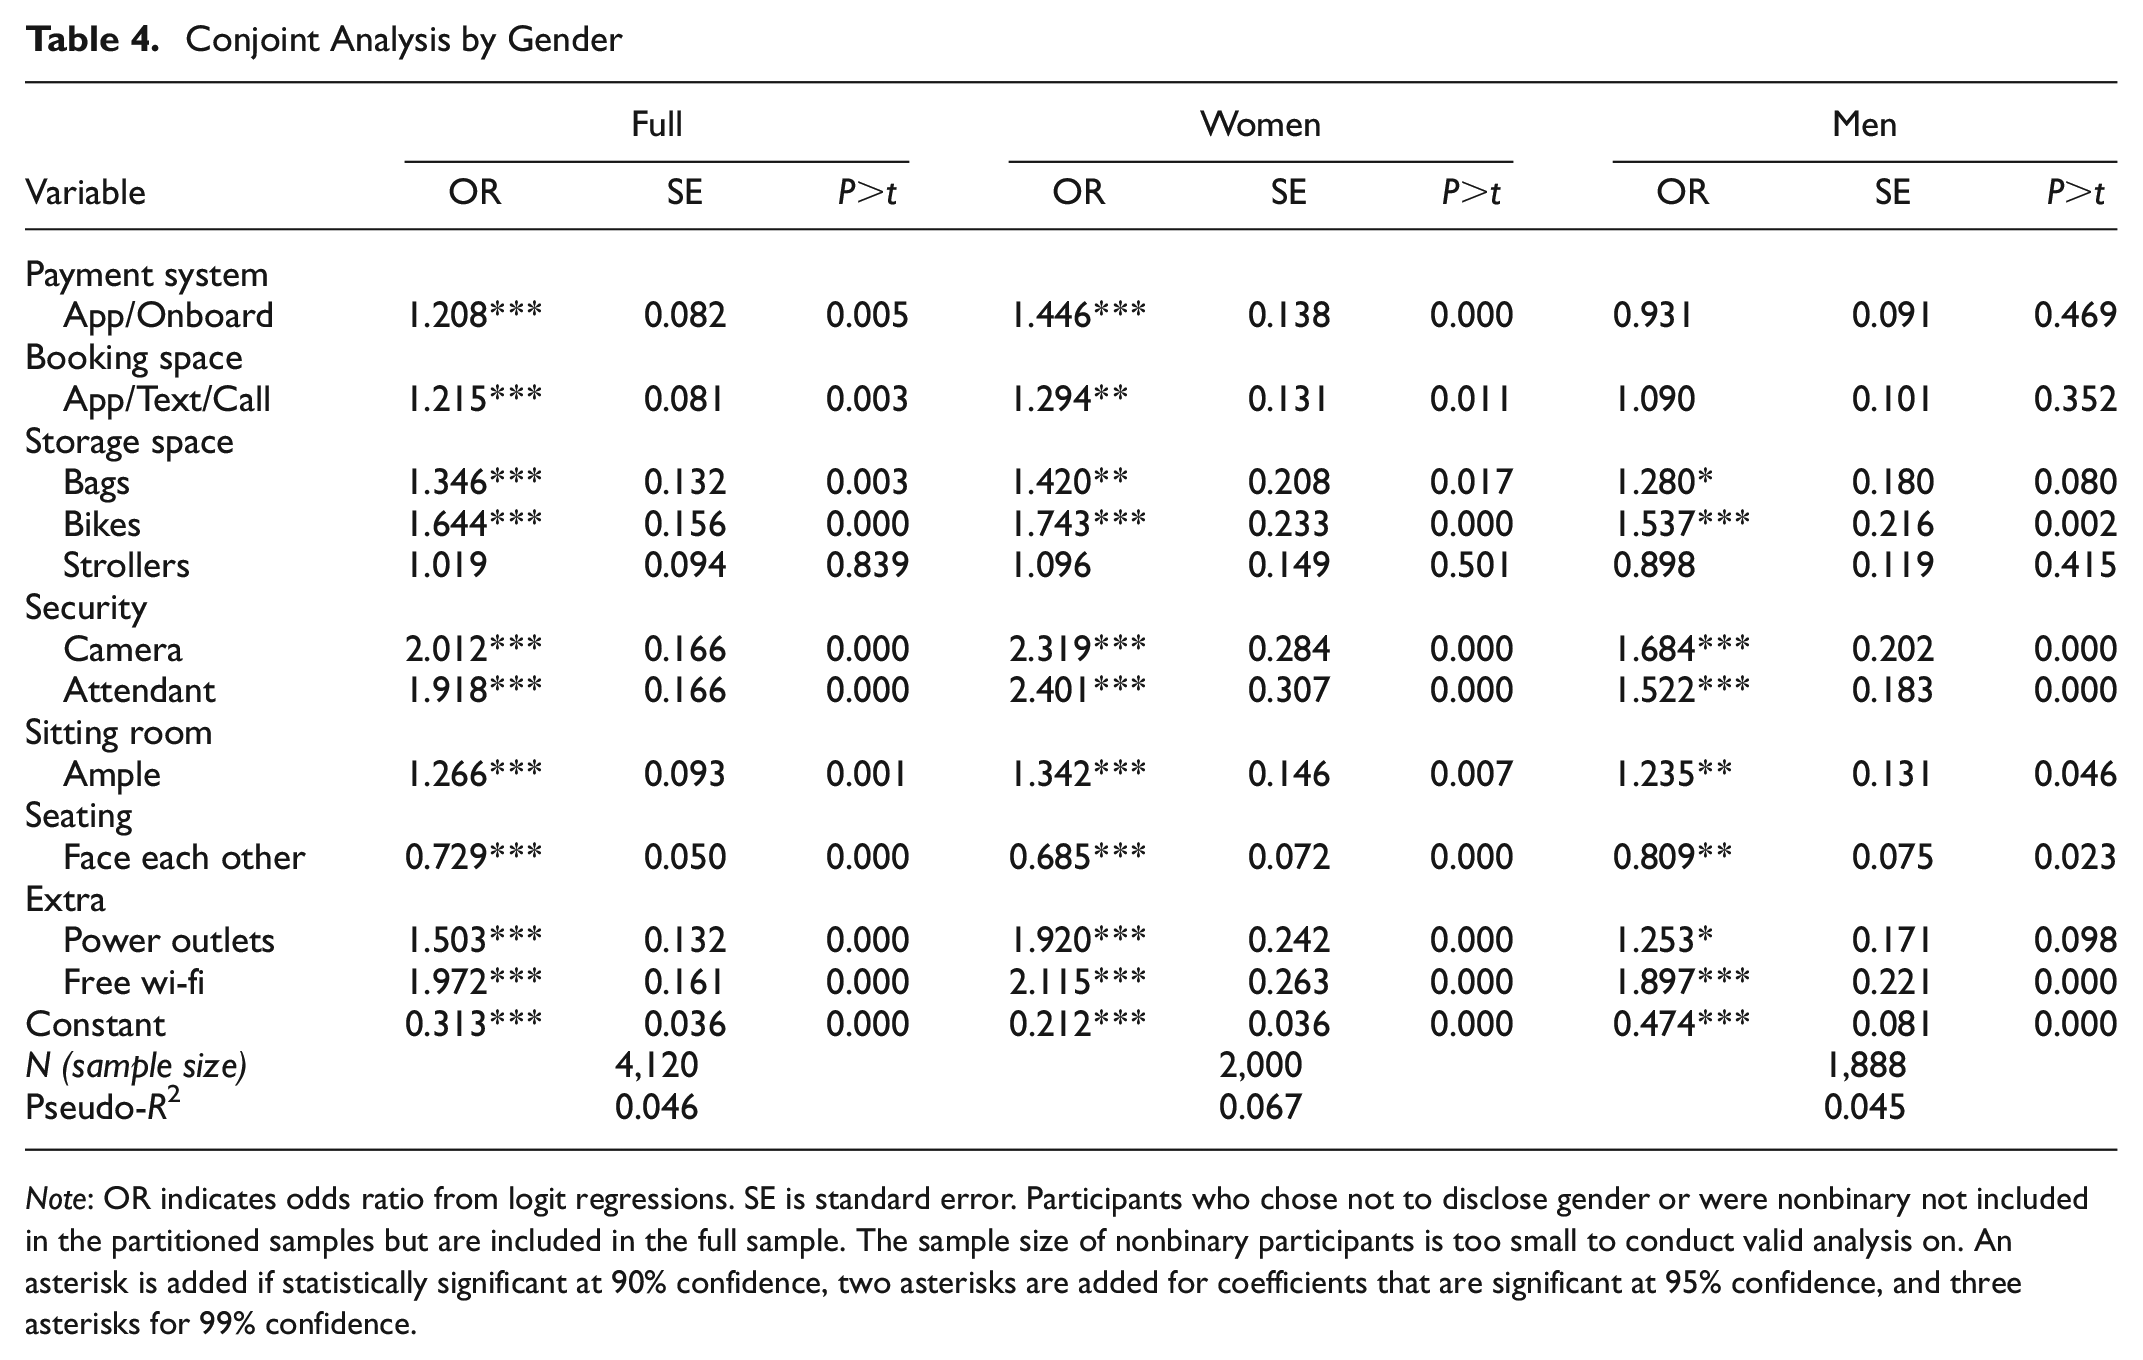
Note: OR indicates odds ratio from logit regressions. SE is standard error. Participants who chose not to disclose gender or were nonbinary not included in the partitioned samples but are included in the full sample. The sample size of nonbinary participants is too small to conduct valid analysis on. An asterisk is added if statistically significant at 90% confidence, two asterisks are added for coefficients that are significant at 95% confidence, and three asterisks for 99% confidence.
The next set of models splits up the sample by race, with results listed in Table 5. Most of the effects estimated in the full sample regressions are driven by White respondents. In fact, the magnitude of the effect on selection associated with each feature’s presence in a collection is higher for white participants than for participants of color (defined here as Nonwhite and/or Hispanic participants). Although for some features such as free Wi-Fi, the difference in effect magnitude between participants of color and White participants is very slight, for other features such as the presence of power outlets or an attendant, presence increases selection odds substantially more for White respondents than for others. Further, people of color do not exhibit any preferences across payment or booking systems, not for ample seating while White respondents do. When Black and/or Hispanic participants are further partitioned, even fewer features significantly affect selection at 95% confidence. The presence of an attendant, forward facing seating, and power outlets do not affect collection selection for Black and/or Hispanic participants.
Conjoint Analysis by Race/Ethnicity
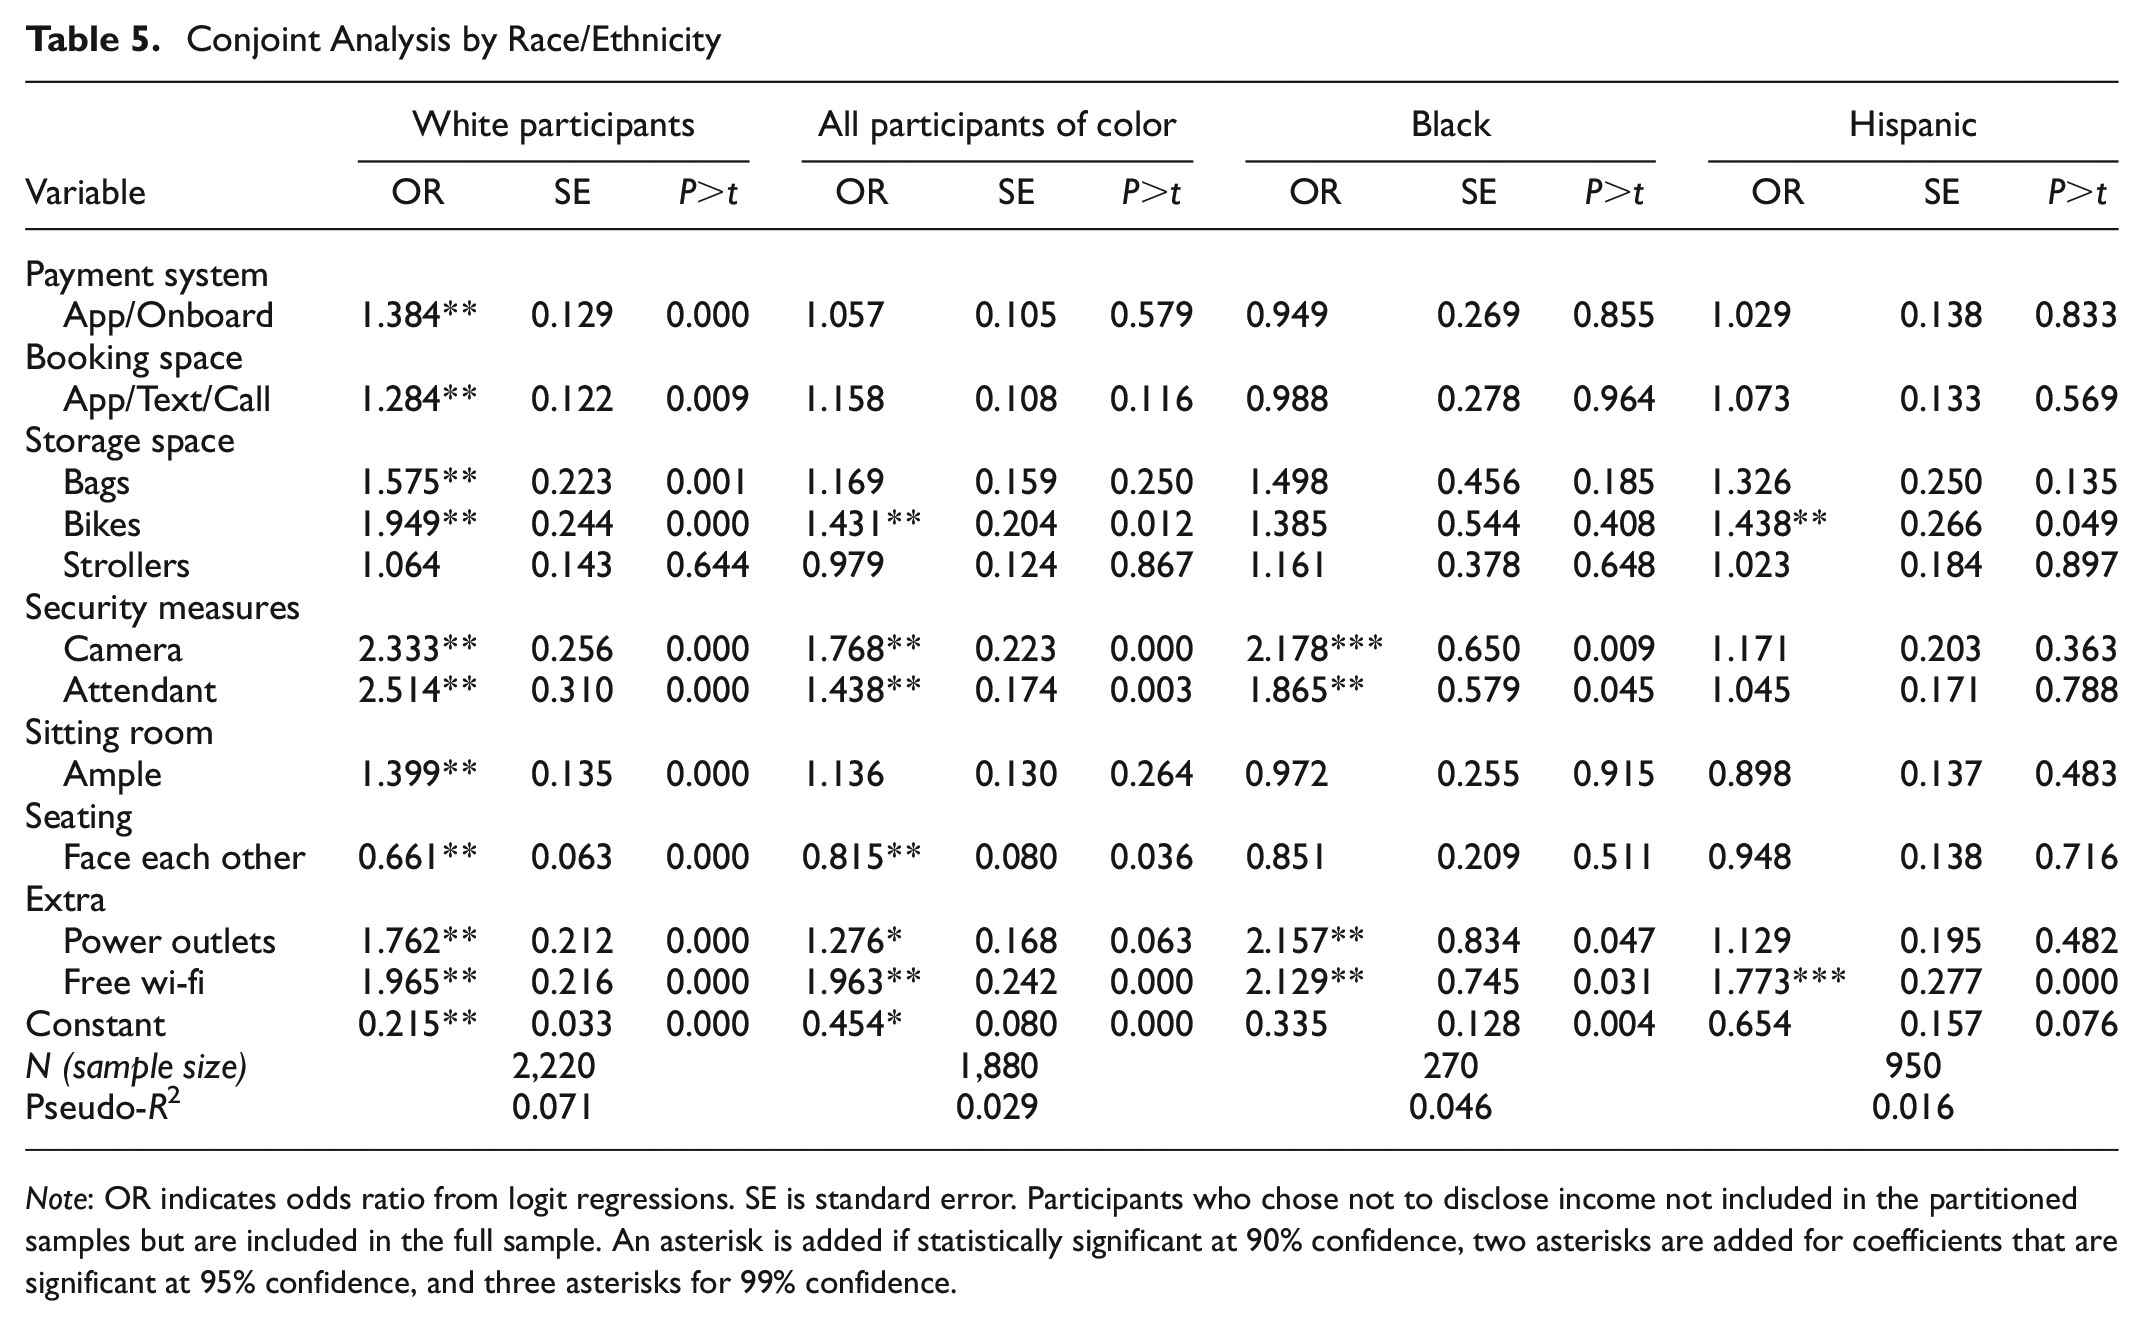
Note: OR indicates odds ratio from logit regressions. SE is standard error. Participants who chose not to disclose income not included in the partitioned samples but are included in the full sample. An asterisk is added if statistically significant at 90% confidence, two asterisks are added for coefficients that are significant at 95% confidence, and three asterisks for 99% confidence.
Next, we partition the sample by health status, as listed in Table 6. Unhealthy participants include those who reported poor or fair health in the survey. The presence of flexible booking, bicycle space, security cameras, and ample sitting room (compared with their respective baseline features) increase the likelihood of selection more for unhealthy participants than for healthy participants. By contrast, the inclusion of flexible payment system, security attendant, and both extra amenities increase the odds of selection more for healthy participants than for unhealthy participants
Conjoint Analysis by Health Status

Note: OR indicates odds ratio from logit regressions. SE is standard error. Participants who chose not to disclose income not included in the partitioned samples but are included in the full sample. An asterisk is added if statistically significant at 90% confidence, two asterisks are added for coefficients that are significant at 95% confidence, and three asterisks for 99% confidence.
Table 7 lists conjoint analysis results partitioned by income. Low-income participants value payment and booking flexibility slightly more than middle-income participants, although high-income participants value payment flexibility about the same as low-income participants, while not exhibiting significant preference across booking options. Preference for bag space is positively correlated with income, and although preference for bike space is similar between low- and middle-income participants, high-income participants exhibit more preference than their lower-income counterparts. Preferences for security features are consistent across income brackets, with low-income participants exhibiting slightly more preference for an attendant and lower preference for cameras than high-income and middle-income participants. Preference for ample seating room is also positively correlated with income, although preferences are similar between low-income and middle-income participants. For extra amenities, although preferences are consistent across income brackets, there is a slight positive income correlation in preference for power outlets and a slight negative income correlation in preference for free Wi-Fi. Preference for forward facing seating is notably consistent in all income groups.
Conjoint Analysis by Income
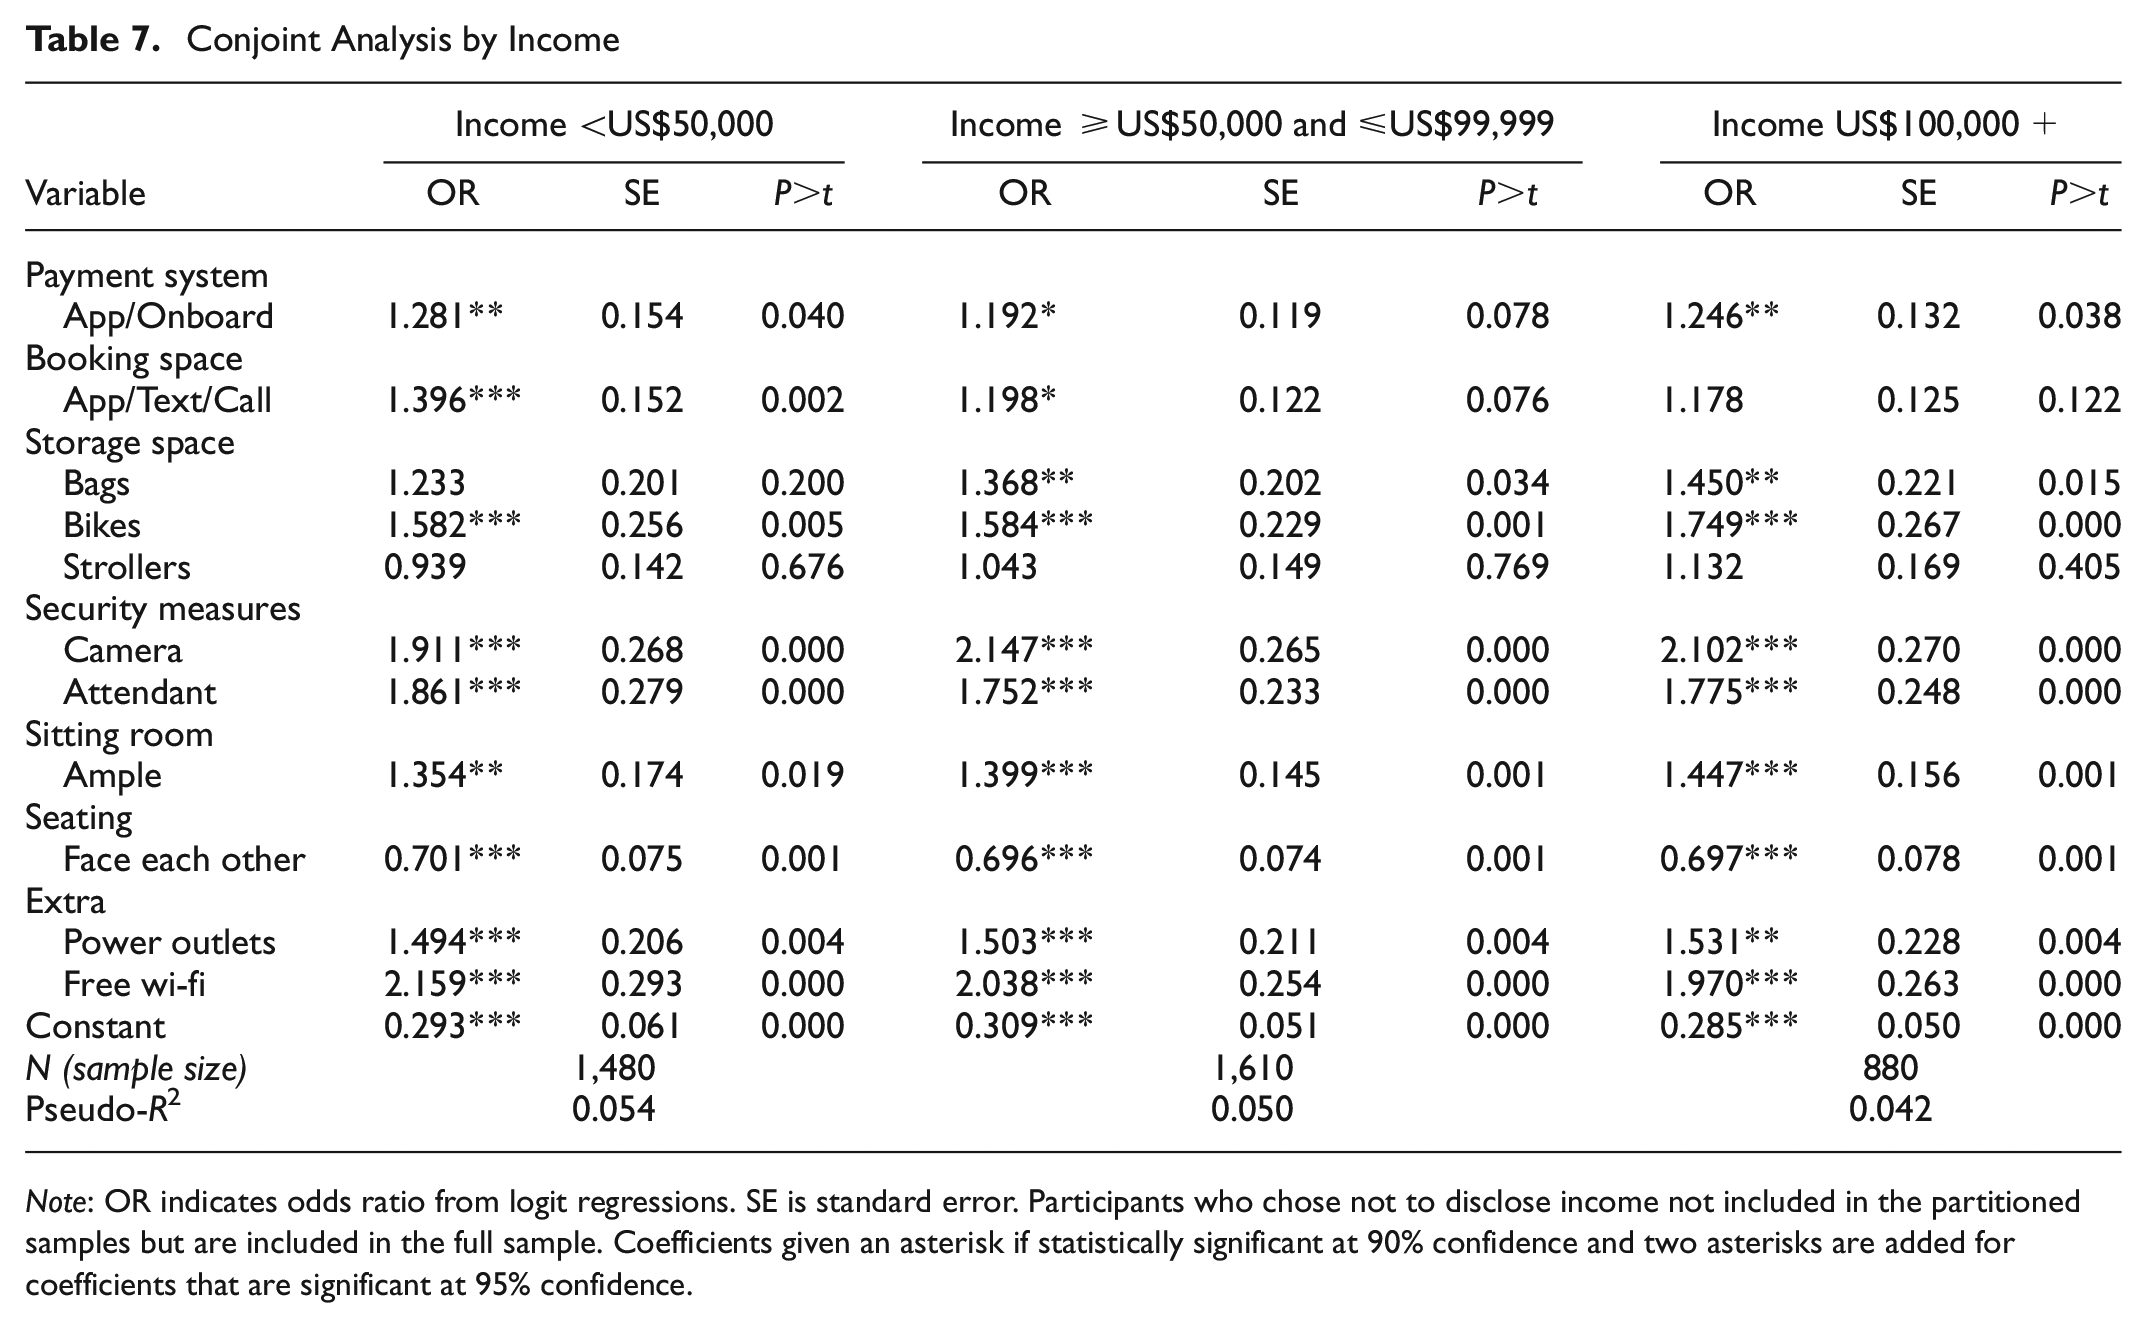
Note: OR indicates odds ratio from logit regressions. SE is standard error. Participants who chose not to disclose income not included in the partitioned samples but are included in the full sample. Coefficients given an asterisk if statistically significant at 90% confidence and two asterisks are added for coefficients that are significant at 95% confidence.
Discussion
Analysis of data from both portions of the survey provides several important and related takeaways. First, women exhibit notably less comfort with SAV technology, compared with men. Results from conjoint analysis offer some potential explanations for this gendered comfort gap. For nearly all categories of features in the conjoint questions, women exhibited less indifference between alternatives and the baseline option. Women especially exhibited higher preference for both security measure options compared with men. This finding aligns with research on women’s overall safety experiences on public transportation ( 27 ). The technology initially shown in the video did not noticeably feature any security measures, which could have contributed to female participants’ overall reduced comfort with the technology.
By contrast, Black and Hispanic participants did not significantly differ from other racial/ethnic groups in their general comfort with SAV technology. However, they were willing to pay more, potentially reflecting a higher economic valuation of SAV technology because of its possible transport comfort and efficiency advantages, compared with currently existing modes. This is notable given established gaps in Black and Hispanic automobile ownership associated with the United States’ historical development of automobile infrastructure for White suburban dwellers, resulting in poorer transportation connectivity in Black and Hispanic neighborhoods ( 25 ). Black and Hispanic participants, as well as other participants of color, demonstrated higher levels of indifference between possible SAV system features, suggesting that the overall transportation ease benefits of SAV may dominate other features when it comes to ultimate preferences and assessments of the technology. These results ultimately suggest that participant race is correlated not with general comfort with SAV technology, but with potential utility drawn from a potential SAV service.
Notably, unhealthy participants revealed higher preference for the flexible booking system (compared with the app-only option) and for ample sitting room than their healthy counterparts. This suggests that although health does not necessarily affect willingness to adopt, public health policy must advise the features included in a final SAV system. Further, wealthier individuals exhibited a higher WTP for a given SAV trip, which makes sense given their higher financial ability. While there were a few income differences in preferences, people with incomes under US$50,000 exhibited more indifference toward all features but free Wi-Fi and security attendants than their middle-income counterparts, suggesting that feature flexibility may appeal more to middle-income or high-income participants. However, it is important to note that low-income individuals exhibited significant preferences regardless in many cases. Finally, the extent to which people experienced travel hassles affected WTP for an SAV trip but not the other two willingness-to-adopt measures.
Conclusion
Transportation researchers have called for an equitable implementation of autonomous vehicle technology. It benefits AV proponents to develop an equitable process because much of the hailed positive externalities of AV systems will only be realized with widespread use ( 6 ). In addition, AV systems could render transportation systems more economically and racially equitable by increasing mobility, reducing air pollution from vehicle emissions, lowering transportation costs, and increasing safety particularly for pedestrians and bike users ( 4 , 7 , 8 , 10 ).
An equitable SAV rollout would mean that public administrators and planners account for gendered, racial, health-related, and economic differences in both general attitudes toward SAV and specific design considerations ( 31 ). This research provides several important findings that can aid the design and rollout of future public SAV systems. First, it provides further evidence that SAV technology can feasibly serve the purpose of reducing transportation inaccessibility, especially for Black and Hispanic people. The indifference exhibited in conjoint analysis by people with high transportation hassle ratios and by Black and Hispanic people should not necessarily indicate that onboard features are irrelevant to these groups of people, but that overall efficiency gains are more important. To ensure gender equity in willingness to adopt this new technology, it will be important for public providers to ensure adequate onboard security and flexibility in payment and booking.
Footnotes
Acknowledgements
We would like to acknowledge Leoma Van Dort and Galen Ryan for assistance preparing the literature review, Travis Ormsby and Shannon Crabtree for assistance constructing and coding the survey instrument, and Frank Douma and Zhi-Li Zhang for help and general feedback with analysis.
Author Contributions
The authors confirm contribution to the paper as follows: study conception and design: Fan, Wexler; data collection: Wexler, Fan; analysis and interpretation of results: Wexler, Fan; draft manuscript preparation: Wexler, Fan. All authors reviewed the results and approved the final version of the manuscript.
Declaration of Conflicting Interests
The author(s) declared no potential conflicts of interest with respect to the research, authorship, and/or publication of this article.
Funding
The author(s) disclosed receipt of the following financial support for the research, authorship, and/or publication of this article: The research in this paper is funded by the National Science Foundation’s Smart and Connected Communities (NSF S&CC) program. The NSF S&CC award (#1831140) is entitled Leveraging Autonomous Shared Vehicles for Greater Community Health, Equity, Livability, and Prosperity (HELP). In addition, the Center for Transportation Studies at the University of Minnesota provided in-kind support for the research in the paper.