
Abstract
In Minnesota, pavements are considered to be in poor condition when the ride quality index (RQI) is less than or equal to 2.0. However, because there are pavement sections that have remained in poor condition for multiple years, it is not clear whether RQI accurately quantifies the “true” condition of certain sections. In this study, sections that had maintained a poor RQI over time were identified in each district and extensive additional information was obtained from interviews with district engineers and planners. The analysis of the additional information showed that most pavement sections that had remained in poor condition for extended periods were not in poor condition. They represent “anomalies” with unique characteristics, and new parameters must be established to quantify the true condition of these sections.
Keywords
Each state department of transportation (DOT) is responsible for a vast network of roads, bridges, and other assets. State DOTs are fairly autonomous from a national perspective, and they have each developed their own methods of pavement management. However, this poses a problem for the Federal Highway Administration (FHWA), which wants to ensure that federally-owned and -aided roads are kept to an acceptable level of service. Over the last two decades, a series of federal funding acts have enacted rules to standardize state DOT pavement management practices (1, 2). The Moving Ahead for Progress in the 21st Century (MAP-21) Act required each state to establish a risk- and performance-based asset management plan for their national highway system (NHS) pavements and bridges ( 3 ). This mandate triggered the beginning of a multiyear transportation asset management plan (TAMP) development and implementation process. This process culminated with the submittal of a final TAMP by each state DOT in the summer of 2019. The call for TAMPs asked each state DOT to detail their pavement management procedures and to develop a method to annually track, monitor, and identify road segments that have been in poor condition for an extended period and to consistently consider them while programming.
Minnesota Department of Transportation (MnDOT) has several pavement sections in their system that have been in poor condition for an extended period. As part of the preparation efforts for TAMP, an important set of questions emerged: why have these pavements been allowed to stay in poor condition for multiple years, and do they share certain attributes that would make it difficult to evaluate their true condition using the current pavement condition indices? One of the most important aspects of pavement management is the ability to accurately measure and represent the condition of the pavement network. Most agencies rely on measures of pavement condition that are based on roughness of ride. MnDOT uses the ride quality index (RQI) for their performance measures and targets. A separate set of measures are used for the required federal targets. RQI is directly calculated from the international roughness index (IRI) measurements collected on MnDOT’s pavement network each year. A section is labeled “in poor condition” when its RQI falls below 2.0. Although RQI is an effective measure on a systemwide scale, the existence of pavements that have stayed in poor condition for long periods (over 10 years in some cases) makes it unclear whether RQI or other roughness-based metrics accurately quantify the “true” condition of certain pavement sections.
To make that determination, those sections were identified, and additional information, not directly related to RQI, was obtained for them. Through a study of the pavement management practices of and communication with several state DOTs, it was determined that personnel from the MnDOT district offices would be able to provide valuable insights into why these sections were allowed to stay in poor condition for an extended period.
Literature Review
Each state’s TAMP must detail their pavement condition data collection, life-cycle planning process, and process for determining funding allocations. This makes TAMP a good resource for learning about each state’s pavement management methods. TAMPs typically include methods related to NHS pavements and bridges. States may also include the methods they use for their state trunk highway systems. The presented methods are the best-practice methods followed by each state.
The pavement management process begins with the collection of pavement condition data. Each state is responsible for annually collecting these data on its NHS roads in 0.1-mi increments. States typically collect condition data on their state highway system every 1 to 2 years. FHWA performance metrics require the collection of data that identify roughness, visual distresses, rutting (for flexible pavements), and faulting (for rigid pavements). Some states (including Minnesota) choose to perform more extensive data collection for the calculation of their own performance metrics. Data collection is performed using survey vans equipped with automated data collection instruments including digital cameras, accelerometers, and 3D laser systems. Once collected, the data are processed to produce the required condition metrics.
FHWA has a set of five standard performance metrics that must be reported for all NHS pavement sections. These metrics are IRI, present serviceability rating (PSR), cracking percent, rutting (for flexible pavements), and faulting (for rigid pavements). PSR is only applied to roads that have a posted speed limit of less than 40 mph for which accurate IRI data are not obtainable ( 4 ). The thresholds for FHWA metrics can be found in Table 1. To be considered in “good” condition, all metrics must rate in the good range. To be considered in “poor” condition, at least two metrics must rate in the poor range. All other combinations are considered to represent a “fair” condition.
Federal Highway Administration Performance Metric Thresholds ( 5 )

Note
Several state DOTs have their own performance metrics to keep track of pavement condition. Some states consider their metrics and thresholds to be more accurate than the universal FHWA metrics and Thresholds in describing the condition of their network. Most DOTs use an overall condition metric that makes the comparison between pavement sections easier. These metrics are a combination of weighted submetrics. Of the 20 reviewed states, 14 use an overall pavement condition metric. Most other states rely on a metric based on a single data type to indicate pavement condition. These states typically use a ride quality metric. As mentioned, Minnesota is included in this group.
As required by federal law, each state uses some kind of risk-based pavement management system (PMS) software ( 3 ). PMS software can take inputs related to a pavement network, analyze the network, and provide recommendations for treatment strategies. The key piece in this process is the model used by the PMS software to predict future pavement condition given the historic conditions and future funding availability. State DOTs develop models that accurately reflect the degradation of their pavement network and plug these models into their PMS software.
Once DOTs have determined the current condition of their system, and have produced treatment recommendations through their PMS software, they must program their annual maintenance and rehabilitation (M&R) schedule. Before this, DOTs typically set up a funding framework to determine what projects to fund in the near and distant future. This framework is made up of long- and short-term funding plans. Almost every state has a 4- to 5- year statewide transportation improvement plan (STIP). STIPs are fiscally constrained by year and include financial information for the projects and project phases that are to be implemented using current and projected revenues ( 6 ). FHWA requires states to provide 10-year funding projections, so many states also develop a 10-year STIP. Once the funding framework has been put in place, programming can commence. The typical programming process begins with the DOT pavement management office sending the PMS-produced treatment recommendations to their district offices. Districts consult with local agencies and parties to form a prioritized list of M&R projects. This list is sent back to the pavement management office, where a complete list of projects is compiled and sent to a finance committee for approval.
State DOT Survey
Although reviewing the best-practice methods presented in the TAMPs is useful, it will ultimately leave out the practices used for some of the most underserved pavements in a state’s system. Because of this, a survey was developed to inquire about the handling of pavements that have remained in poor condition for extended periods by state DOTs around the country. This survey asked state DOT representatives to describe their annual M&R programming process and to confirm whether they have methods in place to annually track, monitor, and identify road sections in poor condition. Representatives from 20 state DOTs responded to the survey. Respondents varied in job titles, from maintenance engineers to research coordinators and executive managers. All respondents had in-depth knowledge of their department’s pavement asset management and programming operations.
The consensus from the responses received was that none of the states have specific mechanisms in place for dealing with pavement sections that have been in poor condition for multiple years. Pavement condition and other factors take priority over the amount of time in poor condition. Most respondents stated that either all poor condition pavements are treated the same by their PMS, or their programming prioritization process is set up so that pavement sections of this type are not numerous enough to be relevant on a policy scale. Another consensus was that the district offices typically play a large role in the programming process as they are the most knowledgeable about their roads. They are heavily involved in both the short- and long-term budgeting and programming processes. They would have the best idea as to why certain sections are allowed to stay in poor condition for multiple years.
Poor Section Identification
The pavement sections in MnDOT’s system that had been in poor condition for multiple years during the period 2000 to 2018 were identified using pavement condition data obtained from MnDOT’s multifaceted PMS software, Highway Performance Management Application (HPMA). HPMA has condition data from before 2000, but this investigation was limited to post-2000 data for simplicity and accuracy assurance. Data were gathered for 15,925 pavement sections from unique route directions totaling 14,308.8 road miles. A unique route direction is a unique combination of route type, route number, auxiliary identifier, and collection direction (e.g., IS-35E-D, US-952A-I). Not every route direction has an auxiliary identifier. The collection direction identifier allows for the separation of data on the same stretch of road for divided highways, meaning data are collected and can be analyzed individually for the decreasing (“D”) and increasing (“I”) directions. Data are only collected in one direction for undivided (“U”) highways.
The raw data from HPMA were transformed into an easily accessible pavement condition database. This database included information about each section that could factor in prolonged poor condition including a timeline of M&R activities, annual average daily traffic (AADT), and pavement condition parameters. These parameters included RQI, surface rating (SR), pavement quality index, and IRI. Another database was created with the pavement sections that had at least one poor year (RQI ≤ 2.0) from 2000 to 2018. This database contained additional information about the circumstances of each section’s poor condition such as the most recent poor year and highest number of consecutive years in poor condition. For those sections that were still in poor condition as of 2018, the number of years they had been in poor condition was calculated and the longest-lasting poor sections were found.
Interviews With District Engineers and Planners
To obtain additional information about the long-lasting poor sections found in HPMA, interviews were scheduled and conducted via Zoom with each district. Before the date of the interview, the district personnel were sent a notable poor section summary for their district. The notable poor section summary was a table of the worst sections in the district in relation to the number of years the section had been in poor condition as of 2018. The table included relevant information about the sections, such as section length, AADT, surrounding poor length, and activities performed since the section went poor. During the interviews, the research team and district personnel discussed possible trends in the notable poor sections and how those trends fitted in with the findings of other districts. Factors that could influence a district’s decision to defer M&R activities, including lack of funding, road jurisdiction, traffic levels, or the economic significance of the road, were also discussed.
The consensus that emerged at the end of the interviews was that most sections that have remained in poor condition for long periods have unique characteristics that significantly affect how these pavements are rated and repaired. These characteristics render the sections “anomalies” when compared with the population of sections and typically cannot be accurately reflected through RQI or other available roughness metrics. These anomalous characteristics tend to fit into one of two categories. Either they inflate the roughness of the road to a level that affects the RQI and exaggerates the deterioration of the road, or they force districts to postpone treatment. The former category includes “urban sections,” sections that contain railroad crossings, and sections that contain bridge transitions. The latter category includes “turnback” sections and sections that are short and not surrounded by other poor pavements.
Urban sections are located in areas with manholes, sewer grates, or shifts in grade resulting from intersections. These features will increase the roughness (i.e., RQI) of the road even though they do not indicate poor pavement structure or condition. Because these pavements do not require any maintenance, no action is taken, and they are allowed to remain in “poor” condition for years on end. District personnel even gave examples of urban sections that were labeled in poor condition owing to their RQI the year after a major rehabilitation. The urban section was the most commonly discussed anomaly throughout the interviews. Nearly every district identified some sections in their notable section summary as urban sections. For one district, 11 out of the 13 sections in their summary were identified as urban. As mentioned, sections that contain railroad crossings or bridge transitions experience the same phenomenon: they are labeled in poor condition because of the inherent rough ride caused by those features and not necessarily owing to structural issues. District personnel will often use other metrics, like the SR parameter or visual inspection, to gain a better understanding of the actual condition of the pavement in these sections.
“Turnbacks” are sections that the state DOT wants to “turn back” to local jurisdiction, typically a county. These roads are generally low traffic, serve one community, and are not a high priority for repair. Districts that discussed this anomaly said that the municipality taking over the section wants the road to be in very good condition. Districts will defer treatment for these sections until they are in poor enough condition to warrant a reconstruction, after which the turnback will take place.
Identifying Urban Section Parameters
It is clear that the condition of urban sections cannot be measured the same way as other pavement sections. The best course of action would therefore be to identify these urban sections (and similar anomalies such as railroad crossings or bridge transitions) and use different standards for pavement condition. To achieve this, a standard definition for what makes a pavement section “urban” must be established. Although each district mentioned the concept of urban sections, there was no consensus on what makes a pavement section “urban.” Some districts considered each section individually whereas others had more concrete rules. For example, District 4 classified each section as urban or nonurban based on a series of factors including speed limit, utilities, number of crossroads, and the existence of curbing or sidewalks along the highway.
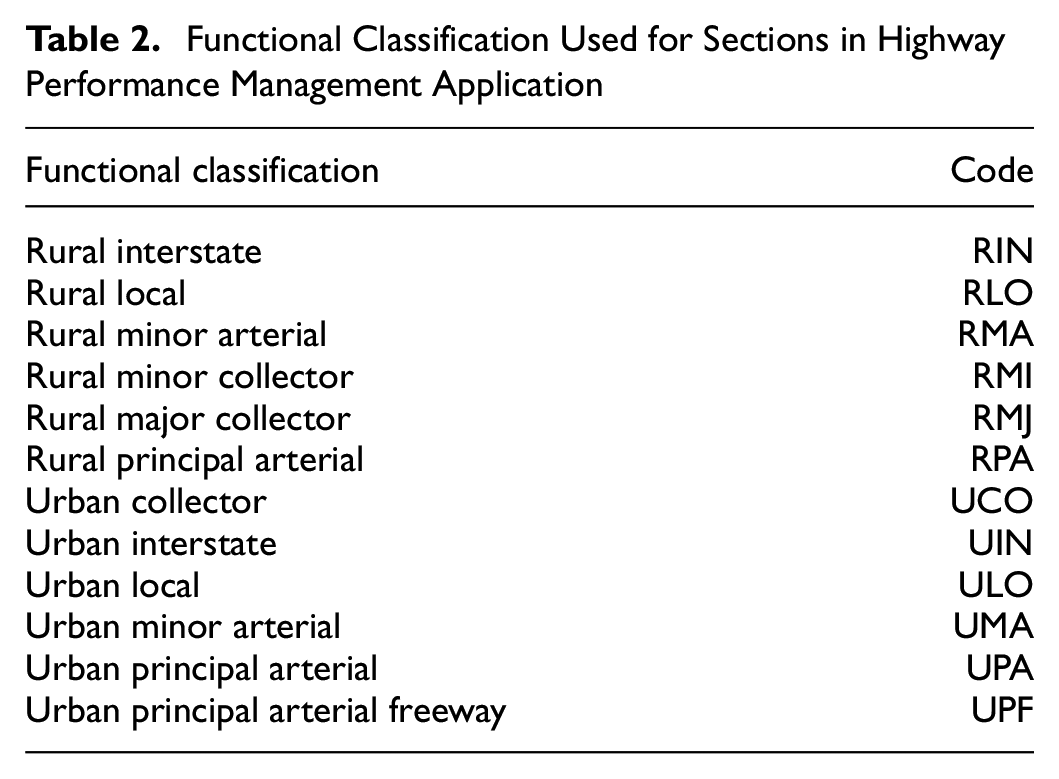
The HPMA database contains several parameters for each section that align with the general rules given by the districts for what makes a section urban. Three of the most promising parameters for identifying urban sections are “drainage type,”“city code,” and “functional classification.” Several districts mentioned that they base the urban distinction on the structural design of the section, specifically whether it has curb and gutter facilities (C&G). Drainage type identifies sections that have C&G. City code indicates whether a section is within a city or not. Functional classifications include urban major arterial (UMA), urban principal arterial (UPA), rural interstate (RIN), and others. These classifications make a clear distinction between urban and rural roads and are useful in identifying urban sections. A full list of the functional classifications used in HPMA can be found in Table 2.
Functional Classification Used for Sections in Highway Performance Management Application
To identify which parameter values (e.g., C&G, city code, functional classification) would best identify urban sections, the research team calculated two values for each of them: the “poor condition proportion ratio” (PCPR) and the “poor SR length proportion ratio” (PSLPR).
Poor Condition Proportion Ratio
Most of the longest-lasting poor sections were identified by district personnel as being “urban.” Therefore, it can be assumed that parameter values that are more likely to appear in the longest-lasting poor sections could be used to identify urban sections. PCPR indicates how likely it is that a section with a certain parameter value will have been in poor condition for a given number of years between 2000 to 2018.
The first step in this analysis was to find the total length of sections in the system corresponding to each possible “total poor year” value (from 0 to 19). “Total poor year” is the number of years a section was in poor condition owing to RQI between 2000 to 2018. To better understand how PCPR is calculated, we present a hypothetical example in which, out of a system of 1,000 mi, there are 10 sections that have a total poor year value of 19. The combined length of these sections is 10 mi. The “length proportion” for these sections is found by dividing the total length of the sections by the total length of the system, which in this case is 10/1,000 = 0.01 = 1%. If we say that five of those 10 sections (total length of 5 mi) have C&G, and the total length of C&G sections in the system is 100 mi, the length proportion with respect to C&G type only can be calculated as 5/100 = 0.05 = 5%. The PCPR of the C&G parameter value is calculated by dividing its length proportion by the length proportion for the overall system (5% divided by 1%). For this example, the PCPR indicates that a C&G section is five times more likely to have 19 total poor years than a randomly selected section in the system.
Following the example shown above, equivalent calculations were performed for each combination of parameter value and total poor year value. The results of the PCPR calculations are shown in Table 3.
Poor Condition Proportion Ratios (PCPRs) for Each Combination of Parameter Value and Total Poor Year Value

Note
Poor SR Length Proportion Ratio
Several district personnel mentioned their use of the SR metric to assess the condition of urban sections. They found SR to align with their assessment of the pavement condition more closely in cases for which RQI would describe the section as being in poor condition. Therefore, it can be assumed that parameter values that are more likely to appear in sections that tend to have good SR scores during their poor RQI years could possibly be used to identify urban sections. PSLPR indicates how likely it is that a section with a certain parameter value will have a good SR value during a year that it has a poor RQI value.
Because MnDOT has no specific standard for what a good or poor SR value is, a poor SR threshold was established for this study. This was done by using trends in the RQI and SR value populations for the entire system for 2000 to 2018: 288,355 RQI measurements, and 173,693 SR measurements, respectively. Histograms were created using these data, as shown in Figures 1 and 2. Note that SR has a maximum rating of 4.0, whereas RQI has a maximum rating of 5.0.

Histogram of all measured surface rating values in the Highway Performance Management Application database from 2000 to 2018.
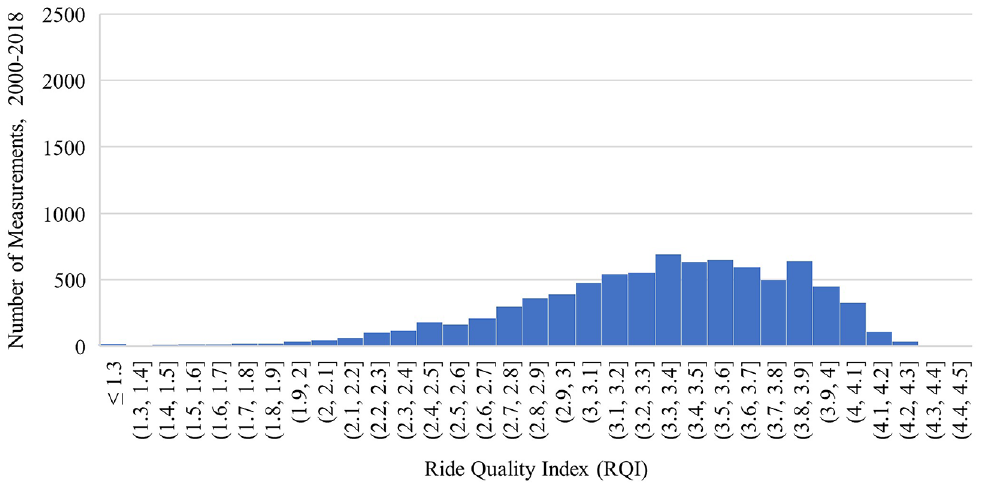
Histogram of all measured ride quality index (RQI) values in the Highway Performance Management Application database from 2000 to 2018.
The trends of the two data populations are different, therefore, the poor threshold value for RQI cannot be used as the poor threshold value for SR. A reasonable poor SR threshold should represent the same proportion of sections in the system as the poor RQI threshold. From the entire RQI dataset, the percentile of an RQI of 2.0 was ~3.4%. This means that only about 3.4% of the entire dataset was at, or below, an RQI of 2.0. From the entire SR dataset, the 3.4% percentile was found to be 1.9. Accordingly, 1.9 was used as the poor SR threshold for this analysis.
For each section that was in poor condition (RQI ≤ 2.0) for at least 1 year during 2000 to 2018, the median poor year RQI and SR values were calculated. For example, if a section was in poor condition in 2005 and 2010, the median poor year RQI for that section would be the median of its 2005 and 2010 RQI scores. Since SR data are typically gathered every other year, SR data were not available for all possible poor years.
The first step of this analysis was to find the total length of sections with at least one poor year from 2000 to 2018 for the system and each parameter value. This was the “total length of poor sections.” Since SR data were not available for all years, the “SR data length” was calculated as the total length of sections that had available SR data during at least one of their years in poor condition. Next, the “SR poor length” was calculated as the length of sections that had a median poor year SR of less than or equal to 1.9. Then, the “poor SR length proportion” was calculated by dividing the SR poor length by the SR data length. This value represents the proportion of pavements that have a poor SR value when they also have a poor RQI value. Finally, the PSLPR of each parameter value was calculated by dividing the poor SR length proportion for that parameter value by the poor SR length proportion of the entire system. A PSLPR < 1.0 indicates that it is more than likely that a section with that specific parameter value will have a good SR value when it has a poor RQI value. This would match the general description given by the district personnel of an urban section. The results of the PSLPR calculations can be found in Table 4.
Results of the Poor Surface Length Proportion Ratio (PSLPR) Calculations
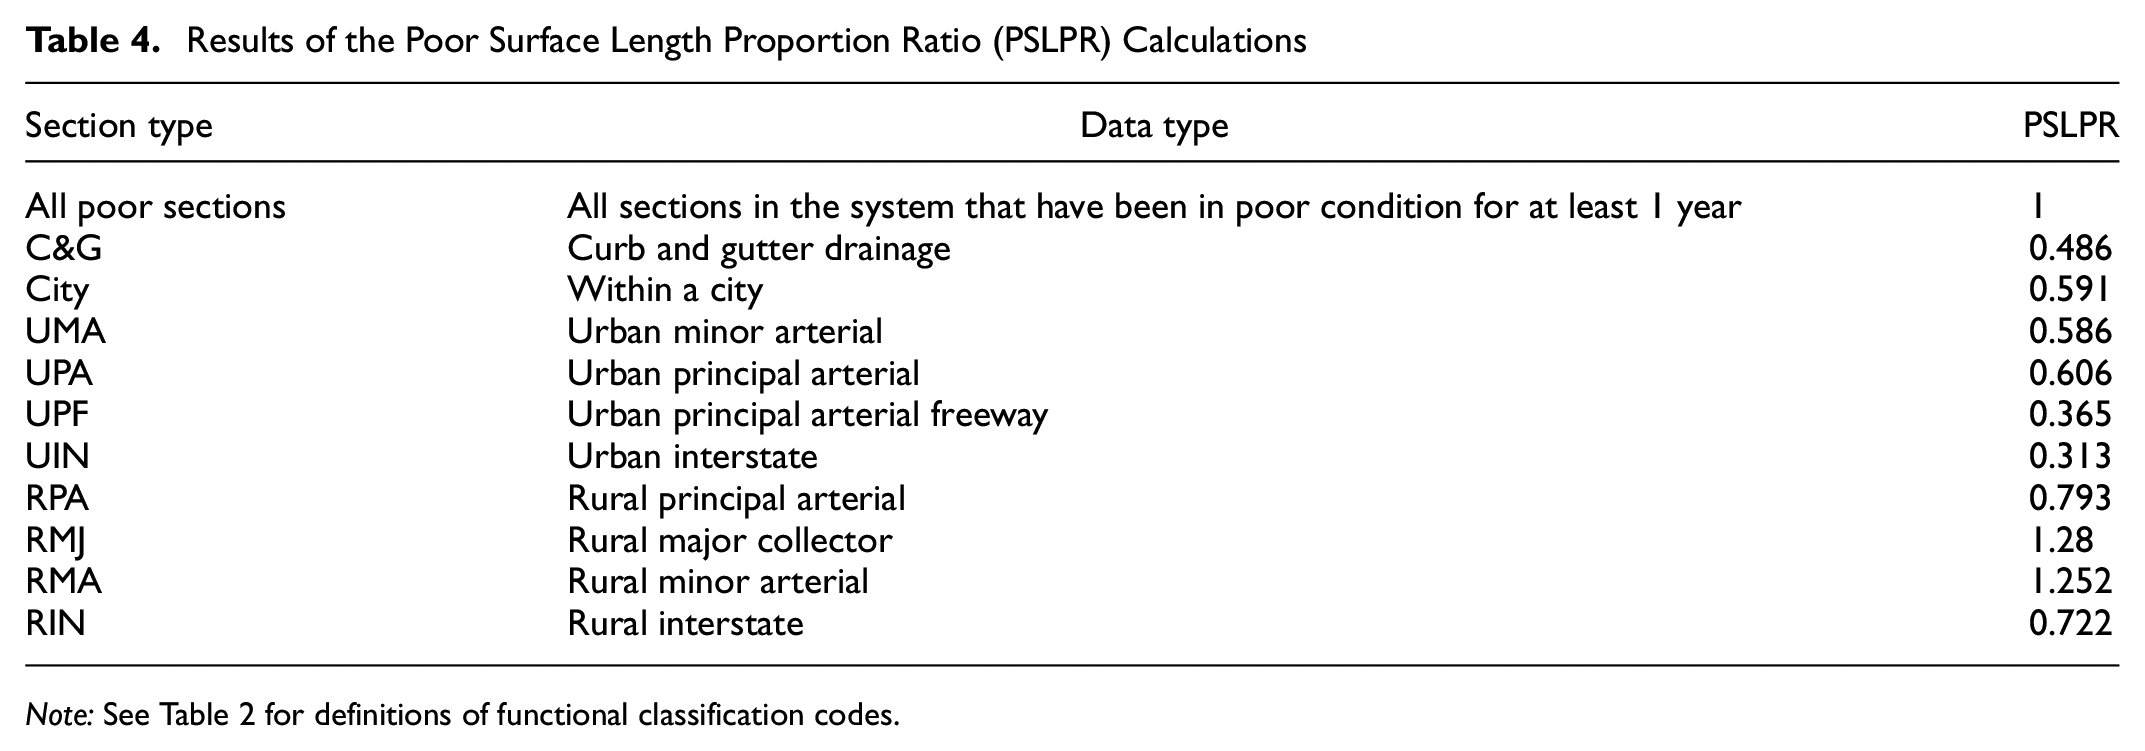
Note: See Table 2 for definitions of functional classification codes.
Discussion
The results of the PCPR calculations in Table 3 indicate that pavement sections with the C&G, City, UMA, and UPA parameters were most likely to be in poor condition most often during the 2000 to 2018 period. The district interviews resulted in the conclusion that most of the long-lasting poor sections were urban sections. Therefore, it can be assumed that sections with these parameter values (i.e., C&G, city, UMA, and UPA) best fit the “urban” classification.
The results of the PSLPR calculations in Table 4 show that the four abovementioned parameter values were on the lower end of the PSLPR spectrum whereas the rural functional classifications had the highest PSLPR values. The types of sections identified in the previous analysis as most likely to be “urban” (i.e., C&G, city, UMA, and UPA) were among the most likely to be in good condition according to the SR when they were in poor condition according to RQI. This is further evidence that these parameter values should be considered when creating a definitive description of an “urban” section.
The analysis performed in this investigation showed that most pavement sections that have remained in poor condition for extended periods represent “anomalies” with unique characteristics that are mostly responsible for their condition rating. For this reason, a uniform definition of these anomalies must be established by MnDOT, especially for the “urban” sections, as the current definition varies by district. Although self-reporting by district offices would be helpful, the establishment of a universal “urban” definition would allow these sections to be identified through means of data. Although the parameter values identified through the presented analysis (C&G, city, UMA, UPA) may prove useful in this definition, further work is needed to optimize this definition. It is possible that other parameters or data could be used, such as digital video taken of the roads by MnDOT’s Pathways survey vans. This video would capture many of the characteristics that qualify an urban section, including manholes, curb and gutter, intersections, stop lights, and stop signs. This video could also be used to identify bridge transitions and railroad crossings.
Once the anomalous sections are identified, a more realistic assessment of the condition of these sections needs to be performed. One option would be to develop a new RQI formula specifically calibrated for urban roads. This would require an additional study in which individuals are driven on these sections and asked to rate them based on ride comfort. The study could also include roundabouts, for which, owing to the geometry of the roundabout, the measurements are less accurate. Another option could be the development of a more robust SR-based pavement condition classification. Once the anomalous sections are identified and new condition parameters are developed, site-specific decision trees, based on the new trigger values (modified RQI, SR, etc.), can be developed for HPMA. This process can be replicated for state DOTs around the country that face the same issues with their roughness-based condition rating systems.
MnDOT district personnel have been already dealing with these anomalies during project programming each year. Most districts, in addition to the HPMA data, visually inspect the sections that need repair and make decisions accordingly. A better rating system has the potential of reducing the workload required to consider all of these additional characteristics and provide metrics that are better tailored to show the “true” condition of unique pavement sections. Such a tool would help planners and decision makers to make more informed decisions and, therefore, optimize the use of available funds.
Conclusions
Because of the presence of pavement sections that have remained in poor condition for an extended period, it was unclear whether MnDOT’s RQI roughness-based metric provides an accurate assessment of pavement conditions for these specific sections. Through a review of MnDOT’s available pavement condition data and consultation with local MnDOT district personnel, it was discovered that most MnDOT sections left in poor condition for an extended period feature “anomalous” characteristics that either inflate the RQI to a level that exaggerates the deterioration of the road (e.g., urban, bridge transitions, railroad crossings) or force districts to postpone treatment for other reasons (e.g., turnback, short and isolated). The most common anomaly was found to be “urban” sections that featured manholes, sewer grates, or shifts in grade owing to intersections. These features increase the roughness (i.e., RQI) of the road even though they do not indicate poor pavement structure or condition. Through further analysis of the pavement condition data, it was found that certain parameter values were able to indicate whether a section was more likely to be urban or not (i.e., C&G, city, UMA, UPA). These parameter values are disproportionately represented in the longest-poor sections in the system and are most likely to have a good SR when labeled poor by the RQI. These two matched the common description of urban sections by district personnel. However, a standard definition for what makes a section “urban” should be established. This definition, along with other “anomaly” identifiers, should be implemented in the PMS of state DOTs to represent pavement conditions more accurately and to produce better decision trees.
Footnotes
Acknowledgements
The research team gratefully acknowledges the Minnesota Department of Transportation for its financial support. The research team would also like to thank the MnDOT technical advisory panel members Deanna Belden, David Janisch, Heather Lukes, Mark Nelson, Joshua Pearson, and David Solsrud for their guidance in this effort. The research team also thank David Glyer, project coordinator, of MnDOT for the smooth running of all project activities. Special thanks go to David Solsrud of MnDOT for setting up the interviews with the districts and to the district engineers and planners who participated in the interviews. Thanks also go to Curt Turgeon of MnDOT for his advice and help during the interview process.
Author Contributions
The authors confirm their contribution to the paper as follows: study conception and design: T. Calhoon, S. McGrath, M. Marasteanu; data collection: T. Calhoon, M. Marasteanu; analysis and interpretation of results: T. Calhoon, M. Marasteanu; draft manuscript preparation: T. Calhoon, M. Marasteanu. All authors reviewed the results and approved the final version of the manuscript.
Declaration of Conflicting Interests
The authors declared no potential conflicts of interest with respect to the research, authorship, and/or publication of this article.
Funding
The authors disclosed receipt of the following financial support for the research, authorship, and/or publication of this article: Funding for this study was provided by the Minnesota Department of Transportation, under Work Order 114.
Data Accessibility Statement
The data that support the findings of this study were provided by the Minnesota Department of Transportation through their Highway Pavement Management Application. The corresponding author does not have permission to provide access to this tool.
The results and opinions presented do not necessarily reflect those of the sponsoring agencies.