



Abstract
Emerging micromobility services (e.g., e-scooters) have a great potential to enhance urban mobility but more knowledge on their usage patterns is needed. The General Bikeshare Feed Specification (GBFS) data are a possible source for examining micromobility trip patterns, but efforts are needed to infer trips from the GBFS data. Existing trip inference methods are usually based on the assumption that the vehicle identity (ID) of a micromobility option (e-scooter or e-bike) does not change, and so they cannot deal with data with vehicle IDs that change over time. This paper proposes a comprehensive package of algorithms to infer origin–destination (OD) pairs from GBFS data with static vehicle ID and unlinked trip origins and destinations from GBFS data with resetting and dynamic vehicle ID. The algorithms were implemented in Washington D.C. by analyzing one week (last week of February 2020) of GBFS data published by six vendors, and the inference accuracy of the proposed algorithms are evaluated by R-squared, mean absolute error, and sum absolute error. It is found that the R-squared measure is larger than 0.9 and the MAE measure is less than 2 when the algorithms are evaluated with a 400 m × 400 m grid. The absolute errors are relatively larger in the downtown area, and the inference error is relatively high during early morning and early nighttime. The accuracy of the trip inference algorithms is sufficiently high for most practical applications.
Keywords
In recent years, shared micromobility services have experienced explosive growth in urban areas ( 1 , 2 ). Micromobility refers to small, single-passenger transportation modes rented for short-term use, such as e-scooters, docked bikes, and dockless bikes. Among all the micromobility options, e-scooters are growing at the fastest pace, largely owing to their flexibility, convenience, affordability, and the fun factor. They are especially attractive to travelers for short-distance trips. Micromobility also offers a potential solution to the “first-mile/last-mile” problem (the problem of public transit being unable to get passengers to the doorstep of their destinations) that has long troubled public transit. On the other hand, some are concerned that micromobility will mainly replace active travel modes such as walking. Also, some micromobility vehicles are parked inappropriately (e.g., on the sidewalks), which inhibits other productive use of the curbside. Given the potential benefits and drawbacks that micromobility brings to urban mobility, great interest exists among transportation professionals for understanding the usage patterns of micromobility services.
Survey data and web-scraping data collected by public application programming interfaces (APIs) are the main data sources for researchers to analyze and understand micromobility. Survey data covers a variety of topics that cannot be gathered through API data: the characteristics of micromobility users, their perception of and willingness to use the services, and the modal shift from cars to micromobility, because it can provide the user information (e.g., age, gender, and education) that the web-scraped data does not have ( 3 – 6 ). Compared with survey data, web-scraped data usually has larger sample size and more detailed spatiotemporal information such as the latitude and longitude of trip origin and trip start time. Therefore, web-scraped data can complement the survey data to obtain a more comprehensive view of micromobility. As part of the micromobility permit requirement, cities often require micromobility providers to share data through APIs prescribed by standard formats, including the General Bikeshare Feed Specification (GBFS) and the Mobility Data Specification (MDS). GBFS was initially developed as the open data standard for bikeshare system availability in 2015, but now it is applicable for nearly all shared micromobility systems in the North America ( 7 ). GBFS APIs report real-time information about available vehicles, which typically includes vehicle location, vehicle type (bike or scooter), and battery level. Created by the Los Angeles Department of Transportation (LADOT) in 2018, MDS extends GBFS to require additional information from mobility providers. The additional information may include data on unavailable vehicles in the network, trip characteristics, and trip trajectories ( 8 ). However, the MDS has received limited adoption so far, and the MDS APIs are usually not made available to the public. Accordingly, this study focuses on GBFS.
Some recent studies have extracted trip information from the GBFS data to examine the spatiotemporal patterns of scooter usage ( 2 , 9 ). The trip inference method used in these studies usually assumes that GBFS APIs report Static Vehicle IDs, that is, the ID of a given micromobility device does not change over time. However, this assumption no longer holds for many circumstances because the GBFS data standards are updated frequently. For example, it is necessary to rotate vehicle IDs randomly after each rental in GBFS v2.0 to reduce the potential exposure of private data ( 10 ). To enhance rider privacy, many micromobility providers currently operate GBFS APIs that report Resetting Vehicle IDs (i.e., the vehicle ID will be randomly rotated once the vehicle is unlocked for a new trip) or Dynamic Vehicle IDs (i.e., the vehicle ID of a given scooter randomly changes every several minutes). The existing approach used for trip inference is not applicable for these new vehicle ID reporting mechanisms. In other words, new methods are needed to infer micromobility trips from the GBFS APIs that report Resetting Vehicle IDs and Dynamic Vehicle IDs.
To this end, this study develops a systematic approach to infer trip origins and destinations for all existing vehicle ID types contained in the GBFS data. Three metrics are used—R-squared (R2), mean absolute error (MAE), and sum absolute error (SAE)—to validate the inference accuracy of proposed algorithms. All proposed algorithms have an R-squared larger than 0.9 when scooter location data is aggregated to a 400 m × 400 m grid, which is sufficiently high for most practical purposes. The inferred e-scooter trip origins and destinations show usage patterns that are consistent with previous studies ( 2 , 11 ).
The contribution of this study is two-fold: (i) a comprehensive package of algorithms is proposed to infer trip origins and destinations for all existing vehicle ID types contained in the GBFS data (OD pairs for “Static Vehicle ID,” and unlinked trip origins and destinations for “Resetting and Dynamic Vehicle ID”); and (2) the algorithms are implemented in Washington D.C. based on the GBFS data published by six vendors and the inference accuracy of the proposed algorithms is validated.
The remainder of the paper is structured as follows. The next section presents a literature review on previous studies on e-scooter services. The third section describes the data collection procedures and the proposed algorithms in detail. The fourth section presents an application of the trip inference algorithms in Washington D.C., followed with a validation. The final section concludes the paper by summarizing the findings, identifying limitations, and suggesting future work.
Literature Review
GBFS is the open data standard for all shared micromobility systems, including e-scooter sharing systems and docked and dockless bikesharing systems. This section summarizes existing shared micromobility studies and discusses the data these studies used.
E-Scooter Sharing Studies and Corresponding Dataset
Studies on e-scooter sharing are burgeoning. Different sources of data have been used in these studies. These data can be categorized into survey data, trip data, and real-time location data.
Since survey data provide micromobility user information such as age, gender, and education, they are usually used to analyze the characteristics of e-scooter users and for modeling people’s willingness to use e-scooter services (3–5, 12–14). For example, based on a survey in Vienna, Austria, Laa and Leth ( 3 ) found that e-scooter users were more likely to be young, male, highly educated, and local residents. Almannaa et al. ( 12 ) showed that gender, age, and using ride-hailing services play an important role in people’s willingness to use e-scooters. Some studies also used survey data to estimate the modal shift of e-scooter users (3, 13 , 15 , 16 ). Some studies found that shared e-scooter services mostly replaced walking and public transport trips ( 3 , 13 ), and that shared e-scooters were also potentially competing with ridesourcing and taxis ( 16 ). Survey data can also provide trip information, such as trip purposes and approximate travel time (estimated by the respondents). For example, based on survey data, Bieliński and Ważna ( 4 ) found that e-scooters are often used for leisure rides. However, survey data also have some limitations. Given the relatively high cost of surveys, survey data often have limited samples (less than 1,000 in most cases). In addition, the survey data cannot provide detailed spatiotemporal trip information such as latitude and longitude of trip origin and precise trip start time. Trip data and real-time location data can serve as complements to analyze the spatiotemporal e-scooter usage patterns.
Some studies analyze the trip data published on a city government’s open data portal ( 17 , 18 ). This kind of data directly provides information (e.g., trip origin, trip destination, trip duration, and trip distance) on every trip. For example, Bai and Jiao ( 17 ) explored e-scooter ridership patterns and analyzed the relationship between e-scooter usage and the built environment in Austin, TX, and Minneapolis, MN, based on the shared micromobility vehicle trips data published by the City of Austin and the City of Minneapolis ( 19 , 20 ). However, e-scooter trip data are unavailable to the public for most cities, because these cities have not mandated trip-level data sharing for their micromobility providers. Some authors thus acquired the e-scooter trip data from the city via personal connections. For example, Liu et al. ( 21 ) used the data provided by the City of Indianapolis to analyze the spatiotemporal patterns of e-scooter trips.
Other studies scraped the publicly accessible GBFS or data published by the micromobility vendors and then processed the data to derive needed information (e.g., trip origin and destination, trip trajectory). The scraped data are real-time location data. For example, McKenzie ( 2 ) compared spatial and temporal patterns of e-scooter-share and bikeshare usage in Washington, D.C. using GBFS data. In another study, McKenzie ( 11 ) further explored spatial and temporal differences in usage patterns between six vendors in Washington, D.C., that is, Bird, Lime, Lyft, Skip, Spin, and Jump. The methods used in the two McKenzie studies to derive e-scooter trips from scraped GBFS data were the same: a trip was identified as the time and location when an e-scooter last appeared available in the system, to the time and location when the same e-scooter next appeared available in the set of scraped data. However, since the vehicle ID was used to identify trips, this trip inference method requires the vehicle ID of e-scooter to be consistent over time. Zou et al. ( 9 ) examined e-scooter travel patterns at the street-segment level based on e-scooter trip trajectories in Washington, D.C. E-scooter trip trajectories were pinpointed based on the attribute in the data that indicated whether an e-scooter was in use. However, this method requires static vehicle ID as well as information on all e-scooters in the system. Only one vendor’s data met these requirements and was used in this study; this kind of data is no longer available in Washington, D.C. Baltra et al. ( 22 ) discussed the privacy issues of GBFS specification and used GBFS data in Los Angeles to infer trips. The logic of trip inference in Baltra et al. ( 22 ) was the same as McKenzie ( 2 , 11 ) and relied on a static scooter ID. Zhu et al. ( 23 ) scraped the docked e-scooter and station status data in bikesharing systems in Singapore. Based on the data, they investigated spatiotemporal heterogeneity of bikesharing and e-scooter sharing systems in two urban areas in Singapore. E-scooter trips were identified by continuously checking the vehicle ID of e-scooters in each station. If a vehicle ID disappeared, this was considered a trip origin, and if a vehicle ID appeared, this was considered a trip destination. A summary of existing studies based on inferred e-scooter trips is presented in Table 1.
Summary of Existing Studies Based on Inferred E-Scooter Trips

Note: GBFS = General Bikeshare Feed Specification.
However, micromobility providers are moving away from Static Vehicle ID out of concern for privacy issues. A recent effort to preserve user privacy was to adopt Resetting Vehicle ID, Dynamic Vehicle ID , or both, in the published GBFS data, which is a growing trend since the release of GBFS v2.0 ( 7 ). For example, Lime published Static Vehicle IDs before September 24, 2019 but switched to Dynamic Vehicle IDs afterwards. The existing trip inference methods will not work for these kinds of data. Since vendors concentrate their vehicles at different locations, which results in distinctive spatiotemporal usage patterns across vendors ( 11 ), omitting trip data from vendors that publish Dynamic Vehicle IDs would provide an incomplete picture of e-scooter demand in the city.
In summary, the existing e-scooter trip inference methods can infer trips when providers use a Static Vehicle ID, but cannot deal with dockless e-scooter data with Resetting Vehicle ID or Dynamic Vehicle ID. Since the vendors are moving away from Static Vehicle ID to Resetting Vehicle ID, Dynamic Vehicle ID, or both, trip inference approaches (note that trip inference used in this paper refers not only to trip OD pairs, but also to separate trip origins and destinations) that can infer trips from GBFS data with different vehicle ID types are needed for a more thorough understanding of e-scooter-related travel behavior.
Bikesharing Studies and Corresponding Dataset
Bikesharing includes two schemes: docked bikesharing and dockless bikesharing. Existing studies used survey data to analyze the user characteristics, user’s attitudes to bikesharing, modal shift, and usage patterns of both docked bikesharing and dockless bikesharing ( 24 – 30 ). For example, Guo et al. ( 27 ) explored factors affecting bikesharing usage and satisfaction of bikesharing users based on a survey conducted in Ningbo, China. The results showed that bikesharing satisfaction was associated with household income, the location of bikesharing stations, and users’ perceptions. Martin and Shaheen ( 24 ) evaluated survey data from Washington D.C. and Minneapolis to explore who is shifting toward and away from public transit as a result of bikesharing. The results indicated that age, being male, living in lower density areas, and longer commute distances were associated with modal shift.
GBFS data have also been used by several bikesharing studies ( 2 , 23 , 31–35). In these studies, GBFS data has shown advantages in its large sample sizes and accurate spatiotemporal information compared with the survey data. For example, Qian et al. ( 31 ) analyzed spatial and temporal patterns of bikesharing usage patterns in San Francisco using trips inferred from GBFS data. The trip data included over 0.6 million trips, which provided a large sample for an in-depth analysis.
The GBFS data feeds for docked bikesharing and dockless bikesharing are different. Docked bikesharing trips can only start and terminate at bike stations, while the dockless shared bikes can be picked up and dropped off at any place within the area of operations. The GBFS data provide station information such as station location and number of vehicles available for docked bikesharing systems. By checking the vehicles available at each station, researchers can infer trip origins and destinations (linked OD for Static Vehicle ID and unlinked trip origins, and destinations for Resetting Vehicle ID and Dynamic Vehicle ID). The GBFS data on dockless bikesharing is similar to that of e-scooter sharing, so the trip inference challenges faced by dockless bikesharing are also similar to e-scooter sharing. Therefore, the methods developed in this paper can be readily applied to the dockless bikesharing system to accurately infer trip information.
Methods
This study focuses on the GBFS data collected from the e-scooter operators’ public APIs and explores methods to accurately infer micromobility trips from the GBFS data with different kinds of vehicle IDs. This section describes data collection and three algorithms developed to infer trip origins and destinations using GBFS data.
Data Collection
The GBFS specification requires that vendors publish certain data feeds as JSON files, which are usually made accessible via public APIs provided by each vendor. Among these data feeds, the one that can be used to infer trip origins and destinations is free_bike_status, which provides location information of all currently available vehicles in the system. The attributes in free_bike_status are listed in Table 2. A data sample is as follows:
Attributes in free_bike_status

Note: POSIX = Portable Operating System Interface.
The data feeds are updated every “time to live” (TTL) seconds. Since no specific value is required by the GBFS specification, the TTL varies among vendors. Typical TTL in GBFS includes 0 (the data should always be refreshed), 300, and 600. In this study, for the data feeds with a TTL below 60 s, the data is scraped every minute; otherwise, TTL seconds are used as the scraping interval.
Trip Origins and Destinations Inference Algorithms
As discussed in the previous section, the GBFS data only provide information on vehicles currently available in the system. In other words, information on vehicles in use is not available. In addition, the vendors may adopt different vehicle ID generating strategies. Currently, there are three different vehicle ID generating strategies in GBFS data:
Static Vehicle ID: Vehicle ID does not change until the vehicle is taken out of service.
Resetting Vehicle ID: Vehicle ID of corresponding vehicle randomizes after every trip, but is otherwise static. For example, when a user terminates a trip and returns the vehicle, the system will assign the vehicle a new random vehicle ID.
Dynamic Vehicle ID : Vehicle ID for all vehicles in the system randomizes every several minutes (typical time intervals are 30 min and 1 h).
The three ID generating strategies produce three different types of vehicle ID. The trip origins and destinations inference logic differs for different ID types. Therefore, for each vehicle ID type, an algorithm is developed to infer trip origins and destinations from GBFS data. The three algorithms are summarized in Table 3.
Summary of Inference Algorithms

Note: GPS = global positioning system.
Vendors sometimes relocate e-scooters away from locations where they are not being used to high demand areas. This type of trip is called a “rebalancing trip” in this paper. To recharge low-battery e-scooters in time, some vendors (e.g., Lime) pay gig workers to recharge e-scooters at their residences. Participants are instructed to pick up e-scooters with low batteries, and drop them off at specific locations after recharging. This type of trip is named a “juicing trip” ( 2 ). Both rebalancing trip and juicing trip are not real trips conducted by travelers, thus it is intented to exclude such trips.
Static Vehicle ID
Since the GBFS data only provides real-time information on available e-scooters, once a user unlocks an e-scooter and starts a trip, information on this e-scooter disappears from the corresponding data feed. When the trip terminates, information on the e-scooter will reappear in the data feed. Therefore, it can be inferred that information on an e-scooter disappearing in the data feeds indicates a trip origin of this e-scooter. Similarly, information on an e-scooter reappearing in the data feeds indicates a trip destination. The inference logic is similar to previous studies ( 2 , 20 , 22 ). Based on this logic, an algorithm is developed to infer trip origins and destinations for e-scooters with Static Vehicle ID. The algorithm is presented in detail in Algorithm 1.

When e-scooter vendors publish valid data with a high update frequency, this algorithm can produce accurate inference results for origin and destination locations. Theoretically, the algorithm can identify all actual trips if data feeds are updated frequently enough, that is, every second. In addition, since the e-scooter vehicle ID is static, this algorithm can infer trip OD pairs. Inference error is possible if there is global positioning system (GPS) error or a low data update frequency. Launch and elimination of vehicles will not result in inference errors. The algorithm only infers linked OD pairs, thus the first record will not be identified as trip destination and the last record will not be identified as trip origin. When a e-scooter is in a rebalancing trip or juicing trip, since the e-scooter is locked, some vendors may mark this e-scooter as “available” and publish information on it to free_bike_status. In this case, movement of e-scooters can be observed in the data feeds but the algorithm will not categorize these trips as real trips conducted by travelers.
The analyst may seek to exclude rebalancing and juicing trips by considering additional criteria such as travel distance, trip speed, or time of day ( 2 , 9 ). This study uses the same criteria as in McKenzie ( 2 ). Trips that lasted longer than 2 h, trips with average speeds greater than 15 mph, and trips with average speeds lower than 2.2 mph are removed from this study.
Resetting Vehicle ID
When an e-scooter using Resetting Vehicle ID starts a trip, information on the e-scooter will disappear from the data feed. After the trip terminates, information on this e-scooter will reappear but with a different ID. The ID is randomly generated so the new ID cannot be matched with the previous one. Therefore, OD pairs cannot be inferred using this kind of data. But trip origins and destinations can be inferred separately. The e-scooter starts using a new ID when a trip terminates. When the next trip starts, this ID then disappears from the data feeds. Therefore, when an e-scooter appears in the system with an ID, this is marked as a trip destination; then at a later time point, when the e-scooter with this same ID disappears in the system, this is marked as a trip origin. In other words, for all records with a unique vehicle ID, the earliest record indicates a trip destination and the latest record indicates the origin of the next trip. Based on this logic, an algorithm to infer trip origins and destinations for e-scooters with Resetting Vehicle ID is developed. The algorithm is presented in Algorithm 2.

Like Algorithm 1, the inference accuracy of this algorithm is related to data update frequency and GPS error. In addition, this algorithm may overestimate trip origins and destinations. If a new e-scooter is added to the system, the first record of this e-scooter will also be incorrectly identified as a trip destination. Similarly, when a broken e-scooter is removed from the system, the last record of this e-scooter is incorrectly identified as a trip origin. The sources of error are summarized in Table 3. The adverse effects of these limitations are evaluated in the section on inference accuracy that follows. Note that when an e-scooter is in a rebalancing trip, the vendors will continue publishing information about the vehicle to the data feeds. We can observe movement of e-scooters in the data feeds, but these e-scooters will not disappear from the data feed. Therefore, the algorithm will not identify trip origins and destinations of these movements.
Dynamic Vehicle ID
Scooters with Dynamic Vehicle ID change vehicle ID periodically, according to a certain time interval (e.g., 30 min). This ID generating strategy is a good way to protect user privacy but makes it challenging to infer trip origins and destinations. However, it is still possible to infer trip origins and destinations using the proposed method.
The first step is to create a series of zones and count the total number of scooters in each zone at regular intervals. Here A and B are used to denote specific zones. The zones should be large enough that GPS location error between time periods for the same stationary scooter does not lead to an inference of a false trip.
Consider a series of consecutive time steps


An example to illustrate the process of trip origin and destination identification of Algorithm 3.
In the case of Algorithm 3, there are more potential sources of error. Inference error may result from GPS error, low data update frequency, and the launch or elimination of e-scooters. Besides, movements of e-scooters which are not real trips (e.g., rebalancing and juicing trips) may be recognized as trips by the algorithm, which may cause extra inference errors. The sources of error are summarized in Table 3. The inference accuracy of this algorithm is discussed below.
Note that in Algorithm 3,
Application and Validation of the Proposed Algorithms
Published GBFS data were collected from six e-scooter services vendors (i.e., Bird, Jump, Lime, Lyft, Skip, and Spin) in Washington D.C. from February 24, 2020 to March 1, 2020. As described in the data collection section, data feeds were scraped using API (https://ddot.dc.gov/page/dockless-api) provided by the vendors. Since the data update frequency varies among vendors, different scraping intervals were used. Specifically, the scraping interval for Bird, Jump, Skip, and Spin data is 60 s, and the scraping interval for Lime and Lyft is 300 s. For vehicle ID generating strategy, Jump, Skip and Spin use Static Vehicle ID. Bird uses Resetting Vehicle ID. Lime and Lyft use Dynamic Vehicle ID. After data collection, trip origins and destinations are inferred by the corresponding algorithm. The features of data are presented in Table 4.
Summary of the Features of the Data

Inference Results
Based on the data collected, 65,601 trip origins and 65,600 trip destinations are inferred in total. The temporal distribution of trip origins and destinations is presented in Figure 2. Note that each

Temporal distributions of trip origins and destinations for different vendors in Washington, D.C.: (a) trip origins and (b) trip destinations.
According to Figure 2, while the six vendors have different trip volumes, the temporal usage patterns are generally similar, which is consistent with conclusions in McKenzie ( 11 ). All of the six vendors have two significant trip peaks during weekdays. The morning peak hours are 8:00 a.m. to 10:00 a.m., and the afternoon peak hours are 5:00 p.m. to 7:00 p.m. But on weekends, there is only one peak, during the afternoon from 3:00 p.m. to 5:00 p.m. This difference between weekdays and weekends presumably results from commuting trips, which are more common during weekdays. Compared with the study by McKenzie ( 11 ), where data from December 2018 to March 2019 were used, the morning and afternoon peaks on weekdays are more prominent in this study. This result suggests that the proportion of commuting trips in e-scooter trips might be increasing over time, but more analysis is needed in the future to assess the e-scooter trip purposes. Since the travel time of most commuter e-scooter trips is less than 1 h and trips are aggregated by hour of the day, there are no significant differences between the temporal distributions of trip origins and destinations. But we can observe that the count of trip destinations is larger than the count of trip origins during the second half of the morning peak (i.e., 9:00 a.m. to 10:00 a.m.). This phenomenon may be caused by commuting trips too, most of which start from 8:00 a.m. to 9:00 a.m. and end before 10:00 a.m.
Using the data heat maps were then generated based on trip origin and destination density to explore spatial e-scooter usage patterns during peak hours. The results are presented in Figure 3. The general spatial pattern of peak-hour trips is that the trip density is significantly high in downtown areas, especially along the arterials. The typical hot spots of e-scooter usage include Dupont Circle, Foggy Bottom, Mount Vernon Square, Union Station and the U.S. Department of Transportation. Interestingly, all of these areas are centered on or close to metro stations. This may indicate that the e-scooter services provide connections between transit stations and origins or destinations of commuters. If so, e-scooter services may help address the “first-mile/last-mile” problem. For morning peaks, the trip destinations are more concentrated than trip origins. This could be because most of the morning commuting trips are from home to work, and the work places are more likely to congregate in downtown areas. For afternoon peaks, there is a significant hot spot for trip destinations in the Penn Quarter, which is a popular entertainment district with bars, restaurants, and shopping. This pattern makes sense because people may use e-scooters to travel to leisure activities after work.
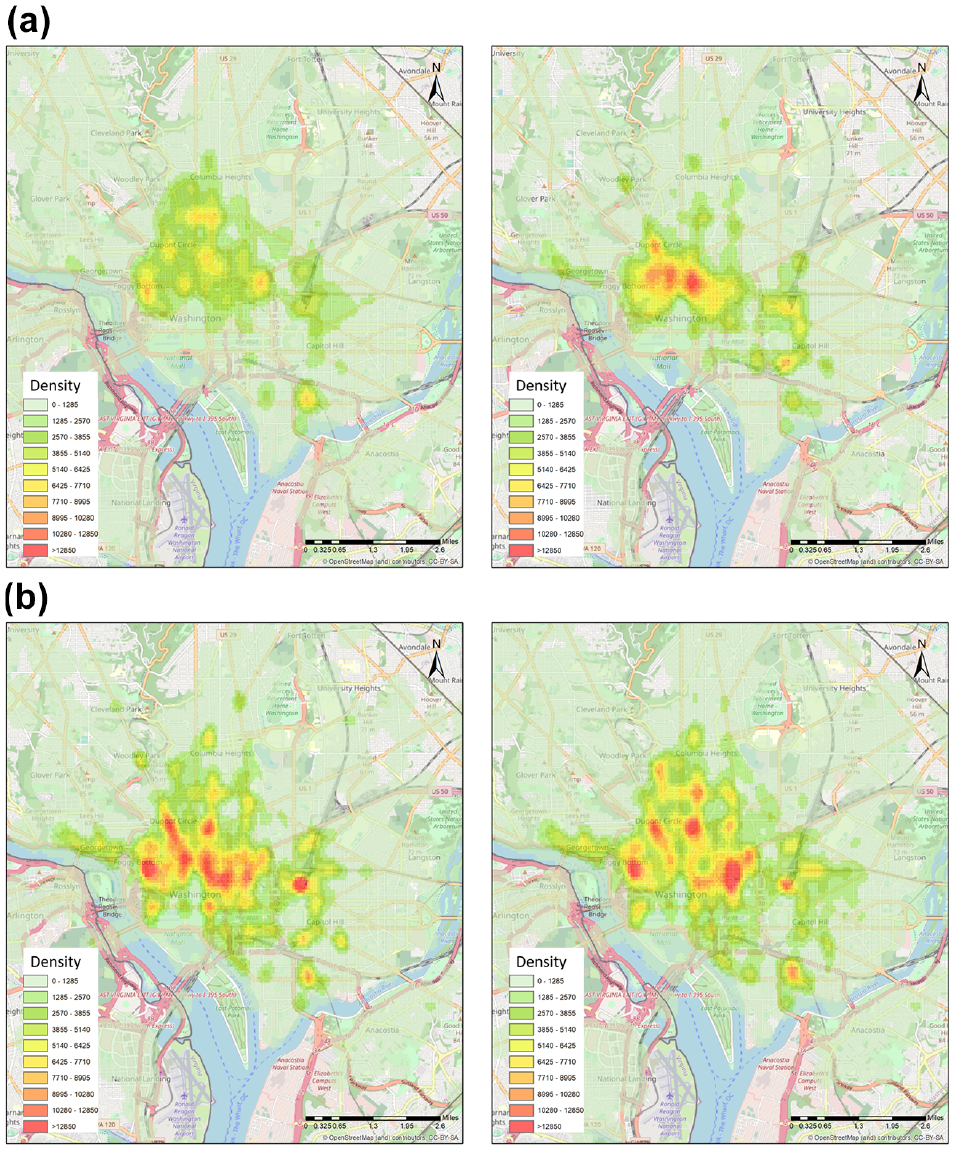
Spatial distributions of trip origins and destinations in Washington, D.C. (density unit: trips per day per square kilometer): (a) morning peak (left: trip origin; right: trip destination.) and (b) afternoon peak (left: trip origin; right: trip destination.).
Evaluation of the Proposed Algorithms
GPS error and the error caused by data update frequency are irreducible. With the same data set, the two errors have the same effect on inference accuracy for the three algorithms. As discussed in the Methods section, the inference error of Algorithm 1 only results from GPS error and the error caused by data update frequency. Theoretically, Algorithm 1 is expected to have the best performance among the three algorithms. Since the vendors using Static Vehicle ID (i.e., Jump, Skip, and Spin) update the e-scooter status data every minute, the travel time error of a trip will not exceed 1 min and location errors cannot exceed the distance a scooter can travel in 1 min. Therefore, the inference results of Algorithm 1 are close to the ground truth. Therefore, the inference result of Algorithm 1 is used as benchmark to evaluate the performance of Algorithms 2 and 3.
The inference accuracy of proposed algorithms is evaluated by three metrics: R2, MAE, and SAE. The research area is first divided into a regular square grid with zones of equal size. Then the trip origins and destinations are aggregated into these grids based on location and then the number of origins and destinations in each grid cell is counted. Since the actual trip count of several grids is zero, the authors choose to use absolute metrics (i.e., MAE and SAE) rather than relative metrics to evaluate the inference errors to avoid undefined values (i.e., division by zero). R2, MAE, and SAE are calculated by:





where
To compare the performance of the three inference algorithms, a data set with Static Vehicle ID is first selected. Then Algorithm 1 is used to infer trip origins and destinations as a benchmark. After that, vehicle ID is regenerated using Resetting Vehicle ID strategy and Dynamic Vehicle ID strategy. Trip origins and destinations are then inferred using the corresponding algorithms (i.e., Algorithm 2 and Algorithm 3) and the results are compared with the benchmark. Among the six vendors, Spin uses Static Vehicle ID and updates the data feeds at a high frequency. Therefore, data feeds published by Spin were use for algorithm evaluation. To analyze sensitivity to zone size, the fit metrics for a range of different zone sizes, ranging from 100 m square to 1,000 m square zones were calculated. The results are presented in Figure 4. Note that the
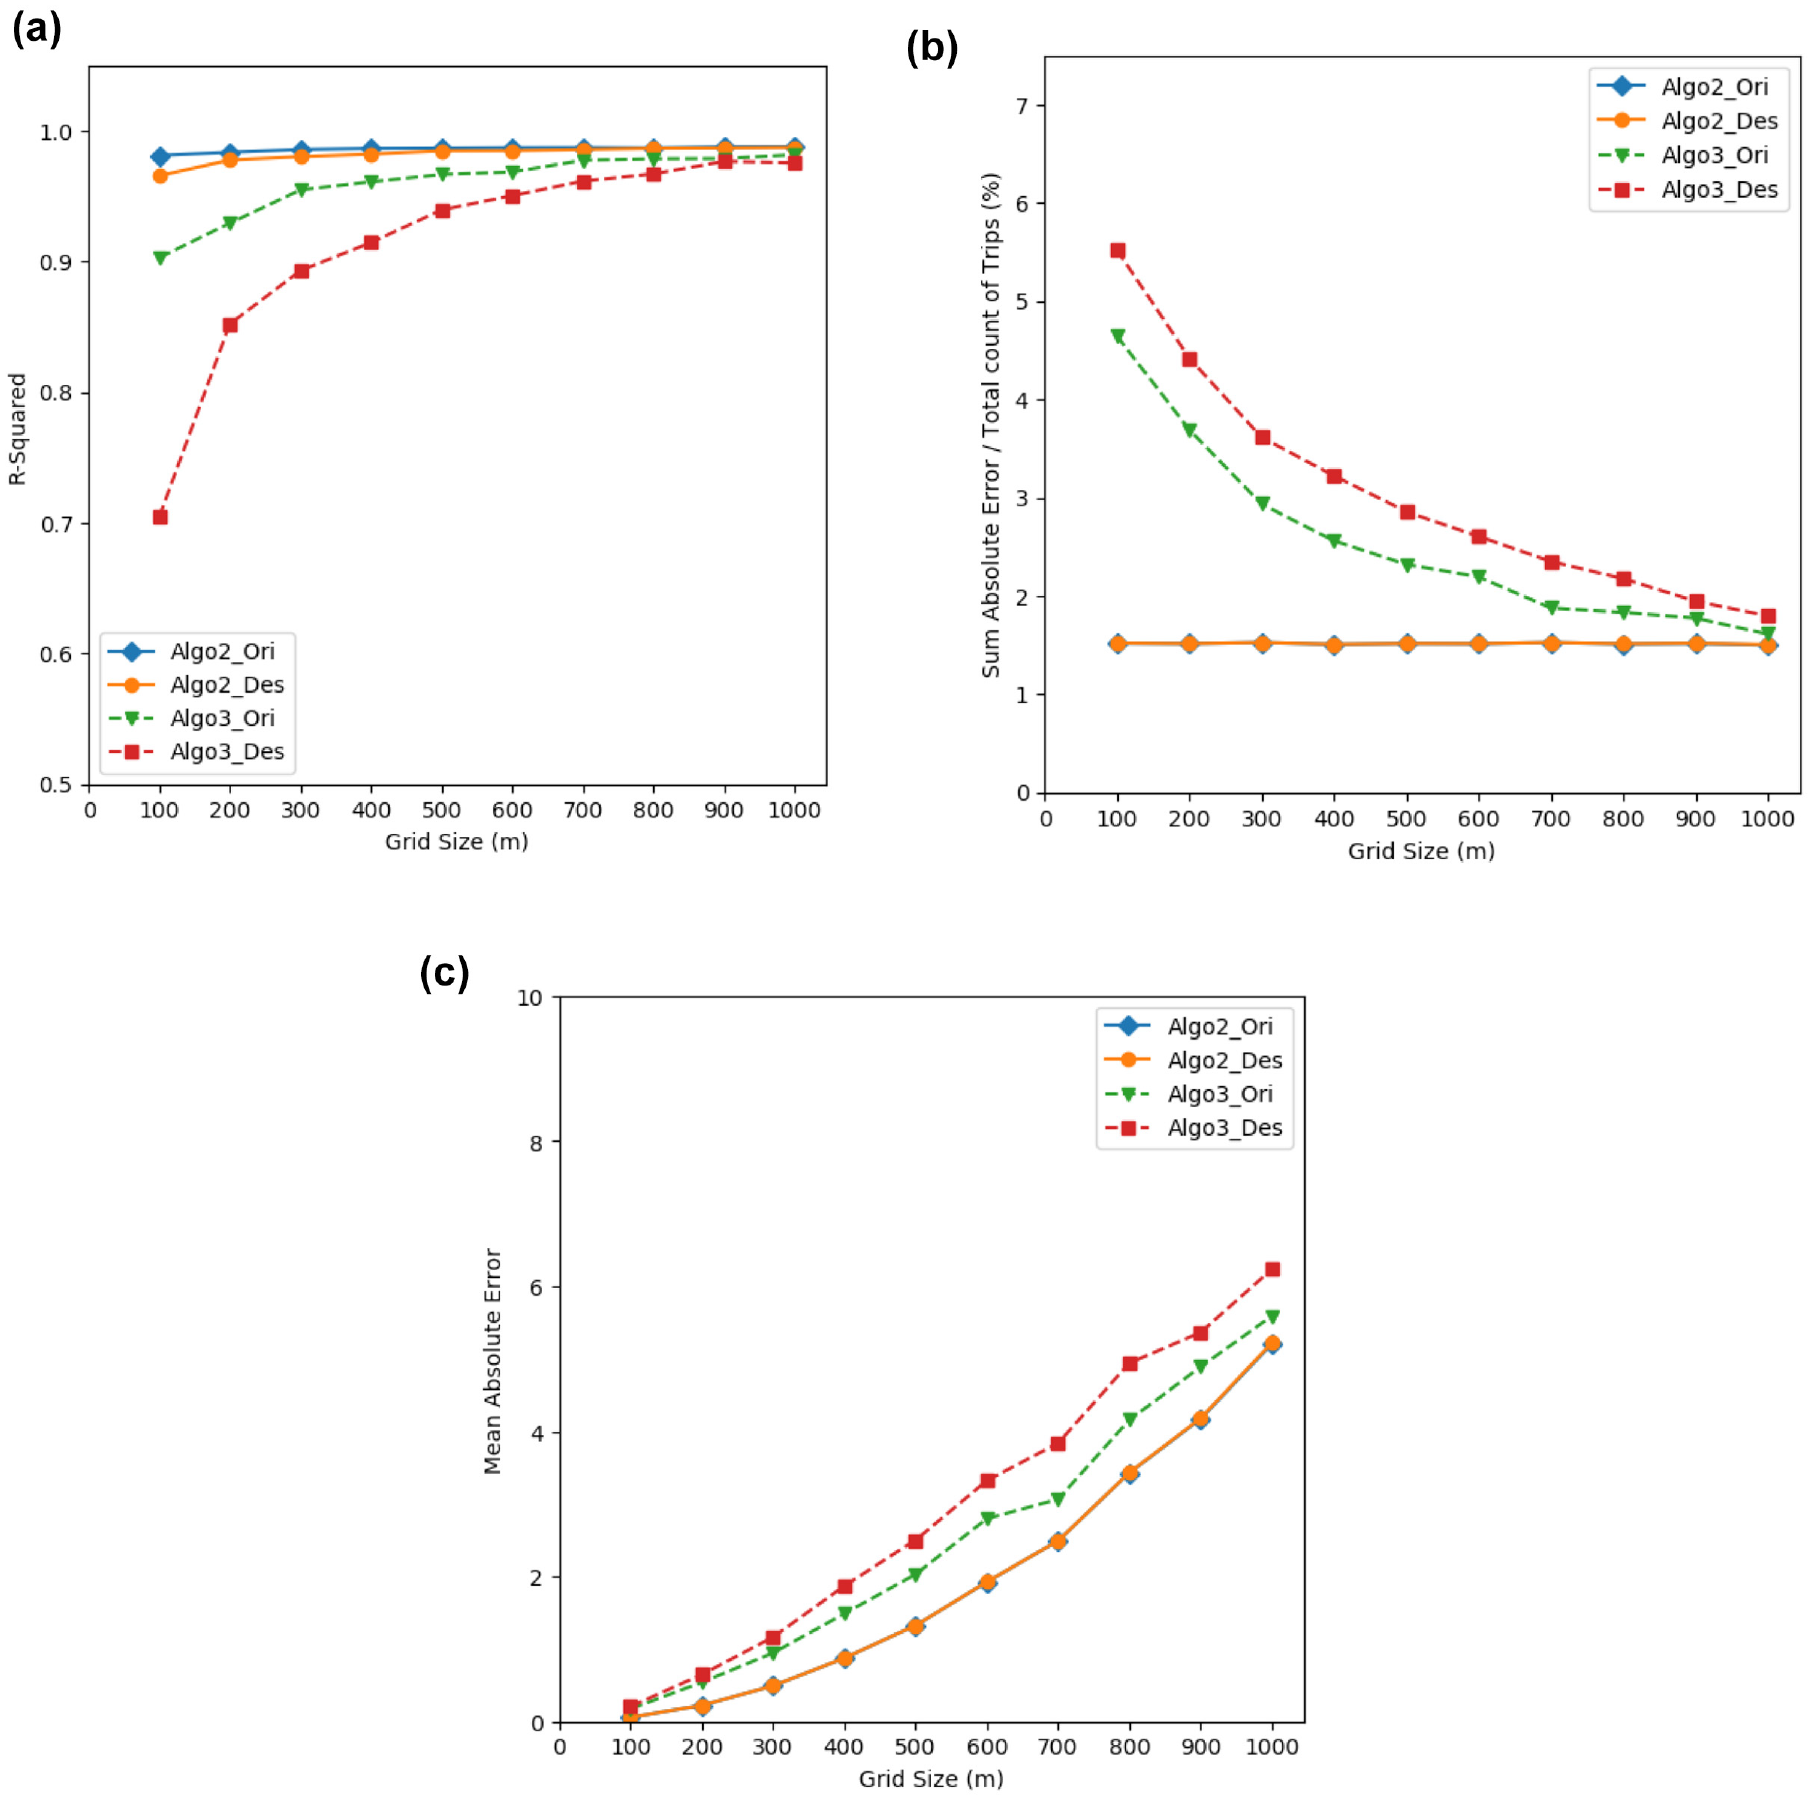
Inference accuracy evaluation of Algorithm 2 and Algorithm 3 for different size of grid (sensitivity analysis): (a) R-squared, (b) sum absolute error, and (c) mean absolute error.
According to Figure 4, both Algorithm 2 and Algorithm 3 have achieved high inference accuracy. Algorithm 2 has higher inference accuracy than Algorithm 3. When the grid size is larger than 400 m × 400 m, the
The spatial and temporal distributions of inference error with 400 m × 400 m grid size are further examined. The spatial distributions of inference error of Algorithm 2 and Algorithm 3 are presented in Figure 5. Note that the total number of e-scooter trips taken is 8,845. We can see that the inference error (absolute value) is larger in downtown areas, where the trip density is greatest. There are more movements of available e-scooters such as vehicle rebalancing in downtown areas. Most launches and eliminations of e-scooters also happen in these areas. As discussed in the Methods section, each of these activities may lead to inference errors. Therefore, the inference error is larger in the downtown area. The temporal distributions of inference error of Algorithm 2 and Algorithm 3 are presented in Figure 6. The inferred demands are grouped by time (i.e., hour). For each time interval (i.e., hour), the inference error for each cell in the grid is first calculated; then the mean and the 95% confidence interval of these errors in this time interval are calculated to generate Figure 6. According to Figure 6, the inference error is relatively high during early morning (i.e., 4:00–8:00 a.m.) and early night (i.e., 6:00–10:00 p.m.). This is because most of the vehicle rebalancing occurs during these time periods ( 2 ). The pick-ups and drop-offs of rebalanced vehicles result in extra inference errors for both Algorithm 2 and Algorithm 3. The inference error of Algorithm 2 is larger than that of Algorithm 3 during 6:00–7:00 p.m. After checking the data, some launches and eliminations of vehicles were observed in that time period. Since the launch and elimination of vehicles has larger adverse effect on inference accuracy of Algorithm 2 according to the algorithm mechanism, its error is larger. In addition, during 8:00–10:00 p.m., the inference error of Algorithm 3 is significantly higher than that of Algorithm 2. Relatively many movements of vehicles not in use during this time period were observed. As discussed in previous sections, these movements do not affect the inference accuracy of Algorithm 2 but cause inference errors for Algorithm 3. Therefore, the error of Algorithm 3 is higher in this time period.
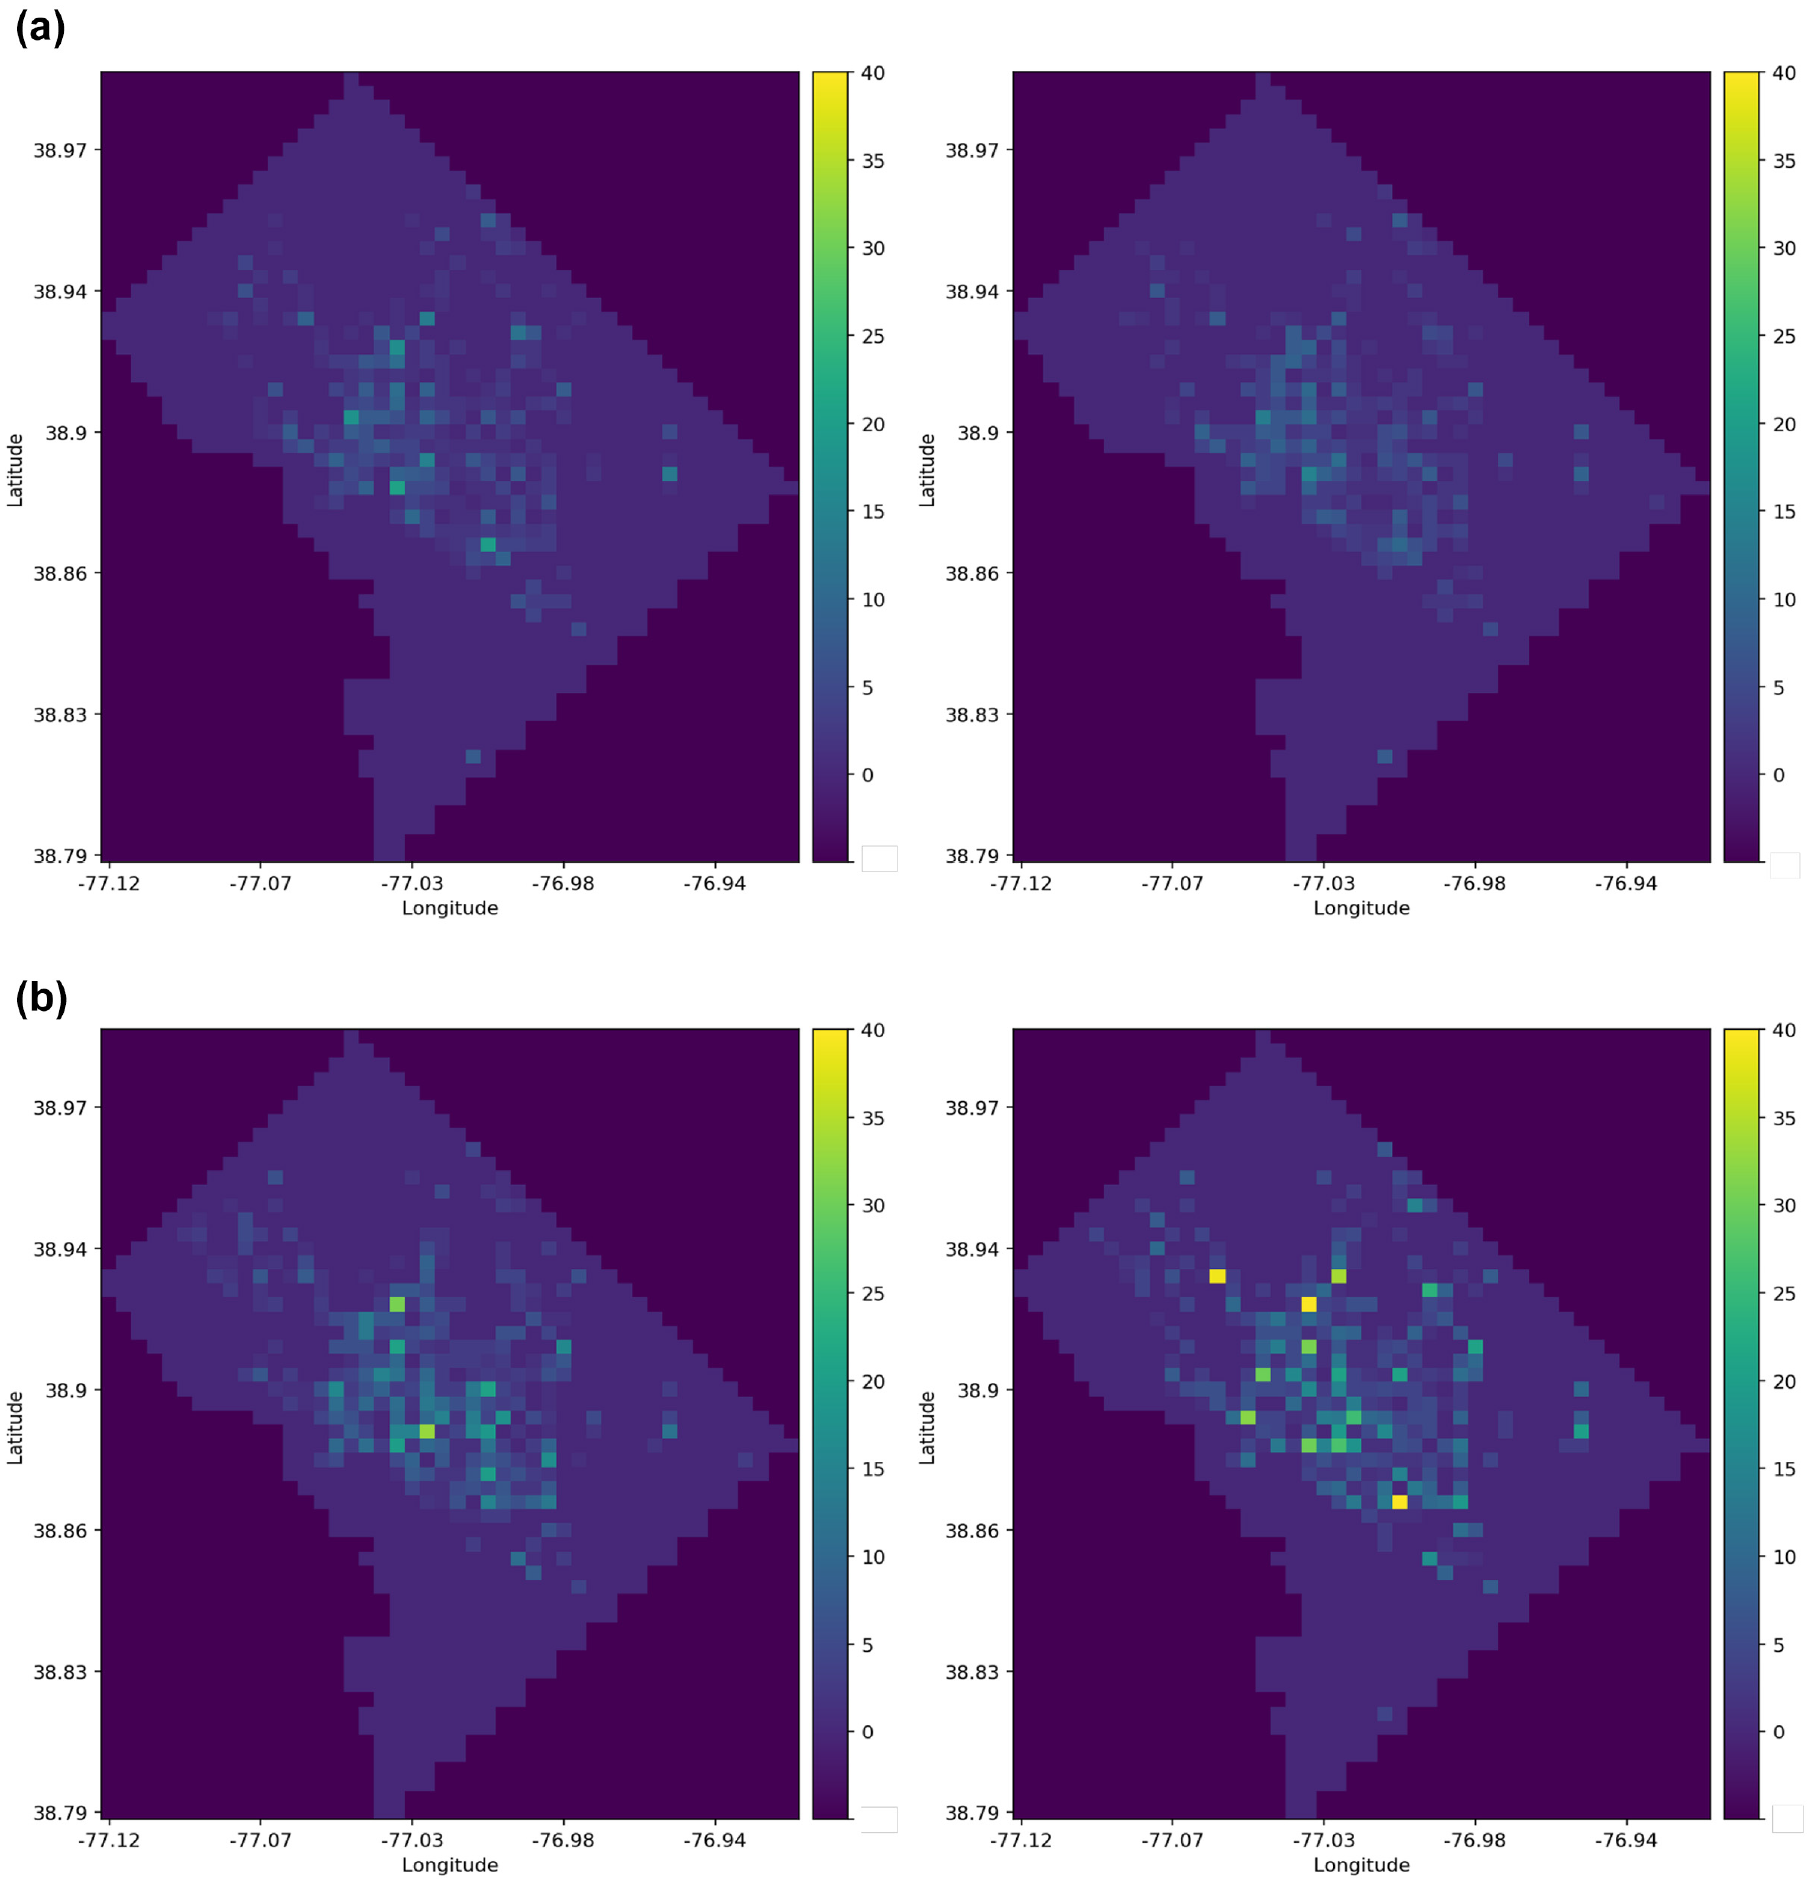
Spatial distributions of inference error (absolute value) of Algorithm 2 and Algorithm 3: (a) Algorithm 2 (left: trip origin; right: trip destination.) and (b) Algorithm 3 (left: trip origin; right: trip destination.).
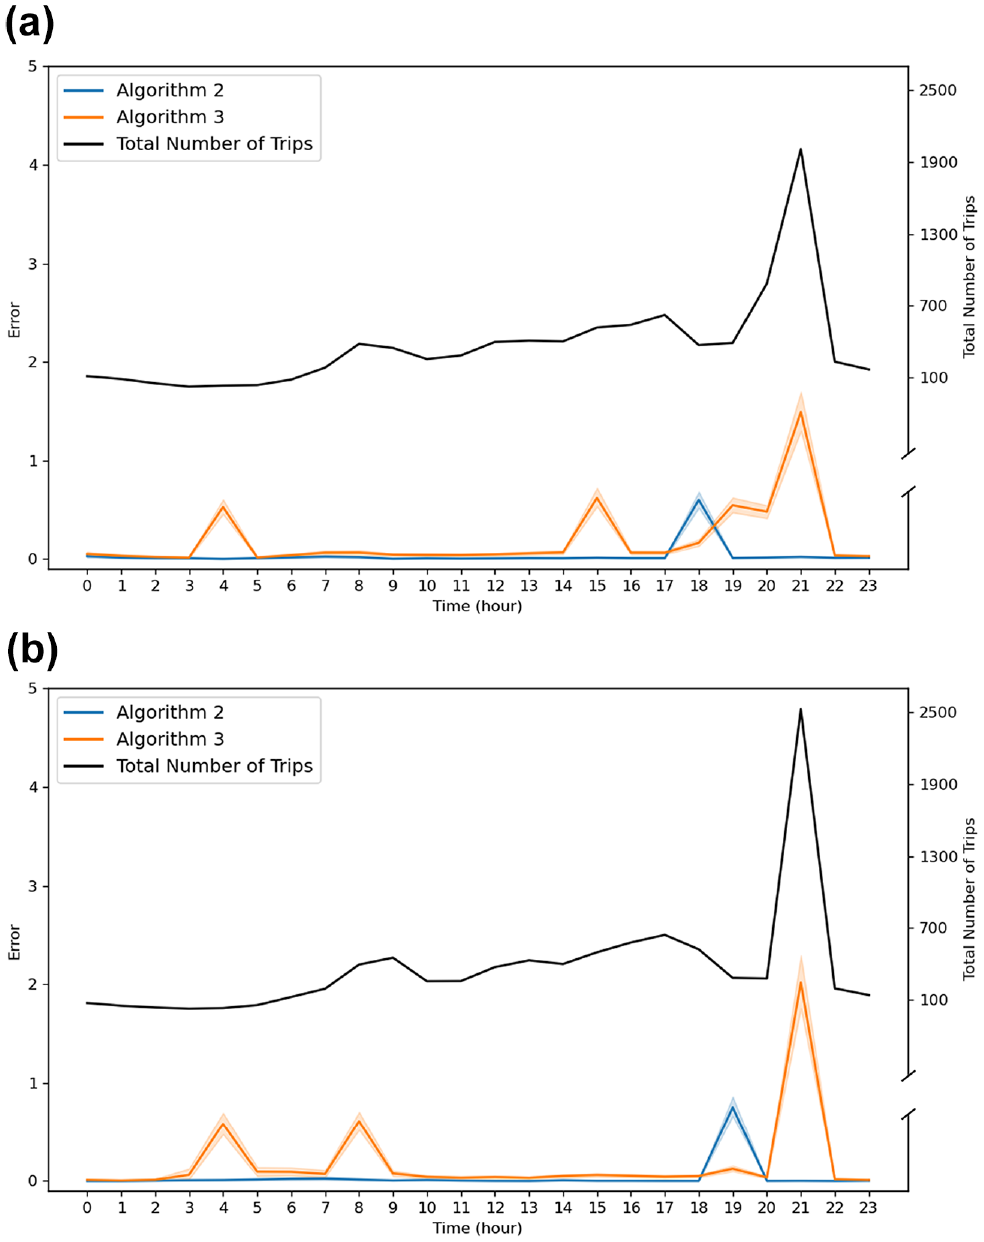
Temporal distributions of inference error (in the number of trips) of Algorithm 2 and Algorithm 3: (a) trip origins and (b) trip destinations.
Discussion and Conclusion
This study proposes a package of algorithms to infer e-scooter origins and destinations from GBFS data with various vehicle ID types. The accuracy of two proposed algorithms is examined using data from Washington D.C. Two algorithms that work with resetting or dynamic IDs are tested in comparison with an algorithm that works for static IDs, and is therefore more reliable. The inference error is measured with R2, MAE, and SAE. With scraped GBFS data from one week, trip origins and destinations are inferred using the proposed algorithms. The inference accuracy of the proposed algorithms is evaluated by simulations based on data from Spin (which has Static Vehicle ID). The results show that both Algorithm 2 and Algorithm 3 have good inference accuracy with R2 larger than 0.9 and MAE smaller than 2 when evaluated with a 400 m × 400 m grid. As the grid size increases, the R2 of Algorithm 3 increases and the SAE decreases, while the R2 and SAE of Algorithm 2 remain flat. The absolute errors of Algorithm 2 and Algorithm 3 are larger in the downtown areas, and the inference error is relatively high during early morning and early nighttime.
Using these proposed algorithms, a temporal analysis on scooter trip origins and destinations was conducted. These data show that e-scooter services have a morning peak and an afternoon peak on weekdays, and these peaks are more pronounced compared with the results produced by earlier studies. The findings suggest that e-scooter services may be increasingly used in commuting trips. A spatial analysis with the inferred OD data shows that many areas with high intensity e-scooter usage are close to metro stations. This suggests that travelers are using e-scooter services to connect with transit stations, possibly addressing the “first mile/last mile” problem.
Cities have to balance the need for information about transportation systems with the need for traveler privacy. The public transportation authorities require data and information to manage and guide transportation policy in a fast-changing world. For example, public authorities may seek to improve connectivity between micromobility services and the public transit system. However, a growing body of research indicates that “anonymous” mobility data, which do not specifically reference a person’s name, email, or address, could still be used to re-identify specific individuals, their whereabouts, and activities ( 8 , 22 ). For example, information on the starts and ends of trips or the entire GPS trace of a trip can be combined with other datasets to identify specific individuals. Therefore, GPS and location data are considered as privacy-sensitive information in some U.S. states ( 36 ). Data standards such as MDS, which track a greater detail of location information, are becoming controversial. The requirements of MDS have been the subject of some lawsuits over data-sharing standards (e.g., Uber and ACLU sued LADOT over MDS [ 37 , 38 ]). The GBFS data standard, by contrast, has gradually moved away from Static Vehicle IDs to Resetting Vehicle IDs or Dynamic Vehicle IDs ( 10 ). This helps to mitigate privacy concerns. More cities are expected to adopt GBFS rather than MDS standards in the near future.
There is a trade-off between preserving user privacy and extracting useful information from the GBFS data. For GBFS with Static Vehicle IDs, we can directly infer OD pairs. When GBFS is used with Resetting Vehicle IDs or Dynamic Vehicle IDs, we can only get unlinked trip origins and destinations. With unlinked trip ends, it is impossible to gain information about how micromobility trips are being used as a substitute for other modes, which will partially hinder our understanding of micromobility usage patterns. Cities must carefully navigate the balance between privacy protection and data utility. If cities fail to protect sensitive data, e-scooter companies may use such failures as an excuse to claw back data-sharing agreements. On the other hand, for transportation officials to promote safe and convenient travel options for all, some mobility data (e.g., OD demand and trip trajectory) are essential to guide policymaking and mobility management. Cities must balance the goal of public data sharing with user privacy, and GBFS seems currently to offer the best balance between these competing objectives. For GBFS with a Resetting Vehicle ID or Dynamic Vehicle ID, trip origin and destination information can be inferred by the proposed algorithms; such data may be sufficient for many research and policy setting purposes.
A limitation of this study is that the inference algorithms and data cleaning process require certain assumptions to be made, such as the maximum e-scooter speed and minimum travel distance. Since the trips not made by users such as rebalancing trips are not labeled in GBFS data, we need to use some criteria such as travel distance to exclude these trips. However, these trips cannot necessarily always be eliminated. Another limitation is that the proposed algorithms for GBFS with dynamic IDs can only infer origins and destinations separately (i.e., we cannot link the origin and destination of a trip). Because of the inference error, the count of origins and destinations may not perfectly match. However, unlinked trip origins and destinations are still useful. We can still examine the spatiotemporal usage patterns using unlinked trip origins and destinations, for example, identifying hot spots of trip origins and destinations during the peak hours and exploring association between trip generation, trip attraction, and points of interest. Additionally, this information can be used to build micromobility demand forecasting models ( 39 ), which can facilitate effective transport planning and achieve efficient real-time management of micromobility services. Future work may consider developing optimization algorithms to infer OD pairs from the separate trip origins and destinations ( 40 , 41 ). Moreover, future work may also include investigating the e-scooter trip purpose by intersecting the trip inference results with the land use data. As the number of entities sharing GBFS increases, researchers may examine how the GBFS data and the algorithms developed for them such as the ones we present here have been instrumental for transportation decision-making.
Supplemental Material
sj-docx-1-trr-10.1177_03611981221092005 – Supplemental material for Micromobility Trip Origin and Destination Inference Using General Bikeshare Feed Specification Data
Supplemental material, sj-docx-1-trr-10.1177_03611981221092005 for Micromobility Trip Origin and Destination Inference Using General Bikeshare Feed Specification Data by Yiming Xu, Xiang Yan, Virginia P. Sisiopiku, Louis A. Merlin, Fangzhou Xing and Xilei Zhao in Transportation Research Record
Footnotes
Author Contributions
The authors confirm contribution to the paper as follows: study conception and design: Y. Xu, X. Yan, X. Zhao; data collection: Y. Xu, F. Xing; analysis and interpretation of results: Y. Xu, X. Yan, V. P. Sisiopiku, L. A. Merlin, X. Zhao; draft manuscript preparation: Y. Xu, X. Yan, V. P. Sisiopiku, L. A. Merlin, X. Zhao. All authors reviewed the results and approved the final version of the manuscript.
Declaration of Conflicting Interests
The author(s) declared no potential conflicts of interest with respect to the research, authorship, and/or publication of this article.
Funding
The author(s) disclosed receipt of the following financial support for the research, authorship, and/or publication of this article: This research was supported by the U.S. Department of Transportation through the Southeastern Transportation Research, Innovation, Development and Education (STRIDE) Region 4 University Transportation Center (Grant No. 69A3551747104).

Supplemental Material
Supplemental material for this article is available online.
References
Supplementary Material
Please find the following supplemental material available below.
For Open Access articles published under a Creative Commons License, all supplemental material carries the same license as the article it is associated with.
For non-Open Access articles published, all supplemental material carries a non-exclusive license, and permission requests for re-use of supplemental material or any part of supplemental material shall be sent directly to the copyright owner as specified in the copyright notice associated with the article.
