
Abstract
New technologies and global datasets enable transport projects to be assessed more effectively and efficiently. Geospatial data are available retrospectively and remotely, which is particularly useful for evaluators working in countries with constraints on their access to data, including those caused by COVID-19 pandemic. Another advantage is that data quality is the same and comparable across countries. This paper reports the results of geospatial portfolio analysis and economic impact analysis with geospatial data. It generated several interesting findings. For example, the contribution of projects carried out by the Asian Development Bank (ADB) became visible, as about 290 million people live along the road alignments of ADB projects and are therefore potential beneficiaries. Their presence and greater economic activity are indicated by increases in the radiance of nighttime light. The data also demonstrated which countries need to make additional efforts to reduce CO2 emissions from the project areas. Two levels of impact analysis using nighttime light were carried out, which measured local benefits of economic growth. The first assessed a national highway project in Armenia. The contribution of the project to economic growth was more than 2.5% per year. The second found that 33 transportation projects had made an average annual contribution to economic growth of 5%. The authors compared the impact assessed by nighttime light with conventional economic analysis using economic internal rates of return, measuring benefits enjoyed by road users and administrators, and observed a positive correlation between the two.
Keywords
A geographic information system (GIS) is a framework for gathering, managing, analyzing, and visualizing geographically referenced information ( 1 , 2 ). It integrates software, applications, and data to show patterns, relationships, and combinations between them. It helps users make more informed decisions ( 1 ). The outputs of a GIS include printed maps and charts, spatial analyses, and, more recently, interactive and dynamic information systems and applications that are accessible online. In recent years, data collection has evolved, for example, with satellite images and other remotely sensed data and computerized data collection from fieldwork minimizing the need for manual digitization.
Figure 1 shows some of the data layers used in GIS and spatial analysis. Since its conceptualization, GIS has been applied in a flexible way. Combining different data sources and transforming them to geospatial datasets helps users to monitor changes in an area (e.g., forest cover mapping), understand trends, identify problems, and create corresponding solutions (e.g., transport planning), manage and respond to events (e.g., extreme weather events and disaster response), forecast future scenarios, and set priorities ( 3 , 4 ).

Sample layers of a geographic information system ( 5 ).
Despite the usefulness of GIS for planning and designing infrastructure, and for managing traffic, only a few organizations have applied GIS to project evaluation in the transport sector. They include the U.S. Agency for International Development (USAID), the World Bank, and the Global Environment Fund ( 6 ). Monitoring and evaluation of a project’s effects on the surrounding area is possible with GIS. Consistent and comparable data observation across an extensive period can be used to depict the situations before, during and after project implementation.
The rapid increase in the availability of geospatial data means that completed, active, and future projects can be evaluated using geospatial monitoring and impact evaluation. This paper found the following advantages to using geospatial information for project evaluation:
Geospatial analysis can be implemented retrospectively and remotely, which makes it particularly useful for evaluators working in fragile and conflict-affected countries. Even if baseline data, such as traffic volume and socioeconomic information on the impact areas, has not been measured or recorded, geospatial data, such as nighttime light, are available.
Most transport projects in developing countries do not have annual traffic data on hand. A project usually relies on a one-time traffic count after project completion. By contrast, geospatial data are available periodically (e.g., every month) and the quality of this data is good almost everywhere. This means that the impact of a project in different places or time frames can be compared, even if sufficient traffic data are not available from traditional sources.
In developing countries, difficulties in obtaining data for project monitoring are a major constraint on measuring project outcomes and impacts accurately, particularly in fragile and conflict-affected countries. Using publicly available geospatial data reduces the burden on developing countries and lessens the uncertainty surrounding monitoring and evaluation.
This study explored the potential benefits of GIS for monitoring and evaluation. It examined how GIS can improve management of a transport portfolio by adding new socioeconomic and environment data from geospatial sources. It also assessed how associated socioeconomic impact can be analyzed using big data analysis and geospatial information in comparison with the current economic analysis.
Methodology of the Study
This paper has two major components: (i) geospatial impact evaluation at the project level (component 1), and (ii) statistical and geospatial portfolio analysis and geospatial impact analysis at the sector level (component 2). Both use the same geospatial database, and the following methodology. The study was an input to independent evaluation studies which were reported to the Board of Directors of the Asian Development Bank (ADB) to show lessons that had been learned and that should be applied to future ADB support, so the methodology was carefully designed to be neutral.
Figure 2 shows how the study set up the GIS database. A total of 163 road and railway sections funded by ADB from 2010 to 2019 were digitized using geospatial datasets from OpenStreetMap ( 7 ) and Geofabrik ( 8 ). The study also created a geospatial portfolio within 10 km buffer zones of these projects using geospatial data, such as nighttime light, carbon dioxide (CO2) emissions, road density, population estimates, and alignment with the Asian Highway Network (Table 1).
Geospatial Datasets Used
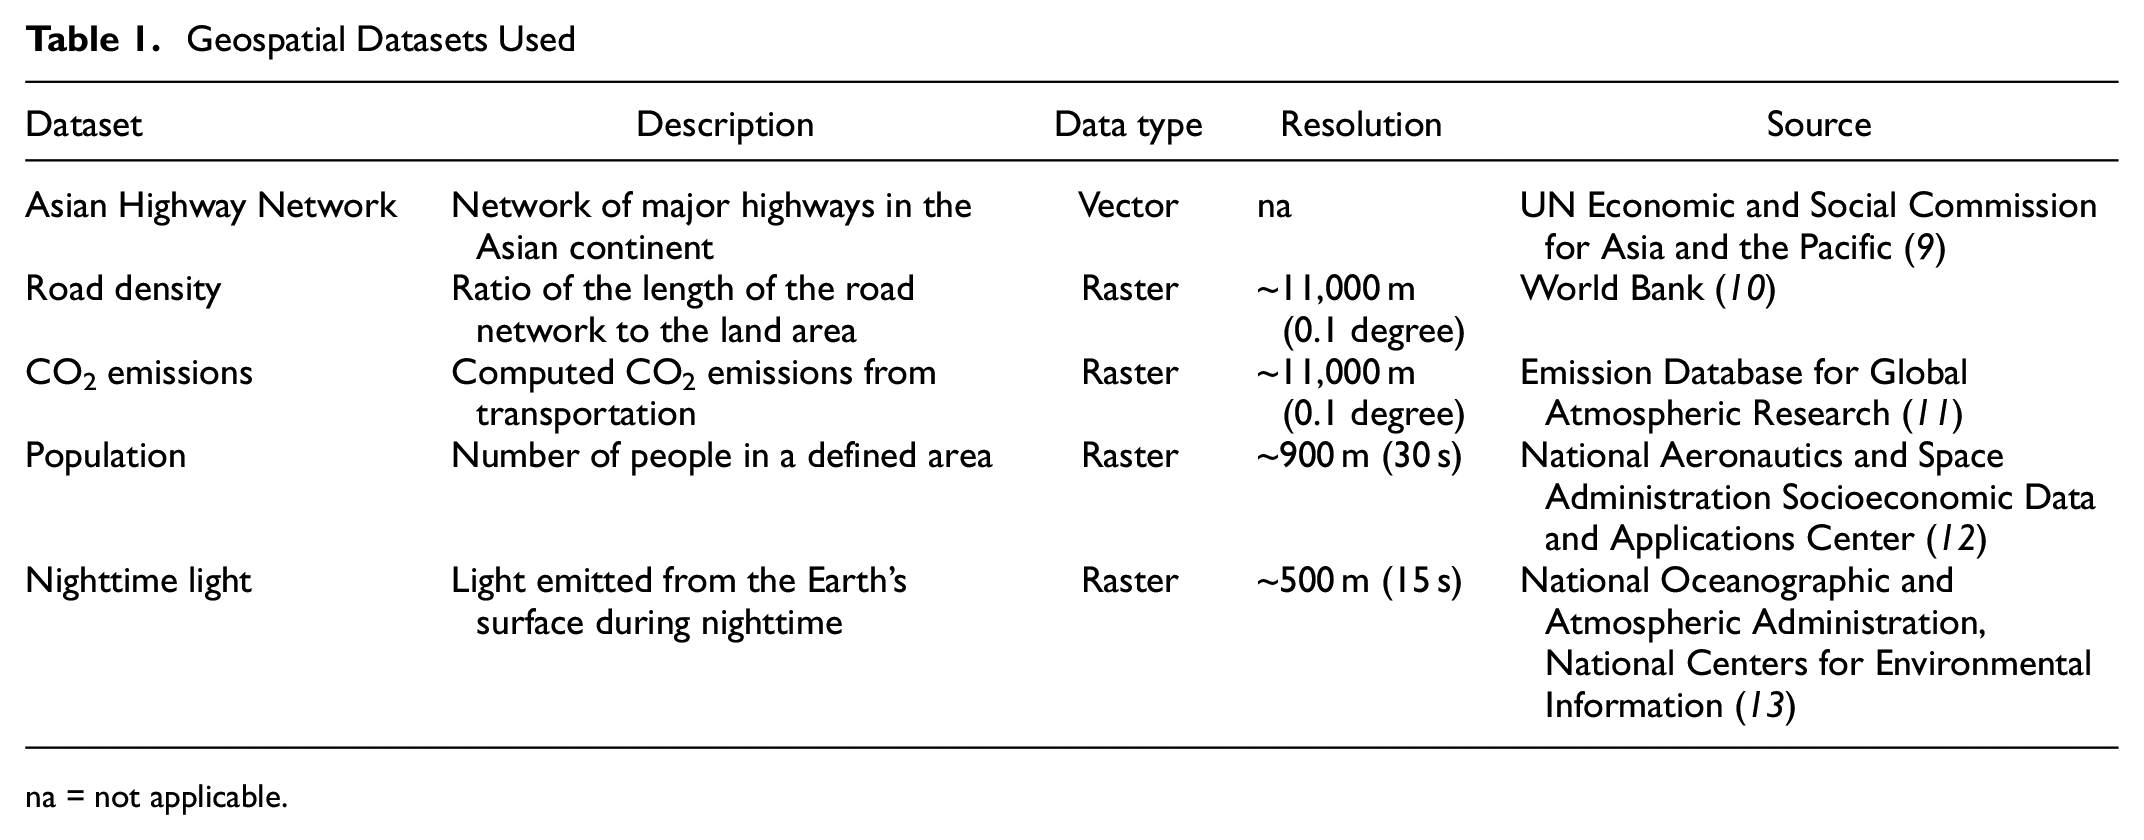
na = not applicable.
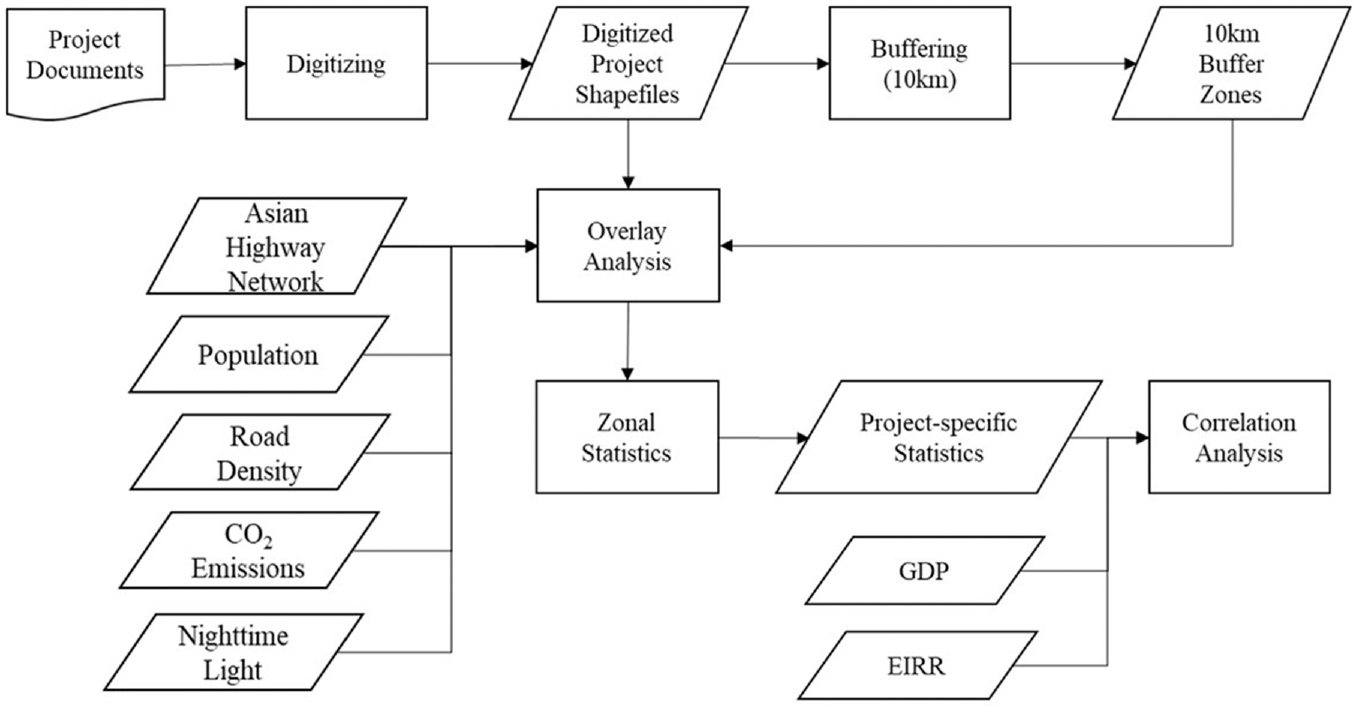
Research methodology.
A limited number of studies have applied GIS to monitoring and evaluation, so there is no established method of determining the ideal radius of buffer zones. In a publication entitled Infrastructure Needs Program in West Bank and Gaza, USAID reported on a geospatial impact evaluation of small, rehabilitated segments of rural roads, 1 km to 15 km in length ( 6 ). It used a 5 km buffer around each road segment to identify a catchment area that had the potential to receive economic benefit from the road improvements. In contrast, the roads and railways assessed in this study were major routes with an average length of about 118 km. A 10 km buffer zone was therefore used for this study.
Like the USAID study and others ( 14 – 19 ), the current study used remotely sensed nighttime light as a proxy for economic development. Henderson et al. have argued that nighttime light is a strong proxy for gross domestic product (GDP) and an accurate measure of short- and long-term economic growth at the country level ( 20 ). Another advantage of GIS is that the shapes of the area for evaluation can be flexibly designed by evaluators and researchers. For example, national or local governments can use their official administrative boundaries.
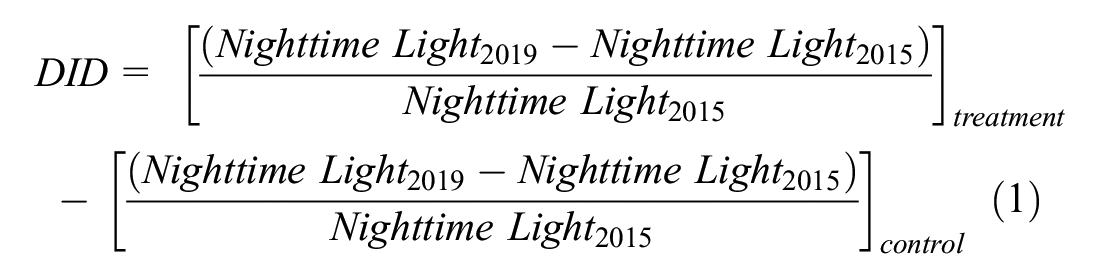
The difference in differences (DID) methodology was applied to the impact evaluation of components 1 and 2. The methodology originated in the field of econometrics and uses a quasi-experimental design that makes use of data from treatment and control groups to obtain an appropriate counterfactual to estimate a causal effect. DID is typically used to estimate the effect of a specific intervention or treatment by comparing the changes in outcomes over time between the intervention group and a control group ( 21 ). Remotely sensed nighttime light was used as an indicator of impact. The impact measured by nighttime light indicates changes in local economy in the buffer zone.
For the project level impact assessment (component 1), two control groups (road sections) were identified, based on consultations with the government, the consultants who worked for the project, and local people. The growth rates of nighttime light in the project roads’ buffer zones were computed for two periods: one a year before project completion (2015), and the latest year for which data were available (2019). Similarly, the growth rate of nighttime light was computed for two control group roads which had been identified as being similar to the project sections (the different roads in the same trend of economic development in the same time period). DID was derived as the difference between these two groups as shown in Equation 1.
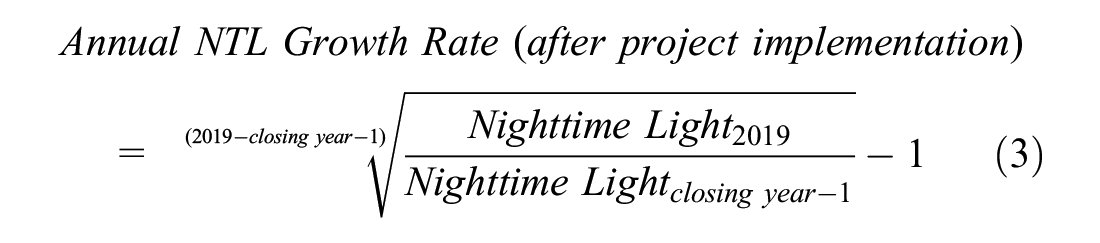
For the impact evaluation at the sector level, it was not feasible to identify control groups at the same quality level for the 33 road sections in 16 countries. Therefore, the DID analysis at the sector level followed the methodology of USAID ( 6 ): the control group was the same project road alignment, but before project implementation (at the same location but different timeframe), instead of identifying control groups with similar economic situations to those of the project roads. The study set a period of “before completion” from 2009 to 2012, and a period of “after completion” from 2015 (a year before project completion) to 2019. Thus, 33 projects completed in 2013, 2014, and 2015 were assessed. The study measured the annual growth rate of nighttime light before project completion, the annual growth rate of nighttime light after project completion, and DID (Equations 2 to 4).


In addition, the analysis also compared the result of impact assessments with the economic internal rates of return (EIRRs) of the projects, as calculated in the relevant ADB project completion reports. Calculating the EIRR is the standard way ADB assesses the economic impact in of its interventions.
Results and Discussion
Impact Analysis at the Project Level With Difference in Differences
The first component of the impact evaluation at the project level reviewed the North–South Road Corridor Investment Program (Tranche 1) in Armenia. ADB provided a multitranche financing facility (MFF) investment loan consisting of three tranches to support the Armenian government’s program to reconstruct the entire Agarak–Kapan–Yerevan–Gyumri–Bavra North–South Road Corridor (NSRC). The corridor complements the East–West Highway between Azerbaijan and Georgia (Figure 3).

Map of Armenia showing North–South Road Corridor and Asian Development Bank support.
Following the approval of the MFF, ADB approved tranche 1 of the project amounting to $60 million in 2009, together with government financing of $10 million. Tranche 1 improved two road corridors leading from the capital city Yerevan: the 10 km section from Yerevan to Ashtarak (Section A) to the north and the 19.6 km section from Yerevan to Artashat (section B) to the south. The succeeding tranches are still ongoing. The authors carried out the impact evaluation using GIS as part of a project performance evaluation study of two sections completed by tranche 1 ( 22 ). The authors examined the incidence of nighttime light in the project area before and after the project to determine how it indicated the amount of development in the zone of influence.
The project was physically completed in June 2016. Figure 4 shows the nighttime light status of the entire country in 2015 (i.e., before physical completion of the project) and 2019 (i.e., the status at the time of an evaluation mission about 3 years after physical completion). The total nighttime light of the country was 59,100 radiance, measured in nanowatts per square meter per steradian (nW/m2-sr), in 2015 and 79,900 (nW/m2-sr) in 2019, a growth rate of 7.8%.

Nighttime light in Armenia.
A 10 km buffer zone along the road sections was used to define the impact area of the project. Section A traverses Yerevan province for a few kilometers, but the national capital area was excluded from the buffer zones because the nighttime light had already reached saturation point before 2015. Measuring economic development in urban areas requires another dimension, the height of buildings, to be taken into account. However, these data were not available for the evaluation periods.
To assess the project’s impact, DID methodology was applied. Control roads were selected for DID. These had profiles of road type, length, and locations similar to sections A and B before the project. These control roads represented a “without project” scenario. The 20 km of the M4 road from the border of Yerevan to Hrazdan, and the 20 km of the M5 road from the border of Yerevan to Armavir were chosen as control roads (Figure 5), following consultations with various stakeholders, including the project team of ADB, the staff of the Ministry of Territorial Administration and Infrastructure, and staff of the European Investment Bank in Armenia.
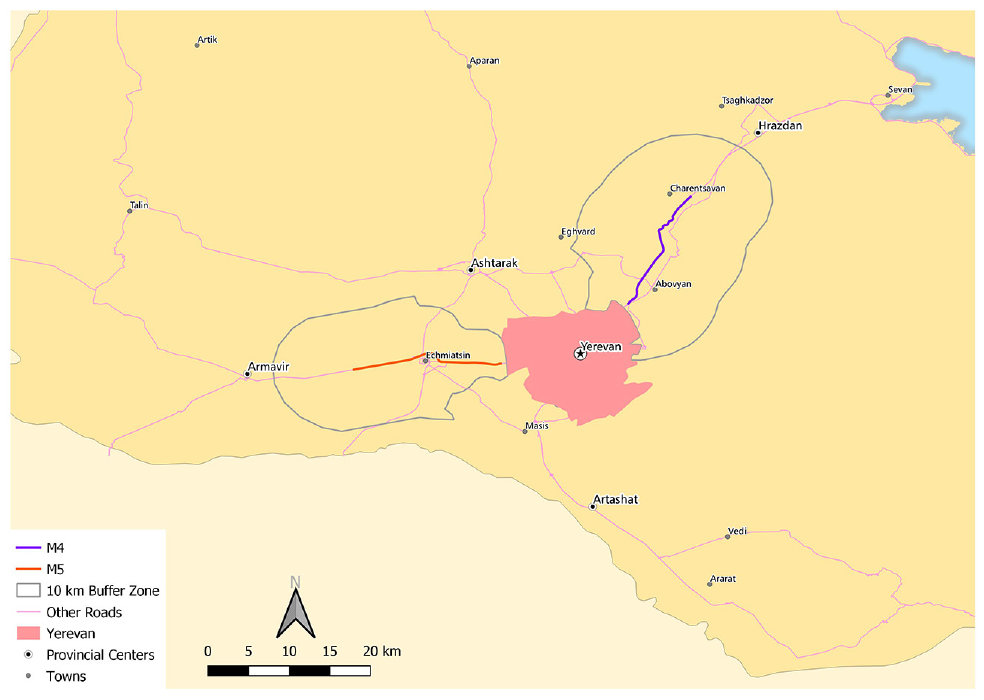
Project roads and control roads.
Table 2 shows the changes in the nighttime light in the project sections and in the control roads from 2015 to 2019. The nighttime light annual growth rate for section A was 9.8%, higher than the national growth rate of 7.8%. The growth rates for the control roads were 7.2% for the M4 road and 4.9% for the M5 road. Thus, the DID of section A with the M4 road was 2.6% and with the M5 road it was 4.8%. The growth rate for section B was 9.7%, almost the same as section A. The DID of section B with the M4 road was 2.5% and with the M5 road it was 4.8%. The annual growth rates of the project areas were clearly higher than the control groups by at least by 2.5%. Figure 6 shows the buffer zone of section B and the nighttime light in 2015 and 2019. The nighttime light analysis showed that economic activities in the project areas had grown more rapidly than in other areas and had made a positive contribution to economic development.
Computation of Nighttime Light Growth During Construction and After Opening, and the Difference Between the Tranche 1 and Control Roads
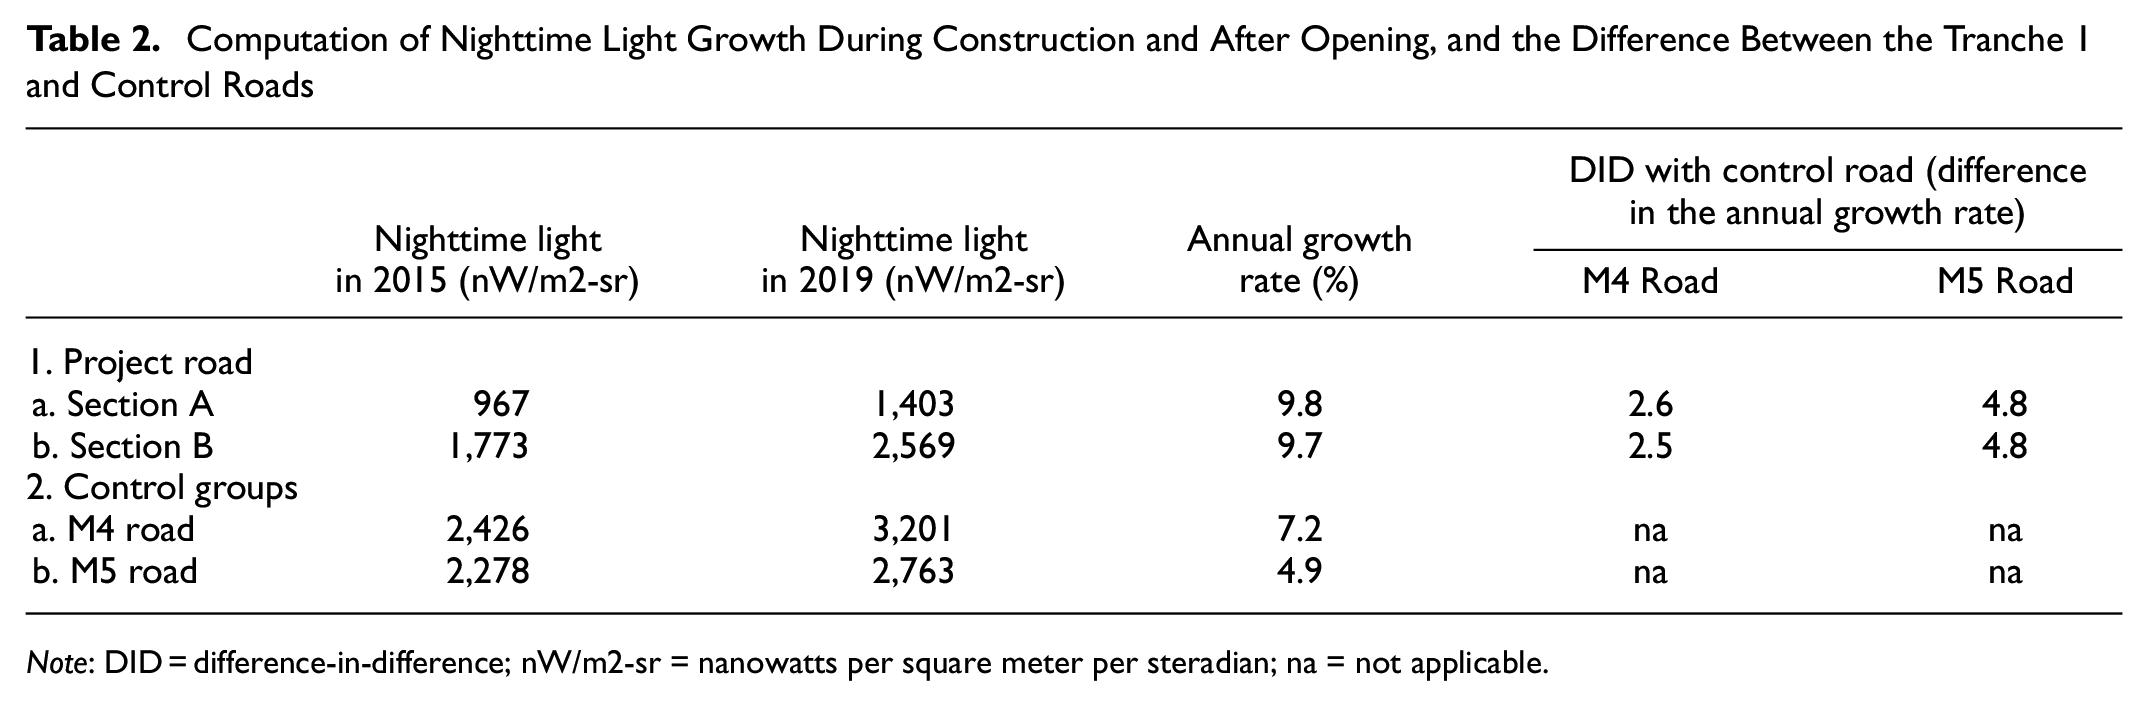
Note: DID = difference-in-difference; nW/m2-sr = nanowatts per square meter per steradian; na = not applicable.

Nighttime light along section B in 2015 and 2019.
The results of the impact evaluation using GIS were very consistent and were validated by feedback from residents along the two improved road sections ( 22 ). The interviews confirmed that the travel times on the improved road sections had been reduced, and that the local population had greatly benefited from improved access to socioeconomic facilities. The interviews revealed that the project had also had gender benefits, since many women in the project areas were engaged in agricultural activities or small or medium-sized agro-industries. Their lives had been improved by the reduced travel time and greater availability of transport services, which had increased their access to markets and social service institutions and created employment opportunities.
The authors compared the result of the impact assessment with the economic analysis done by the project performance evaluation study ( 22 ). It is mandatory for ADB to estimate the EIRR of a project to assess its financial viability. The standard evaluation period of EIRRs is 20 years. The EIRR is a major benchmark for decision making and results monitoring and is part of the decision to approve a project and to evaluate its economic benefits after completion. The minimum requirement of an EIRR is 12%; if the EIRR of a project is less 12%, it means the project was not efficient. If the EIRR of a project is equal to or more than 12%, it means that the project used financial resources efficiently.
EIRRs of ADB transport projects mainly measure benefits enjoyed by road users and administrators such as time savings, reductions in vehicle operations costs, and savings to asset owners, such as reductions in maintenance costs. EIRRs occasionally cover savings from reductions in road accidents, but none include the benefits to local residents along road alignments because of the difficulty of obtaining data to measure the local economy. A project’s EIRR focuses on direct benefits, mainly for transport users. By contrast, nighttime light, a proxy for local economic growth, represents indirect benefits in local areas. Thus, an impact assessment complements the EIRR and helps to provide a holistic understanding of a project’s contribution to growth. Triangulating the result of the impact assessment with the EIRR is still useful because a strong positive correlation should exist between them.
The economic analysis to arrive at the EIRR comprised vehicle operating cost savings and time savings. The evaluated EIRR for section A was 20.0% and that for section B was 20.8%. Both were considerably higher than the thresholds of 12%, 8%, and 8.8%. In comparison with the EIRRs of both sections, the DID for the control roads (Table 2) is smaller than the modified EIRRs (by deducting 12% from the original EIRRs) but consistent with the conventional economic analysis. A possible reason for the smaller impact of economic development is that the impact assessment with nighttime light assessed only the first few years after completion when the impact may not have been apparent, while the EIRRs estimated the economic impact for 20 years.
Geographic Portfolio Analysis at the Sector Level
The second component at the sector level computed the road density, amount of CO2 emissions, and populations of the 163 ongoing and completed projects. The study aggregated them by country to review overall ADB support by country.
One advantage of applying GIS to evaluation and monitoring is the sheer number of projects that can be assessed using the same standards and data quality, regardless of the size of areas, countries, and regions. This is not possible when using country-based statistics, which have different standards and levels of data quality and availability. This section reports on an evaluation of the geospatial portfolio of all ADB transport projects implemented during 2010 to 2019, including those approved before 2010 but implemented during the period, to review strategic relevance.
ADB projects aim to improve the socioeconomic conditions of their beneficiaries, so identifying locations where interventions are most needed requires data-driven decision making. The following sections examine ADB’s road projects for their impact on regional cooperation, population, accessibility (as a function of road density), and CO2 emissions. In total, 163 road and rail projects were digitized and assessed. Figure 7 shows all locations of ongoing in blue and completed projects in red.
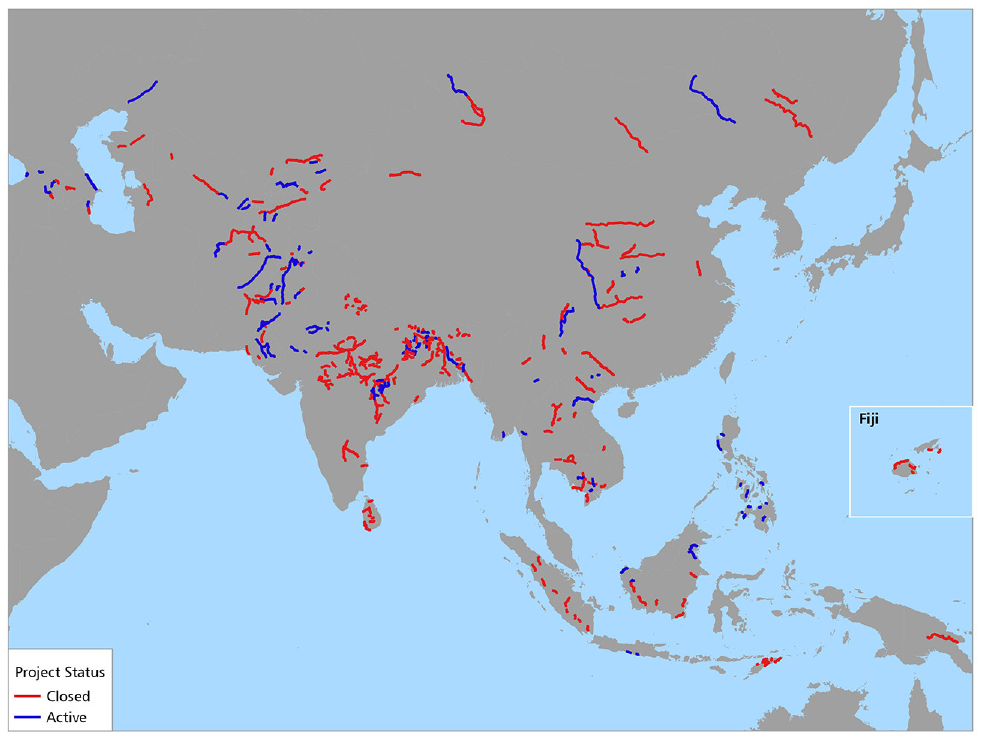
Locations of Asian Development Bank road and rail projects.
Figure 8 overlaps the project sections against the alignment of the Asian Highway Network. The map clearly shows that, while most of the ADB support in the Central and West Asian Region was along the network, outside this region only a few projects financed by ADB were located along the network. This is because most countries in the Central West Asian Region belonged to the former Soviet Union, and key infrastructure was in a deteriorated state when the Soviet Union was dissolved. The reconstruction of the Asian Highway Network is a priority for these countries.
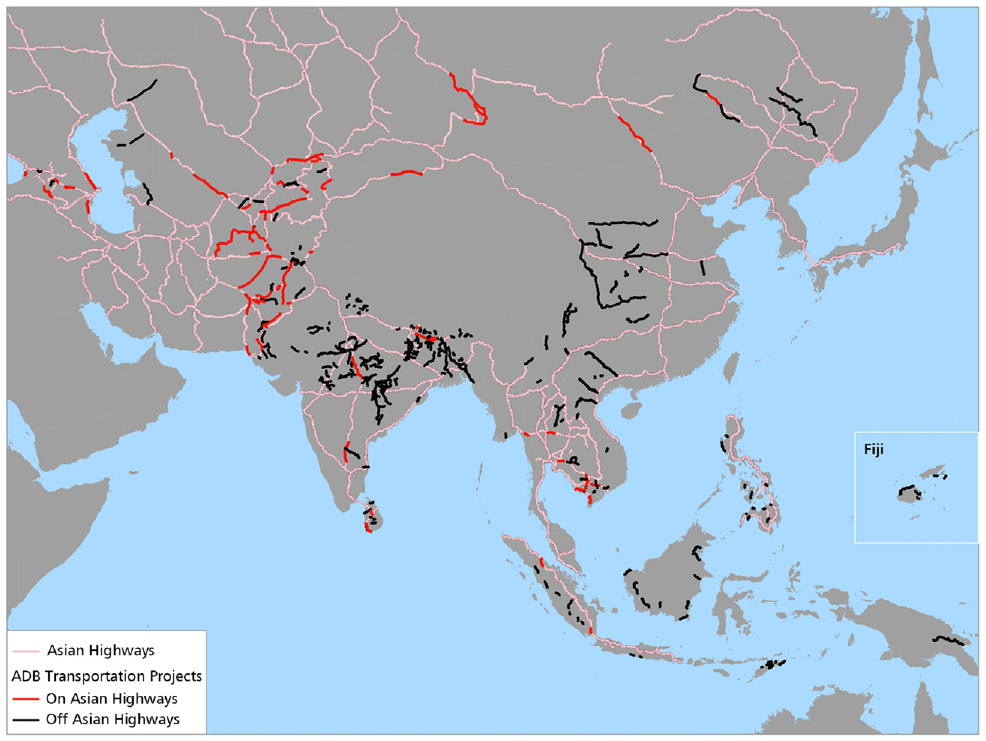
Project locations and the Asian Highway Network.
Population
The size of the population affected by ADB projects is one of the most important indicators of how ADB support has contributed to poverty reduction. Figure 9 shows the distribution of ADB project locations and population density in 2015. About 289 million people lived along the alignments of the 163 projects (Figure 10). They were potential project users and beneficiaries, as was the passing traffic. India had 94 million potential project beneficiaries. Bangladesh, the People’s Republic of China, Nepal, Pakistan, and Vietnam all had at least 10 million each. About 57 million of these potential beneficiaries (20%) were poor. In India alone, out of 94 million living along the project sites, 20 million lived below the poverty line. The study used poverty rates at the national level; if geospatial data on poverty by area becomes available, it will improve project planning and design since ADB’s objective is poverty reduction. With the application of GIS, the size of the population and the number of poor people can be used as monitoring indicators at sector and project levels by ADB, other international organizations, or national agencies.
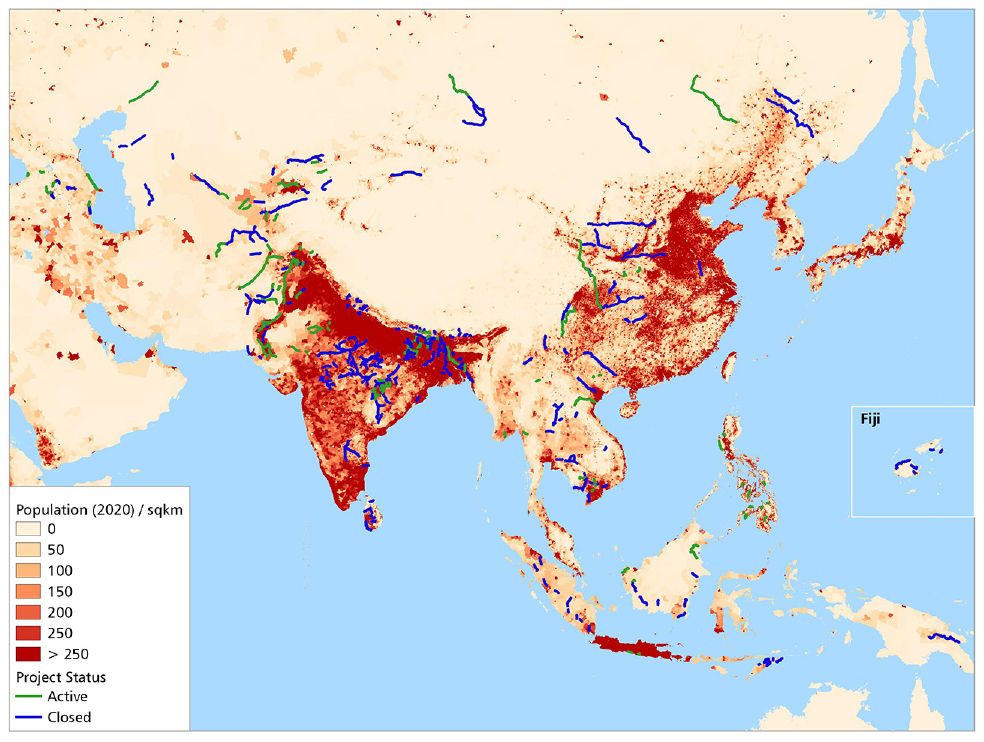
Project locations and population density (2020).
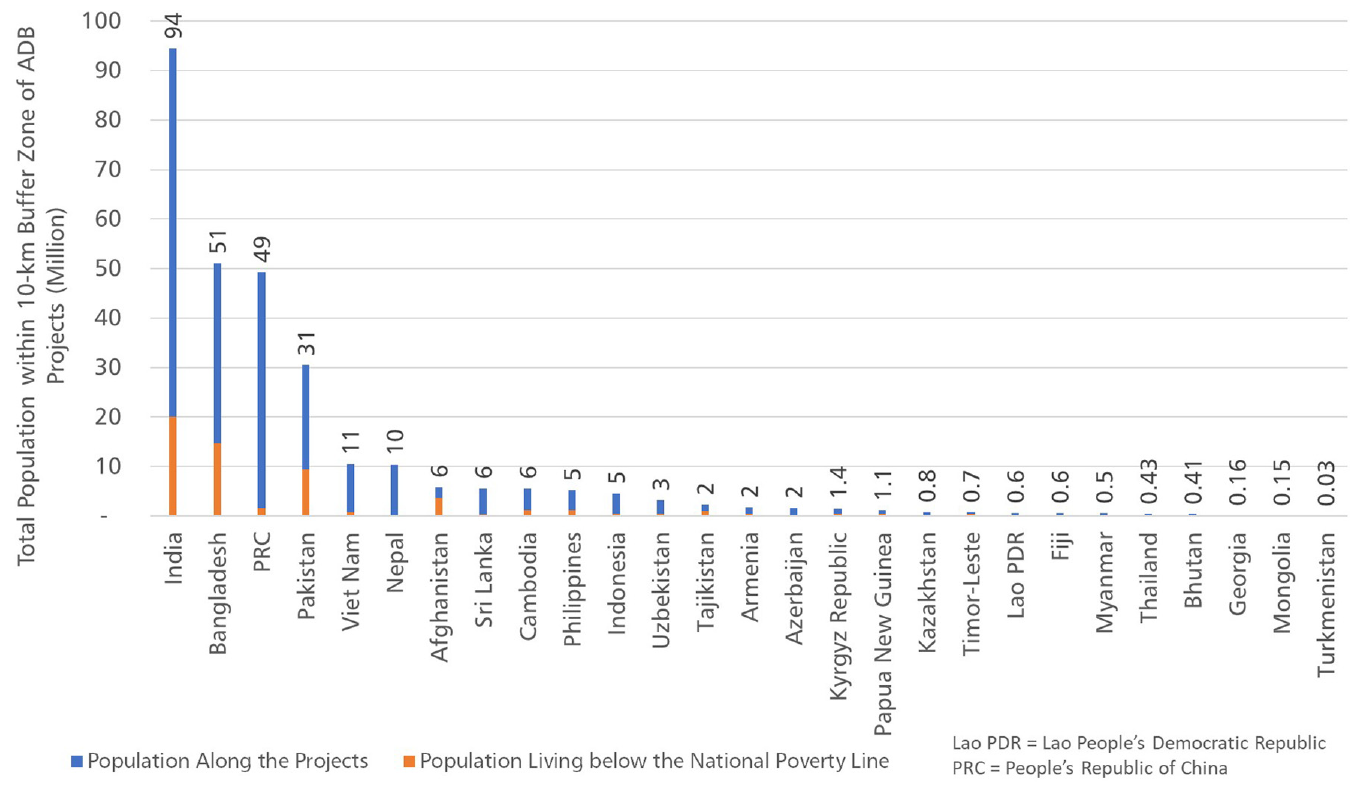
Population living below the poverty line by country (2015).
Road Density
Most of the 163 projects were in rural areas with road densities of less than 500 m/km2. Figure 11 shows the project locations, overlaid with the World Bank’s 2018 road density data.
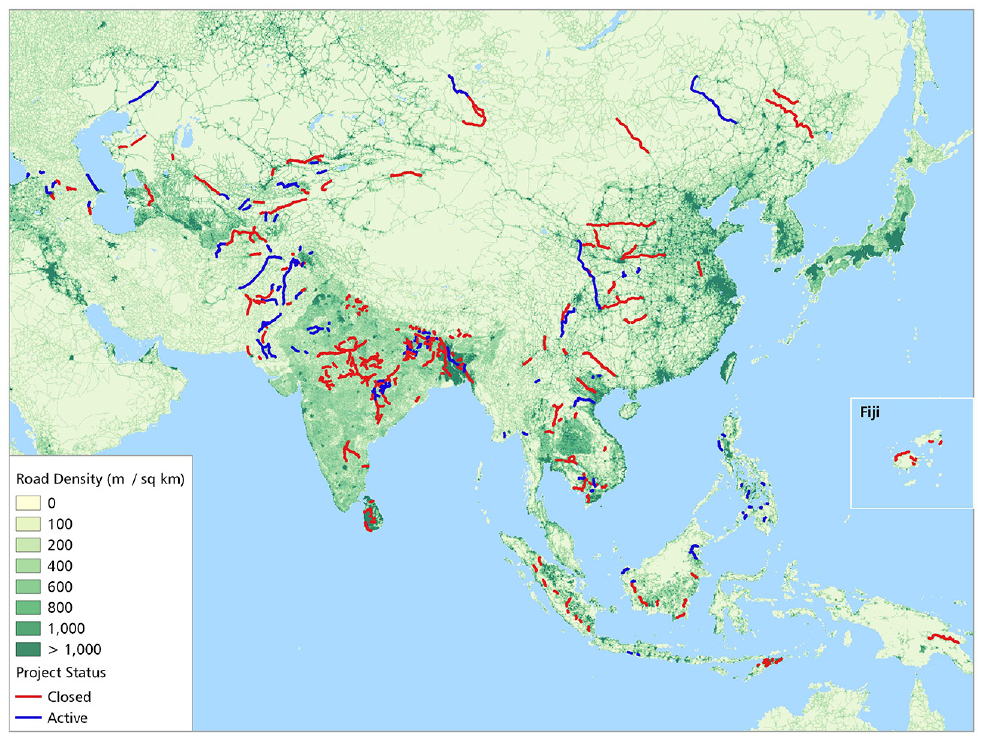
Project locations and road density (2018).
The ADB road projects were located in areas of slightly higher than average road density (Figure 12). Most of projects carried out rehabilitation or improvement within the right of way and were in rural areas where it is very important to cooperate with other sectors to maximize the benefits of integrated development.
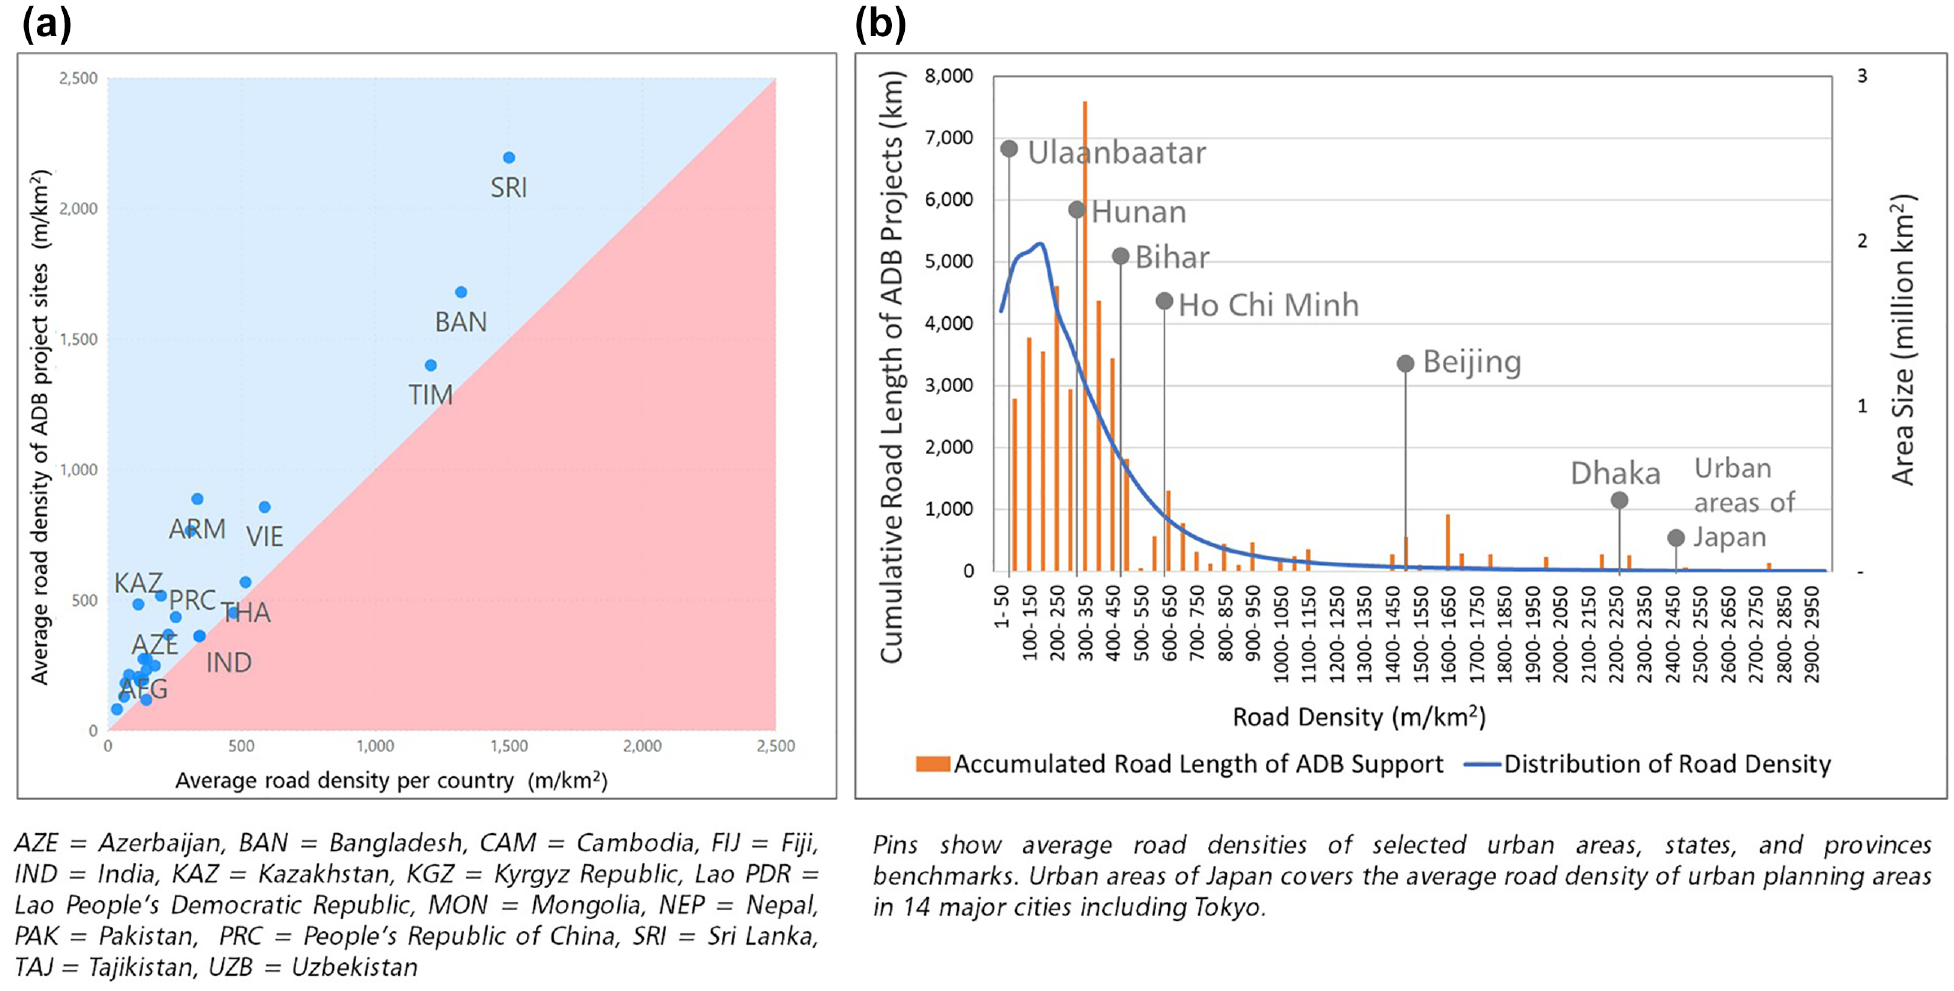
Average road density of Asian Development Bank (ADB) projects compared with country average (a) and distribution of ADB road projects by country (b).
Existing CO2 Emissions
The study also reviewed the climate change sensitivity of the project sites by counting the amount of CO2 emitted based on the database of CO2 emissions from transport (Table 1). Figure 13 shows the distribution of the project locations and the estimated CO2 emissions. While the study did not estimate the increase in CO2 emissions by ADB projects, it did review the status of CO2 emissions from the transport sector in the project sites in 2018. This is a useful way of monitoring traffic and can contribute to decisions on actions needed for climate change mitigation.
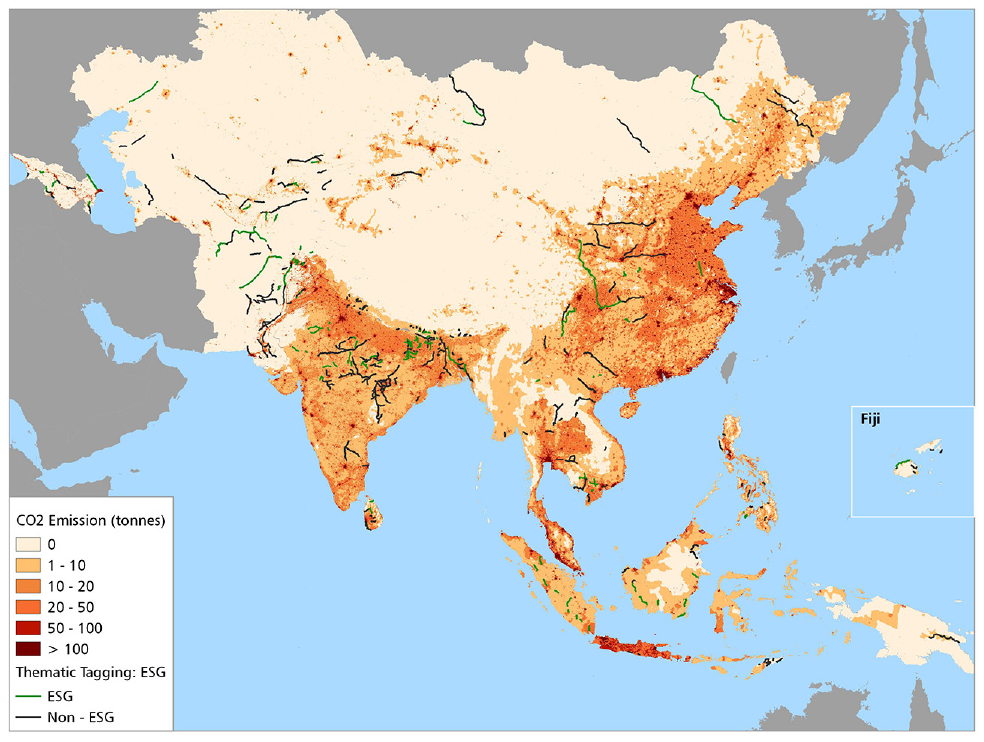
Project locations and estimated CO2 emissions from the transport sector (2018).
Figure 14a shows the total amount of CO2 emission in the buffer zones of the project sites. Countries with high CO2 emissions include the People’s Republic of China (PRC) and India, where ADB has financed many projects. The total amount of CO2 emissions from the project sites of those two countries were double the total amount produced by ADB projects in the remaining 25 countries.
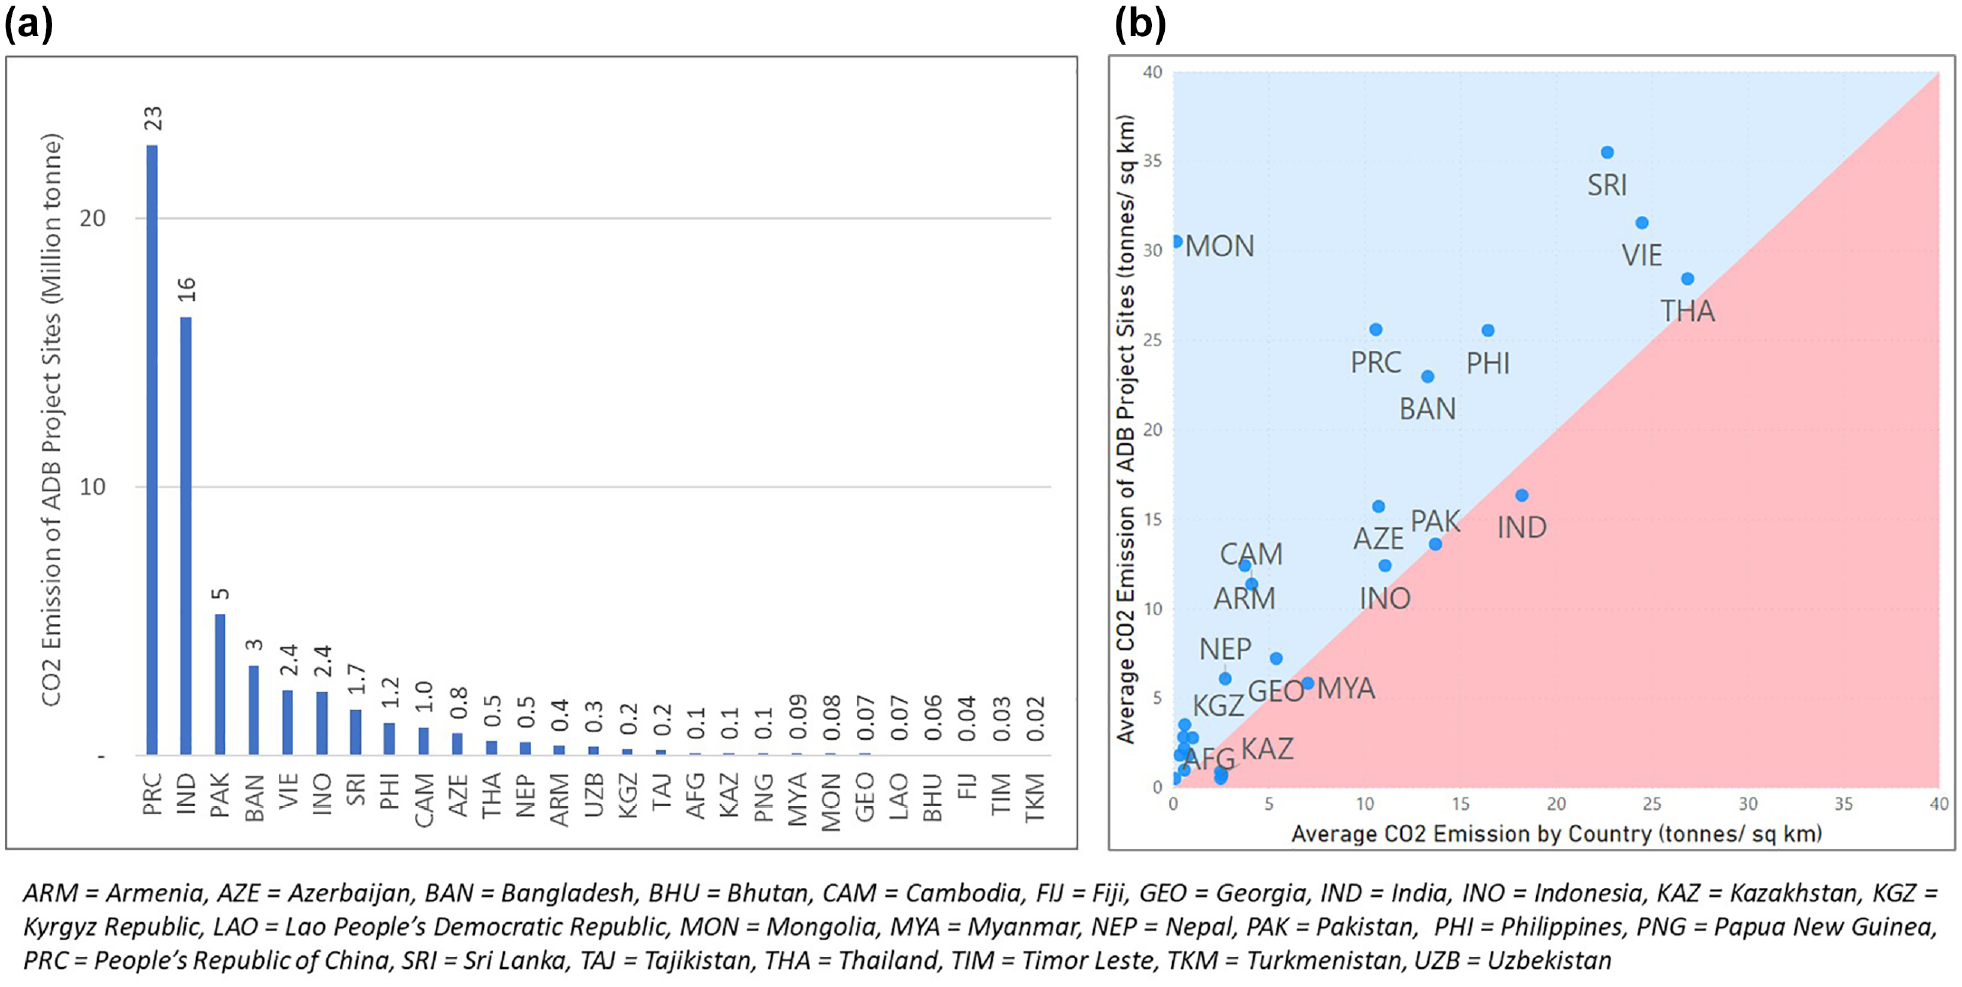
Total CO2 emissions of Asian Development Bank (ADB) projects per country (a) and average CO2 emissions of ADB projects compared with country average (b) for 2010 to 2019.
Figure 14a compares the country average for CO2 emissions per square kilometer with emissions in the areas surrounding the ADB project sites. ADB projects in Mongolia, PRC, Bangladesh, Philippines, Sri Lanka, and Viet Nam were located in areas with higher CO2 concentrations than the country average. While ADB projects are usually in rural areas (based on road density, see Figure 12), the areas surrounding the project sites emitted more CO2 than average, indicating that ADB projects are located in climate-sensitive and rapidly growing areas. Thus, both ADB and countries receiving ADB projects need to exert efforts for sustainable development.
Economic Impact Analysis with Nighttime Light
Aggregated Growth of Nighttime Light by Country
Changes in nighttime light in a project area were measured for their correlation with the economic development of the surrounding area. Of the 163 projects examined, the study focused on 33 road and rail projects completed in 2013 to 2015. Figure 15 shows the distribution of the 33 project locations and the nighttime light. The associated socioeconomic development of an ADB project was assessed by changes in the nighttime light within a 10 km buffer zone along its alignment.

Locations of 33 projects and nighttime light in 2019.
Figure 16a shows the aggregate increase in nighttime light per year by country, approximating the annual economic growth of the project site. India had the largest growth in nighttime light of the 16 countries where the ADB projects took place, far higher than any other country, followed by the PRC, Bangladesh, and Cambodia. The annual increase in nighttime light in the other countries gradually decreased to almost zero (mainly in Central and West Asia). Figure 16b relates the increases in nighttime light to the project cost, as a proxy for efficiency. The projects in Bangladesh, Cambodia, Nepal, the Lao People’s Democratic Republic, and Nepal were more efficient than those in other countries despite achieving only a moderate increase in the total amount of nighttime light. The performance of India is notable: it tops the table for growth and is in second place for efficiency. The analysis reveals that countries in Southeast and South Asia achieved efficient socioeconomic growth, but that countries in Central and West Asia performed poorly for both the amount and the efficiency of the growth in nighttime light. The PRC ranked second for the increase in nighttime light per project, but lowest for the increase in nighttime light related to project cost.

Increase in nighttime light per Asian Development Bank project (a) and increase in nighttime light related to project cost (b).
The following observations can be made for countries that appeared to offer low increases in nighttime light per million U.S. dollars of project cost: (i) the sections of ADB support were often missing links in a transport network or high-speed transport projects, with few beneficiary areas nearby; (ii) ADB support was typically for advanced infrastructure investment for developing new areas, and such investment requires longer-term monitoring; and (iii) although the total economic benefit was not high in these areas according to the increases in nighttime light, nevertheless the projects had benefits, since transport is a basic human need, especially in areas with high rates of poverty.
Across the 33 projects, the average increase in nighttime light was 11%, which is higher than the increase in GDP for the 33 projects in the same period (5.5%). The analysis does help in assessing whether ADB placed its transport projects in the right locations, that is, those that can catalyze economic development. The results of the nighttime light analysis suggest that many ADB projects contributed to economic growth or were in the right location to gain the maximum potential for economic development once the transport infrastructure was in place. The extent to which increases in nighttime light can be attributed to ADB projects is assessed in the following section after a discussion of the correlation between population and nighttime light with the DID methodology.
Correlation Between Nighttime Light and Population
Increases in population in the project areas of the 33 completed projects between 2013 and 2015 were also computed, using the same methodology as the nighttime light analysis based on data from the National Aeronautics and Space Administration Socioeconomic Data and Applications Center ( 12 ) (Table 1). Figure 17 shows that the total amounts of nighttime light and the population increased in the project areas from the base years of each project to 2019. The three countries that experienced the biggest changes were India, the PRC, and Bangladesh. Limited changes were seen in the other countries, although Sri Lanka and Nepal also showed some growth. The directions all the countries took were similar. Most observed significant increases in nighttime light, but only limited increases in population. The socioeconomic activities with which nighttime light is correlated are very responsive to infrastructure investments, even in the short term. Population is not very responsive to infrastructure investment in the short term, although it could be in the long term.
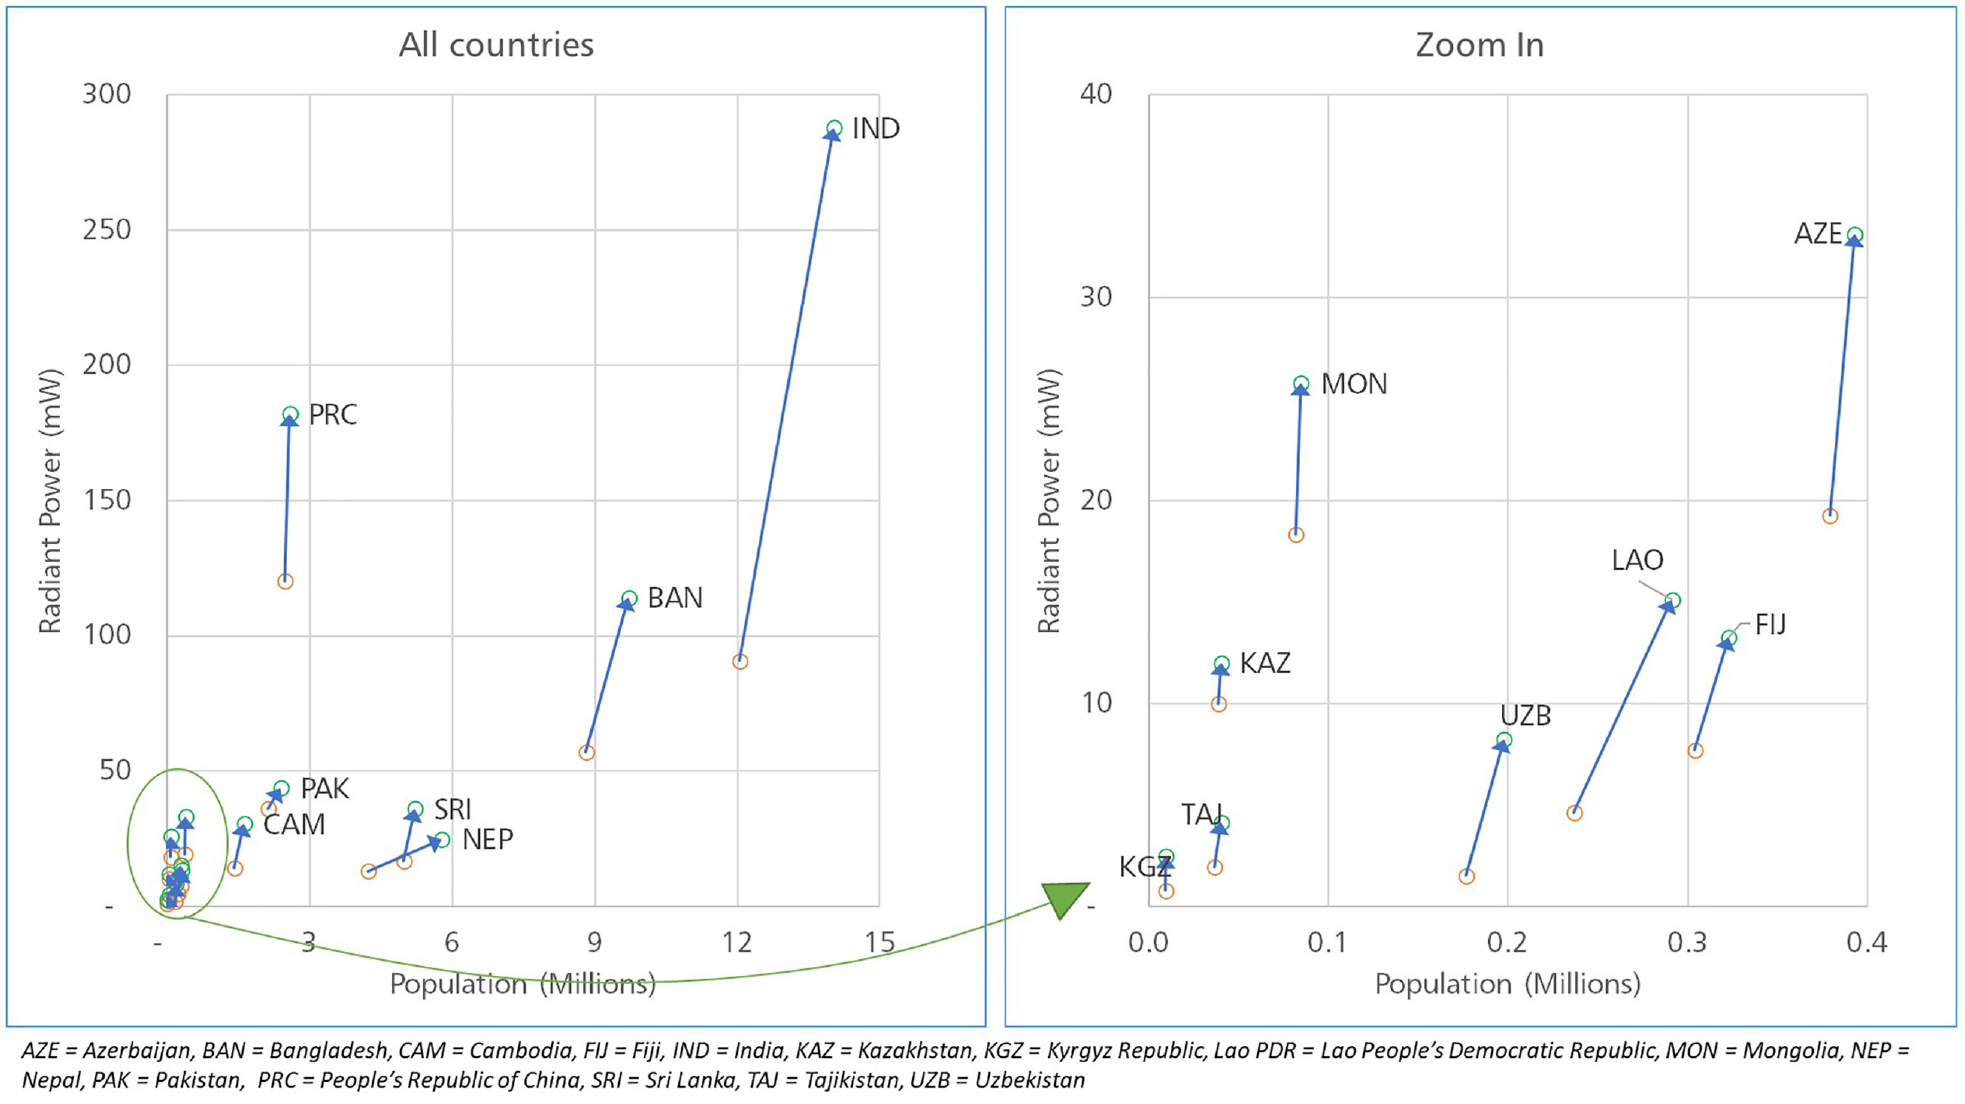
Increase in nighttime light and population in completed projects.
Nepal experienced significant population growth around the seven road alignments that were constructed with ADB support (Figure 18). The population increased in two alignments near the border with India and in another section in Kathmandu. Compared with population growth, the increase in nighttime light, which is a proxy of socioeconomic activity, was limited. This implies that comprehensive social sector support may be needed around the border and in the capital, because most of the increase in population could be as a result of migration from other countries to Nepal, from rural areas to urban areas, or from mountainous areas to flatlands.
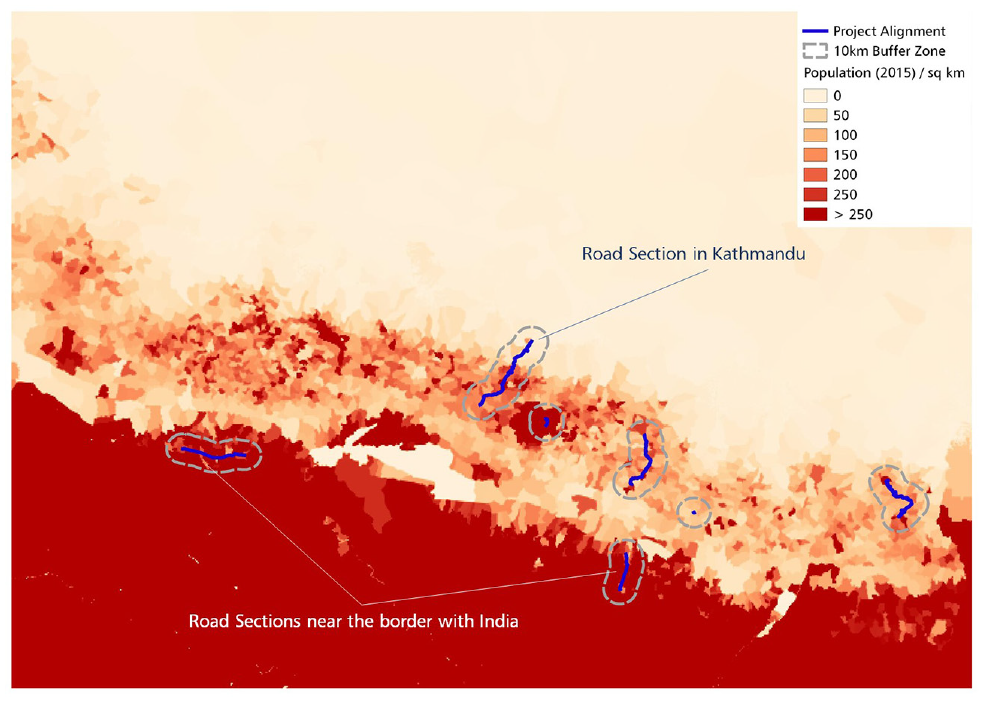
Project sites in Nepal.
Impact Analysis Using DID at the Sector Level
This section reports on the use of DID to assess the contribution of ADB support to economic development in the project areas. The control groups were in the same project alignment but in a different time frame as it was not possible to identify road sections with economic situations similar to those of the project highways. The study set a period of “before completion” from 2009 to 2012, and a period of “after completion” from a year before project completion to 2019.
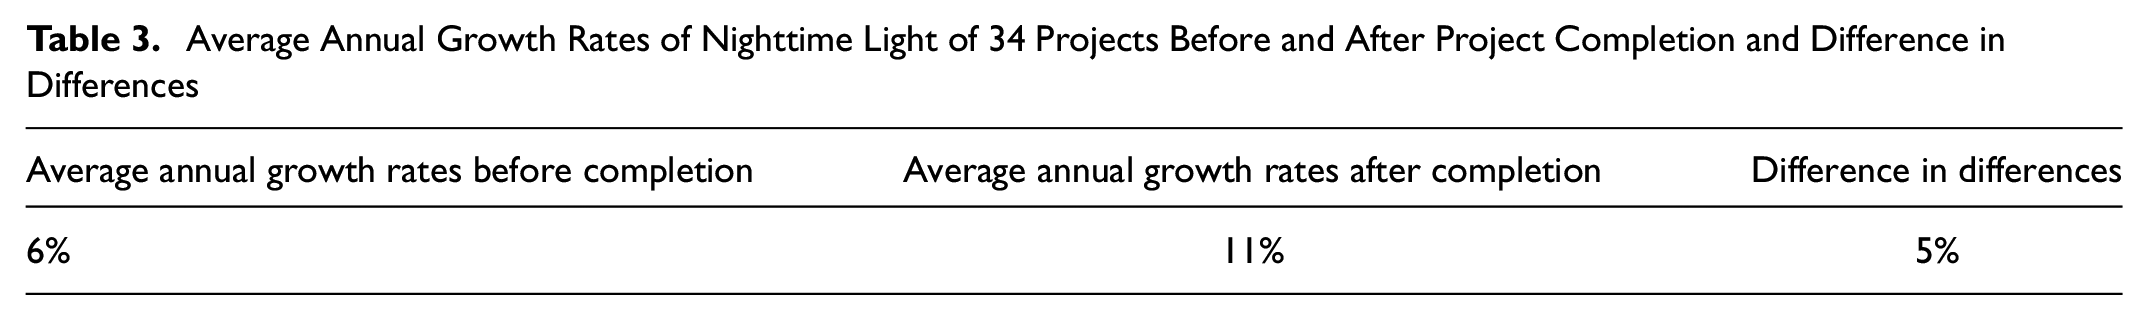
Table 3 shows annual growth rates of nighttime light before and after project completion and the DID of the 33 projects. The average annual growth rate of nighttime light before project completion was 6%. This is consistent with the general GDP growth rate in developing countries. The average annual growth rate of nighttime light after project completion was 11%, almost twice the rate before project completion. Thus, the average DID is 5%, indicating the very positive contribution of ADB projects to economic growth around the project areas.
Average Annual Growth Rates of Nighttime Light of 34 Projects Before and After Project Completion and Difference in Differences
The aggregated result of the 33 projects was very good as about a half of the total growth is the contribution of the ADB projects. Further research is needed for the project-level assessment, including setting up appropriate impact zones by project. Figure 19 shows the ranges of the growth rates of nighttime light and the DID. The annual growth rates of nighttime light before project completion ranged from −9% to 16%. There were three projects which showed negative growth before project completion (in the PRC and Kazakhstan). Similarly, the annual growth rates of nighttime light after project completion ranged from −3% to 30%. There were three projects with negative growth rates in Kazakhstan and Pakistan. For DID, the range was −11% to 24%.
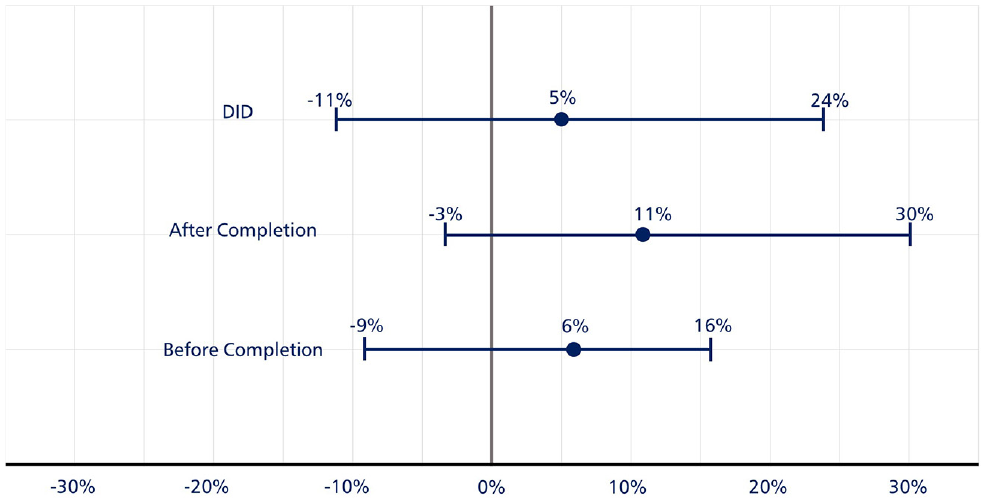
Ranges of growth rates and difference in differences.
For the project-level evaluation, the buffer zone and timeframe need to be specified because, as mentioned above, a possible explanation for negative growth after project completion is that ADB support was often for missing links in the transport network and there were no beneficiary areas nearby for some projects. The 10 km buffer zone and the DID of the same segment but with a different time frame can show reasonable results at the sector level when more than a dozen projects are aggregated.
Comparing Increases in Nighttime Light With Economic Internal Rate of Return
The study then examined the relationship between the change in nighttime light and project EIRRs. Figure 20 shows the linear relationship between the two. A positive trend can be discerned, although it is not yet statistically significant. EIRRs ranged between 6% and 37%. The modified range (by deducting 12%, the baseline of EIRRs) was between –6% and 25%, with an average of 5%. The economic analysis with EIRRs was very consistent with the impact analysis with nighttime light.
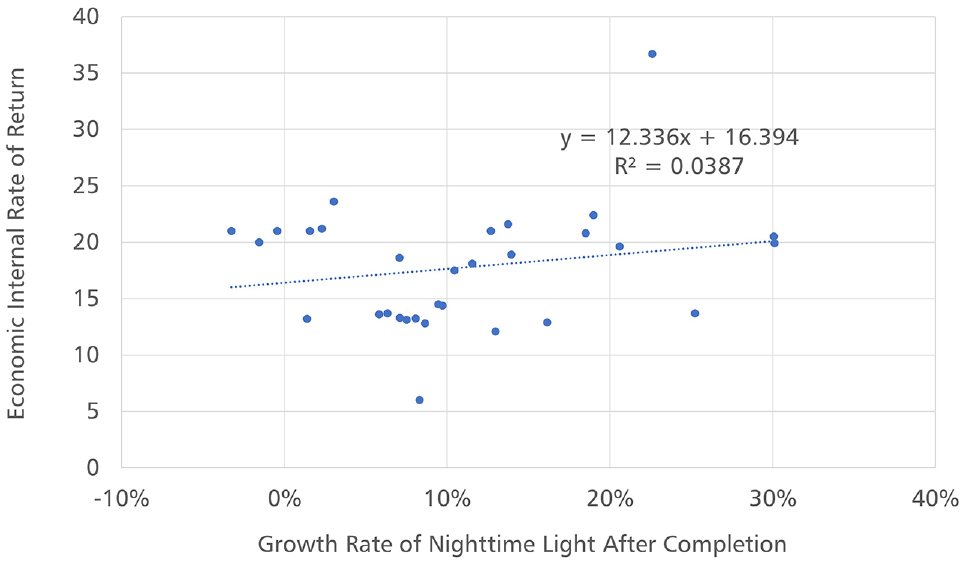
Correlation between growth rate of nighttime light and economic internal rates of return (EIRR).
Conclusion
This study analyzed the geospatial characteristics of a portfolio of 163 ADB transportation projects. For the impact assessment at the project level and sector level, the DID technique, which originated from the field of econometrics, was applied in two different ways. The first used areas with economic conditions similar to the project areas as control groups during the same observation period. The second was used as part of the sector level analysis; the same road segment as the project area was evaluated but at a different time, before and after project completion.
The geospatial portfolio analysis generated three main findings. First, GIS analysis is a useful and convenient way to identify a transportation project’s geographical relationship with other infrastructure such as the Asian Highway Network. Understanding road densities is a useful way to select the right locations for road projects and their road designs. Second, ADB’s presence was visible and significant as about 290 million people live along the road alignments and are potential beneficiaries of ADB transport projects. If local poverty data are available, it will be possible to improve project designs to support poverty alleviation. Population density can also be an indicator for results-based lending. Third, the calculation of CO2 amounts emitted in the project areas is crucial in the design of projects, particularly those located in areas with high CO2 density from transportation. In the long term, it can be used to monitor project impact on CO2 emissions.
The first impact analysis assessed the North–South Road Corridor Investment Program (Tranche 1) in Armenia financed by ADB, which improved 26.9 km of national highways near the capital, Yerevan. The DID of the two sections with their two control groups ranged between 2.5% and 4.8%, which represented the contribution of the project to economic development. The impact analysis of nighttime light with the DID methods confirmed the views of local residents who reported that travel times had been reduced, and that they had benefited from improved access to socioeconomic facilities. The project also had positive impacts on gender concerns, since many women in the project areas were engaged in agricultural activities or small and medium-sized agro-industries.
The second impact analysis was at the sector level. This measured the average increase in nighttime light and the DID of the 33 completed projects found that ADB support had had strong positive associated socioeconomic changes. The average annual increase in nighttime light, a proxy for socioeconomic growth, was 11%, and the average annual growth rate with DID was 5%. The GIS analysis successfully provided the quantitative data to enable ADB to evaluate its support at the sector level. The methodology could be used more widely to measure the indirect impact of transport projects.
Based on the findings above, applying GIS to impact analysis has the potential to provide a solution to a long-standing issue. Measuring the impact of economic activities around a project site has been a challenge for a long time. In the past, increases in tax revenues were used to measure the impact of large-scale projects such as expressway and bullet-train projects. However, this measure cannot be applied to small projects or to areas where tax data are not available. In such cases nighttime light offers a way for ADB to measure the indirect impact of its projects on the local economy.
The authors compared the impact of transport projects assessed by nighttime light with conventional economic analysis using EIRRs and observed a positive correlation between the two. Nighttime light is an indicator of the local benefits of economic growth, while EIRR is an indicator of transport users’ benefits. At present, ADB’s calculation of a project’s EIRR assesses only the benefits enjoyed by road users and administrators. If it could be extended to assess the economic benefits enjoyed by beneficiaries around the project areas, it would be possible to find the logical relationship between the two groups. The existing economic analysis and the GIS analysis could complement each other to yield a more rounded picture of project benefits, so they offer a comprehensive assessment covering benefits for both transport users and local people.
The study also measured the population along the 33 project sites. In comparing the increase in nighttime light with the increase in population, the evaluation found that nighttime light was responsive to ADB support, but population was not, at least in the short term. Long-term changes in nighttime light and population could not be analyzed but should be monitored in future.
The application of geospatial data to transport projects, although it is at an initial stage and needs to be refined, is very useful for evaluating results and identifying lessons, including what worked and what did not. The GIS data for the ADB projects studied here made it possible to (i) measure the impact of ADB transport projects and (ii) compare impacts across the project portfolio in different countries based on the same data quality and standards, even though baseline data were not collected for some projects before they began. A geospatial analysis does not replace the traditional evaluation approach, but it can complement its results. Geospatial assessment methods are flexible and can be used to evaluate individual projects and project portfolios, especially now that the availability of data and information is growing.
Footnotes
Acknowledgements
The authors would like to acknowledge the support of their colleagues and supervisors at the Independent Evaluation Department of the Asian Development Bank (ADB). Their comments on an earlier version were very helpful in completing this paper. The authors would also like to extend their gratitude to the Economic Research and Regional Cooperation Department at ADB for providing some of the geospatial datasets used in this research.
Author Contributions
The authors confirm the contribution to the paper as follows: study conception and design: T. Yokota; data collection: H. Pagkalinawan; analysis and interpretation of results: T. Yokota, H. Pagkalinawan; draft manuscript preparation, T. Yokota, H. Pagkalinawan. All authors reviewed the results and approved the final version of the manuscript.
Declaration of Conflicting Interests
The author(s) declared no potential conflicts of interest with respect to the research, authorship, and/or publication of this article.
The opinions expressed in this paper are those of the authors and do not represent any of the views, understandings, or policy of the Asian Development Bank.