
Abstract
This study evaluated the potential influence of demographic factors on seat belt compliance rates in an urban area. Washington D.C., which is the capital of the United States, is an urban area with mixed and diverse population. The city (and all states) conducts seat belt compliance surveys annually as a requirement of the National Highway Traffic Safety Administration (NHTSA). This article used compliance rates obtained from the field for 2014 through 2020 and matched those with demographic data for the same timeframe. The demographic data for the city was obtained from the United States Census Bureau. Demographic variables including race, educational and income levels for the eight wards in Washington D.C. we extracted for analysis. Overall, seat belt compliance usage in Washington ranged from 93% to 95.7% between 2014 and 2020. Approximately 42.3% of its population are Caucasian while 43.9% are African Americans with the remaining being Asian, Hispanics and other races. In addition, seat belt usage was reported by ward. Using single factor analysis of variance, it was determined that compliance rates in the wards were not statistically influenced by race, educational level, or income level at 5% level of significance. However, when comparing yearly seatbelt compliance from 2014 to 2020, the compliance rates of 2014 versus 2019, and 2014 versus 2020 were determined to be statistically different. Seat belt use should be encouraged for everyone in all jurisdictions. The analysis shows that, in this urban area, the three demographic variables do not have any influence on the compliance rates.
Introduction
The use of seat belts reduces the risk of death and serious injury in Motor Vehicle Crashes (MVCs) significantly. For drivers and front-seat passengers, studies show that they can reduce the risk of death by 45%, and the risk of serious injury by 50% ( 1 ). Seat belts save thousands of lives each year, and as a result, its increase in usage would potentially save a lot more. As a result, jurisdictions in the United States are required to conduct annual seat belt compliance surveys based on field data collection and other means to report their response rates to the National Highway Traffic Safety Administration (NHTSA). This is a part of NHTSA’s “Click It or ticket” campaign aimed at increasing seatbelt compliance across the country. Conducting seatbelt surveys enables engineers as well as policy-makers to target resources to effectively provide enforcement at areas where seatbelt usage is low.
According to NHTSA ( 2 ), the overall national seat belt compliance rate in the United States in year 2020 was 90.3%. In 2017 alone, approximately 15,000 lives were saved by seat belts and an additional 2,549 lives could have been saved if they had complied with its usage ( 2 ). In the District of Columbia (DC), over the past 7 years (2014–2020), the compliance rate has ranged from 93.2% to 95.7% although DC’s seatbelt law requires all drivers and passengers (front and back seats) to wear a seatbelt.
DC has a population of approximately 689,545 based on the 2020 census data ( 3 ). The breakdown comprises of approximately 42.3% White, 43.9% Black, 4.48% Asian and 5.35% other races ( 4 ). The data also shows approximately 13.5% of its population are persons in poverty. The median annual household income in DC is approximately $87,000.
It is generally thought that seat belt compliance rates would generally be higher for the areas with high income and education levels, compared with those in sections of the city that have low income and lower education levels. This study analyzed demographic data with the annual compliance rates to determine if there is a discernable connection between the seat belt compliance rates and the demographics of the area.
Literature Review
Vehicular crashes are one of the leading causes of death in the United States. According to the National Traffic Safety Administration (NHTSA), vehicle crashes in the United States have increased consistently from 2017 through 2019 ( 5 ). However, the number of crash-related injuries has decreased through the same period. This is likely to be a consequence of the increasing seat belt usage trend in vehicle occupants. Seat belt use is critical in preventing or decreasing the severity of passenger injuries. NTHSA stated that when a lap or shoulder belt was used properly, it could reduce the risk of a fatal injury in front-seat vehicle occupants by 45% and the risk of a moderate to severe injury by 50% ( 6 ). In 2018, from all the crash-related fatalities, more than half of teens (from 13 through 19 years old) and adults (from 20 through 44 years old) were not buckled up at the time of the incident ( 7 ).
There are several factors that affect seat belt compliance among drivers. A study conducted in 2008 ( 8 ), stated that race is a factor that is correlated with seat belt usage in the United States. From the study, the authors identified a limited number of research papers that studied racial disparities in crash-related fatalities and their association with seat belt use. In 2003, Braver ( 9 ), used 1995 data from the Fatality Analysis Reporting System (FARS), and identified that minorities such as African American and Hispanic men with no education beyond high school were at increased risk of dying when traveling in a motor vehicle. Further, Wells et al. ( 10 ) as well as Vivoda et al. ( 11 ) concluded that there is a significant difference between seat belt usage among races, where African Americans were less likely to wear a seat belt compared with Caucasians and Hispanics.
Marco et al. ( 12 ) investigated the factors affecting seat belt noncompliance among patients who were admitted to the Trauma Service after a motor vehicle crash (MVC). The study consisted of 766 adults (over 18 years of age) of which 32% (245 adults) of the patients were not wearing seat belts during the time of accident. The authors concluded that seat belt noncompliance was generally observed in young male patients, who were either intoxicated during the time of accident or who displayed positive screens for drugs usage (cocaine, tetrahydrocannabinol, or methamphetamine) after being admitted for medical treatment following a MVC. There were also no observed significant differences in seat belt usage with respect to patients with different ethnicities. A different study by Ball et al. ( 13 ) was conducted in Canada and examined the seat belt usage in trauma patients who were previously involved in an MVC. Out of 386 trauma patients who participated in the study through telephone questionnaire, it was found that almost 48% (185 individuals) were not wearing a seat belt during the time of collision. Unbelted occupants had higher mean injury severity scores, as well as longer hospitalization periods. The study also found that 55.4% of the admitted patients consumed alcohol before driving. Multivariate analysis was used to determine seat belt noncompliance predictors that included environmental (trip duration and length, time of travel, road category) and behavioral (driving under influence, poor driving habits and history) factors. Moreover, younger adults (mostly males), unemployed individuals and people with low levels of education were also good predictors of seat belt noncompliance. There was also a significant positive change in the self-reported driving skills and perceptions of participants with respect to awareness of correct seat belt usage after recovery.
A study conducted by Febres et al. ( 14 ) focused on developing Bayesian Networks which showed that driver injury severity (dependent variable) could be attributed to variables such as seat belt usage, road type, visibility, and distractions. Seat belt noncompliance was found to be the most influential variable in the analysis attributed to driver fatality or serious injury during accidents. On investigating the demographic factors like sex and age, likeliness of a serious or fatal injury was displayed mostly in male drivers and drivers under the age of 25 and over 60 years old who did not use seat belts. In another study by Carpenter and Pressley ( 15 ), NHTSA’s FARS data was used to obtain correlations between seat belt noncompliance and fatality in teenagers aged 15 to 17 involved in a fatal crash. The authors found that teen drivers who have permits were more likely to drink and drive, speed, and not use seat belts compared with those who have obtained their full driver’s license.
Research conducted by Lerner et al. ( 16 ) identified demographic factors that influenced seat belt use in adults. The study included variables such as age, sex, race, and residence zip code as a proxy for income. The results showed that women were more likely to wear a seat belt compared with men. Moreover, seat belt usage was more prevalent in Caucasians and older vehicle occupants. The study concluded that seat belt usage was lower in populations making less than $20,000 per year.
Another study conducted by Vaughn et al. ( 17 ) compared people’s self-assessment of seat belt usage with a nationally representative sample in the United States. Out of 39,259 individuals who were 18 years or older, there were 1,188 individuals who responded “Never” to wearing a seat belt while driving. There were 1,354 respondents who answered “Never” to wearing a seat belt while riding as a passenger. Logistic regression analysis was used to estimate relationships between seat belt noncompliance and sociodemographic factors. Passengers and drivers of 50 years and older were reported to significantly display seat belt noncompliance. Furthermore, significantly more male passengers than females did not use seat belts. The study also found that African American drivers and passengers were significantly more likely to use seat belts rather than Caucasians. Passengers earning an annual salary of below $50,000 and drivers earning less than $75,000 were significantly less likely to wear seat belts. Seat belt noncompliance was also demonstrated significantly in drivers who neither graduated from high school, nor attended or graduated from college.
In the United States, seat belt usage also varies among states. This could be attributed to varying seat belt law enforcements in different states. Primary enforcement laws allow law enforcement to stop vehicles when a driver/passenger is not seen wearing a seat belt while secondary enforcement does not require a car to be pulled over if the driver is not wearing a seat belt ( 18 ). Further, a study conducted in 2017 ( 19 ) analyzed responses from 2.1 million telephone survey respondents conducted by county/state health departments and found seat belt noncompliance in states and counties with secondary enforcement laws. The results also indicated higher mean seat belt compliance rates in states that have primary enforcement laws. Boakye and Nambisan ( 20 ) used 2013 to 2017 FARS data to conclude that states with stricter seat belt laws (for front- and rear-seat passengers) demonstrated higher seat belt compliance rates. In the United States, as of 2021, primary enforcement is observed in 34 states and in DC.
Ash et al. ( 21 ) explored relationships between standardized aggregate state-level academic abilities, overall state population healthiness, economic prosperity, and other variables, and seat belt usage. Analysis of covariance (ANCOVA), more specifically moderation analysis, demonstrated that there was high seat belt compliance in states with high academic achievement and primary enforcement laws. Health, gross state product (economy), government effectiveness and the number of rural roads in a state were shown to have significantly moderated the relationship of law enforcement and seat belt compliance rates. The authors concluded that educational inequity rather than traditional demographic differences affect seat belt usage rates across different states.
In summary, literature assessing socio-economic and demographic factors indicate that seat belt usage varies within different groups. Since the results obtained from different studies considered several factors (some of which could not be controlled for), these studies might be susceptible to sample selection or social desirability bias. Most studies indicate young populations, primarily males, and people with low education background are more likely not to be wearing a seat belt at the time of fatal/serious injury crashes. Other factors like race/ethnicity and annual income demonstrated contradicting influences on seat belt usage. However, recent studies conclude that drivers and passengers in states with primary enforcement are more likely to use seat belts than drivers in states with secondary enforcement.
Data Collection and Methodology
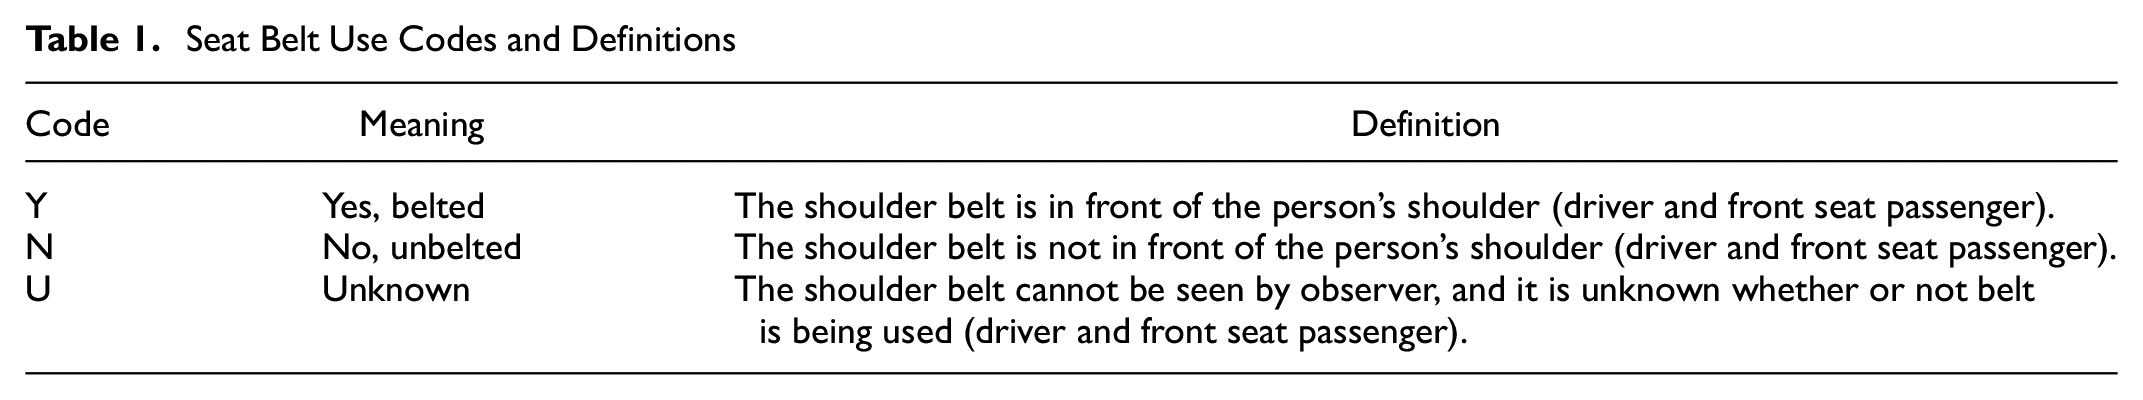
Annually, the research team conducts field surveys of sampled vehicles at 150 or more segments or locations to determine the compliance rate for the city. Field technicians conduct surveys of only passenger vehicles (commercial motor vehicles are exempt) between the hours of 8 a.m. through 5 p.m. on weekdays. At each location, at least 100 vehicles are sampled by a field technician who observed if the driver and/or front seat passenger were wearing a seatbelt. The observations resulted in a total of at least 15,000 tallies for the compliance survey each year. Since DC is divided into eight wards, representative locations in each ward were included in the field surveys. The field data collection team observe only drivers and front passenger occupants to determine their compliance (Belted or Not Belted) and followed the codes presented in Table 1 to survey 100 cars at each location. Therefore, the compliance rate at any intersection is the percentage of only the belted occupants observed at that intersection.
Seat Belt Use Codes and Definitions
To avoid any patterns associated with inter-ward travel, the compliance studies in all the locations were performed for 100 vehicles per location during different rimes of the day (and different days of the week). Moreover, field technicians did not observe vehicles weighing over 10,000 pounds (buses, commercial trailers, police vehicles, ambulances, postal delivery vehicles) as the vehicles were more likely to be from a different ward/state. Using single factor analysis of variance (ANOVA), the compliance rates are computed using SPSS and Excel, with a standard error of 2.5% or less. The summary of the overall seat belt compliance rates from 2014 through 2020 is presented in Table 2.
Overall Seat Belt Compliance Rates for DC
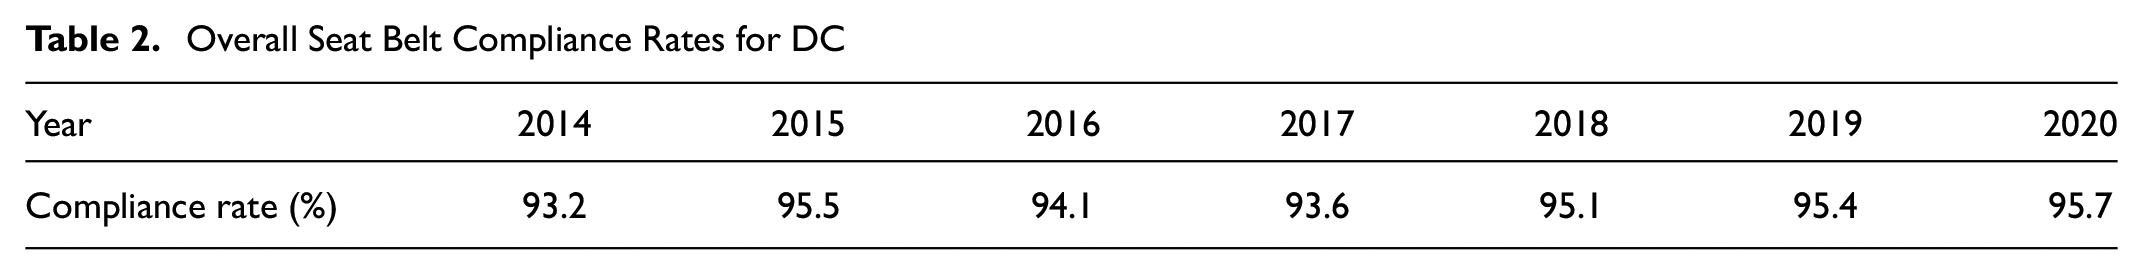
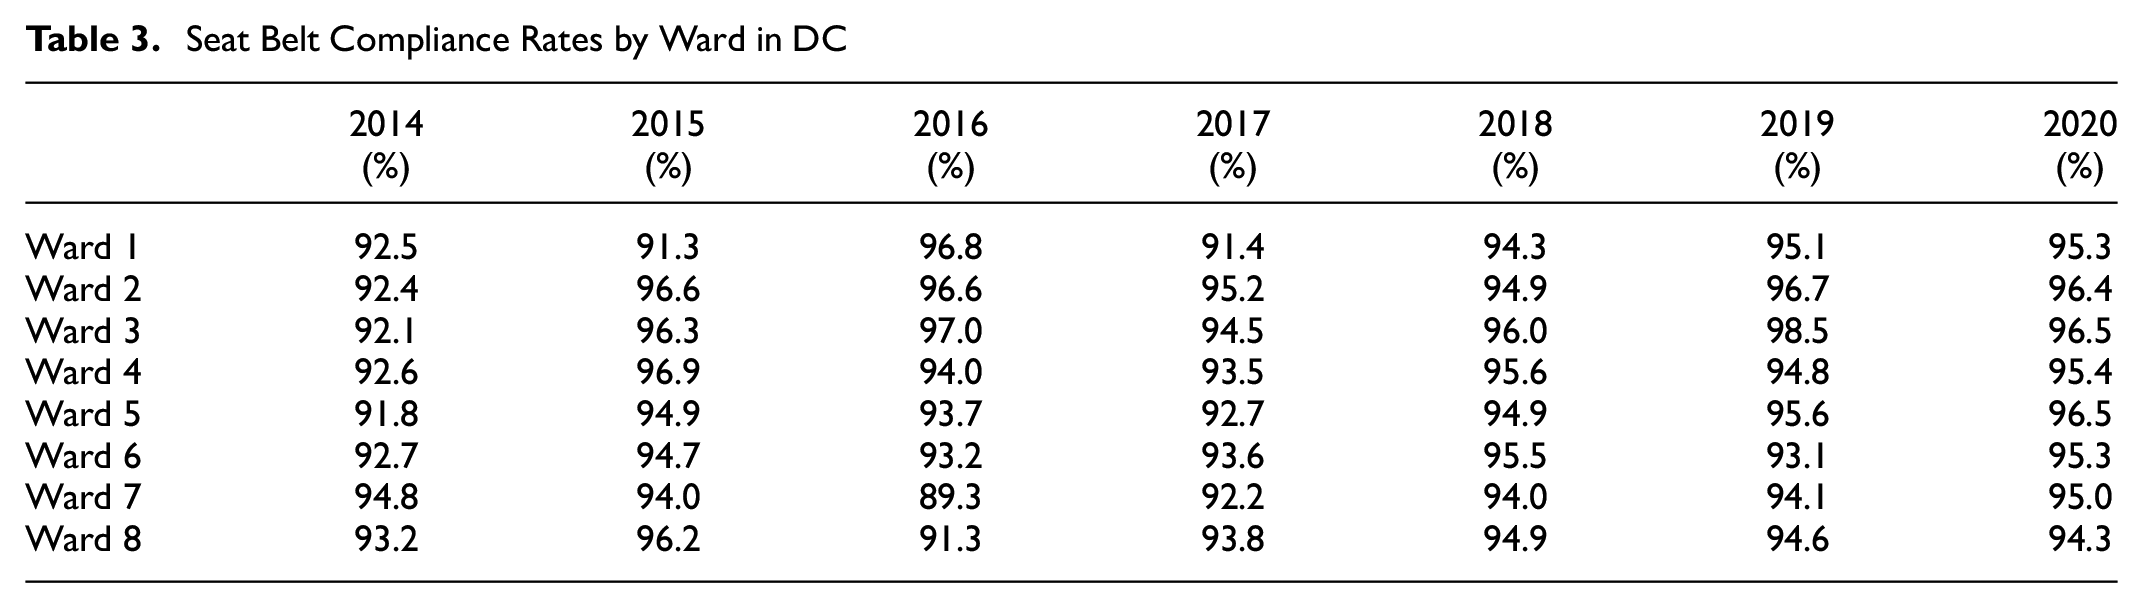
The highest overall compliance rate obtained from 2014 through 2020 was 95.7% (in year 2020). In addition, the detailed compliance rates for the respective wards in DC were extracted from the database by year. Each cell represents the average driver and front seat passenger seatbelt compliance rates at all the locations within a ward during a year. This is presented in Table 3.
Seat Belt Compliance Rates by Ward in DC
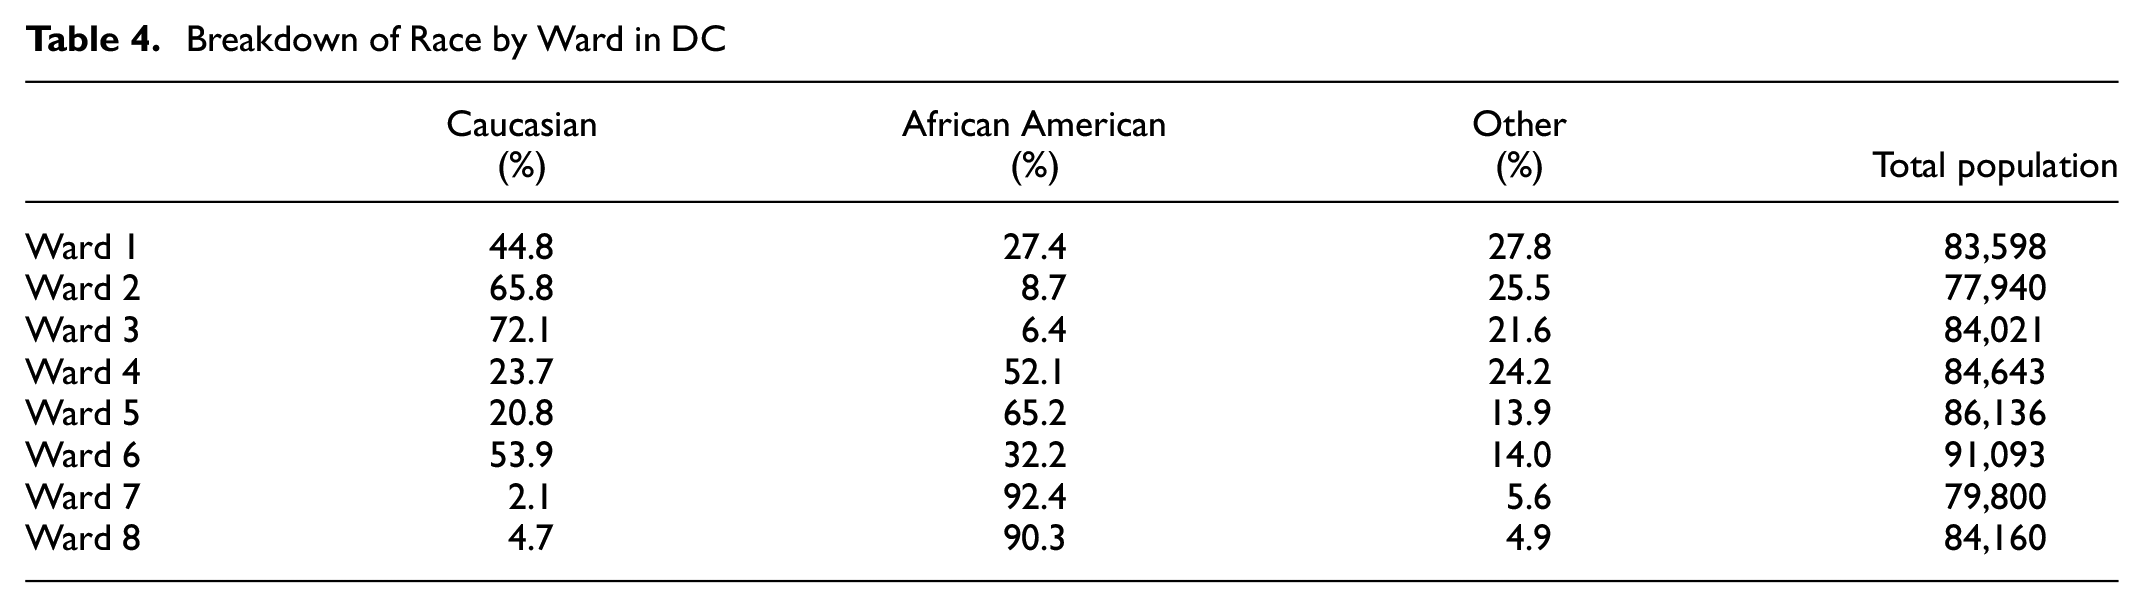
Demographic data was obtained from the U.S. Census Bureau spanning the period from 2014 to 2020 (https://www.census.gov/library/stories/state-by-state/district-of-columbia-population-change-between-census-decade.html). Data from 2016 through 2020 was used to calculate an estimate (5-year average) of socio-demographic data per ward which was used in the analysis. The variables extracted by ward were race, household income, and educational level. Table 4 presents the breakdown of race by ward in DC along with the total estimated population in each ward. To simplify the analysis, Caucasian, African American, and “other” races were considered (Asian, Hispanic, and others were combined). From the summary, ward 3 has the highest Caucasian population while ward 7 has the highest African American population.
Breakdown of Race by Ward in DC
In DC, ward 3 has the highest number of persons with a degree (i.e., associate, bachelors, or graduate) representing approximately 89% while ward 8 has the lowest with a degree (21%). This is presented graphically in Figure 1.

Education level by ward in DC.
In regard to income level, as shown in Figure 2, the highest income level (earning $200K or more) was reported for ward 3 with the lowest income levels in ward 8.

Income level by ward in DC.
ANOVA and Tukey Test
Single factor ANOVA was used to determine if there is a statistically significant difference between the seat belt compliance rates by year and by wards. Generally, the single factor ANOVA assumes a null hypothesis that there is no statistically significant difference between groups based on a single dependent variable. The test was conducted at 5% level of significance. If the p-value is determined to be greater than 0.05 (i.e., 5%), we fail to reject the null hypothesis. However, if the p-value is less than 0.05, then there exists a statistically significant difference between the groups.
The Tukey’s honest significant difference (HSD) test was used to determine the differences within groups. This is a post-hoc test based on the studentized range distribution that helps to determine which specific groups’ means (compared with each other) are different. This is conducted for all possible pairs of means in each group ( 22 ).
In the pairwise comparisons among means, the Tukey HSD is calculated for each pair of means using the following equation:

where Mi– Mj is the difference between the pair of means, MSw is Mean Square Within, and n is the number in the group or treatment.
If the p-value associated with Tukey’s HSD is less than 0.05, then there is a statistically significant difference in the group mean values.
Results
A review of general demographic data suggests the notion that wards with persons with higher education levels may potentially have a significantly higher seat belt compliance rate compared with those with lower educational levels. Likewise, areas with higher income levels may potentially have significantly higher seat belt compliance rates. There is also the general notion that wards with a higher Caucasian population may have a significantly higher compliance rate than those with a high African American population.
From the data, it is thought that ward 3, which has the highest income and educational levels coupled with the highest Caucasian population, would have significantly higher compliance rates than the wards with low-income levels, lower educational levels as well as a higher African American population.
Single Factor ANOVA
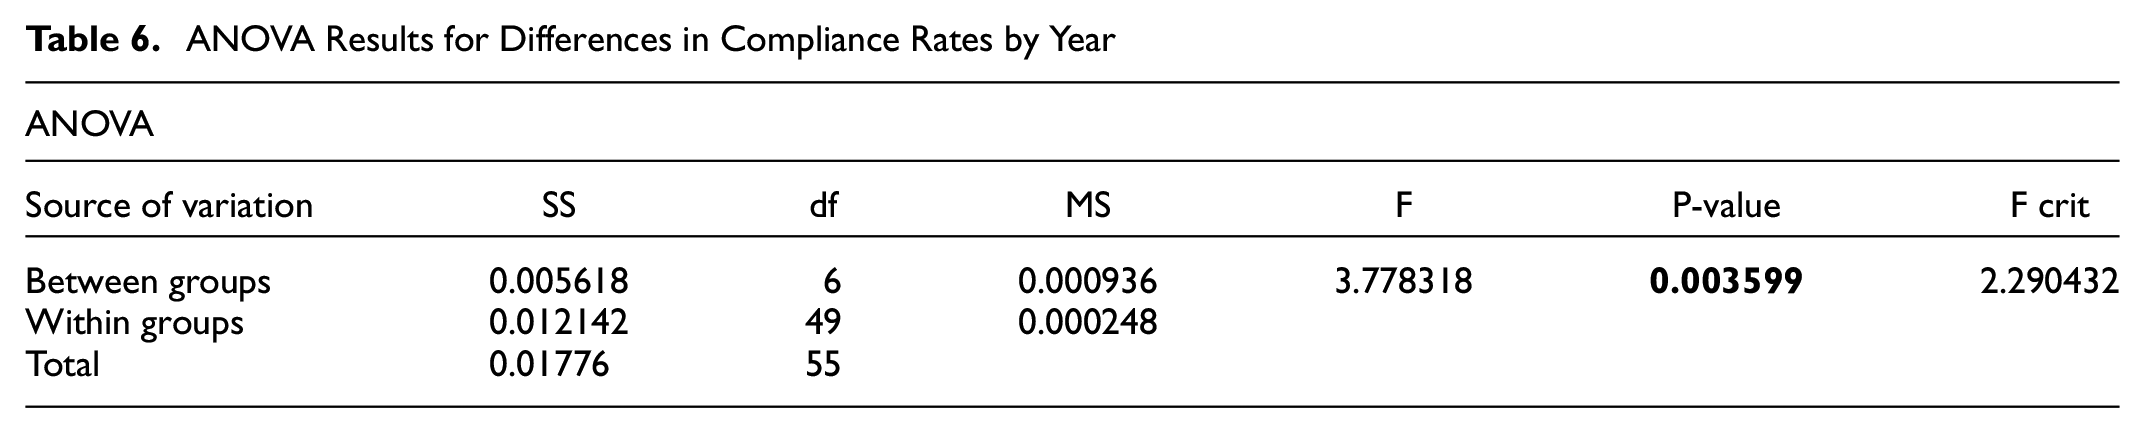
The seatbelt data collection locations observed in DC from 2014 to 2020, were grouped by wards. A matrix was developed where the average seatbelt compliance was presented by year. The single factor ANOVA was conducted for the seat belt compliance rates by ward and then by year. Tables 5 and 6 present the respective results by ward and by year.
ANOVA Results for Differences in Compliance Rates by wards
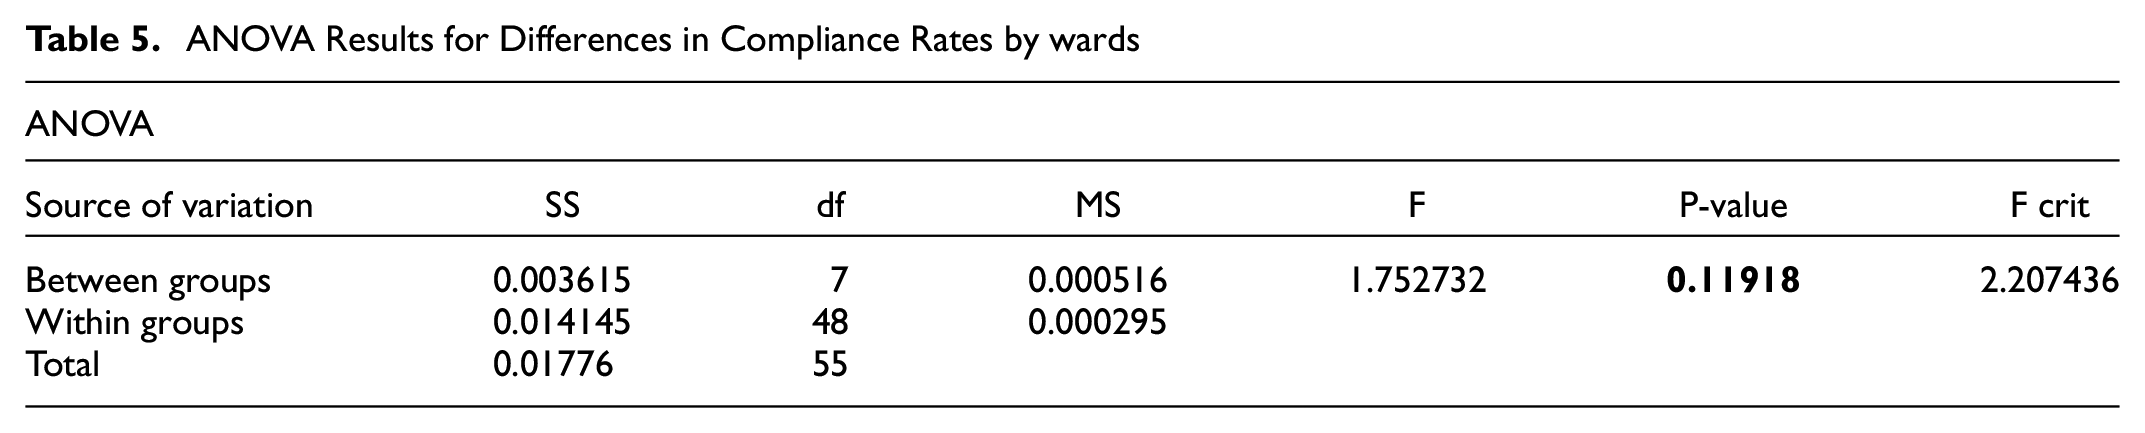
The results from Table 5 indicate that there is no statistically significant difference in the compliance rates between wards (p = 0.12) at the 5% level of significance. Thus, regardless of income and educational level coupled with race, there is no statistically significant difference between the compliance rates in the various wards in DC.
Table 6, however, shows that there is a statistically significant difference in the compliance rates over the years from 2014 through 2020 (p = 0.003) at the 5% level of significance. As a result, the Tukey’s HSD post-hoc test was conducted to determine which pair of years showed statistically significant differences. Table 7 shows the results of Tukey’s HSD tests conducted for the compliance rates by year.
ANOVA Results for Differences in Compliance Rates by Year
Tukey’s HSD Tests by Year
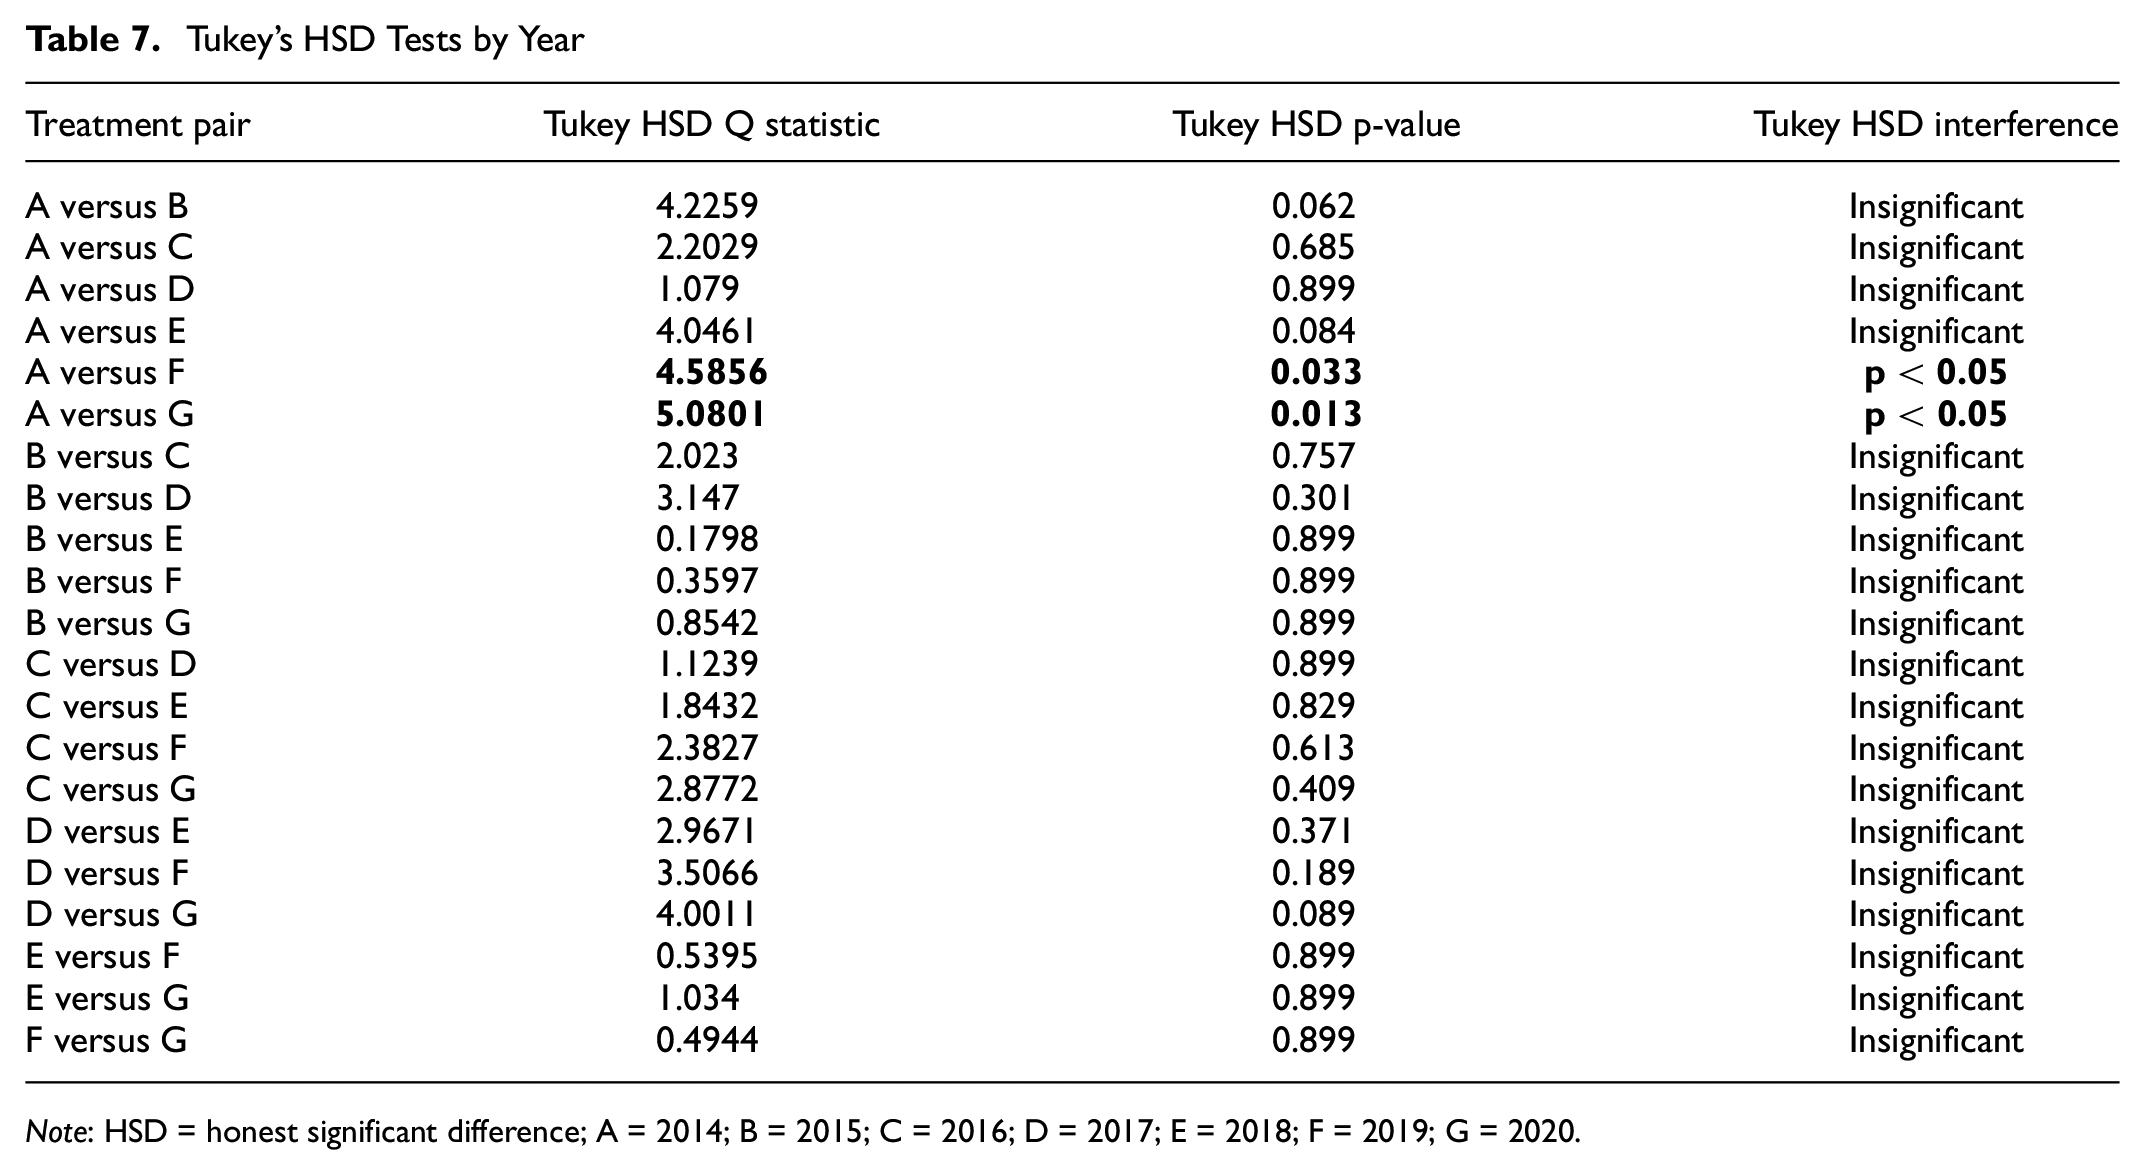
Note: HSD = honest significant difference; A = 2014; B = 2015; C = 2016; D = 2017; E = 2018; F = 2019; G = 2020.
In Table 6, A represents 2014 while G represents 2020. From the table, the seat belt compliance rates were statistically significant for years 2014 versus 2019 (p = 0.03), as well as for 2014 versus 2020 (p = 0.01) at the 5% level of significance.
Discussion
Seat belt compliance has been thought to be one of the key features that help with improved safety for vehicle occupants. Crashes involving vehicles usually result in higher percentages of disabling injuries or fatalities, particularly for occupants who are not restrained. As a result, NTHSA and the Federal Highway Administration promote a rigorous seatbelt campaign aimed at increasing compliance. In addition, law enforcement agencies provide the necessary support to stem the incidence of non-compliance across the United States.
In some cases, there is a targeted audience, particularly among poor and minority communities. In an urban area such as DC, just as in any typical urban area, there are several wards that have a higher percentage minority population. Likewise, there are several wards with a higher Caucasian population and high-income level residents. Generally, it is thought that seat belt compliance rates would be low among low-income and poor communities.
The 2020 census data showed that DC has a population of approximately 689,545 with approximately 42.3% Caucasian, 43.9% African American, 4.48% Asian and 5.35% other races ( 4 ). The seat belt compliance rates over the past 7 years range between 93.2% and 95.7%. With the varying mixture in the makeup of the population coupled with different income levels and educational backgrounds, it is thought the seat belt compliance rates would potentially be worse in low-income and minority communities compared with the more affluent ones.
The results from the single factor ANOVA indicated that there is no statistically significant difference between the average compliance rates by ward, even though the makeup of the wards are distinctly different. For example, most of the affluent residents in the district are in wards 2 and 3 while wards 7 and 8 have high minority, low-income and less educated residents. However, the results show that there is no statistically significant difference in the rates of seatbelt compliance between the wards. This may be attributed to the aggressive annual “Click it or ticket” campaign and law enforcement efforts in all the communities in the urban area.
In regard to the compliance rates by year, the results show that there were statistically significant increases in seat belt usage when years 2014 versus 2019 and 2014 versus 2020 are compared. This potentially also indicates that, since 2014, there has been a significant improvement in the compliance in seatbelt usage over the most recent 2 years. Again, this could be attributed to the aggressive law enforcement in the district in all jurisdictions as well as the annual campaign for seatbelt usage.
It must be noted that the vehicles sampled were all DC licensed to eliminate those from adjoining jurisdictions. However, because of lack of access to motor vehicle registration records, the wards where those vehicles came from could not be verified. This may contribute to bias in the data based on which future work on this key research question can be included. The main purpose of the study was to observe the seat belt compliance of drivers that were mostly local to all the study locations chosen in Washington, D.C. Therefore, convenience sampling was observed, where the vehicles were selected at a given time of the day based on accessibility. This form of non-probability sampling bias restricted our study to draw conclusion on the assumption that most of the drivers sampled in any ward actually live in the respective wards. NHTSA’s guide for these surveys do not necessarily require tying vehicles observed for seat belt compliance to their residential locations.
The time it took to obtain a sample of 100 vehicles at each location did not exceed 40 minutes. However, this time could have taken longer if access to motor vehicle registration records to be verified in the field during data collection was available. The Department of Motor Vehicles only provides such access to law enforcement officials, thus making verification of the ward where the vehicle owners reside nearly impossible.
To eliminate or reduce any bias from this form of non-probability sampling, multiple locations within a single ward were considered (oversampling) for the study. With this assumption, the authors were reliant on convenience sampling to get a representation of each ward’s population. The results and conclusions using this approach would not have differed if probability-based sampling had been used since there would be a similar or lower level of sampling errors while observing only the ward’s native driving population. Another limitation that could not have been avoided during data collection was verifying that the owners of each vehicle sampled were residents of the respective ward. However, this limitation would not have any impact on the results as it would be another case of non-probability sampling which would reduce additional bias.
Conclusions and Recommendation
This research shows that there is no discernable difference between the seat belt compliance rates in DC based on the following three demographic variables: income level, educational level, and race. There has been a marked improvement in the compliance rates particularly over the past two years since 2014. These marked improvements could be attributed to the programs implemented by the city officials, including law enforcement. Further studies could be undertaken to determine seat belt compliance based on gender. The outcome of that study could be used to target the gender category for improvement if warranted. It is also understood that disparities between inter-ward driving population specifics was not available to be analyzed. In addition, any potential sample bias could be eliminated if the owners or drivers of the vehicles sampled could be verified as residents of their respective wards using motor vehicle registration records.
Footnotes
Author Contributions
The authors confirm contribution to the paper as follows: study conception and design: S. Arhin; data collection: B. Manandhar, M. Timoteo Anderson; analysis and interpretation of results: S. Arhin, B. Manandhar, M. Timoteo Anderson; draft manuscript preparation: S. Arhin, B. Manandhar, M. Timoteo Anderson. All authors reviewed the results and approved the final version of the manuscript.
Declaration of Conflicting Interests
The authors declared no potential conflicts of interest with respect to the research, authorship, and/or publication of this article.
Funding
The authors disclosed receipt of the following financial support for the research, authorship, and/or publication of this article: National Highway Traffic Safety Administration (NHTSA, via District Department of Transportation).