
Abstract
Speed reduction markings have been installed on highways as perceptual countermeasures for speeding. However, little is known about the effects of the shape and interval of road markings on driving speed and lane position. In this paper, a driving simulator experiment and questionnaires were performed to explore the effects of speed reduction marking patterns on driving speed and standard deviation of lane position (SDLP), as well as drivers’ subjective feelings, mental workload, and visual attention. Thirty-nine participants drove on a simulated two-lane rural highway where speed reduction markings with different shapes and intervals were presented at horizontal curves. The pavement markings were associated with reduced throttle values and mean speed in advance of a horizontal curve. The marking shape did not affect participants’ speed choice or SDLP. A cognitive alerting effect of the speed reduction markings was dominant because the participants did not drive more slowly with the markings with converging intervals toward the traveling direction compared to those with a constant interval. A questionnaire on drivers’ attention reflected a potential use of road markings for drivers’ lane-position maintenance. Since less than 18 % of the participants noticed the convergence in marking intervals, speed reduction markings may also induce the perceptual illusion of acceleration.
Studies indicate that driving speed is a major determinant of crash severity ( 1 , 2 ); speeding is, therefore, a critical issue in highway safety. Because driving behavior consists of a constant loop of recognition, decision, and operation ( 3 ), higher driving speeds result in a smaller margin of safety for drivers.
Various traffic calming measures have been installed on roads to reduce vehicle speed. Smith and Appleyard ( 4 ) categorized traffic control methods into three subgroups: positive physical controls (e.g., speed bumps, speed humps, and median barriers), passive controls (e.g., stop signs, speed limit signs, and turn prohibition signs), and controls dealing with driver perception and psychology (e.g., lateral bars and speed actuated flashing warnings). Speed reduction markings fall into the third category, as they refer to a series of pavement markings that aim to reduce vehicle speed without regulatory or text messages such as “SLOW” ( 5 ) or “CURVE AHEAD” ( 6 ). Figure 1 shows examples of speed reduction markings.
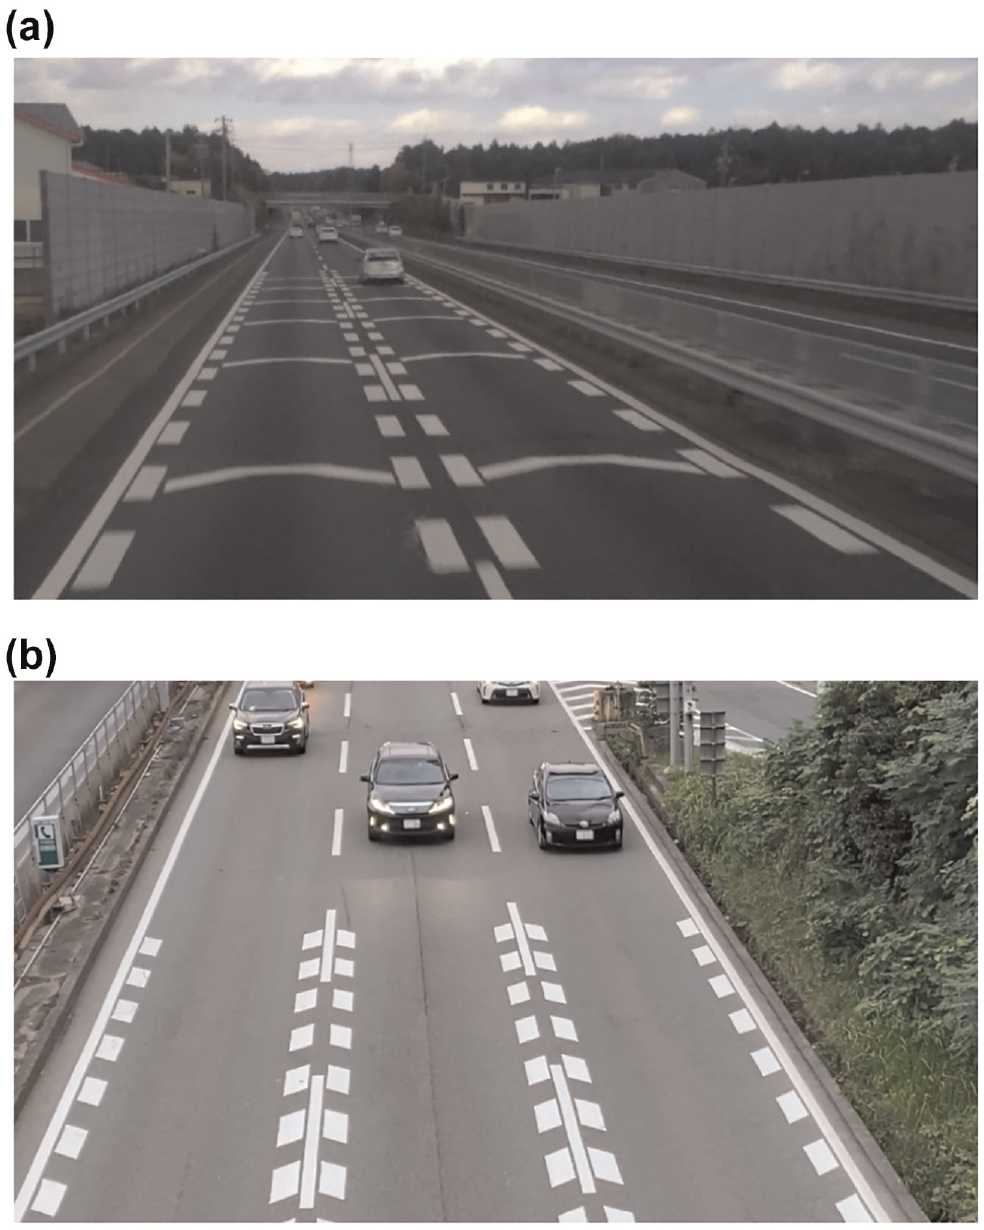
Examples of speed reduction markings: (a) Higashi–Meihan Expressway in Suzuka, Mie; (b) Kinki Expressway in Suita, Osaka.
Effects of Speed Reduction Markings
Driver-behavior models mostly agree that a higher-perceived risk leads to safer behavior, and vice versa. One of the earliest driver-behavior models was the zero-risk model proposed by Näätänen and Summala ( 7 ). In the zero-risk model, the researchers described that drivers’ subjective risk remains zero unless some events make their risk cross over the threshold to change their risk-related behaviors. Wilde ( 8 ) later described in his risk homeostasis theory that drivers tend to maintain a certain level of risk by adjusting behavior (e.g., speed reduction). Fuller ( 9 ) extended the risk homeostasis theory and proposed the risk allostasis theory, where drivers maintain their feeling of risk within a certain range by compensation. Furthermore, Summala ( 10 ) explains that there is a feedback loop of target speed and safety margins, which are closely tied to drivers’ mental workload and comfort.
Speed reduction markings have been developed on this basis as relatively low-cost speed reduction devices with the potential to overcome behavioral adaptation by implicitly increasing drivers’ perception of risk. Driving tasks primarily rely on visual information ( 11 ). Because drivers select their speeds based on their perception of the environments they drive through ( 10 , 12 ), the concept of optic flow ( 13 ) implies the possibility of affecting drivers’ speed perception by placing “perceptual cues” in their peripheral vision.
Speed Reduction
Speed reduction markings were initially developed as devices that elicit the feeling of acceleration in drivers. In the 1970s, Denton ( 14 ) reported a negative correlation between the number of transverse bars presented per unit time and a driver’s time perception. The researcher also observed significant reductions in mean speed and 85th percentile speed after installing wide, transverse bars with converging intervals preceding a roundabout in Midlothian, Scotland ( 15 ). In the United States, Enustun ( 16 ) reported a mean speed change ranging from −13.36 km/h to +6.27 km/h after introducing transverse bar markings on Interstates in Michigan. Many other applications followed. For example, a 57 % short-term reduction in crashes ( 17 ) and speed ( 18 ) was reported after placing transverse bar markings in the United Kingdom and the United States. In Japan, Takada ( 19 ) assessed the effects of parallelogram edge lines (also known as “comb markings”) in Shiga and found a 1.6–5.7 km/h reduction in mean speeds as well as a 1.9–8.4 km/h reduction in 85th percentile speeds. A short-term naïve crash reduction (from 10 in the previous year to zero in the six months following the installation) was also reported after converging sets of chevron markings and parallelogram edge lines with a constant interval were introduced on a bridge in Osaka ( 20 ). After the same type of markings were introduced on Interstate Highway 94 in Wisconsin, mean driving speeds dropped by 14 km/h relative to a control site ( 21 ). In Wisconsin, Gates et al. ( 22 ) also observed a 1- to 4-mph mean speed reduction by short transverse bar markings on Interstate Highway 43. Katz ( 23 ) compared the effects of peripheral transverse lines on highways in Syracuse (New York), Flowood (Mississippi), and Waller (Texas) to reveal speed reduction effects at these three sites. The degree of speed reduction varied from site to site, with the minimum speed reduction in Waller, Texas. Because the Waller site had a higher percentage of local drivers than the other sites, the author assumed that the road markings involved some cognitive process where drivers got used to the markings. In 2008, the Japanese Metropolitan Expressway introduced a series of egg-shaped markings called “Optical Dots” on a highway in Saitama and observed a reduction in the proportion of vehicles driven at 100 km/h or above ( 24 ). The shape was intended to give drivers visual cues to capture oncoming roadway curvature ( 25 ). In China, Liu et al. ( 26 ) compared driving speeds on two straight roadways with yellow edge lines at different intervals. Although the study found greater speed reduction associated with higher frequency than with smaller intervals, this might have resulted from narrower unmarked lane widths associated with smaller marking intervals. Hunter et al. ( 27 ) performed longitudinal speed studies involving converging wide chevron markings at two interchanges in Atlanta, Georgia. They found 1- to 3-mph reductions in the 85th percentile speed one month after the treatment, but the speed shifted back toward the original in nine months. The authors speculated that the drivers acclimated to the markings over time. Afterward, Hunter et al. ( 28 ) developed the crash modification factor (CMF) of the same type of markings based on two-year crash data for 43 freeway ramps in Atlanta, Georgia. They estimated that the CMF ranges from 0.453 and 0.689. They did not find significant effects of driver age or gender on the effectiveness of the markings.
In recent years, researchers have compared the effects of pavement markings as perceptual cues in simulated environments. Liu et al. ( 29 ) used animated clips with rectangular “edge line markings” and found the largest speed overestimation occurred with marking intervals between 8 Hz and 16 Hz. They also reported that the participants underestimated driving speed once the marking frequencies exceeded 32 Hz, presumably because of the flicker fusion phenomenon. In Italy, Montella et al. ( 30 ) investigated the speed reduction effects of colored transverse markings, “dragon teeth” markings, and painted medians. The researchers found larger deceleration with all of these countermeasures compared to the baseline condition, which did not have the markings, articulating the importance of helping drivers detect curves early enough. Ariën et al. ( 31 ) compared deceleration and lane positions at rural horizontal curves with transverse rumble strips and backward-pointing herringbone patterns. The authors found larger deceleration at the curves with the herringbone patterns, while the transverse rumble strips resulted in earlier deceleration. Babić and Brijs ( 32 ) simulated a red median and horizontal warning signs (pavement markings depicting a series of curve signs) at curves. They found a lower speed with the treatments than in the control condition, but did not find significant differences in speed between the marking types. The participants’ lateral position had shifted away from the red median.
Despite many studies measuring the effects of speed reduction markings, there is no clear consensus around the psychological mechanism behind the resulting speed reduction. While early developers of speed reduction markings aimed to increase drivers’ feeling of speed by illusion, some studies have claimed that speed reduction markings have cognitive alerting effects instead. Jarvis and Jordan ( 33 ) reported that yellow transverse bars reduced the approach speeds toward the road markings, concluding that the markings functioned as a large warning device rather than creating the perceptual illusion of acceleration. In a driving simulator experiment by Godley et al. ( 34 ), the interval convergence of wide transverse bars and edge lines did not impact drivers’ speed choice. The researchers found a lower mean speed in wide transverse bars than in edge lines during the first 100 m of the markings, concluding that an alerting effect triggered the speed reduction. In other words, they claimed that drivers slowed down because they recognized unusual pavement markings.
Because of the wide variety of variables in existing literature on speed reduction marking, it is challenging to synthesize the results. Nevertheless, identifying a dominant psychological effect (i.e., feelings of acceleration versus alerting effect) is an interesting issue because speed reduction markings have the potential to overcome drivers’ behavioral adaptations if they work as inexplicit stimuli. With this in mind, it is worth noting that most existing literature attributing speed reduction to feelings of acceleration has compared road markings with converging intervals to those with a fixed interval equal to the maximum interval of a set of converging intervals (i.e., α versus β in Figure 2). Therefore, the smaller marking interval itself was a covariate of marking convergence. However, speed reductions observed in such a comparison might not be attributable to the illusion of acceleration because the “convergent” conditions had inherently more frequent longitudinal markings, which can be visually more alarming even without the convergence. For this reason, drivers might have been slowing down just because they saw “something unusual.”
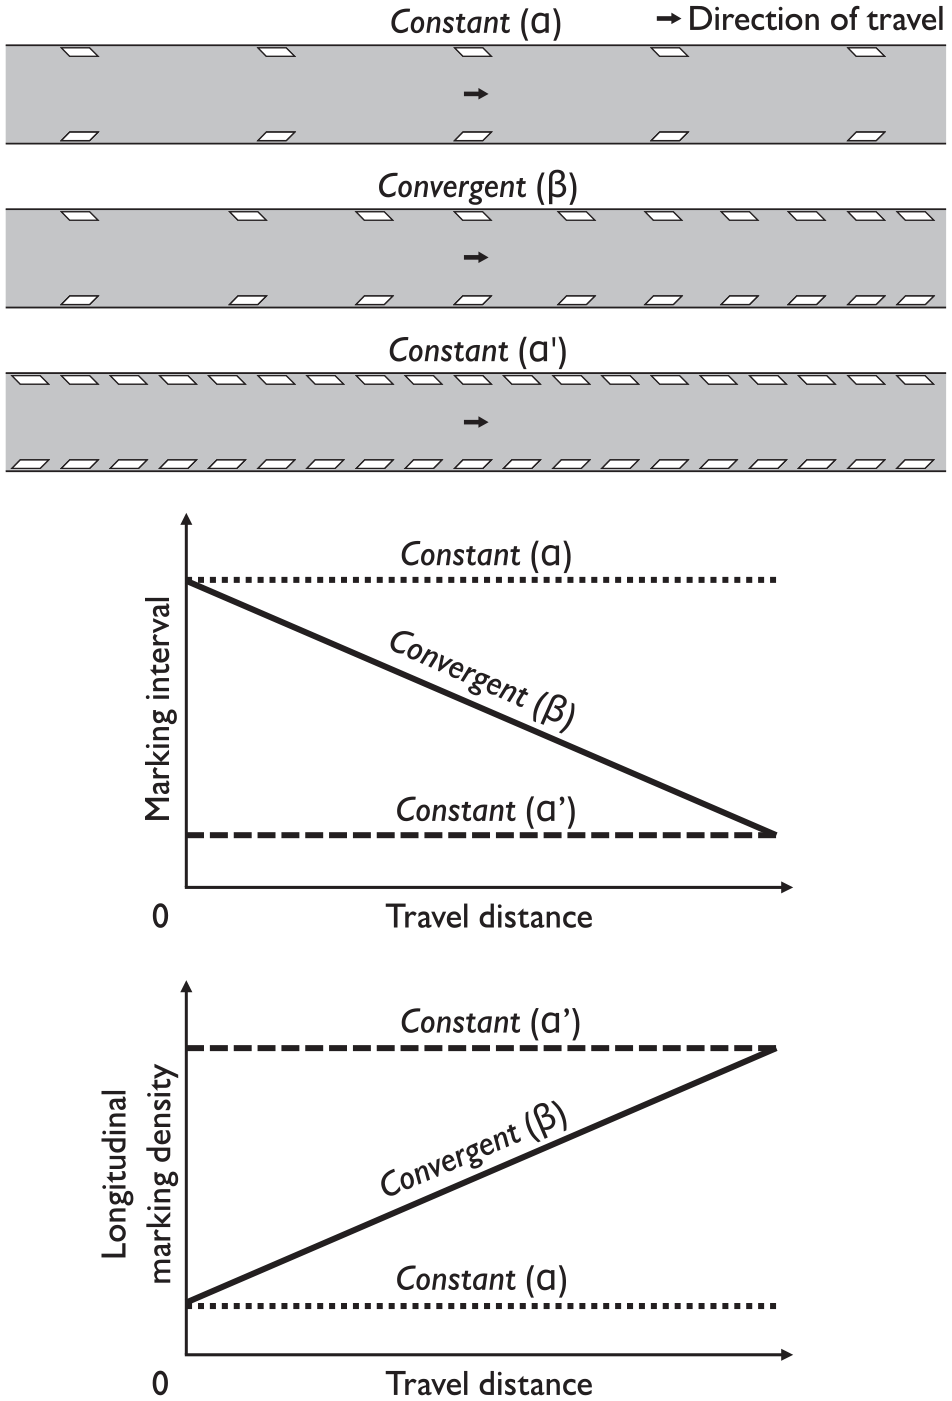
Illustration of experimental conditions on marking interval.
Lane-Keeping
In addition to proper speed choice, lane-keeping is a vital element of driving through horizontal curves. In fact, road markings are sometimes used to guide drivers through horizontal curvature as drivers are believed to scan the curvature before entering a horizontal curve ( 35 ). Literature indicates drivers tend to look at the apex of the inner division line at a horizontal curve ( 36 ). Mourant and Rockwell ( 37 ) claimed that peripheral vision plays a major role in monitoring lane position. Summala ( 38 ) later concluded that the foveal task load does not impact peripheral lane-keeping performance.
The stability of lateral lane position is often measured by the standard deviation of lane position (SDLP), where a larger value indicates a larger tendency to swerve ( 39 ). Researchers have found smaller SDLP in narrower lanes than wider lanes on simulated ( 40 , 41 ) and public roads ( 41 ). De Waard et al. ( 42 ) proposed increasing drivers’ mental workload to induce driving behavior change, as they observed a reduction in driving speed and swerving on rural roads that had gravel chippings on lane edges. He et al. ( 43 ) mentioned the possibility of maintaining lane position specifically, by presenting road markings with high mental workloads to drivers. In fact, the researchers observed a lower SDLP in high-workload conditions than in low-workload conditions, using an auditory working memory task. In a recent work, Galante et al. ( 44 ) reported colored transverse markings, “dragon teeth” markings, and painted medians as the best perceptual treatments to improve lane-keeping measured by SDLP. Nonetheless, little research has thoroughly investigated SDLP or the driver’s visual attention across multiple patterns of speed reduction markings. Therefore, workload assessments for speed reduction marking patterns are also worth carrying out. In particular, narrow chevrons could provide delineation, while markings along edge lines can make drivers hesitant to cross them.
Research Objectives
Currently, various types of speed reduction markings have been applied as traffic countermeasures without robust criteria because there is a limited number of studies assessing the effects of different elements of speed reduction marking, such as shape and interval. In Japan, for example, the National Police Agency Department of Transportation ( 45 ) recommends the use of “the most fitting” marking patterns “by considering the road environment,” yet how these decisions are to be made remains unclear. However, it would not be surprising if wider speed reduction markings and markings placed along lane lines had larger deceleration effects than the other types of speed reduction markings, because the concept of optic flow ( 13 ) argues that drivers’ feeling of speed relies more on peripheral vision than on foveal vision.
Given that little is known about the effects of the shape and interval of road marking on driving speed and lane position, this research examines the relative effects of multiple types of speed reduction markings. We attempt to reveal a driver’s visual attentional pattern, subjective feelings, and mental workload in response to each road marking.
Hypotheses
To conservatively rule out the indeterminacy between the feeling of acceleration and pure alerting effect caused by increased longitudinal marking density (α versus β), the fixed interval was set as the same as the minimum interval of the converging condition (α’ versus β) in this study (Figure 2). If speed reduction markings primarily work as implicit perceptual devices that cause an illusion of acceleration, drivers would drive at a lower speed through speed reduction markings with converging intervals than those with a constant interval (
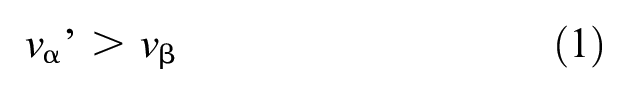
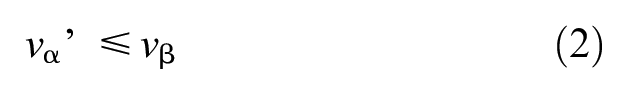
where vα’ = driving speed through road markings with a constant interval, and vβ = driving speed through road markings with converging intervals.
Methods
The study consisted of two parts: a driving session and a questionnaire session.
Participants
The participant sample consisted of 39 Japanese drivers (seven females and 32 males). Participants were recruited through a website, and those who were in good health took part in the experiment. Their mean age was 22.55 (standard deviation [SD] = 5.08) years, and they had been driving for 2.89 (SD = 4.95) years on average. Each participant was compensated with 1,000 Japanese yen for their participation.
Materials
The materials included a driving simulator and questionnaires.
Driving Simulator
A driving simulator made by SIMREX Corporation (Figure 3) was used in a simulated environment in UC-win/Road 9.0.3, whose high relative validity in speed-maintenance behavior has been reported ( 46 ). Three displays manufactured by LG Electronics Inc. (42LA6650) displayed simulated images with 1,920 × 1,080-pixel resolution. Engine noise was presented through a speaker, and the seat vibrated in response to engine speed. Participants drove a coupe.
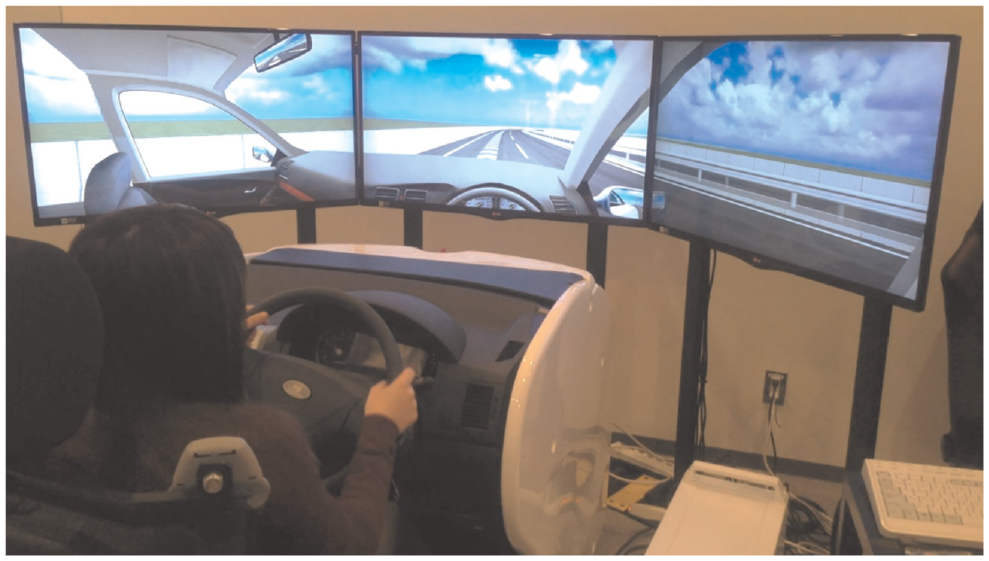
A participant in the driving session.
Course
The course, a 36.266-km rural divided highway with two lanes in each direction, was created based on the Japanese highway design standard. The course consisted of nine U-shaped blocks (Figure 4). Output from the driving simulator was analyzed between S1 and S3 (Figure 4). The design speed was 80 km/h. Each block had four horizontal curves with a radius of 220 m bound by 145.5-m clothoid curves following a 410-m tangent without a longitudinal grade. The cross-section widths were 3.5 m for a lane, 0.15 m for a lane line, 1.25 m for the left shoulder, and 0.3 m for the right shoulder. There were no buildings or speed limit signs along the course. The opposite lanes had traffic flow at 60 km/h with 7.2-s headways on average. Per the policy of Japan’s National Police Agency Department of Transportation ( 45 ), the marking interval in the Convergent condition was decreased in stages (Table 1).
Placement of a Series of the Road Markings
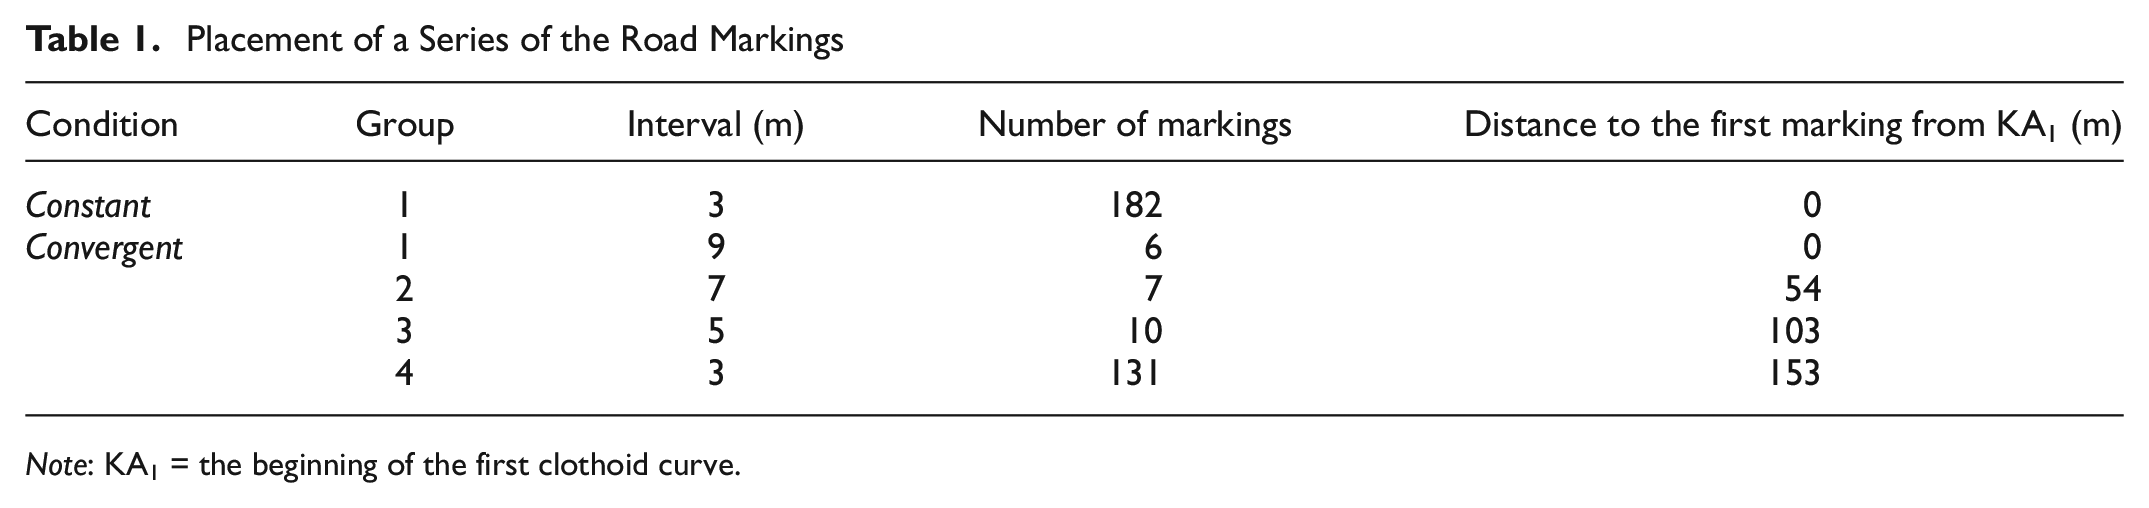
Note: KA1 = the beginning of the first clothoid curve.
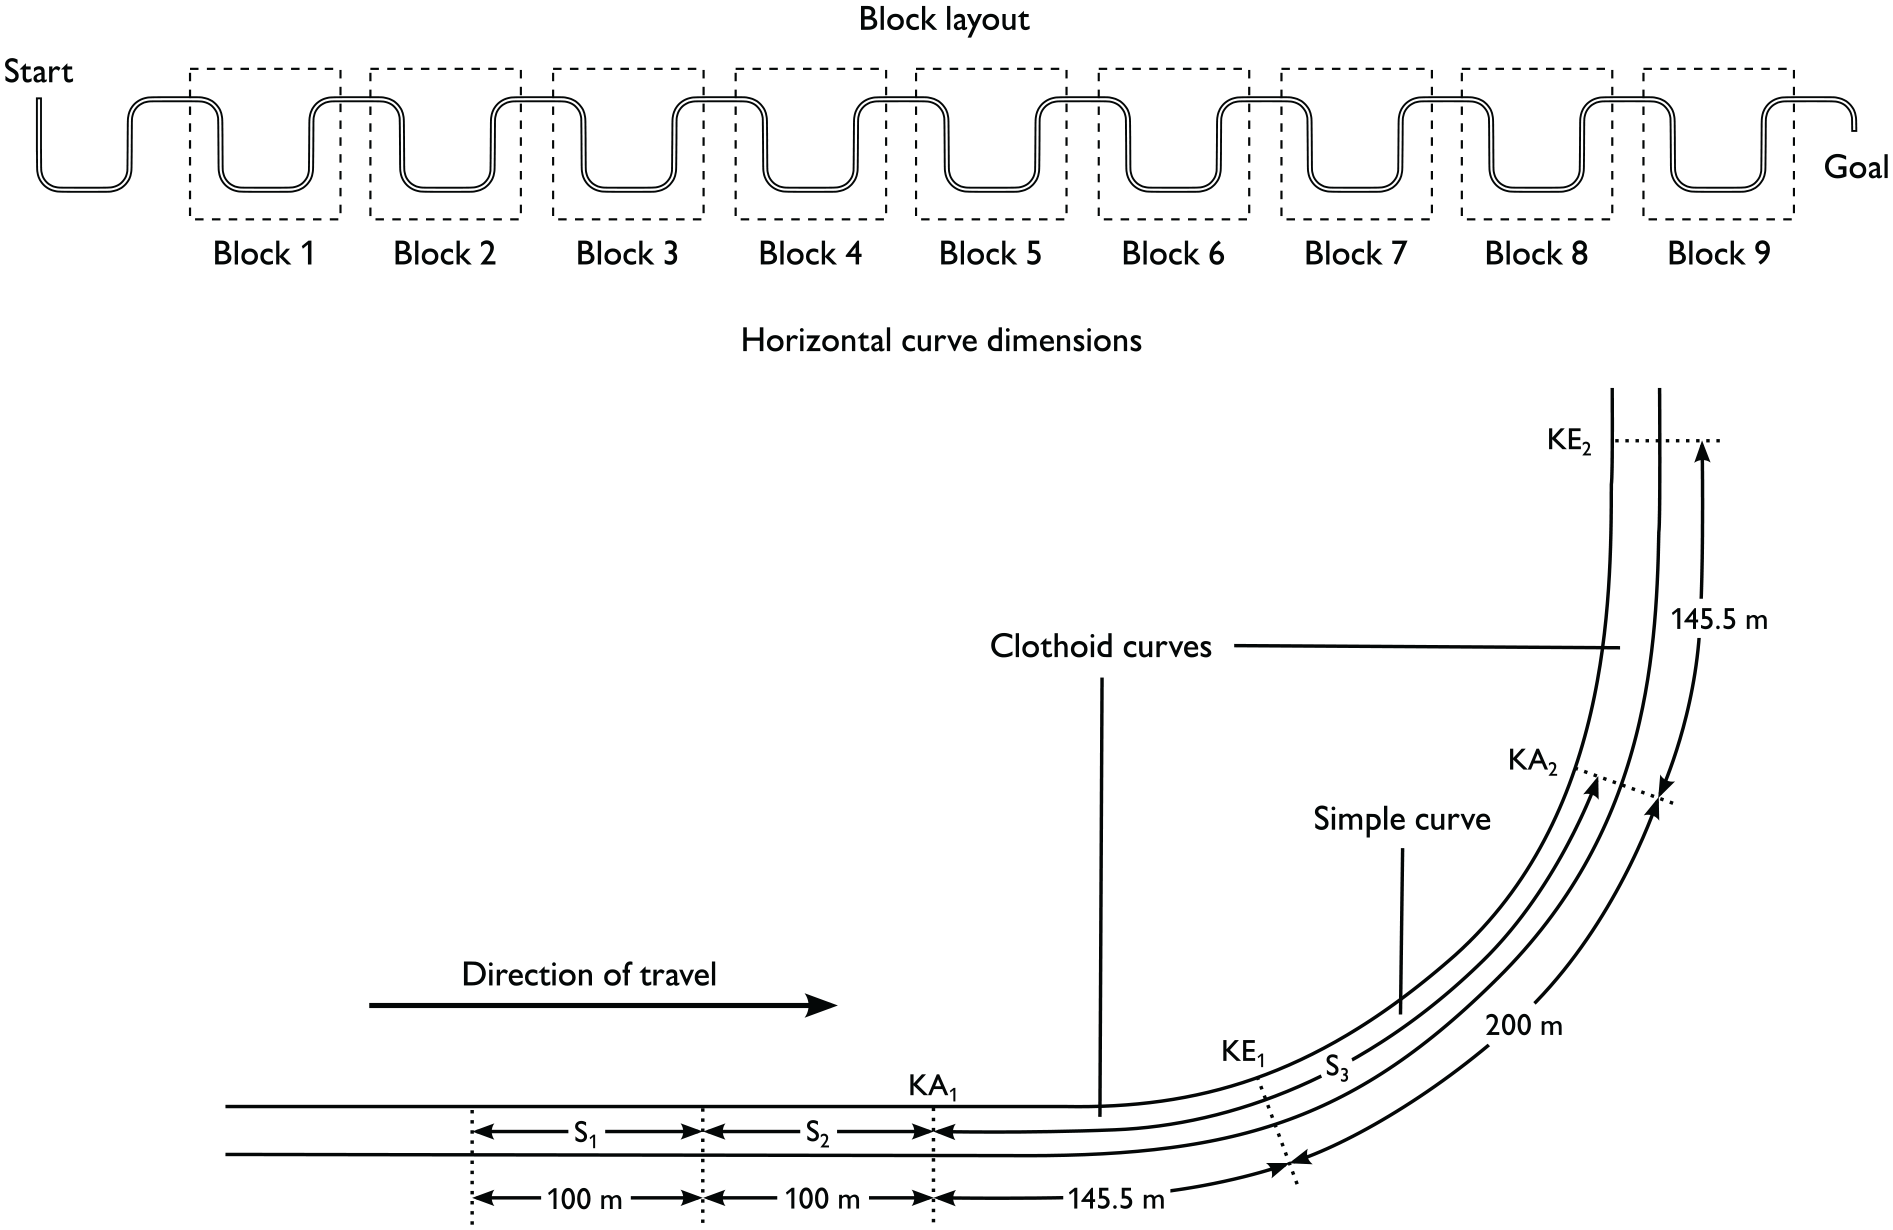
The course layout.
Speed Reduction Markings
Four patterns of white speed reduction markings—Parallelogram Edge Line, Wide Chevron, Narrow Chevron, and Optical Dots—were displayed (Figure 5). Each pattern of road markings was installed in S1, S2, and S3 in Figure 4. The order of the road markings’ shape and interval were counterbalanced separately using the ABBA method to restrain the effects of the order of road marking presentation; the participants experienced a series of conditions in the first half of the course and the same conditions in the reverse order in the second half (Table 2).
Counterbalanced Horizontal Curve Profiles
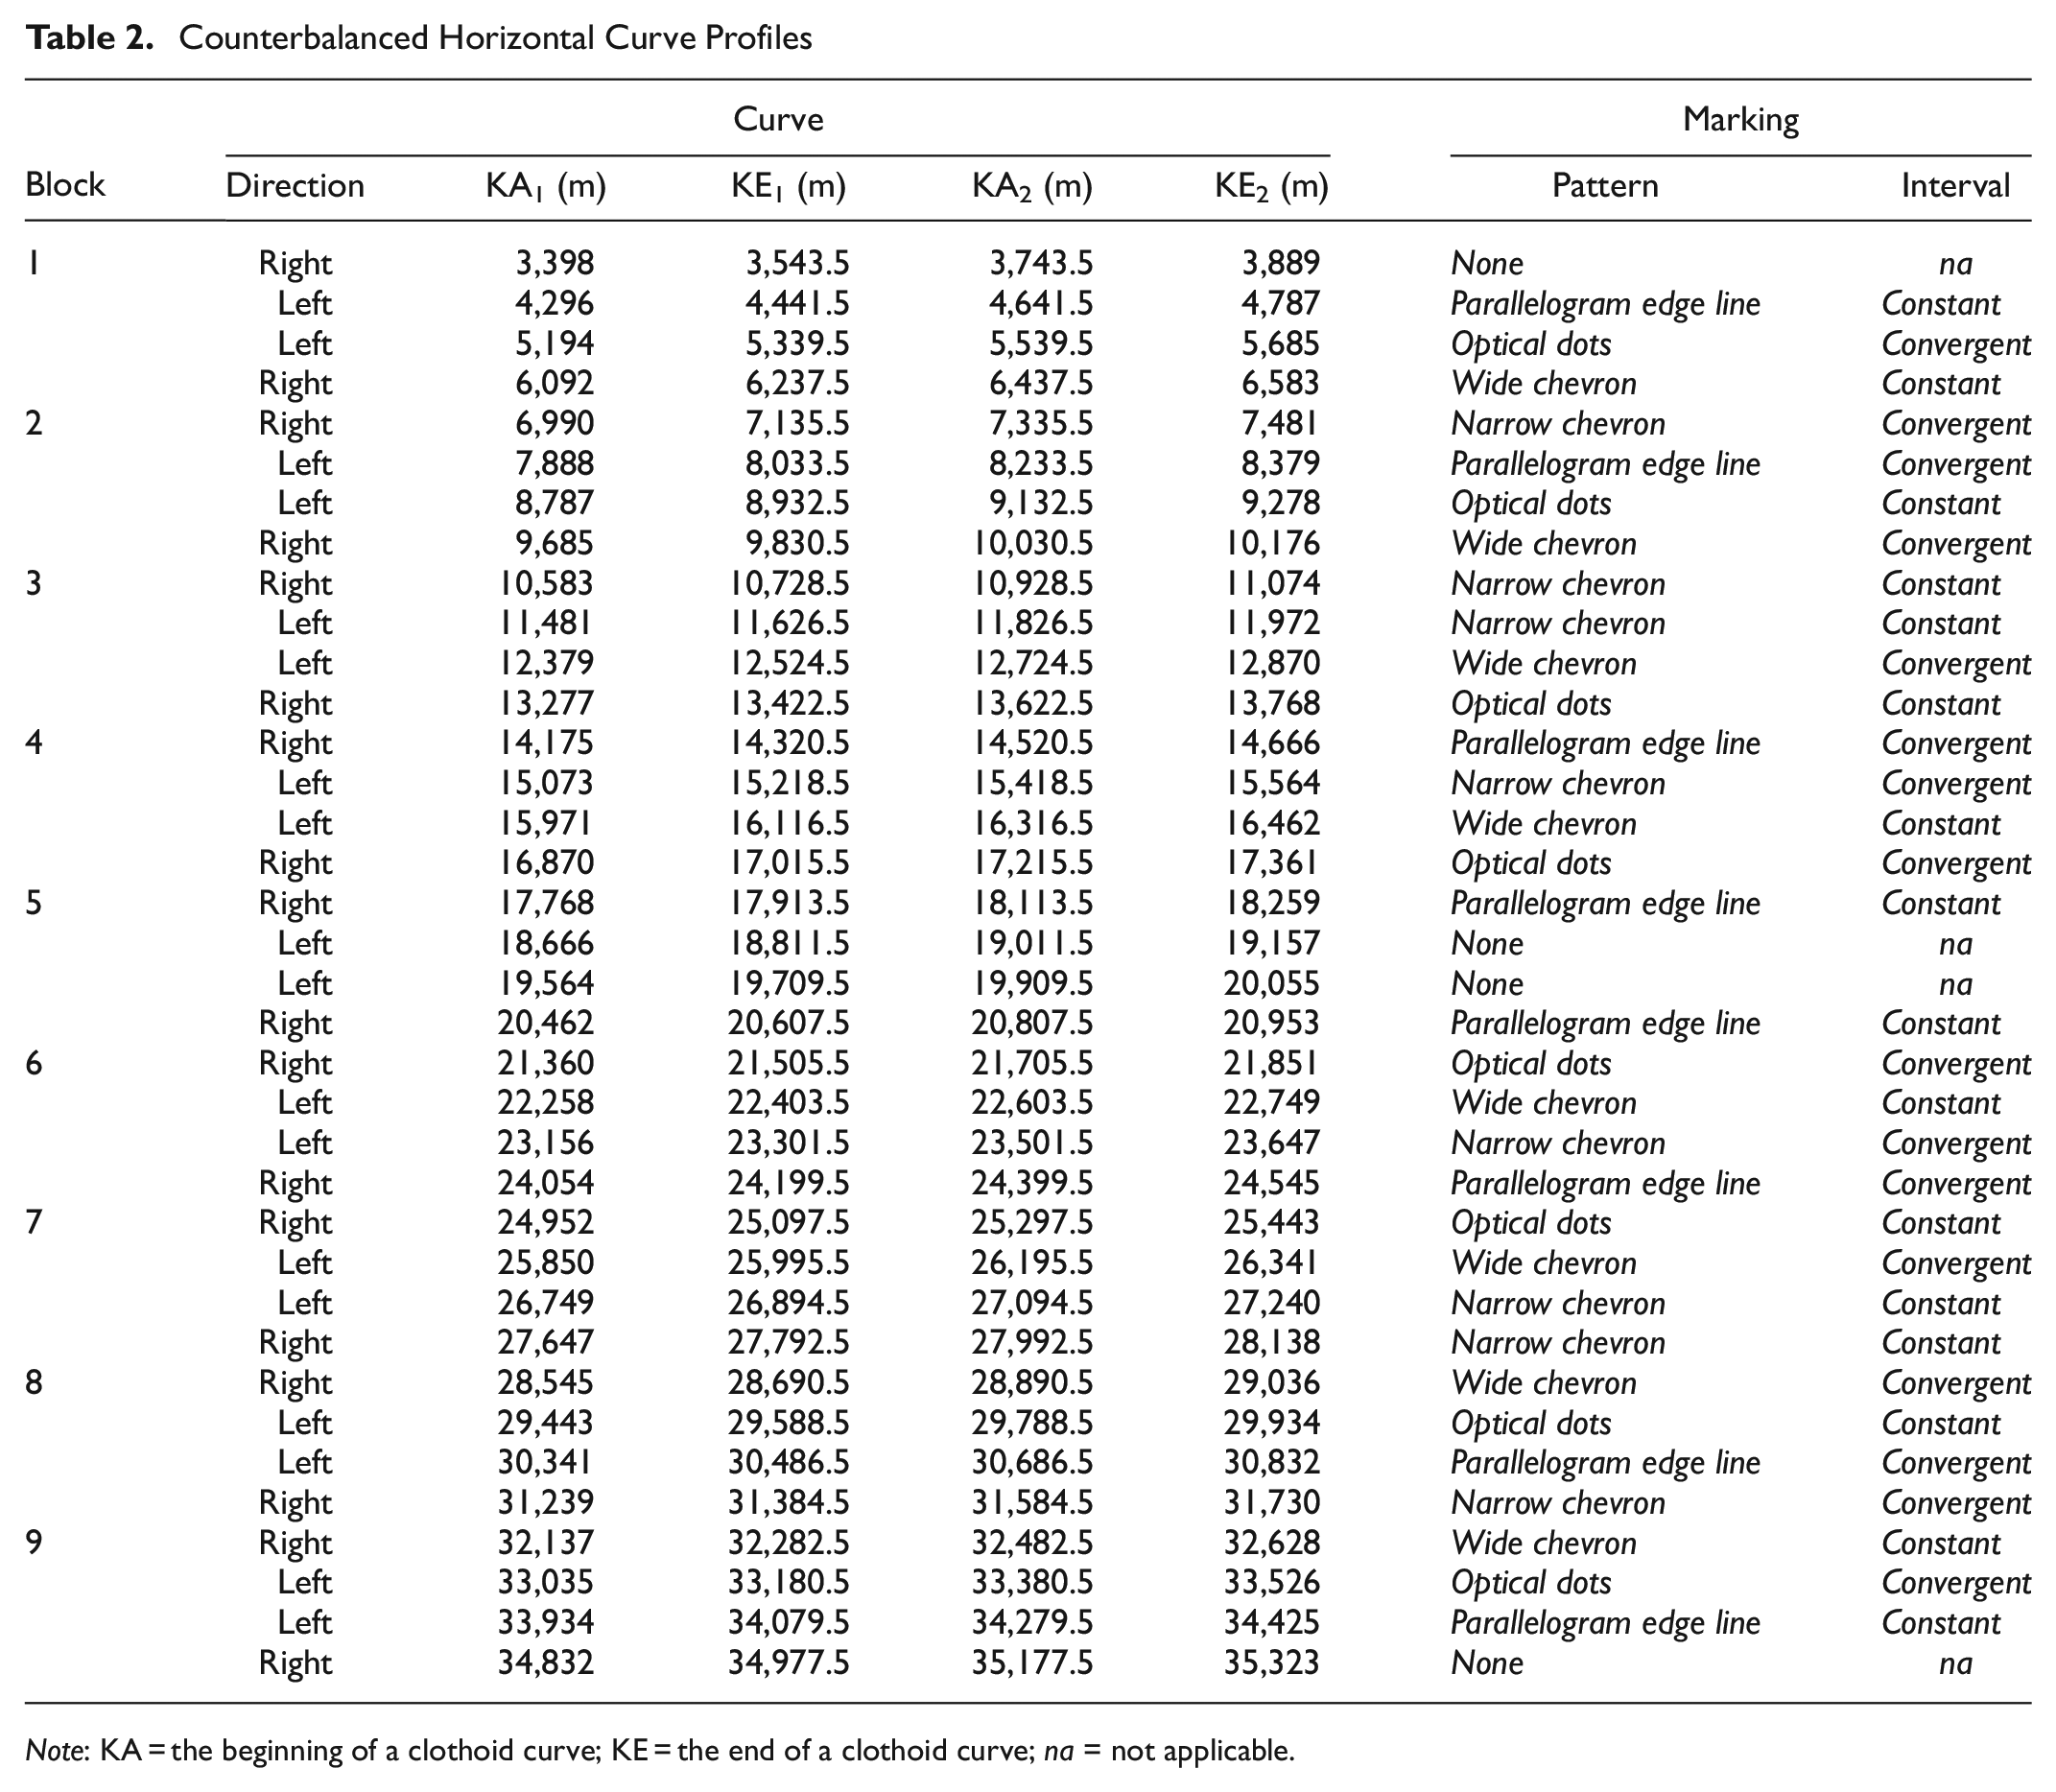
Note: KA = the beginning of a clothoid curve; KE = the end of a clothoid curve; na = not applicable.

Dimensions of the four patterns of pavement markings: (a) Parallelogram Edge Line, (b) Wide Chevron, (c) Narrow Chevron, and (d) Optical Dots.
Computer Generated Animation Questionnaire
A modified version of the Computer Generated Animation Questionnaire (CGAQ) ( 47 ) was used in this study to assess the participants’ subjective feelings about the road markings. The original questionnaire was developed to assess designs on a tunnel wall, under the philosophy that exceedingly odd or distracting visual stimuli should not be used to avoid unintended driving maneuvers (e.g., harsh braking). In this study, the phrase “tunnel walls” was rephrased appropriately, resulting in five items: Feeling of Danger, Feeling of Speeding, Eyes on the Road, Driving Difficulty, and Difficulty of Grasping Distance. Each item was evaluated on the seven-point Likert scale (“1 = Strongly disagree,”“2 = Disagree,”“3 = Somewhat disagree,”“4 = Neither agree nor disagree,”“5 = Somewhat agree,”“6 = Agree,”“7 = Strongly agree”). Driving Difficulty was considered a surrogate measure of mental workload because mental workload, effort, and task difficulty are strongly correlated ( 48 ). Participants assessed the scales while watching video clips of a driver’s view at 80 km/h through a right horizontal curve section with each pattern of Constant markings (Figure 6). The questionnaire was presented using a laptop computer.
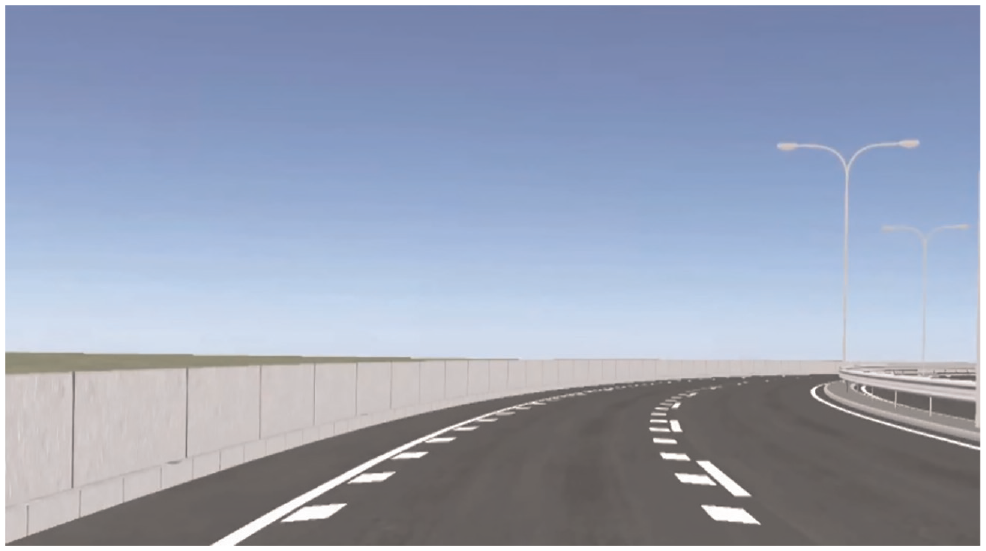
Screenshot of a video clip in the CGAQ.
Grid Image Questionnaire
The Grid Image Questionnaire (GIQ) is comprised of five static images of right simple curve sections from the driver’s view, with 1,800 (60 × 30) square grids overlayed (Figure 7). Participants were asked to report the areas they specifically looked at or paid attention to during the driving session by circling the areas on sheets of paper. Each image in this questionnaire had a different pattern of road markings.

A sheet in the GIQ.
Procedure
The experiment was conducted in Room M308 at Osaka University School of Human Sciences Main Building.
Informed Consent
All participants gave their informed consent for inclusion before participating in the study. The consent form described the purpose of the study as “to reveal driving behavior,” and ensured participants’ right to quit the experiment any time for any reason. Participants also filled in bank transfer forms to receive compensation.
Driving Session
Participants first went through a 10-min practice session in the driving simulator, where they were instructed to drive within a lane on an urban highway at the speed they perceived as safe, checking a speedometer and images in the side mirrors as needed. The practice session was followed by a driving session in which the speedometer was covered with a sheet of black paper. In the driving session, participants were instructed to drive in the left lane on a highway at the speed they felt was safe until the end of the course.
Questionnaire Session
After the driving session, participants responded to the CGAQ and GIQ. The order of videos and images was counterbalanced between participants. After completing the questionnaires, participants were asked if they had noticed the convergence of some road marking intervals.
Data Analyses
In the driving session, we used a two-layer hierarchical research design composed of an experiment with a single factor and a four-by-two factorial research design for speed-related measures. All independent variables were within-subject variables. The independent variable in the experiment with a single factor was the existence of road markings (Control and Treatment). The four-by-two factorial research design featured five shapes (None, Parallelogram Edge Line, Wide Chevron, Narrow Chevron, and Optical Dots) and their intervals (Constant and Convergent) as independent variables. The dependent variables were mean speed, throttle, and SDLP. For SDLP, the marking shape was the only independent variable. For the questionnaire session, marking shape was a within-subject independent variable.
Statistical analyses were performed using Microsoft Office Excel 2013 and PASW Statistics 18.0. When Mauchly’s sphericity test indicated that the assumption of sphericity had been violated, the Greenhouse–Geisser correction was applied when epsilon was .75 or smaller; the Huynh–Feldt correction was applied when epsilon was larger than .75. The significance level of these tests was .05. The Bonferroni correction was applied to multiple comparisons.
Mean Speed and Throttle
For speed related measures, paired t-tests were conducted in S1, S2, and S3 to examine the effects of the existence of the speed reduction markings, followed by a two-way repeated-measures analysis of variance (ANOVA) if a paired t-test revealed any significant difference in the section.
SDLP
A one-way repeated-measures ANOVA was performed at simple horizontal curves. Because there were no clear rationales that laterally scattered speed reduction markings such as Wide Chevron and Optical Dots prevent swerving, comparisons were made among None, Parallelogram Edge Line, and Narrow Chevron. Participants deviating greater than three standard deviations from the mean were considered outliers.
CGAQ
A one-way repeated-measures ANOVA was performed on each item, followed by post hoc comparisons when the ANOVA revealed any significance.
GIQ
Heat maps of each condition were generated based on stacked grids indicated by the participants. Each grid was counted as one when a participant’s circled area overlapped with more than 50 % of the grid’s area; otherwise, the grid was considered to be null.
Results
One participant’s log file was permanently lost because of a program crash. In addition, 10 participants’ lane position data were lost because of improper settings in the driving simulator. For this reason, the final sample size varied across the measures: 38 for speed-related measures, 28 for lane position, and 39 for the questionnaires. Tables 3 exhibits mean speed, mean throttle, SDLP, and their standard deviations, by condition. Table 4 shows the descriptive statistics of the ANOVAs performed.
Mean Speed and Throttle by Condition
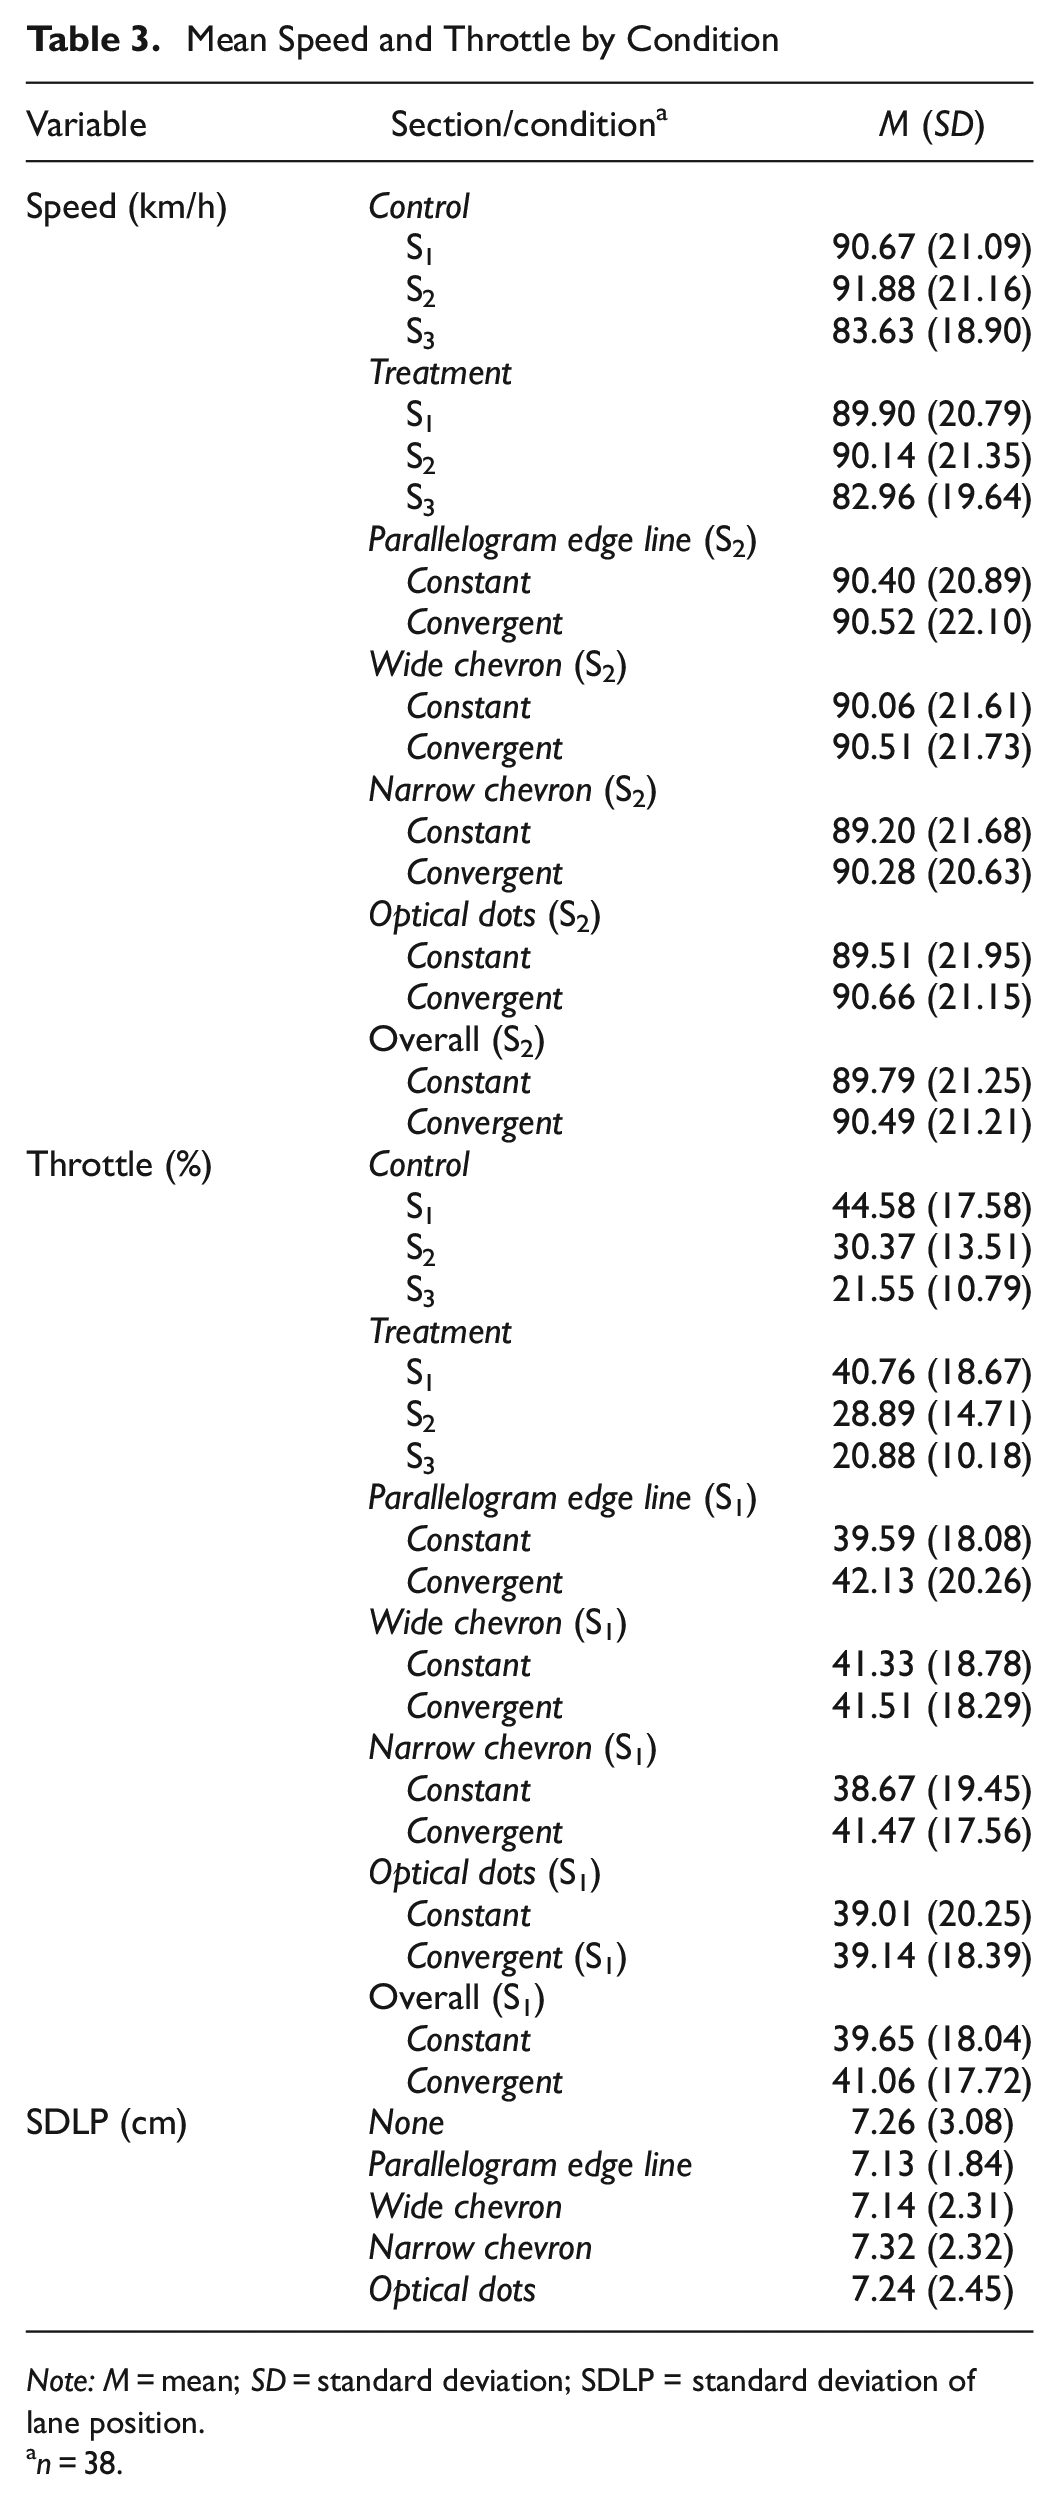
Note: M = mean; SD = standard deviation; SDLP = standard deviation of lane position.
n = 38.
Descriptive Statistics of Analyses of Variance (ANOVAs)
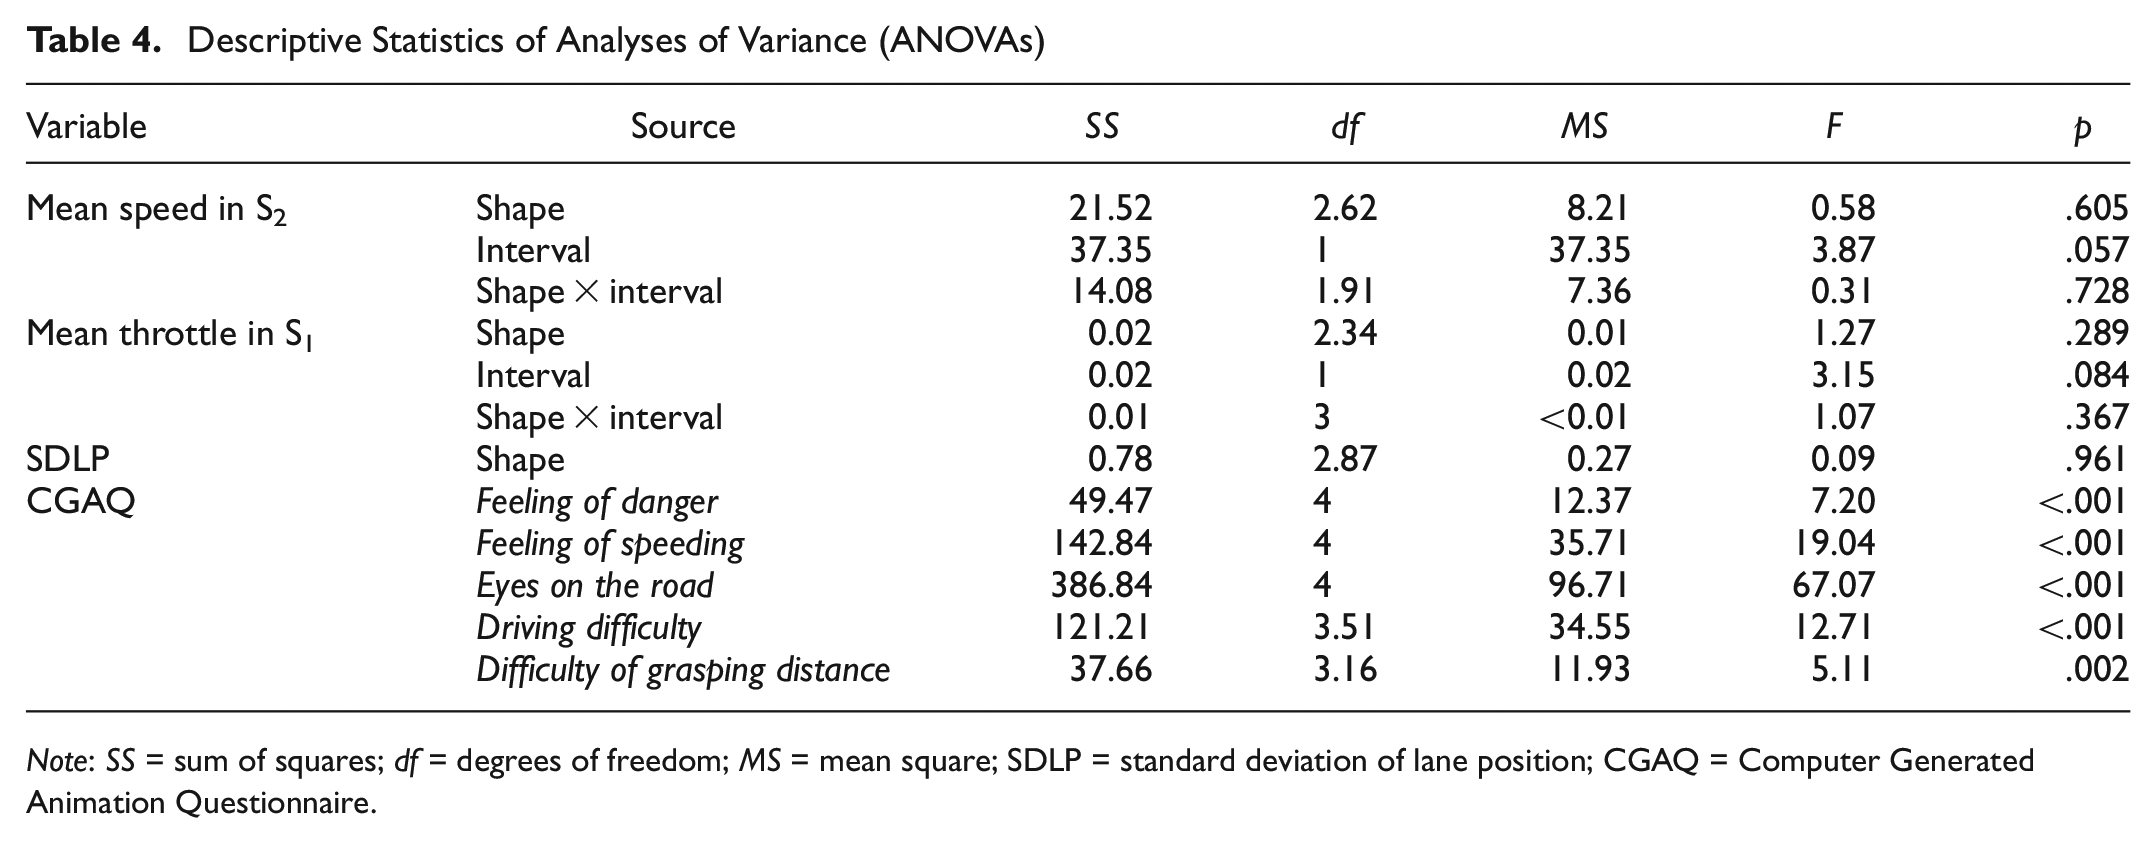
Note: SS = sum of squares; df = degrees of freedom; MS = mean square; SDLP = standard deviation of lane position; CGAQ = Computer Generated Animation Questionnaire.
Mean Speed
Figure 8 shows mean speeds in None, Constant, and Convergent conditions at a curve. In the Treatment condition, mean speed fell by 0.77 km/h (0.85 %) in S1, 1.74 km/h (1.89 %) in S2, and 0.67 km/h (0.81 %) in S3, relative to the speed in the Control condition. A paired t-test revealed a significant difference in mean speed in S2 (t(37) = 2.37, p = .046), while no significant differences were found in S1 (t(37) = 1.23, p = .452, not statistically significant [ns]) or S3 (t(37) = 0.98, p = .666, ns). In S2, mean driving speed was 89.79 km/h (SD = 21.25 km/h) in the Constant condition and 90.49 km/h (SD = 21.21 km/h) in the Convergent condition. For S2, Mauchly’s sphericity test indicated that the assumption of sphericity had been violated in marking shape (χ2(5) = 12.54, p = .028) as well as in interaction of shape and interval (χ2(5) = 29.31, p < .001). As a result, the degrees of freedom adjusted with the Huynh-Feldt correction and the Greenhouse-Geisser correction were applied to shape (ε = .87) and interaction of shape and interval (ε = .67), respectively. A two-way repeated-measures ANOVA did not reveal a main effect for shape (F(2.62, 96.95) = 0.58, p = .605, η p 2 = 0.02, ns), marking interval (F(1, 37) = 3.87, p = .057, η p 2 = 0.10, ns), or any interaction of shape and interval (F(1.91, 70.73) = 0.31, p = .728, η p 2 = 0.01, ns).
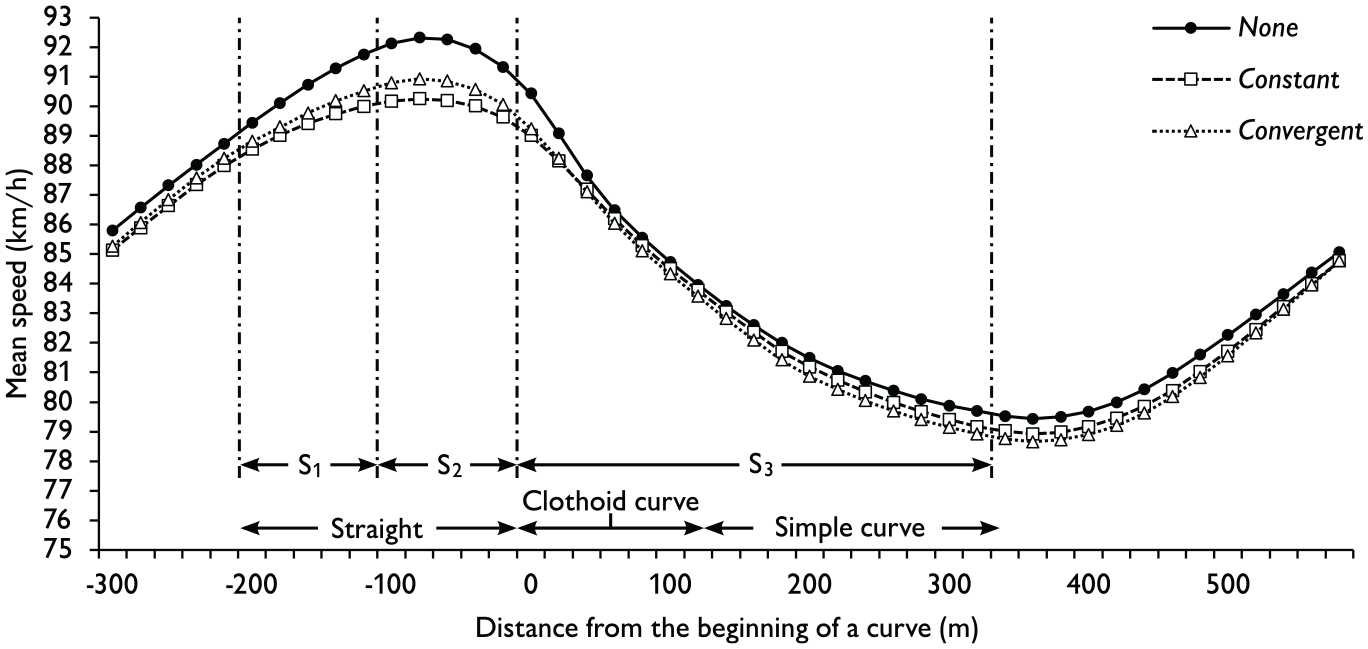
Mean speeds in None, Constant, and Convergent conditions at a curve.
Throttle
Figure 9 shows mean throttle values in None, Constant, and Convergent conditions at a curve. In the Treatment condition, mean throttle dropped 3.82 percentage points in S1, 1.48 percentage points in S2, and 0.67 percentage points in S3, compared to the throttle in the Control condition. A paired t-test revealed a significant difference in mean throttle in S1, (t(37) = 3.00, p = .015), while no significant difference was found in S2 (t(37) = 1.19, p = .723, ns) or S3 (t(37) = 0.98, p = .459, ns). In S1, mean throttle was 39.59 % in the Constant condition and 42.13 % in the Convergent condition. However, a two-way repeated-measures ANOVA did not find significant main effects for marking shape (F(2.34, 86.54) = 1.27, p = .289, η p 2 = 0.03, ns), marking interval (F(1, 37) = 3.15, p = .084, η p 2 = 0.08, ns), or the interaction of shape and interval (F(3, 111) = 1.07, p = .367, η p 2 = 0.03, ns). For S1, Mauchly’s sphericity test indicated that the assumption of sphericity had been violated in marking shape (χ2(5) = 24.83, p < .001); therefore, the degrees of freedom adjusted with the Huynh–Feldt correction was applied (ε = .78).
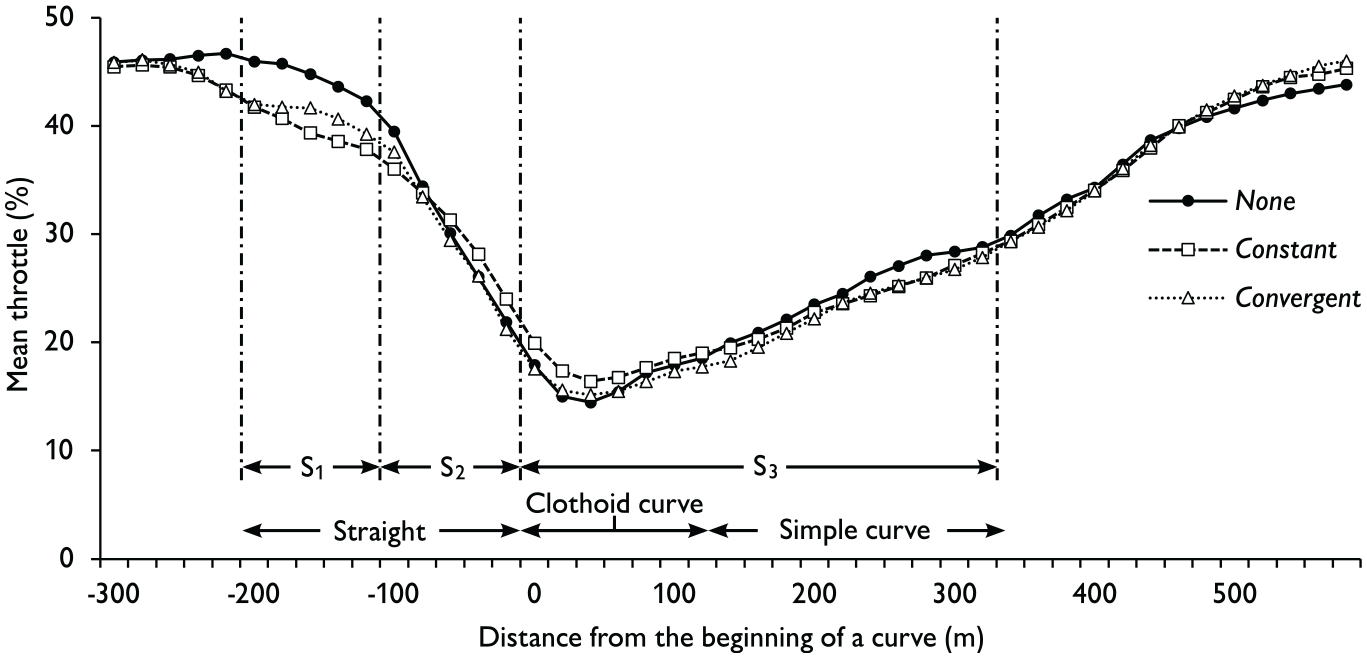
Mean throttle in None, Constant, and Convergent conditions at a curve.
SDLP
SDLPs were stable before increasing at a simple curve (Figure 10). At the curve, mean SDLP was 7.26 (SD = 3.08) cm in None, 7.13 (SD = 1.84) cm in Parallelogram Edge Line, 7.14 (SD = 2.31) cm in Wide Chevron, 7.32 (SD = 2.32) cm in Narrow Chevron, and 7.24 (SD = 2.45) cm in Optical Dots conditions. Mauchly’s sphericity test indicated that the assumption of sphericity had been violated (χ2(9) = 22.17, p = .008); therefore, the degree of freedom adjusted with the Greenhouse–Geisser correction was applied (ε = .72). A one-way ANOVA did not reveal a significant effect for marking shape (F(2.87, 77.55) = 0.09, SS = 0.78, MS = 0.27, p = .961, η p 2 = 0.00, ns). Each participant’s SDLP was plotted in a control chart (Figure 11). Here, participants 15 and 26 showed relatively unstable lateral positions in None, but they did not swerve in other conditions with the road markings. No participants exceeded M + 3SD.
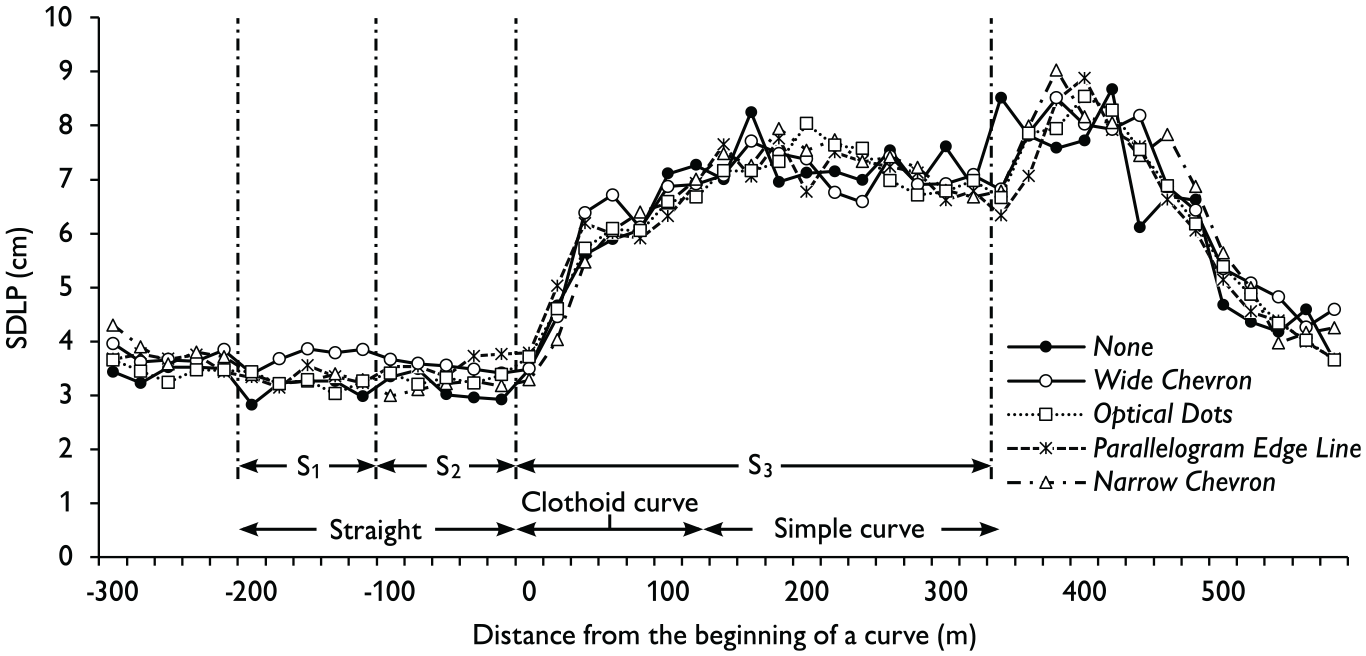
SDLP at a curve with None, Parallelogram Edge Line, Wide Chevron, Narrow Chevron, and Optical Dots marking patterns.
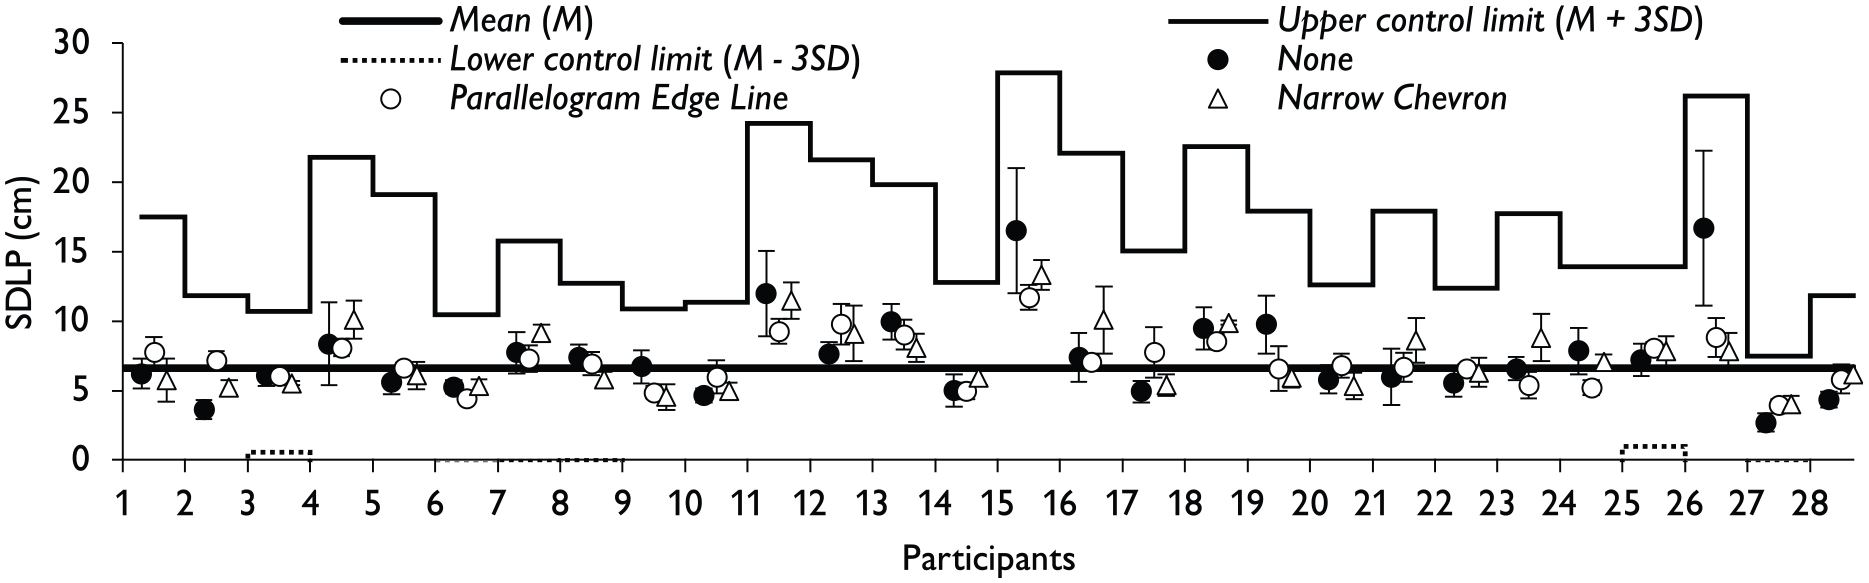
Control chart of each participant’s SDLP at a simple curve.
CGAQ
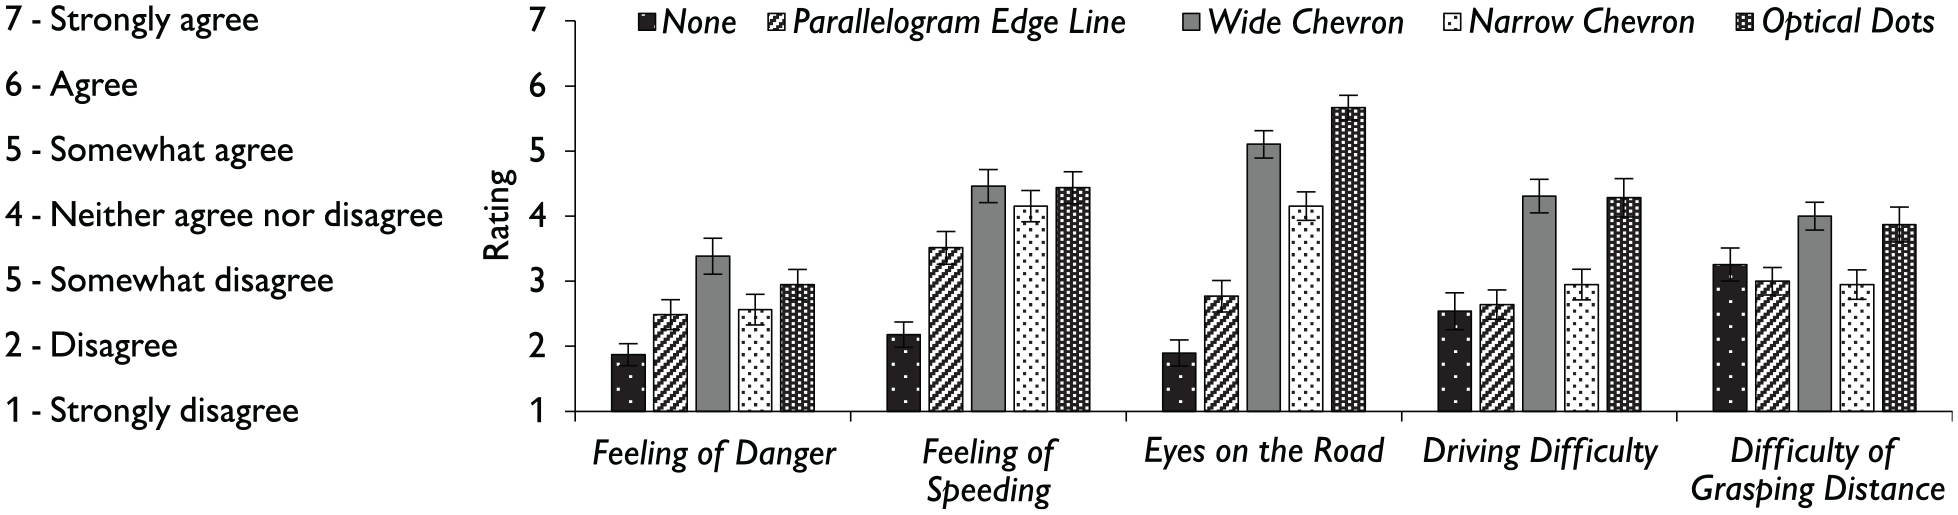
Figure 12 exhibits ratings in each condition in the CGAQ.
One-way ANOVAs of the CGAQ.
Feeling of Danger
A one-way repeated-measures ANOVA found a significant effect of marking patterns on subjective ratings of the Feeling of Danger (F(4, 152) = 7.20, p < .001, η p 2 = 0.16). Post hoc comparisons with a Bonferroni correction showed that the Feeling of Danger was rated significantly higher in Wide Chevron (p < .001) and Optical Dots (p = .001) than in None, and in Wide Chevron than in Narrow Chevron (p = .017).
Feeling of Speeding
A one-way repeated-measures ANOVA found a significant effect of marking patterns on subjective ratings of the Feeling of Speeding (F(4, 152) = 19.04, p < .001, η p 2 = 0.33). Post hoc comparisons with a Bonferroni correction showed that the Feeling of Speeding was rated significantly higher in Parallelogram Edge Line (p = .001), Wide Chevron (p < .001), Narrow Chevron (p < .001), and Optical Dots (p < .001) than in None.
Eyes on the Road
A one-way repeated-measures ANOVA found a significant effect of marking patterns on subjective ratings of Eyes on the Road (F(4, 152) = 67.07, p < .001, η p 2 = 0.64). Post hoc comparisons with a Bonferroni correction showed that Eyes on the Road was rated significantly higher in Parallelogram Edge Line (p = .004), Wide Chevron (p < .001), Narrow Chevron (p < .001), and Optical Dots (p < .001) than in None; in Wide Chevron (p < .001), Narrow Chevron (p < .001), and Optical Dots (p < .001) than in Parallelogram Edge Line; in Wide Chevron (p = .016) than in Narrow Chevron; and in Optical Dots (p < .001) than in Narrow Chevron.
Driving Difficulty
Because Mauchly’s sphericity test indicated that the assumption of sphericity for Driving Difficulty had been violated (χ2(9) = 19.31, p = .023), the degrees of freedom adjusted with the Huynh–Feldt correction was applied (ε = .88). A one-way repeated-measures ANOVA found a significant effect of marking patterns on subjective ratings of Driving Difficulty (F(3.51, 133.31) = 12.71, p < .001, η p 2 = 0.25). Post hoc comparisons with a Bonferroni correction showed that Driving Difficulty was rated significantly higher in Wide Chevron (p < .001) and Optical Dots (p = .006) than in None, higher in Wide Chevron (p < .001) and Optical Dots (p = .001) than in Parallelogram Edge Line; higher in Wide Chevron (p < .001) than in Narrow Chevron, and higher in Optical Dots (p = .005) than in Narrow Chevron.
Difficulty of Grasping Distance
Because Mauchly’s sphericity test indicated that the assumption of sphericity for the Difficulty of Grasping Distance had been violated (χ2(9) = 25.66, p = .002), the degrees of freedom adjusted with the Huynh–Feldt correction were applied (ε = .79). A one-way repeated-measures ANOVA found a significant effect of marking patterns on subjective ratings of the Difficulty of Grasping Distance (F(3.16, 119.98) = 5.11, p = .002, η p 2 = 0.12). Post hoc comparisons with a Bonferroni correction showed that the Difficulty of Grasping Distance was rated significantly higher in Wide Chevron (p = .006) and Optical Dots (p = .038) than in Parallelogram Edge Line, higher in Wide Chevron (p < .001) than in Narrow Chevron, and higher in Optical Dots (p = .040) than in Narrow Chevron.
GIQ
Figure 13 shows the results of the GIQ. The participants’ attention was concentrated on the apex of the inner division line in the None condition. Although they also paid attention to the same area in the Parallelogram Edge Line condition, the depth of concentration was smaller in the Parallelogram Edge Line than in None, indicating relatively closer attention to the near side of the inner division line and to the far side of the outer division line. Wide Chevron and Narrow Chevron both showed a line of attentional concentration along the center of the patterns, though the depth of concentration was larger in Narrow Chevron. Attention was more laterally scattered in Wide Chevron than in Narrow Chevron. In the Optical Dots condition, participants paid attention to a relatively wider area across the markings.
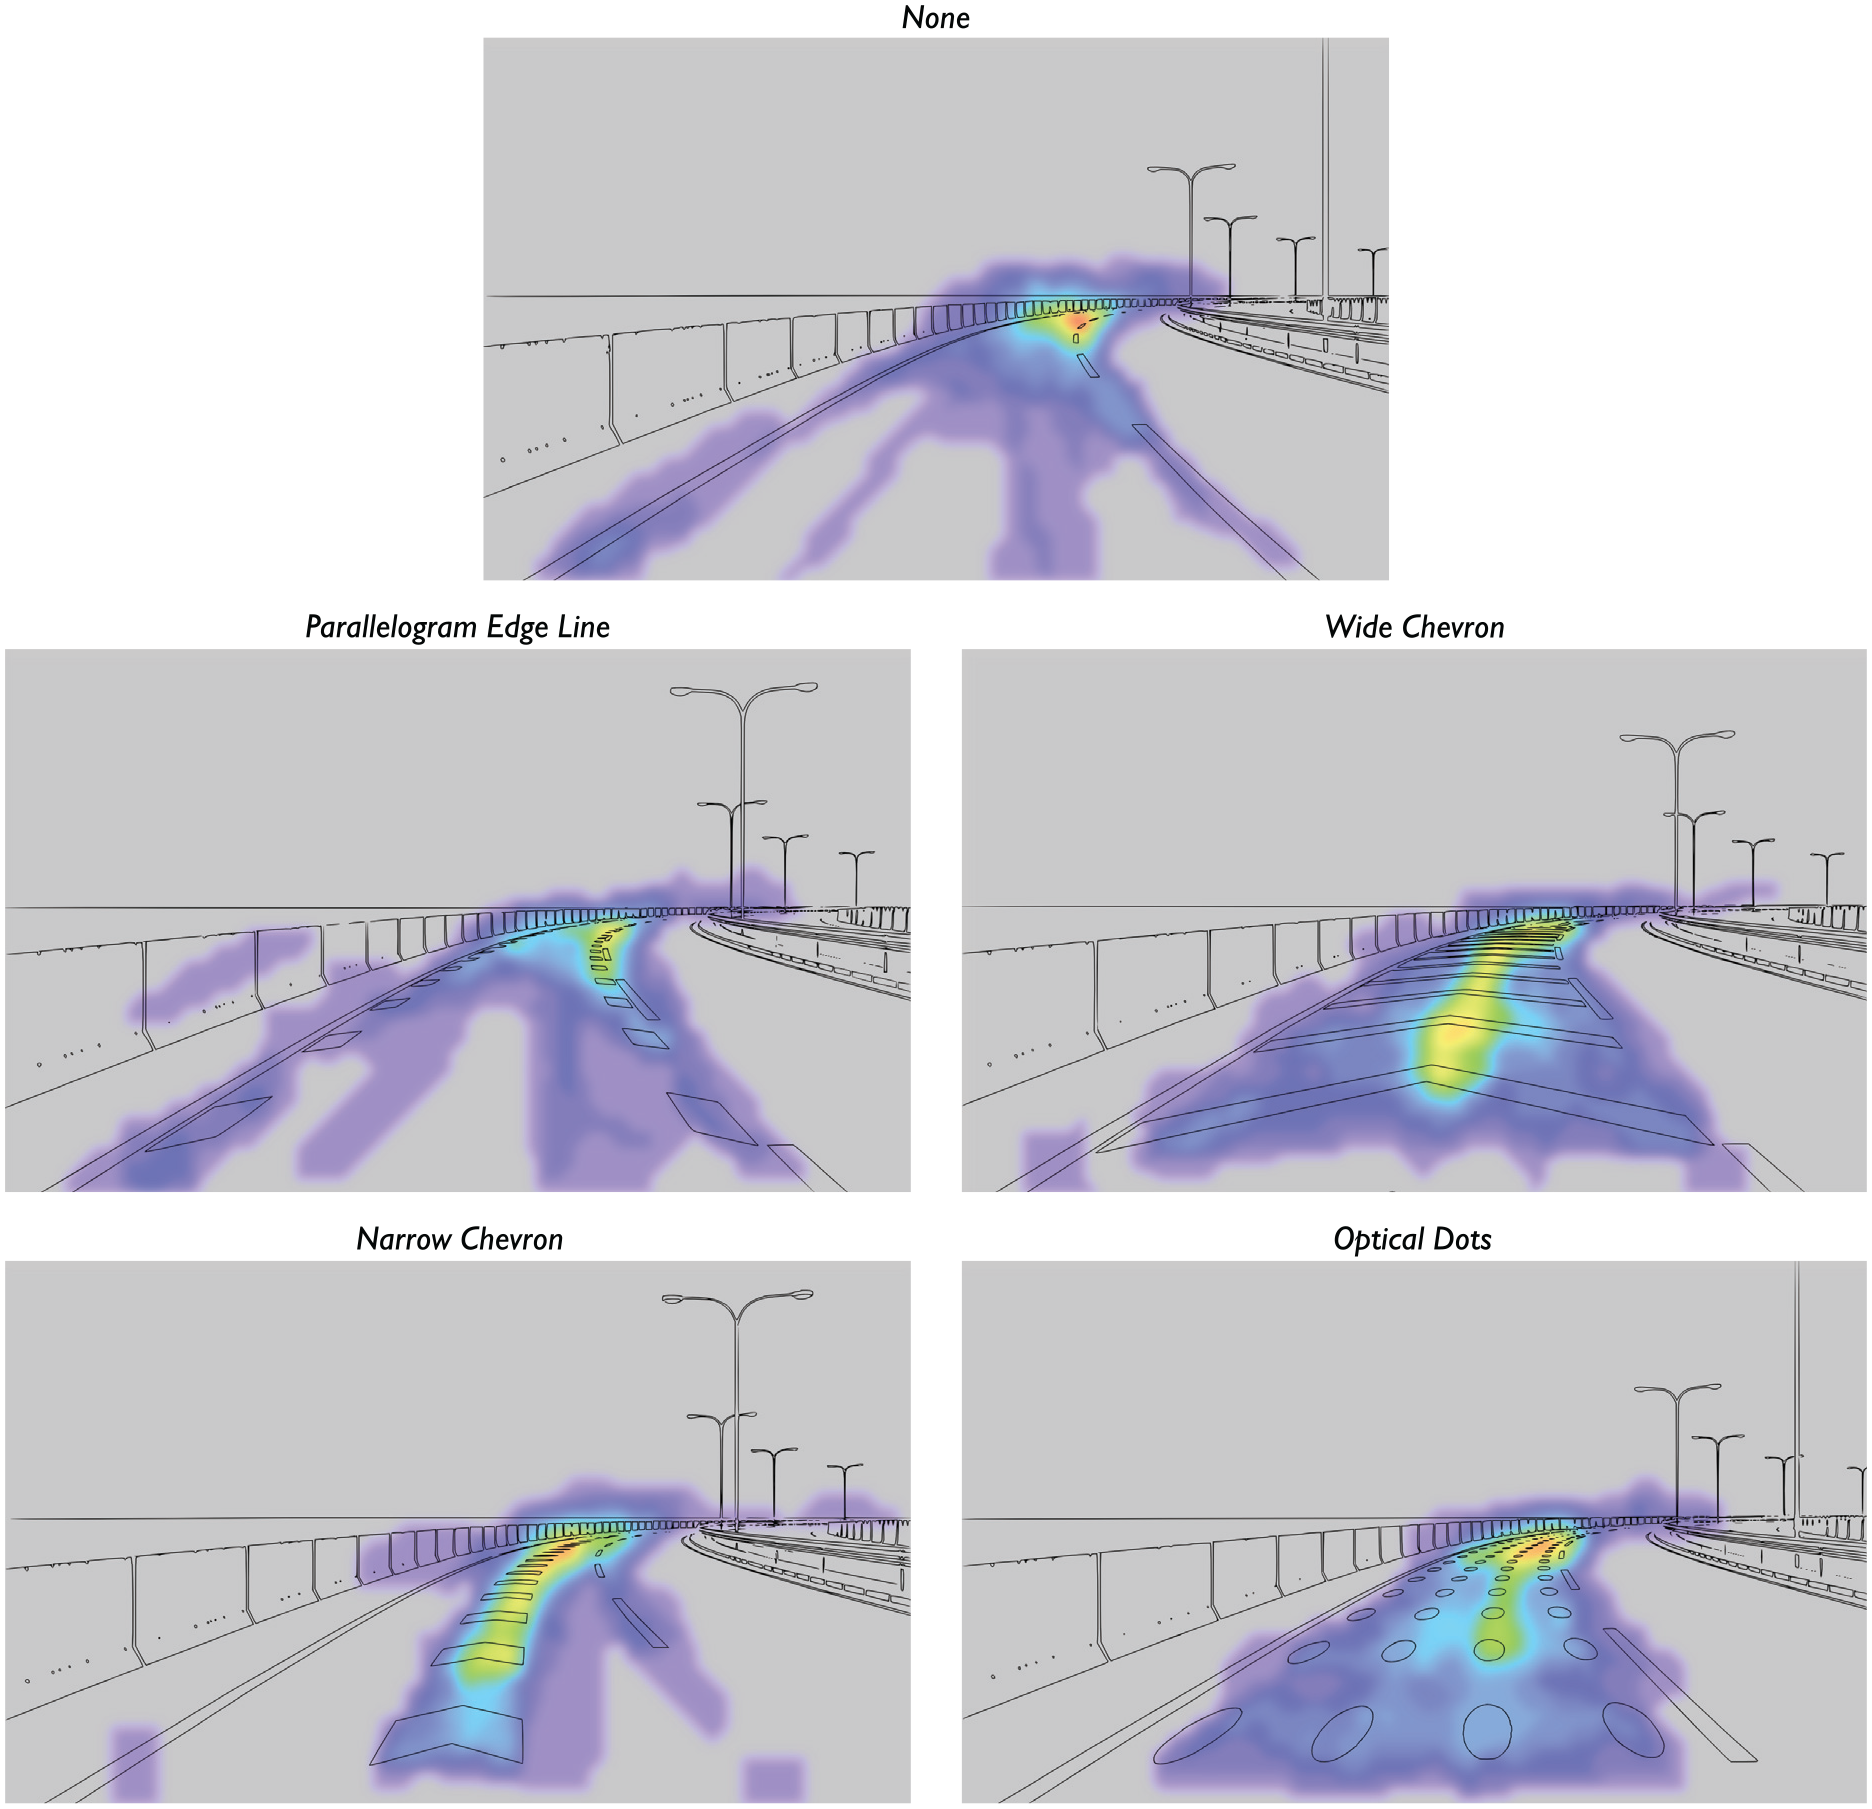
Heat maps indicating the areas that attracted participants’ attention in each marking pattern.
Three (7.79 %) out of the 39 participants noticed the interval convergence in Parallelogram Edge Line and Narrow Chevron conditions, whereas seven (17.95 %) participants noticed the convergence in Wide Chevron and Optical Dots conditions. A Cochran’s Q test did not reveal any differences in noticeability of the interval convergence by marking shape (p = .094, ns).
Discussion
The present study investigated the effects of speed reduction marking patterns on simulated driving speed and lane position as well as drivers’ subjective feelings, mental workload, and visual attention. To overcome the indeterminacy between the perceptual illusion of acceleration and the cognitive alerting effect caused by speed reduction marking patterns, we conservatively ruled out confounding factors by using the minimum interval in a set of converging intervals as a fixed interval in the Constant condition. The following subsections summarize the interpretation of each result, practical implications, limitations, and future research needs.
Driving Speed
The results indicated that the speed reduction markings predominantly worked as cognitive alerting devices rather than as perceptual cues that increase the perceived speed because:
mean driving speed and throttle were not larger in the presence of the speed reduction markings with a converging interval than those with a constant interval (
the presence of the road markings lowered the mean speed by 1.74 km/h in the segment right before the first clothoid curve.
An alerting effect of the speed reduction markings was dominant because vα’ was not larger than vβ. This result strengthens the “large alerting device” theory by Jarvis and Jordan ( 33 ) and Godley et al. ( 34 ) as well as the findings of Katz ( 23 ) and Hunter et al. ( 27 ), who reported different levels of speed reductions spatiotemporally. The speed reduction in advance of the markings also implied the presence of an alerting effect. The results of this experiment were similar to recent simulation studies ( 31 , 32 ), in that the existence of the speed reduction markings reduced driving speed and there were no differences in speed by marking shape.
Nevertheless, the results do not deny the presence of the acceleration illusion, because the illusion of speeding and the alerting effect are not mutually exclusive. Most participants did not notice the convergence of the marking intervals. This was an interesting finding as there had been little literature about the noticeability of the interval convergence before the present study. While the alerting effect seemed to be dominant, this result leaves the door open to using pavement markings as unobtrusive perceptual cues as well in some circumstances.
SDLP
To evaluate the effectiveness of the speed reduction markings on swerving prevention, SDLP was compared among the three different conditions: None, Parallelogram Edge Line, and Narrow Chevron. No significant effects of the road markings were found on SDLP. We tried plotting each participant’s SDLP in each condition in a control chart (Figure 11)—a tool commonly used to monitor unusual values ( 49 ). While the chart showed that two participants had relatively unstable lateral positions in the None condition compared to the other conditions with the speed reduction markings, none of the participants deviated more than three standard deviations from the mean. Overall, the observed SDLPs were smaller than those in earlier studies ( 40 , 43 ). This might have been because the simulator’s lane position did not have absolute validity. If the small SDLP had been caused by a floor effect, it would be interesting to observe in future studies how SDLP in wider lanes is associated with mental workloads.
Subjective Feeling
Questionnaires were used as preliminary tools to capture the participants’ subjective feelings and visual attention patterns associated with each speed reduction marking shape. In the CGAQ, Driving Difficulty was important because a high workload can potentially contribute to a larger speed reduction effect, as driver-behavior models ( 7 – 10 ) had suggested. In the questionnaire, the wider markings, such as Wide Chevron and Optical Dots, were associated with a larger mental workload, as measured by Driving Difficulty, than the other markings (Figure 12). Eyes on the Road and the Difficulty of Grasping Distance showed a similar trend with Wide Chevron and Optical Dots rated the highest. Interestingly, Feeling of Speeding showed the same pattern as the results of speed and throttle; all the markings were rated higher than None, with no significant differences among the marking shapes. However, it was unclear if the Feeling of Speeding was qualitatively closer to the feeling of acceleration or to the alerting effect, because the CGAQ only included the markings with the Constant interval.
Although the questionnaires were performed to explore the relationship between the effects of speed reduction markings and drivers’ subjective assessment measures, strong associations with mental workload, speed, and SDLP were not observed in this study since speed reduction and SDLP did not vary significantly by marking shape. In other words, the results did not parallel those in He et al. ( 43 ). However, this does not mean that mental workload does not affect or is not affected by driving speed; the mental workload from some pavement markings may be larger than other markings, but the magnitude of the difference may be too small to affect the driving speed at a detectable level. In this experiment, the association was at least too weak to observe. Notwithstanding, the results showing significantly different levels of subjective feelings with different marking shapes add new insights to existing literature. Not being a full-scale mental workload questionnaire, the CGAQ was somewhat exploratory; therefore, further evaluation would be needed to reveal the relationship between mental workload and speed reduction markings.
Visual Attention
The GIQ offered preliminary insights into drivers’ visual attention. When no speed reduction markings were present, the participants reported that they tended to look at the apex of the inner division line. This result matched existing literature ( 36 ). With Parallelogram Edge Line markings, participants paid more attention to the near side of the inner division line and the far side of the outer division line, suggesting there could have been a “virtual lane narrowing” effect. In contrast, the participants paid attention to the lane center with Wide Chevron and Narrow Chevron. This result was in line with the intentions of these road marking shapes as steering guidance to help drivers visually scan curvature. The laterally scattered attention patterns for Wide Chevron and Optical Dots were consistent with the relatively high scores in Eyes on the Road in the CGAQ.
Although the participants reported different attentional patterns in the GIQ, no significant differences in SDLP by the marking shape were observed. These results do not contradict each other because the GIQ attempted to capture where they looked, whereas SDLP captured how they drove.
Practical Implications
This paper explored the effects of speed reduction markings from a psychological perspective. Although the external validity of a driving simulator experiment might not be as high as field observations, the controlled experiment and questionnaires revealed some practical implications for what to install, when to install, and where to install for speed reduction and swerving prevention.
First, speed reduction markings can reduce the driving speed of those who are unfamiliar with the road segment. This insight is not unique to the present work, but the finding adds additional evidence of speed reduction to the existing body of literature.
Second, while the results did not reveal significant effects of marking shape on speed reduction or swerving prevention, there remain no substantial reasons to prevent practitioners from considering any of the four marking shapes. In regard to this result, we would like to emphasize that the statistical tests did not actively claim there were no differences; rather, the differences, if any, were too small to detect. The finding provides some degree of flexibility in the selection of the shape of speed reduction markings. For example, road agencies may choose Parallelogram Edge Line over Wide Chevron to save material costs. From a maintenance perspective, some jurisdictions may want to install Parallelogram Edge Line or Narrow Chevron instead of wide markings such as Wide Chevron or Optical Dots to avoid wheel paths. Also, it would not harm to install specific speed reduction markings such as Parallelogram Edge Line and Narrow Chevron in the hope of a potential swerving prevention effect (though this effect was not observed in this research).
Additionally, road agencies can make decisions based on the CGAQ. For example, Adachi et al. ( 47 ) had considered high scores in Eyes on the Wall and the Difficulty of Grasping Distance in the original CGAQ to be undesirable for tunnel walls because high scores in these items were thought to be distracting. Because some researchers claim that laterally scattered pavement markings (e.g., Optical Dots) convey helpful information about oncoming lane geometry to drivers ( 25 ), we do not make any conclusions here concerning whether this feature is good or bad for speed reduction markings. However, it may be reasonable to select or avoid Wide Chevron and Optical Dots based on the results of CGAQ, depending on how agencies think about human factors. The quantification of driver workload concerning road infrastructure is an ongoing issue requiring further research effort ( 50 ).
In addition to the aforementioned points, there is a unique suggestion in this study. The comparison between the Constant and Converging marking intervals indicated that longitudinally denser speed reduction markings can reduce driving speed more effectively than the markings with converging intervals that have longer intervals. Based on this result, perhaps speed reduction markings in the United States, which currently consist of a series of converging short transverse lines along lane lines ( 51 ), could be made more effective by using shorter, constant intervals or a more “stuffed” element (e.g., Parallelogram Edge Line).
Lastly, some practitioners might wonder about a good context or situation to use speed reduction markings. Although our study did not directly evaluate answers to this question, it provides a hint. The dominance of the alerting effect implies that drivers can “learn” when speed reduction markings are used out of context. If that is the case, the speed reduction effect will deteriorate over time, especially when speed reduction markings are placed out of context. Katz ( 23 ) and Hunter et al. ( 27 ) might have captured this phenomenon when they observed different speed reduction rates by site and speed changes nine months after the installation, respectively. Based on the results, it may be more appropriate to install speed reduction markings selectively rather than installing them as the first-choice countermeasures at a curve. In fact, the latest Manual on Uniform Traffic Control Devices also discourages the installation of speed reduction markings at sites mainly used by local or familiar drivers ( 51 ). Considering potential acclimation, speed reduction markings are expected to be the most effective in the long term at road segments frequented by unfamiliar drivers such as tourists ( 52 , 53 ). As Montella et al. ( 30 ) suggest, other explicit countermeasures, such as curve signs, advisory speed limit plaques, and chevron alignment signs ( 54 ), should be considered alongside speed reduction markings to maximize their effects.
Limitations and Future Research Recommendations
One limitation of the experiment was the participants. The participants in this study were primarily recruited on a college campus with a limited budget, meaning they were relatively young and perhaps inexperienced compared to the general driver population. Although the participants were daily drivers, literature reports that young male drivers are often associated with riskier driving ( 55 – 58 ), while another study reports smaller SDLP at horizontal curves among female drivers and older drivers ( 44 ). Therefore, it would be ideal for future research to include larger samples from a different or more general driver population to overcome these limitations associated with age, gender, or education.
Because of the limited sample size ( 59 ), the present study did not capture detailed speed profiles (e.g., 85th, 95th, or 99th percentile speed). Considering crashes are rare events, investigating the influence of speed reduction markings on relatively high percentile speed would be beneficial.
Also, it would be fruitful to study the effect size of speed reduction markings in urban settings with slopes, horizontal curvature, and mental workload. Furthermore, a study with eye-tracking would also reveal a more thorough picture of visual attention (e.g., unconscious eye movements).
From a practical standpoint, a cross-sectional assessment of real roadways is recommended, since simulator studies sometimes lack external validity and do not replicate drivers’ motivation or the physical collision risks on real roadways. Like many other medium-fidelity driving simulators, the driving simulator used in the present study only had relative validity in driving speed. Therefore, the magnitude of speed reduction on public roads, and the efficacy of markings compared to other countermeasures, should be investigated by driving simulators with absolute validity in speed or by observations on real roadways.
Currently, it is hard to quantify the cost–benefit ratio of speed reduction markings because long-term CMFs have not been developed ( 27 , 52 ). Because the present study and literature infer that drivers can acclimate to speed reduction markings ( 27 ), the existing CMFs based on two-year crash data ( 28 ) may have a limited scope. Perhaps, considerations should be given to drivers’ familiarity with the sites because the magnitude of speed reduction may vary depending on drivers’ familiarity with the sites ( 23 ). For these reasons, it would be better to develop CMFs of speed reduction markings based on longer-period crash data and even by highway functional classification ( 60 ). Field studies would enhance the scientific knowledge of speed reduction markings in regard to external validity.
Conclusions
Speed reduction markings, regardless of the shape, reduced driving speed before a horizontal curve. A larger speed reduction was observed with the markings with a denser, constant interval than those with progressively reduced intervals.
The result implies that the speed reduction markings worked primarily as cognitive alerting devices rather than devices that purely evoke a perceptual illusion of acceleration; thus, a speed reduction effect may decrease over time as drivers acclimate to the markings.
There were no observed effects of the speed reduction markings on swerving prevention.
Speed reduction markings may be most effective at road segments frequented by those unfamiliar with the segment.
Footnotes
Acknowledgements
The authors are thankful to West Nippon Expressway Co., Ltd., West Nippon Expressway Facilities Co., Ltd., and Hanshin Expressway R&D Co., Ltd. for providing information on current applications of speed reduction markings.
Correction (June 2023):
This article has been updated to correct heading levels and the subscripts in Inequalities 1 and 2.
Author Contributions
The authors confirm contribution to the paper as follows: study conception and design: K. Iio, H. Nakai, S. Usui; data collection: K. Iio; analysis and interpretation of results: K. Iio, H. Nakai, S. Usui; draft manuscript preparation: K. Iio, H. Nakai. All authors reviewed the results and approved the final version of the manuscript.
Declaration of Conflicting Interests
The author(s) declared no potential conflicts of interest with respect to the research, authorship, and/or publication of this article.
Funding
The author(s) received no financial support for the research, authorship, and/or publication of this article.
The study was conducted in accordance with the Code of Ethics and Conduct of the Japanese Psychological Association, and the protocol was approved on September 8, 2014, by the Behavioral Sciences Ethics Committee of Osaka University Graduate School of Human Sciences (No. HB26-29).