



Abstract
In urban areas, the ground vibrations induced by vehicle loads are becoming an increasingly serious environmental issue, especially in the planning and design of high-tech workshops. In this paper, traffic flow and ground vibrations are simultaneously measured from the vehicles moving on a trunk road in Beijing from 9:30 a.m. to 9:30 p.m. The correlation between traffic volume and ground vibration is calculated to analyze the contribution of different vehicle types and density. The characteristics of ground vibration are revealed by analyzing the experimental data from the testing points of time history and frequency variety. Moreover, the attenuation law of ground vibration is summarized and well fitted by the Bornitz model. Finally, according to existing assessment standards, the vibration levels are effectively assessed. The results indicate that the concentration of multi-peak ground vibrations in a short time period can be attributed to the combination of vibration waves induced by vehicles close to each other. Two vibration peaks were observed in the frequency range of 10 Hz to 12.5 Hz and 2.5 to 4 Hz, close to the resonant frequencies of vehicle parts. The environmental vibrations induced by road traffic may exceed the allowable values stipulated in the relevant standards, and undoubtedly influence the normal operation of precise instruments, even at a distance beyond 100 m from the source.
Keywords
In recent years, many cities have experienced rapid urbanization with population growth and economic development, especially in China ( 1 ). For example, the level of urbanization in China is expected to reach 66% by 2050 ( 2 ). Increase in the level of urbanization is inseparable from the development of the urban transportation system, so the development of the urban road network will be an inevitable reality in the coming decades. However, with more vehicles, heavier loads, and higher speeds, the environmental vibration induced by moving vehicles on urban roads has aroused widespread public concern ( 3 – 5 ). Moreover, the increase of urban population and resulting demand for road networks means that more buildings are located much closer to the main arteries in cities ( 6 , 7 ). Traffic-induced vibrations often occur around the busiest areas of the city, day and night, and thus have a long-term influence on the surrounding environment. Such vibrations may disturb people’s normal sleeping, working, and studying patterns, causing them to feel uncomfortable or upset ( 6 – 9 ). Vibrations may also affect the structural safety of heritage buildings, for example, with constantly emerging cracks in ancient masonry structures (Figure 1a) ( 10 ) and direct damage or fatigue damage to some ancient cultural relics (Figure 1b) ( 11 ). In addition, the vibrations can also adversely disturb the normal operation of sensitive instruments used in nearby medical laboratories and high-tech manufacturing workshops (Figure 1c) ( 9 , 12 ). Therefore, it is important to better understand, measure legitimately, predict and assess the environmental vibration induced by road traffic.
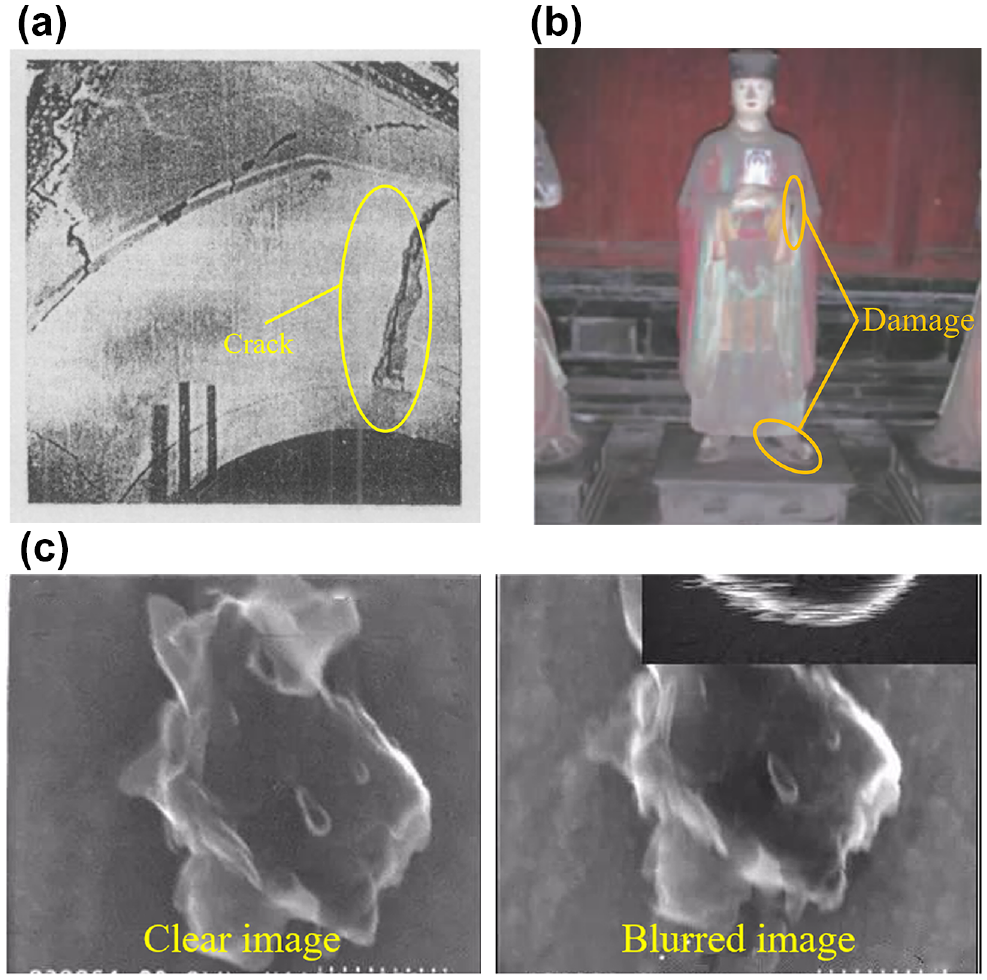
The influence of environmental vibration induced by road traffic corresponds to three different working conditions: (a) cracking of ancient masonry structures, (b) damage to historical relics, and (c) abnormal operation of sensitive instruments.
The propagation process of environmental vibration can be described as follows: (i) vehicles driving on uneven roads generate the vibration source; (ii) vibrations are transferred from the road surface to the structure of subgrade or bridge, and then propagate in the subsoil or along the ground surface; (iii) energy reaching the foundations of the surrounding buildings gives rise to the internal vibration response of the structure.
In studying the generation of vibration, the dynamic loads of vehicles and the vibration responses of roads are often simulated or measured. In such research, the types of vehicle model, the materials of the road structure, the roughness level of the road surface and even traffic obstacles ( 12 ) that contribute to significant vibrations are the critical influential factors ( 13 – 15 ). Since the vehicles are in close contact with the road surface, the vehicle–road coupling ( 16 , 17 ) or the vehicle–bridge coupling ( 18 , 19 ) is believed to offer the best solution to the dynamics problems of the complex system. In addition, random traffic flows are often simulated on the basis of probability and stochastic theories that can better reflect the actual state of traffic flow on the road ( 20 – 22 ). With regard to the propagation of vibrations, how to establish an efficient field model under different subsoil conditions has been a research topic in recent years ( 23 – 25 ). Evaporation and transpiration in different regions mean that the degree of water saturation may also be considered in the subsoil model to make the displacement of soil skeleton and excess pore water pressure more realistic, and thus make the simulation of vibration propagation more accurate ( 26 , 27 ). In the reception and transmission of vibration to the surrounding buildings, types of building structures with different operating requirements are modeled and analyzed to evaluate the overall and local vibration of sensitive locations in the building ( 28 – 30 ), in which the dynamic interaction between structural foundation and subsoil should be considered ( 31 ). Some suggestions and measures of vibration isolation are also put forward to meet the anti-micro-vibration requirement of environmental vibrations.
In addition to theoretical analysis and numerical simulation, the on-site experiment is one of the effective ways to obtain the actual energy distribution and propagation laws of ground vibration and to validate the effectiveness of theoretical methods. Furthermore, the assessment of ground vibration in the field can provide technical guidance for the planning, design, and protection of existing or proposed roads with different transportation capacities and buildings with different performances. By means of multiple on-site experiments, Smirnov and Tsukernikov ( 32 ) studied the conversion and transmission losses of vibration waves propagating from the ground to the building floors, and applied the transfer coefficients to predict the vibration levels of buildings induced by traffic loads. Sun and Gao ( 33 ) measured the ground vibration in residential areas adjacent to freight rail traffic, assessed the vibration level according to the requirements of the standard (GB-10070-88) ( 34 ), and suggested increasing the number of rows of slope protection piles to reduce the environmental vibration. In the first part of the Chinese Technical Code for Anti-Micro-Vibration Engineering of Electronics Industry (GB51076-2015), it is stipulated that the experimental testing of free-field vibration should be carried out before the construction of a proposed building to ensure the normal operation of sensitive instruments in the building ( 35 ). Gao et al. ( 36 ) tested the ground-borne vibrations at the proposed location of a high-tech electronics workshop, and evaluated the vibration effect by the Bolt, Beranek, and Newman (BBN) ( 37 , 38 ) criteria. Certainly, some experimental results can be input into the established numerical model of a structure, which provides a good reference for the structural design of an electronics workshop ( 7 , 36 , 39 ).
From the above literature, it can be found that most current research focuses on the vibrations generated by vehicle loads driving on expressways far away from urban areas, and rarely on trunk roads in urban areas. Ground vibrations generated by heavy vehicles traversing a traffic obstacle (such as a road hump or a speed cushion) have received more attention, while less attention is given to vibrations induced by random traffic flow moving on the road surface with its inherent level of roughness. It is accepted that on roads having different functions, such as expressways versus common urban roads, the characteristics of generated ground vibration are distinct because of the different speeds of vehicles, density of traffic flow, proportions of vehicle types, and so on. To study the environmental vibration induced by the vehicle flows driving on an urban trunk road, an on-site experiment is carried out in this paper. The traffic flow on an urban trunk road in Beijing, China, was recorded, and the traffic-induced ground vibration was tested, by which the characteristics of traffic flow and ground vibrations are analyzed and the correlation between them is explored. Moreover, the decay of ground vibration is studied by the peak acceleration and root mean square (RMS) acceleration, respectively, and the attenuation formula with one-third octave band center frequency is fitted. Finally, the environmental vibration is assessed by the applicable environmental vibration standards.
Overview of the Experiment
Experimental Site and Instruments
Selection of Experimental Road and Free Field
To find the ground vibration characteristics induced on land by vehicle loads moving on urban roads, an experiment was carried out at a location close to Beiqing Road in Changping District, Beijing, China. There are two reasons for choosing this area as the site. First, Beiqing Road is the main east–west traffic artery and skeleton between the North Fifth Ring Road and the North Sixth Ring Road of Beijing, where the traffic volume is dense and so it can represent the traffic characteristics of urban roads. Second, there is no interference from other traffic lines for measurement of vibration at the selected site.
The trunk road chosen in the experiment is a two-way, four-lane urban road with concrete pavement, with non-motorized vehicle lanes and sidewalks set on both sides of the road. Even better, there is a free field of open ground close to the trunk road, as shown in Figure 2, which provides for the convenient measurement of road traffic-induced ground vibrations at the same elevation.
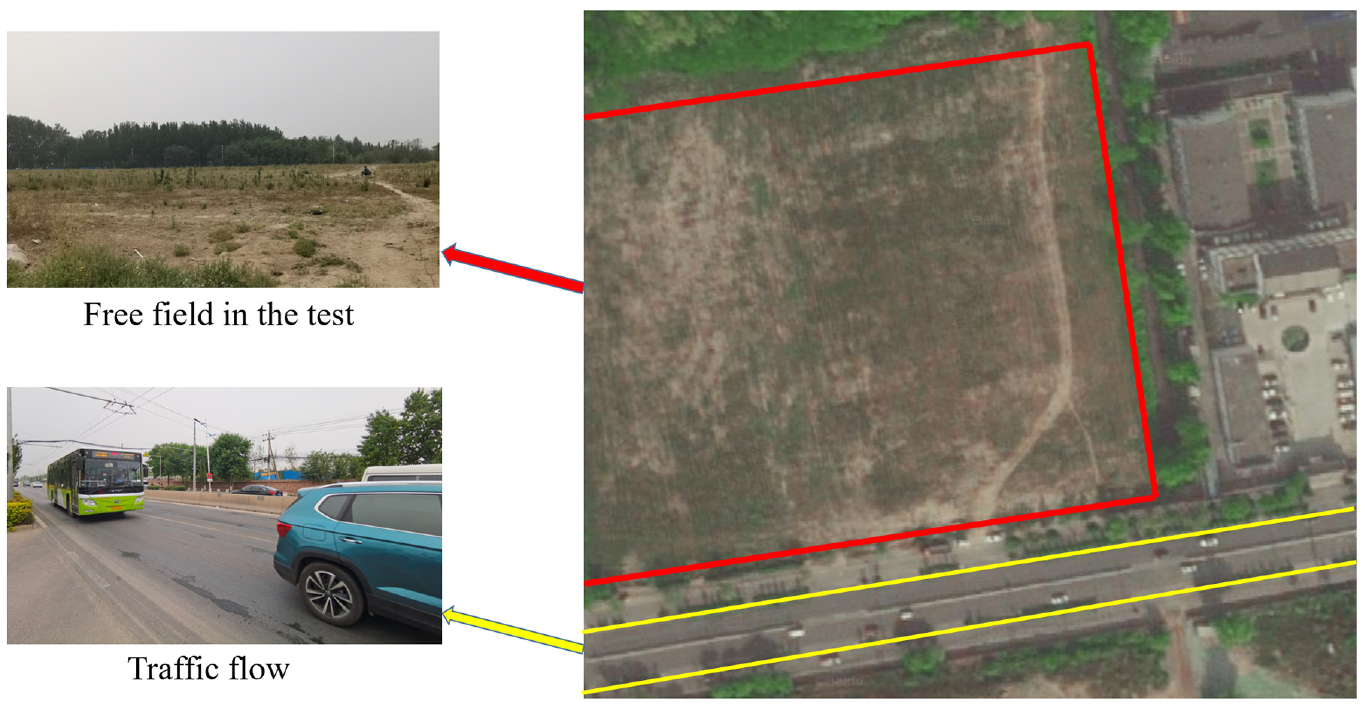
Aerial photograph of experimental site, with detailed photographs of traffic flow and free field used in the test.
Investigation of Actual Traffic Vehicles
The loads from the vehicle flow are exerted onto the road surface as the source, and the generated vibrations are transmitted successively to the roadbed, the subsoil, and adjacent ground (the free field). By site investigation and observation of the actual traffic flow, we found that there were mainly three types of vehicles on the chosen road: cars, buses, and trucks, as shown in Figure 3. Since multi-axle wagons have a similar structure to trucks but greater weight, the few multi-axle wagons are classified as trucks in the following analysis.
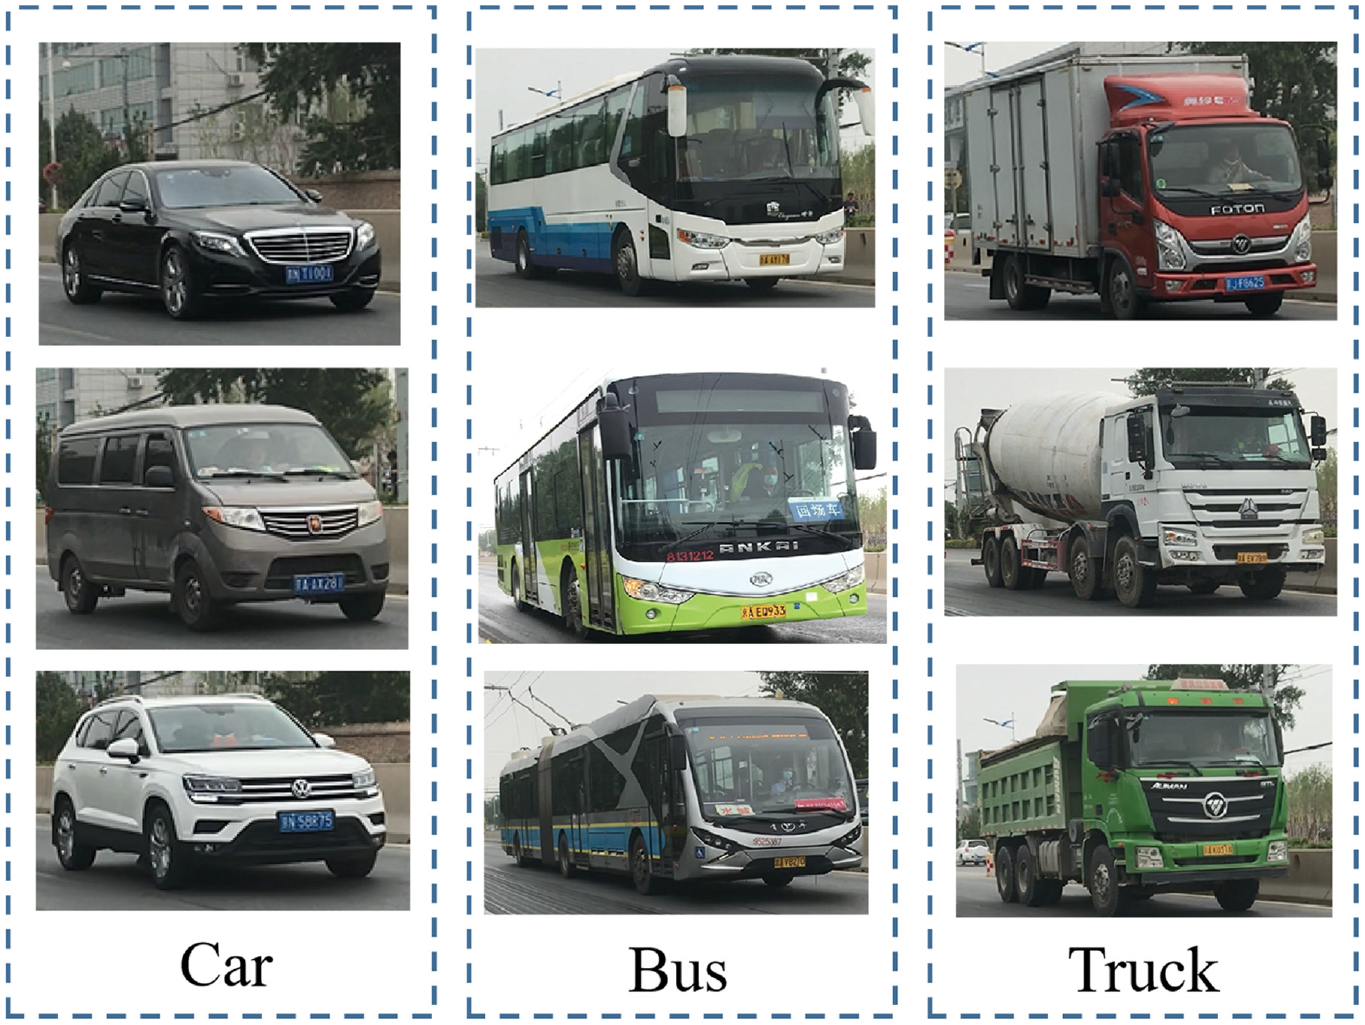
Classification of moving vehicles in the test.
Information on Engineering Geology
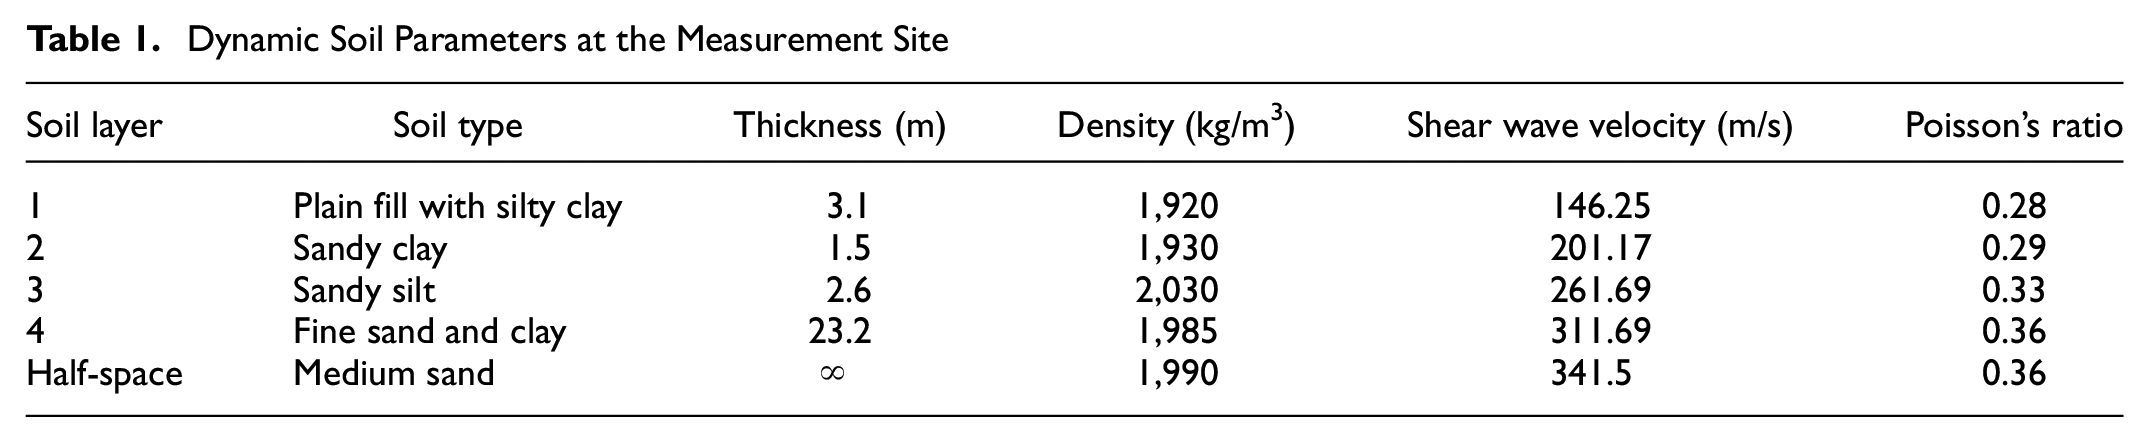
According to the existing survey of the engineering geology ( 40 ), the soil condition in the experiment site can be divided approximately into five different types of soil layers from top to bottom: plain fill with silty clay, sandy clay, sandy silt, fine sand and clay, and medium sand. The static level of underground water is 42.98 m to 44.10 m, which has no effect on the ground vibrations. The types of soil layers and the corresponding dynamic soil parameters are listed in Table 1 ( 41 ).
Dynamic Soil Parameters at the Measurement Site
Experimental Instruments
Two main tasks were carried out in the experiment. The first was the collection of real-time statistics on the types of vehicles moving on Beiqing Road and their speeds. Here a large-capacity video storage instrument (Figure 4a), radar speedometer (Figure 4b), and manual recording work together to ensure that vehicle information can be better recorded. The second was the measurement of ground vibration. The testing instruments are mainly composed of 941B vibration sensors with high sensitivity to ultra-low frequencies (Figure 4c), the INV3020s signal acquisition instrument (Figure 4d), and a laptop computer equipped with the DASP signal processing system (Figure 4d).
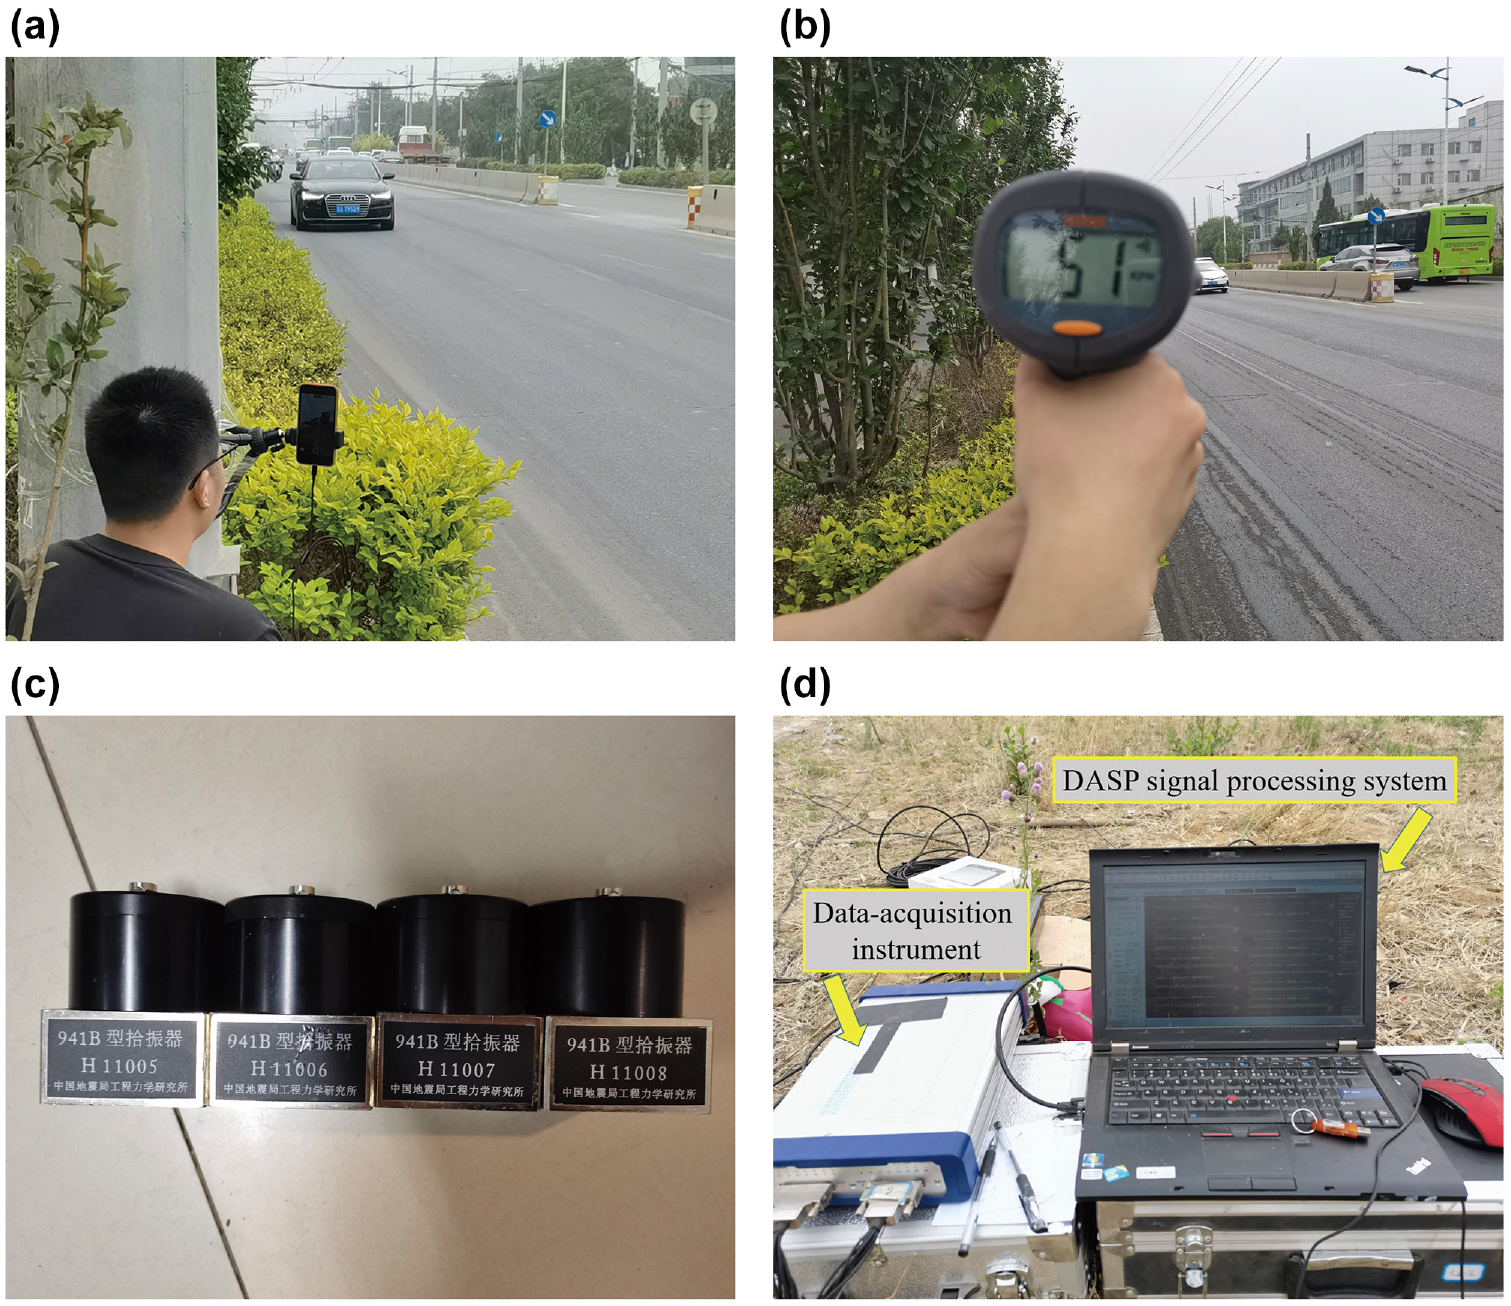
Test instruments and data processing system: (a) large-capacity video storage instrument, (b) radar speedometer, (c) 941B ultra-low-frequency vibration sensor, and (d) data acquisition and signal processing system.
In the test, the acceleration and velocity of vibration can be measured separately by changing the gear position of the 941B vibration sensor. It should be noted that all the measurements conducted in the first part and the second part are time-synchronized to ensure the generated vibration response can be consistent with the vehicle information.
Layout of Testing Points in the Free Field
The free field and its relative location to the motorized vehicle lanes (MVLs), non-motorized vehicle lanes (NMVLs), and pavement on the urban road are clearly illustrated in Figure 5, in which a three-dimensional Cartesian coordinate system is defined, including the transverse x-direction, the longitudinal y-direction, and the vertical z-direction. In this paper, since the ground vibrations induced by vehicles are the research priority, all measurement points were arranged on the ground surface in the surrounding free field.
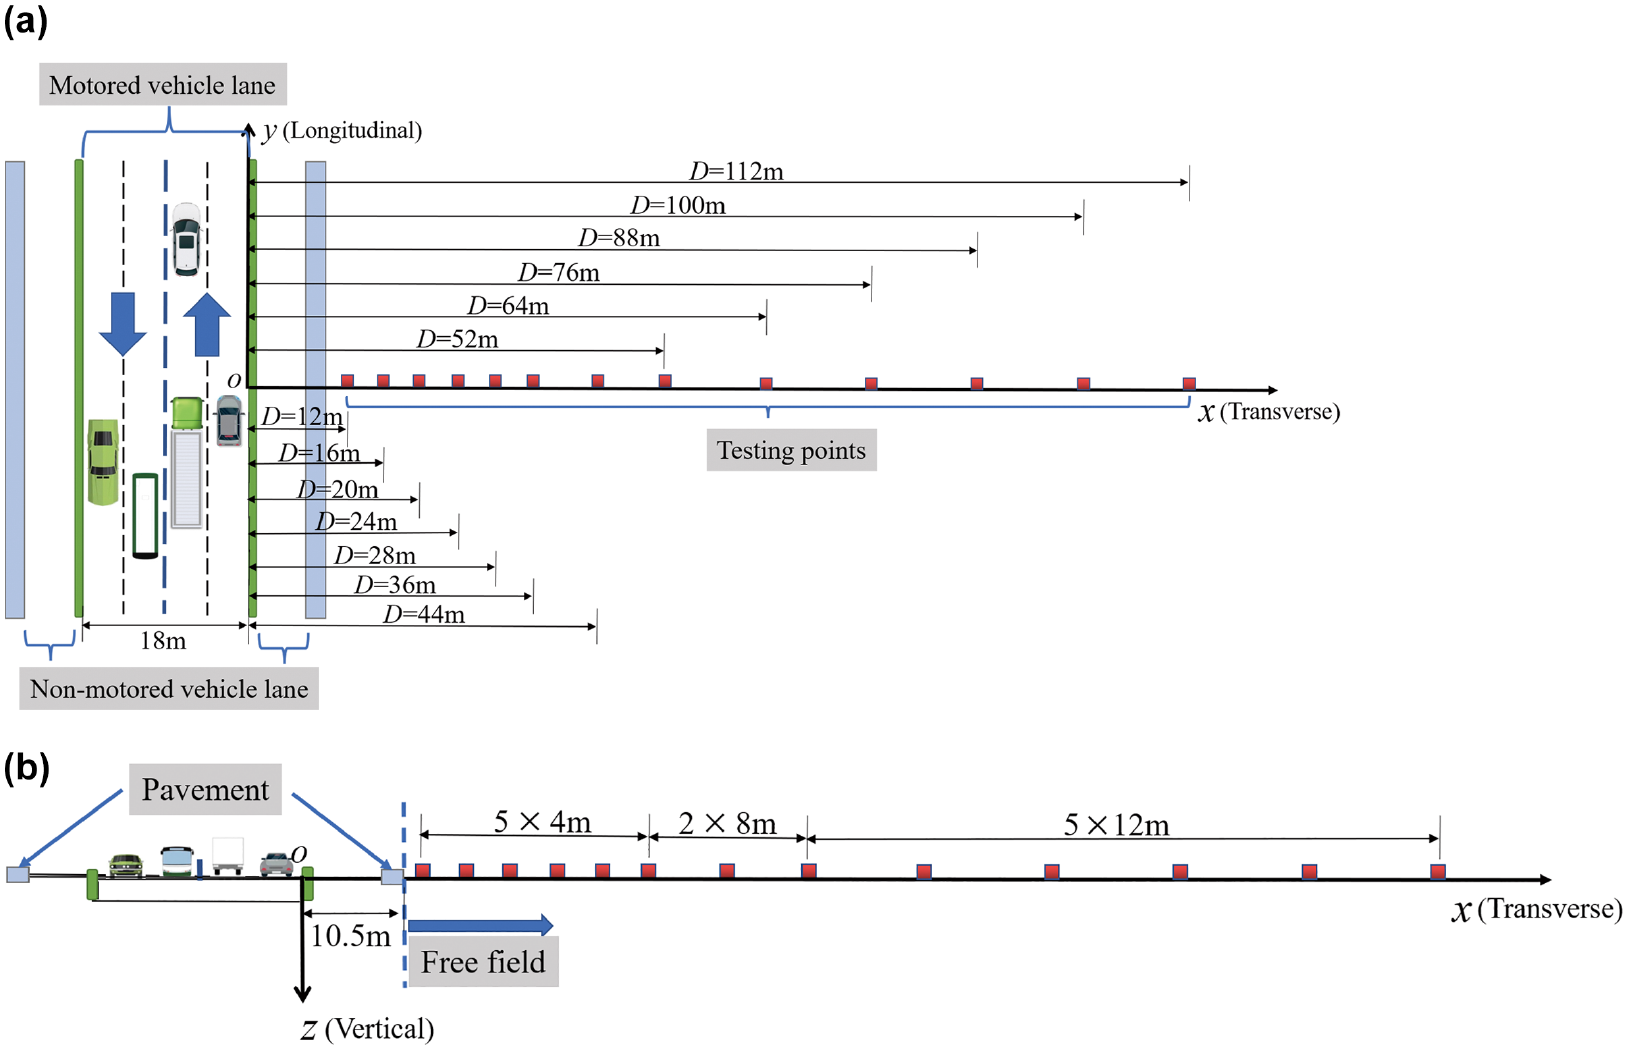
Spatial location of the free field and layout of testing points: (a) plan view and (b) elevation view.
Because of the separation of the NMVLs and the pavement from the MVL, the nearest testing point on the ground is 12 m away from the edge of the MVL (Figure 5). All the other 12 testing points are set up in turn along the transverse x-direction at a distance of 16 m, 20 m, 24 m, 28 m, 36 m, 44 m, 52 m, 64 m, 76 m, 88 m, 100 m, and 112 m from the edge of the MVL, as shown in the planar view (Figure 5a) and the elevational view (Figure 5b). In the following section, the different test point is represented by the abovementioned distance, denoted by the sign D.
Depending on different research objectives, several kinds of experimental arrangements are separately designed by changing the measured duration, test point location D, concerned direction, and vehicle samples. The detail experimental arrangement is summarized in Table 2.
Experimental Arrangement

To guarantee the immobility of sensors during the measurement, they are attached to steel plates with spikes bolted on at the corners (Figure 6). In this way, the entire component can easily penetrate into the soil to better measure the ground vibration.
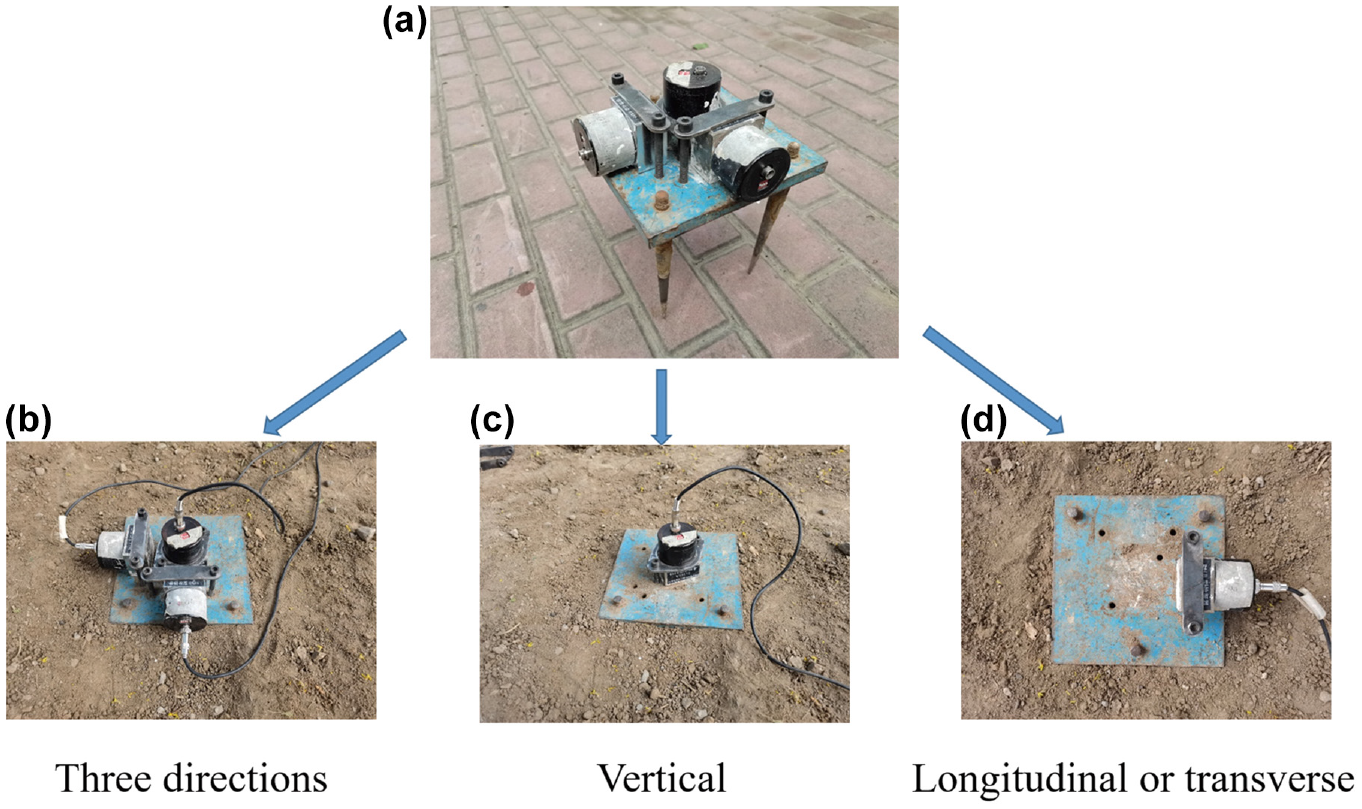
Sensors attached to steel plates: (a) assembled components, (b–d) set into the ground.
For the acquisition of vibration signals, the sampling frequency of the sensors is set to 512 Hz, which can guarantee the frequency range of vibration signals up to 256 Hz (half of the sampling frequency) based on the Nyquist theory. Existing studies show that the dominant frequencies of ground vibrations induced by vehicle loads are within 80 Hz ( 8 , 42 ), which can be entirely and sufficiently covered by the spectral information of vibration signals.
Interference Elimination of Ambient Vibration
To observe and eliminate the interference of ambient vibration on experimental results, the ambient vibration of every measuring point is recorded in the free time when there are no moving vehicles or any other obvious external interference.
Take the ground vibration signals at the location of D = 20 m as an example. The acceleration histories of the total ground vibration and the ambient vibration in three directions are respectively illustrated in Figure 7a, in which the light gray lines represent the ambient vibrations. By means of the Fourier transformation, the one-third octave band spectra and the RMS acceleration in the frequency domain can be obtained, as shown in Figure 7b.
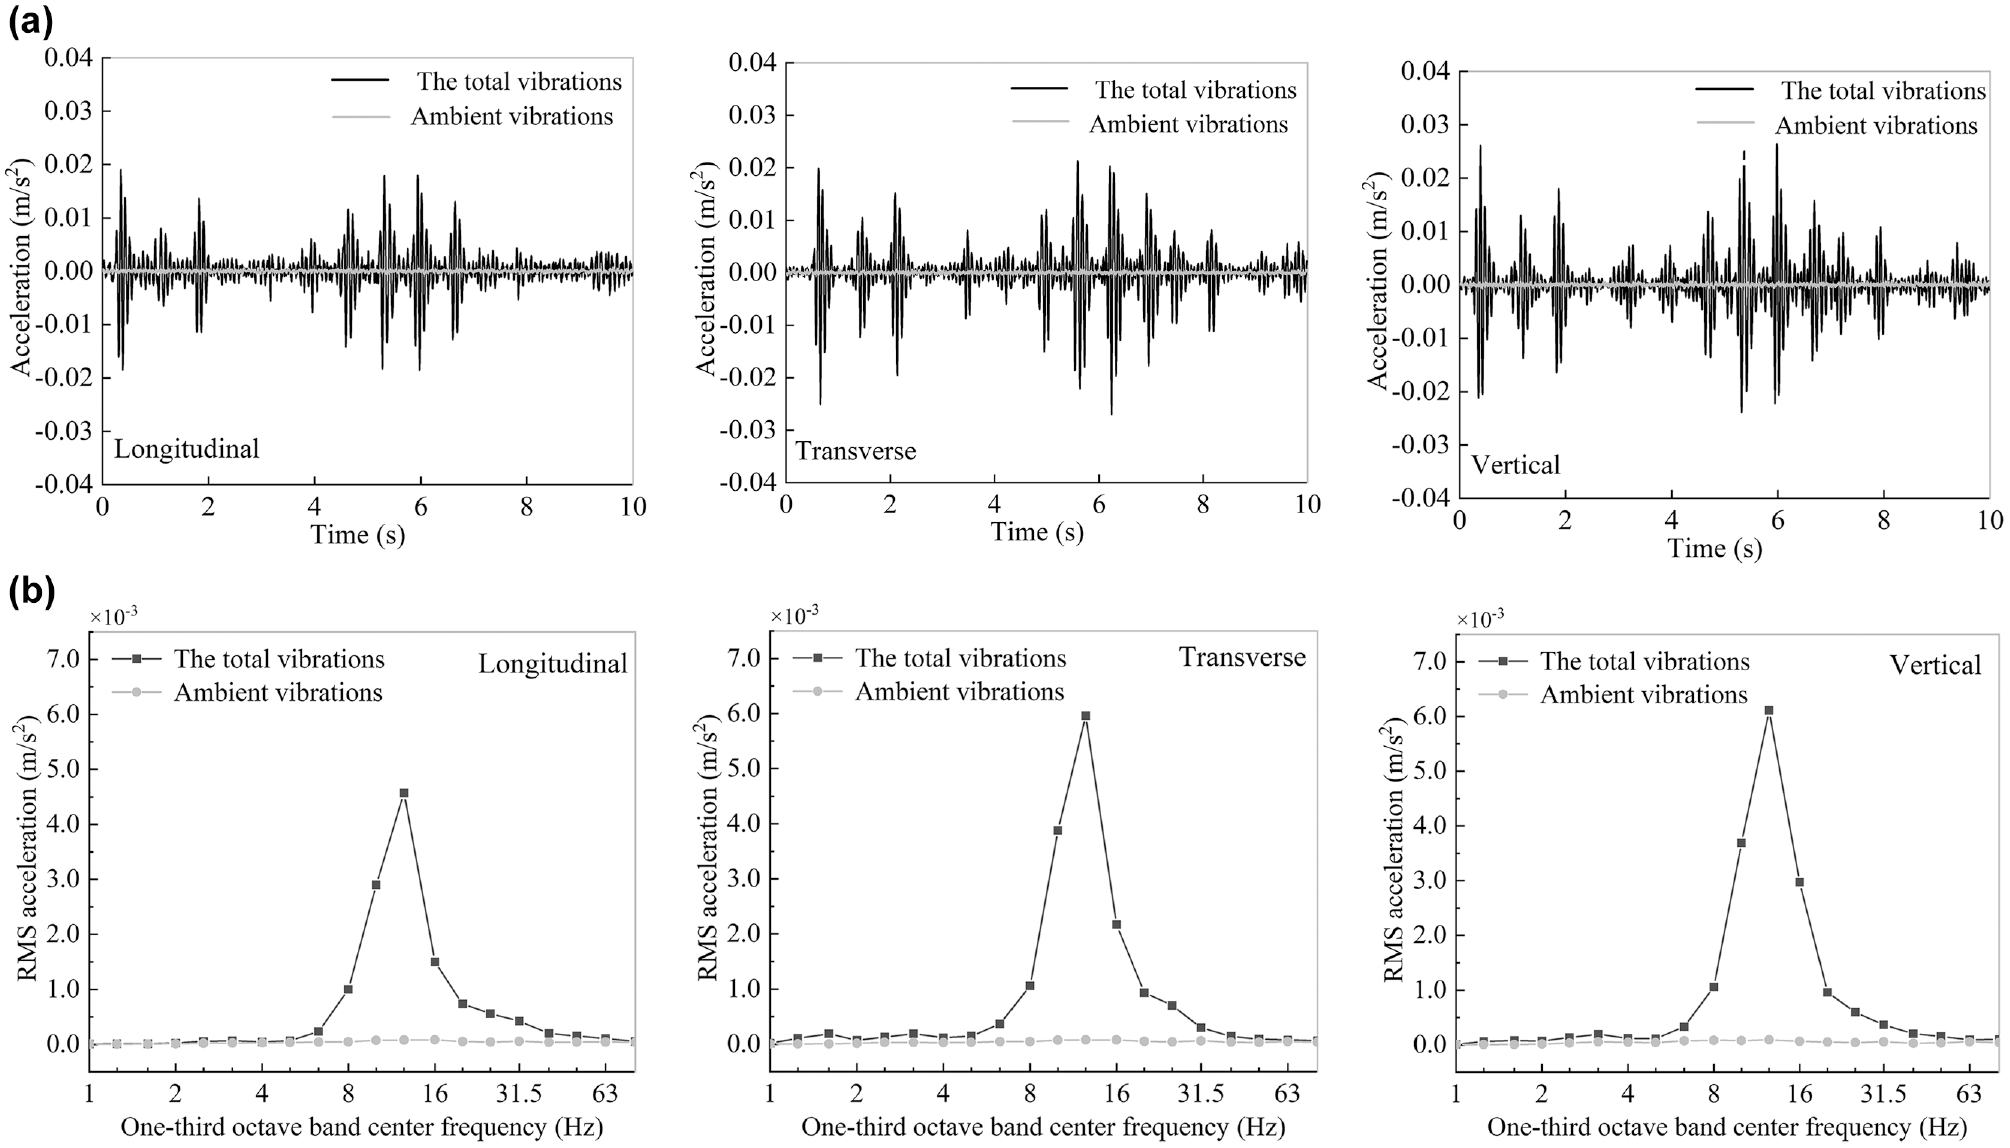
Ambient vibrations in three directions: (a) time histories and (b) one-third octave band spectra.
It can be clearly observed from Figure 7 that the ambient vibration is far less than the total ground vibration and causes little interference with the traffic-induced ground vibrations. Since Figure 7b can approximately reflect the energy distribution of ground vibration, the minor disturbance from ambient vibration can be eliminated by dealing with the RMS accelerations in the frequency domain. Based on the energy superposition method (
43
), the RMS acceleration

where fc is the central frequency of one-third octave band;
Measurement and Characteristic Analysis of the Ground Vibration
In this section, the characteristics of traffic flow and the correlation between traffic volume and ground vibration are first analyzed. Next, the characteristics of ground vibration are studied in the time domain and in the frequency domain, respectively, and finally the attenuation with distance is well fitted in the one-third octave band center frequency.
Statistics of Traffic Flow and Correlation with Ground Vibration
In the experiment, information on the actual traffic flow running on Beiqing Road is recorded by radar speedometers, video instruments, and manual records from 9:30 a.m. to 9:30 p.m. In the following analysis, the continuous measurement period of 12 h is divided into many time bandwidths of 10 min, and the number of each type of vehicle or all types of vehicles per 10 min is defined as traffic volume (unit: no./10 min). Here, the vehicle speed, the proportion of each type of vehicle, and the traffic volume are taken as indicators to describe the characteristics of traffic flow.
Through the observation and measurement of vehicle speed, it is found that the speeds of buses are about 30 km/h, which probably results from the regulations of the transportation company. For other vehicle types such as cars and trucks, the speeds are mostly between 30 and 60 km/h because of a speed limiting device on the tested road.
The 10 min traffic volume during different time intervals in a day are shown in Figure 8. It can be observed that the maximum traffic volumes of both cars and buses are during the period of 3:30 p.m. to 7:00 p.m. in a day, while for the trucks, the number is more in the daytime than at nighttime. Correspondingly, the statistical information on traffic volume is listed in Table 3. It can be seen that the cars contribute the most to the traffic, accounting for 91.26%, with higher average traffic volume and greater degree of dispersion. The proportions of buses and trucks are 3.71% and 5.03%, respectively, with lower average traffic volume and less variance. In addition, it can also be found that the maximum traffic volume is up to 344 no./10 min during the time interval of 4:10 to 4:20 p.m., and the minimum was 228 no./10 min, which also exceeds 200 no./10 min. Therefore, the urban trunk road chosen in the experiment is medium busy and the traffic volume is high enough to meet the experiment requirements of environmental vibrations stipulated in the standard of GB10070-88 ( 34 ).
Statistical Properties of 10-Minute Traffic Volume

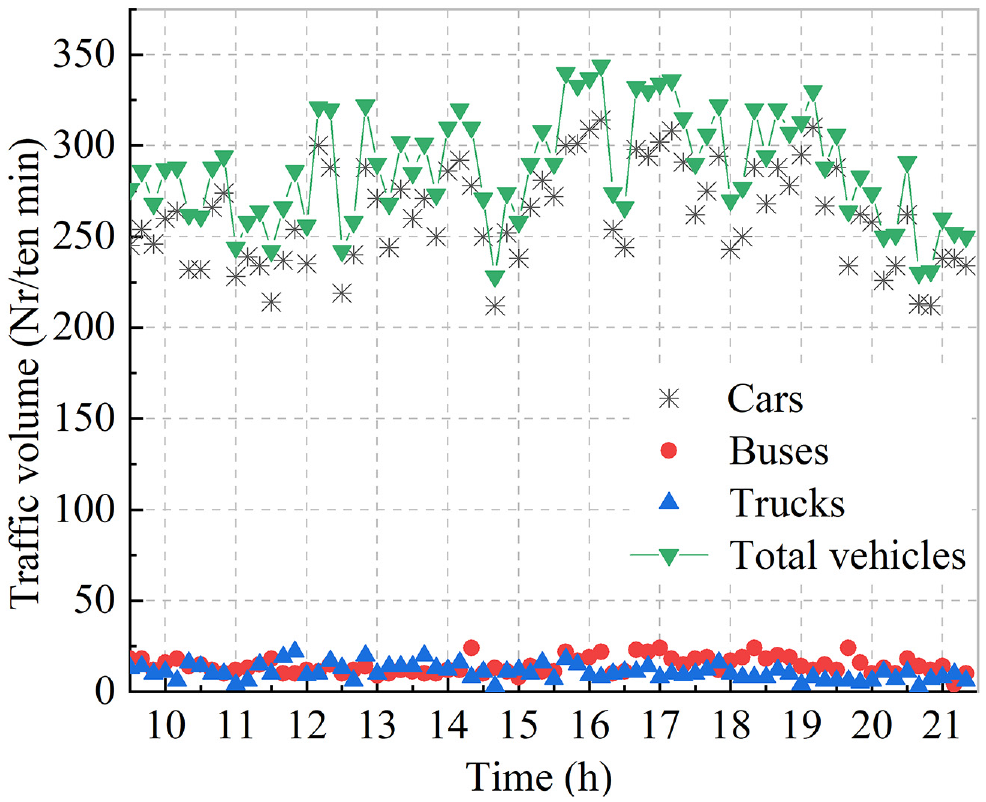
Traffic volume by vehicle types, measured in 10-min units.
As for the road traffic-induced ground vibrations, it can be seen from Figure 7 that the vertical ground vibrations are greater than the vibrations in the other two directions (transverse and longitudinal) at the same receiver point, which accords with the existing conclusions ( 8 ). In the following, the vertical ground vibrations at the distances of D = 12 m and D = 16 m are taken to analyze the vibration characteristics and the correlation between the traffic flow and the ground vibration.
In the on-site experiment, the vibration signals during 12 h from 9:30 a.m. to 9:30 p.m. are recorded continuously. To discuss further the variation of ground vibrations in a day, the vibration signals per hour are extracted and analyzed as a processing unit. Figure 9a gives the vertical RMS acceleration at the receiver points of D = 12 m and 16 m (closest to urban trunk road, as shown in Figure 5) hour by hour. As we can see, during the 12 h from 9:30 a.m. to 9:30 p.m., the RMS acceleration within 9:30 a.m. to 10:00 a.m. and 4:00 p.m. to 7:00 p.m. is larger than those within other time intervals, which indicates greater vibrations occur during the morning peak time and evening peak time in the Beijing urban area. In addition, it can be found from Figure 9a that, for different receiver points at different distances away from the road, the variation tendency of ground vibration amplitudes with the time in a day is almost consistent.
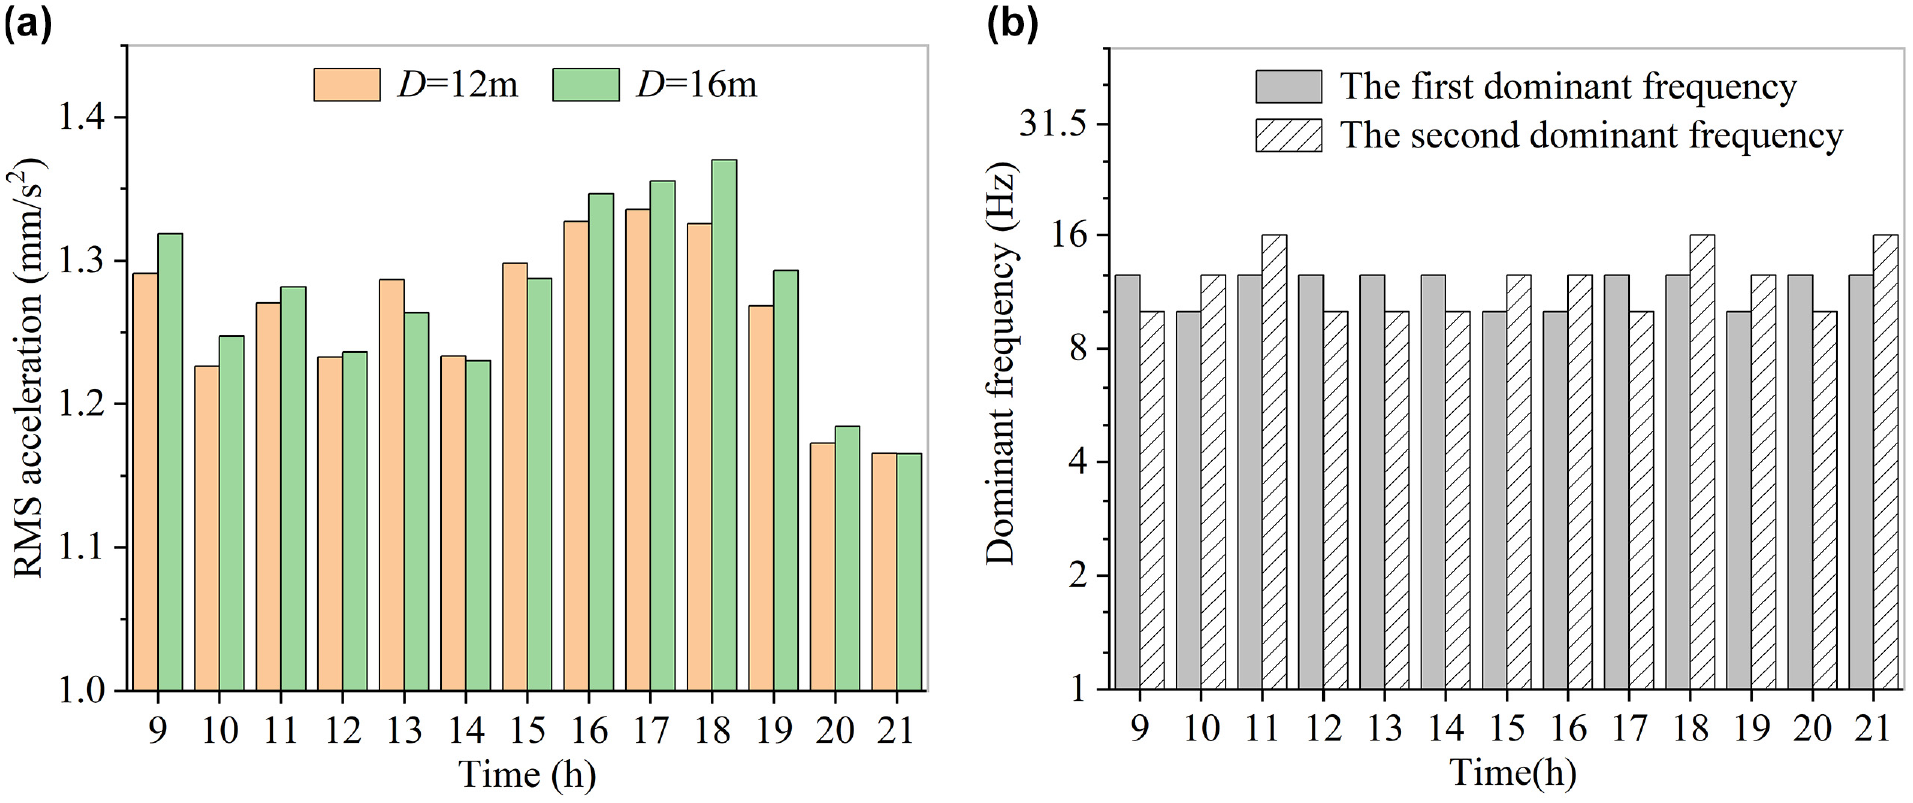
Ground vibration characteristics, by 1-h units: (a) vertical root mean square acceleration and (b) dominant frequency.
By means of Fourier transformation, the vertical ground acceleration histories per hour can be transformed into the one-third octave frequency domain, and thus the first and second dominant frequencies of vertical ground vibrations within an hour can be obtained, as shown in Figure 9b. It can be seen that, although the time of day is different, the first dominant frequencies of road traffic-induced ground vibrations mainly concentrate on 12.5 Hz and 10 Hz, and the second are mainly 10 Hz, 12.5 Hz, and 16 Hz.
Different types of vehicles may produce different ground vibrations. Heavier vehicles produce greater ground-borne vibration because of the larger mass acting on the pavement. Trucks equipped with steel suspension can produce higher dynamic loads and vibrations compared with trucks equipped with air suspension ( 44 ). To further analyze which type of vehicle flow is more relevant to the ground vibration, Pearson correlation coefficient can be employed ( 45 ).
The correlation coefficients between the traffic volume of cars, buses, and trucks, and the total vehicles and the RMS acceleration of ground vibration are calculated by Equation 2 ( 46 ):

where
The correlation coefficient rage and corresponding rank are shown in Table 4 ( 47 ). The closer to one the Pearson correlation coefficient is, the stronger the correlation between two variables; the closer to zero, the weaker the correlation between them.
Correlation Coefficient Range and Corresponding Rank

The calculated correlation coefficients are listed in Table 5. It can be seen that the correlation coefficients between the traffic volume of cars, buses, or trucks and the ground vibration are concentrated in 0.44 to 0.58, which indicates there exists medium correlation between them. However, for the traffic volume of total vehicles, the correlation coefficients are just greater than 0.6, demonstrating that the total vehicles make a greater contribution to vibration energy than individual types of vehicles. Simultaneously, the significance test (t-test) and probability (P-value) corresponding to the correlation coefficient are carried out to reflect statistically whether the correlation between two variables is significant. As shown in Table 5, the probability P-value is far less than 0.01, verifying that the resulting correlation coefficients are reliable and significant at the 1% significance level.
Correlation Coefficients and Corresponding t-Test and Probability P-Value

Histories and Spectra of Ground Vibrations
During the time period with highest traffic volume (4:00–7:00 p.m.), the ground vibrations at D = 12 m, 16 m, 20 m, 24 m, 28 m, 36 m, 44 m, and 52 m are measured simultaneously in three directions. Figure 10 shows a segment of the measured vertical ground acceleration cut from the whole signal during the period from 4:00 to 7:00 p.m. It can be found that there exist many peak vibration zones during the whole measurement, just like the signals circled by red dotted curves. These phenomena are attributed to the driving condition of vehicles on the tested trunk road. Observing from the recorded vehicle information, we find the corresponding traffic state is mainly the parallel or intersection of the vehicles (Figure 11a) and car-following (Figure 11b) with almost similar vehicle speeds. Therefore, the source excitation of ground vibration is actually provided by a series of vehicle groups, and the multi-peak vibration zones are induced by the superposition of vibration waves excited by groups of several to two dozen vehicles.
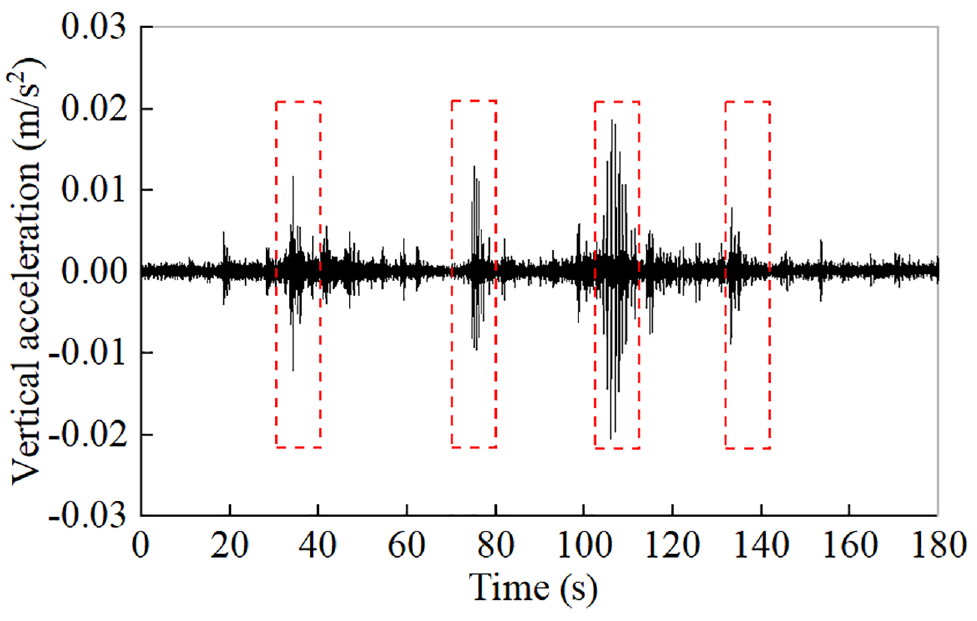
Histories of vertical acceleration of ground vibrations within a period of time.
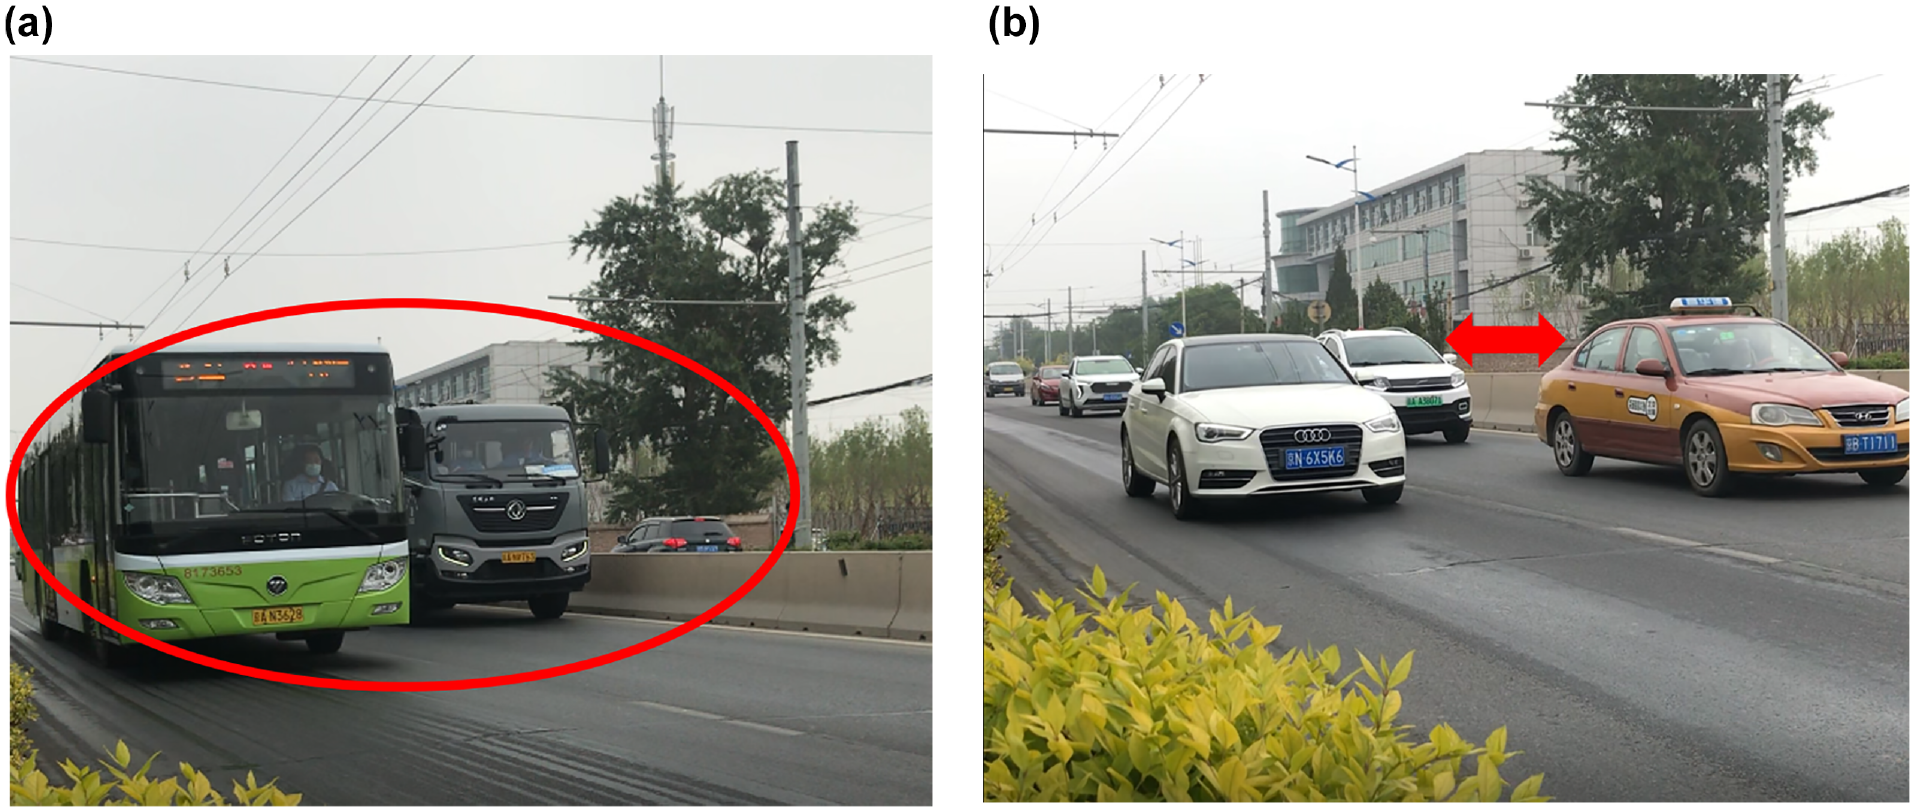
Vehicle driving states on urban trunk road: (a) parallel and intersection of vehicles and (b) following vehicles.
To analyze the characteristics of ground vibrations effectively, the whole vibration signals from 4:00 to 7:00 p.m. should be handled first by extracting as many vibrational peak zones as possible. By observing those signals circled by red dotted curves in Figure 10, one can find that the durations of almost 10 s can embrace the effective peak vibration zones in the experiment. So, in the next spectra analysis of ground vibrations and the assessment of environmental vibrations, the period of 10 s is used as the time scale of intercepting vibration signals in the experiment, where a complete process of ground vibration with the generation and attenuation of signal waves should be included to avoid the lack of frequency domain.
Take one typical intercepted vibration signal as an example to analyze the frequency distribution of ground vibrations. Figure 12, a–c , show the vibration spectra induced by vehicle groups at different distances on the ground along three directions. It can be seen that the energy is concentrated in the low-frequency band, the amplitude shows a decreasing trend as the distance D increases, and the vibration spectra in three directions have a similar tendency to frequency. Taking D = 12 m as an example, the vibration energy in three directions is mainly concentrated on 8 to 20 Hz, and as the distance increases, the energy in the higher frequency band decays rapidly.
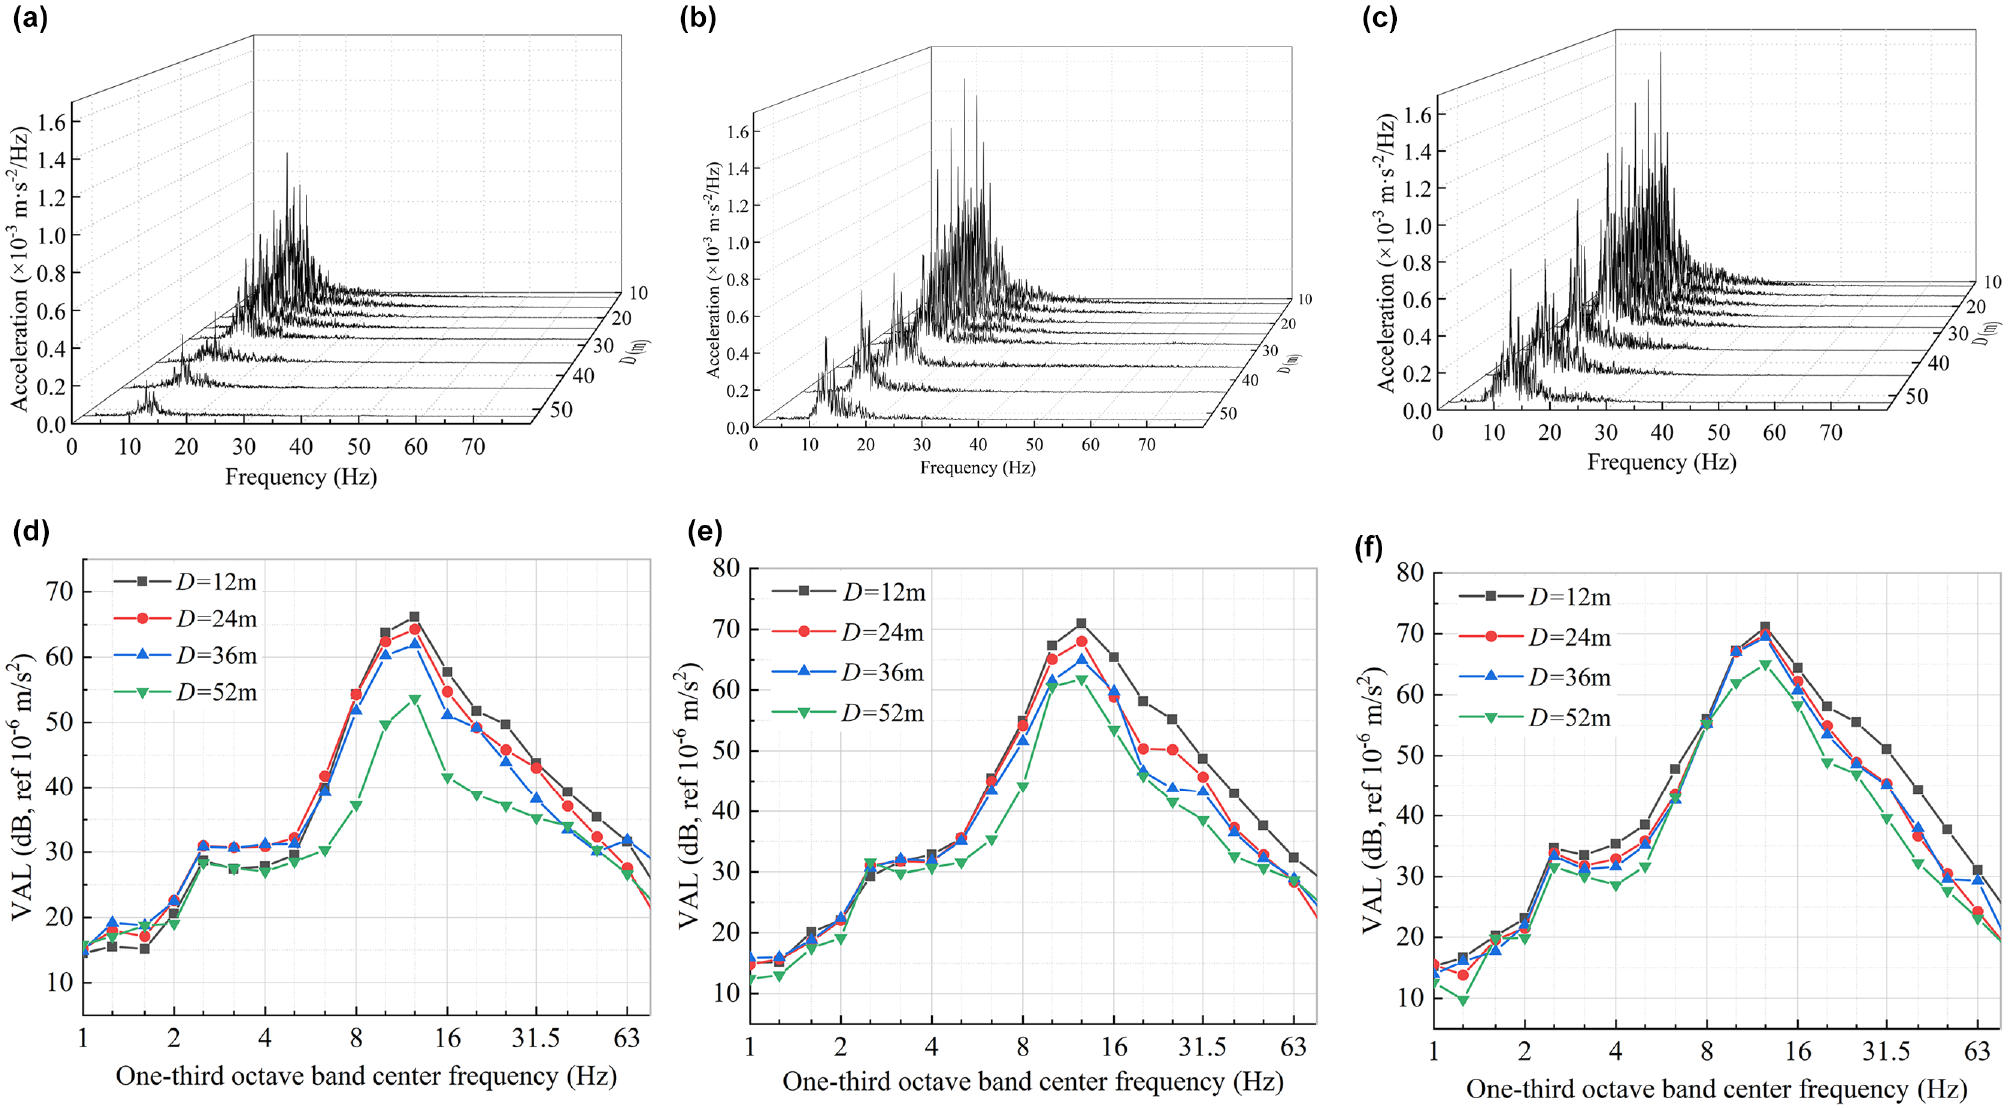
Spectra and one-third octave frequency acceleration level in three directions: (a) longitudinal acceleration, (b) transverse acceleration, (c) vertical acceleration, (d) longitudinal acceleration level, (e) transverse acceleration level, and (f) vertical acceleration level.
The vibration acceleration level (VAL) is used to express the intensity of vibration (unit: dB), calculated by:

where
VALs in the one-third octave frequency band at D = 12 m, 24 m, 36 m, 52 m in three directions are shown in Figure 12, d–e . It can be observed that there are two obvious peak levels: the bigger one is at 12.5 Hz, which is consistent with the bouncing frequency of vehicle wheels (8–15 Hz) ( 12 ), and the smaller one is at 2.5 Hz, which is consistent with the bouncing frequency of the vehicle body (0.8–4 Hz) ( 12 ).
Attenuation of the Ground Vibration with Distance
Based on the propagation path of vibration waves induced by groups of vehicles, the peak acceleration (PA) of ground vibration can be extracted from the signals in the time domain. Here, 15 groups of typical ground vibrations in three directions are selected to obtain the PA, as illustrated in Figure 13. In the figure, each curve represents the vibration attenuation with the distance from the roadside in the case of a vehicle group. In the same direction, the PA induced by different vehicle groups has a certain difference. However, the PA has similar overall attenuation trends, except for several amplification zones at the distances of D = 16 m, 20 m, and 44 m.
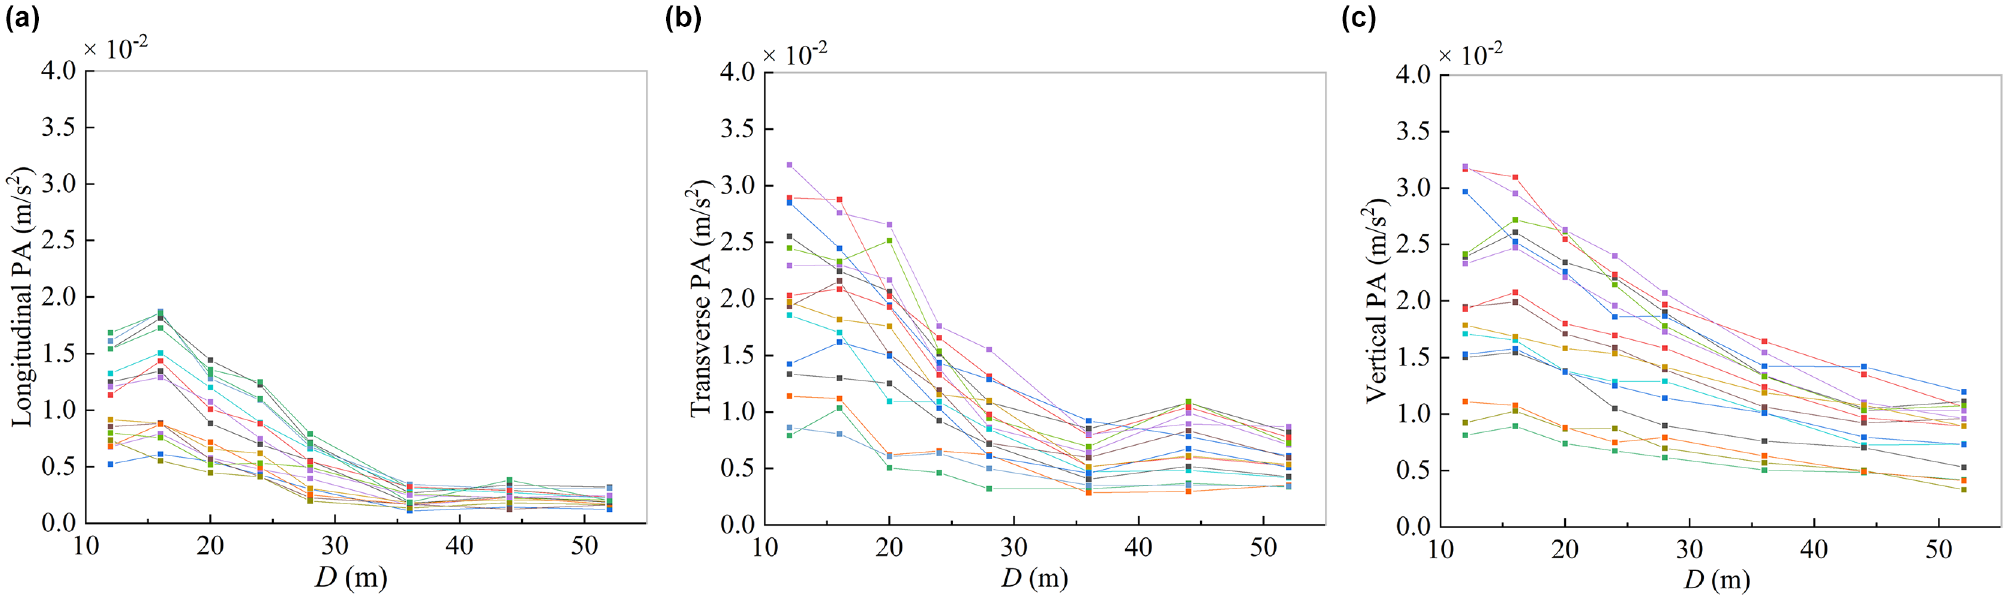
Peak acceleration of vibration in three directions: (a) longitudinal, (b) transverse, and (c) vertical.
To further quantify the vibration characteristics in different directions, the statistical values of the 15 groups of PAs are calculated, as shown in Figure 14. By observing the mean and variance of PA, it can be found that the vibration response in the vertical direction is the largest, followed by the transverse direction, and the smallest in the longitudinal direction at the same distance D. The discreteness of PA also decreases with the increase of distance. Here, the concept of PA residual ratio SPA is proposed, expressed as

where
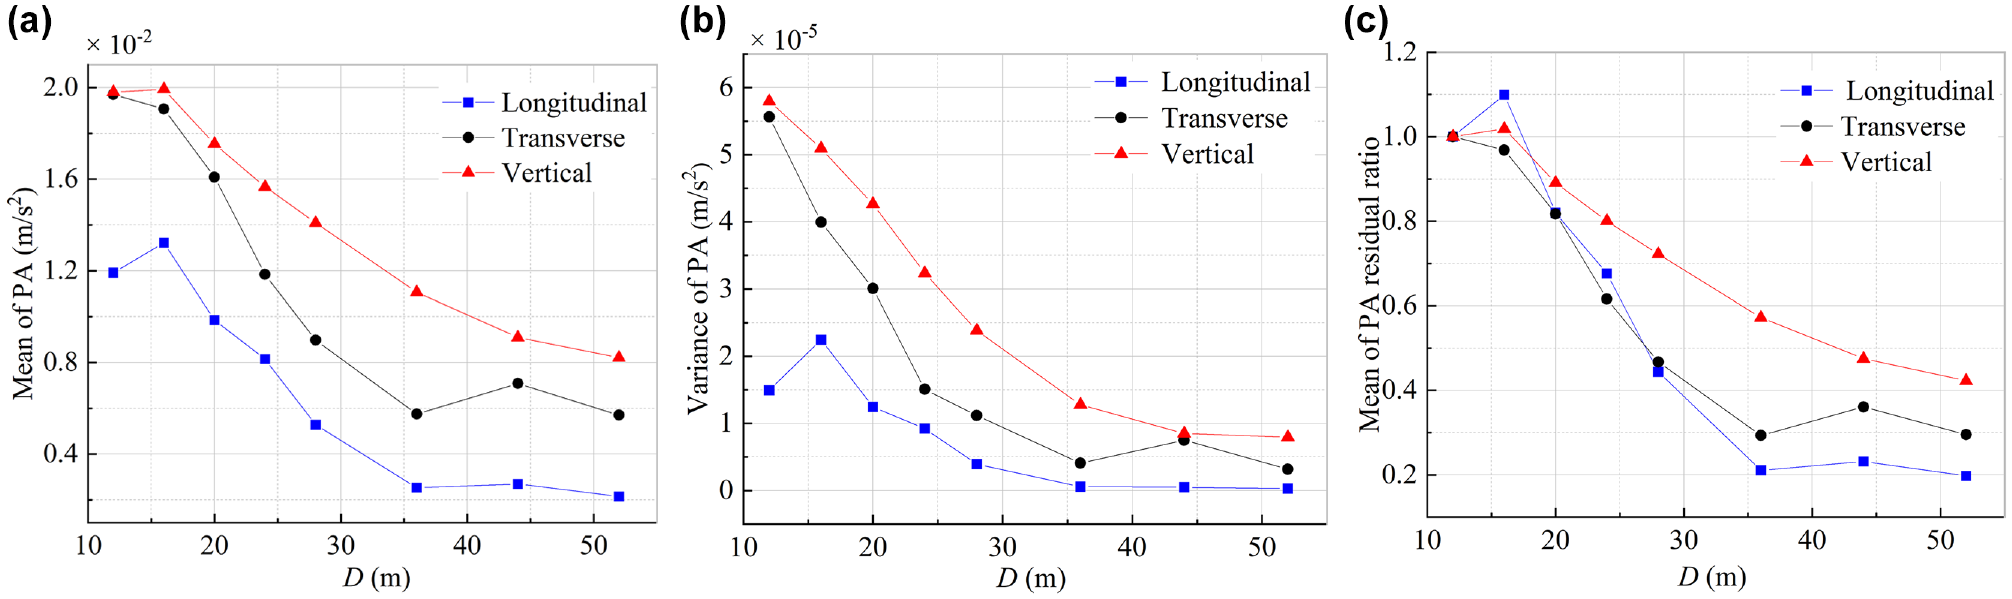
Statistical characteristics of peak acceleration (PA) of vibration in three directions: (a) mean of PA, (b) variance of PA, and (c) mean of PA residual ratio.
Figure 14c presents the variation of the mean of PA residual ratio with the distance in three directions. At the distance of D = 16 m, there is a slight amplification of ground vibration and after D = 20 m, as the distance increases, the PA residual ratios in the vertical direction are much higher than those in the longitudinal and transverse directions. Among them, the attenuation tendency of SPA in the longitudinal direction is the most obvious and it becomes the smallest after D = 28 m.
Fitting of Attenuation Formula
From the above section, the attenuation tendency of vibration response with distance can be clearly observed. However, vibration waves with different frequencies have different attenuation characteristics. Moreover, in predicting and evaluating the effect of vibration on precise applications, the attenuation law of one-third octave band velocity spectrum is needed to compare the vibration level with the allowance in the BBN criteria. Therefore, it is valuable to study the attenuation characteristics of ground vibrations with different center frequencies by means of one-third octave band velocity spectrum. To gain the velocity spectrum of ground vibration, the vibration pickups are set to the velocity gears in this measurement. Using all the 13 testing points shown in Figure 5, the vertical velocity of ground vibration is measured during the traffic peak hours of 4:00 to 7:00 p.m.
In simulating the attenuation of ground vibration, the Bornitz model ( 48 ) is a classical attenuation model, in which the ground vibration is excited by the disturbing force acting on the surface of the half-space subsoil and attenuates because of geometric diffusion of vibration and material damping of soil. Based on the Bornitz model, the current formula of attenuation ratio suitable for the one-third octave band center frequency is derived by

where
According to Equation 5, the attenuation of vertical ground velocity excited by groups of 16 to 20 vehicles can be fitted. Figure 15 shows the fitted curves corresponding to the center frequency of 10 Hz, 12.5 Hz, 16 Hz, and 20 Hz, respectively. It can be seen that the attenuation coefficient
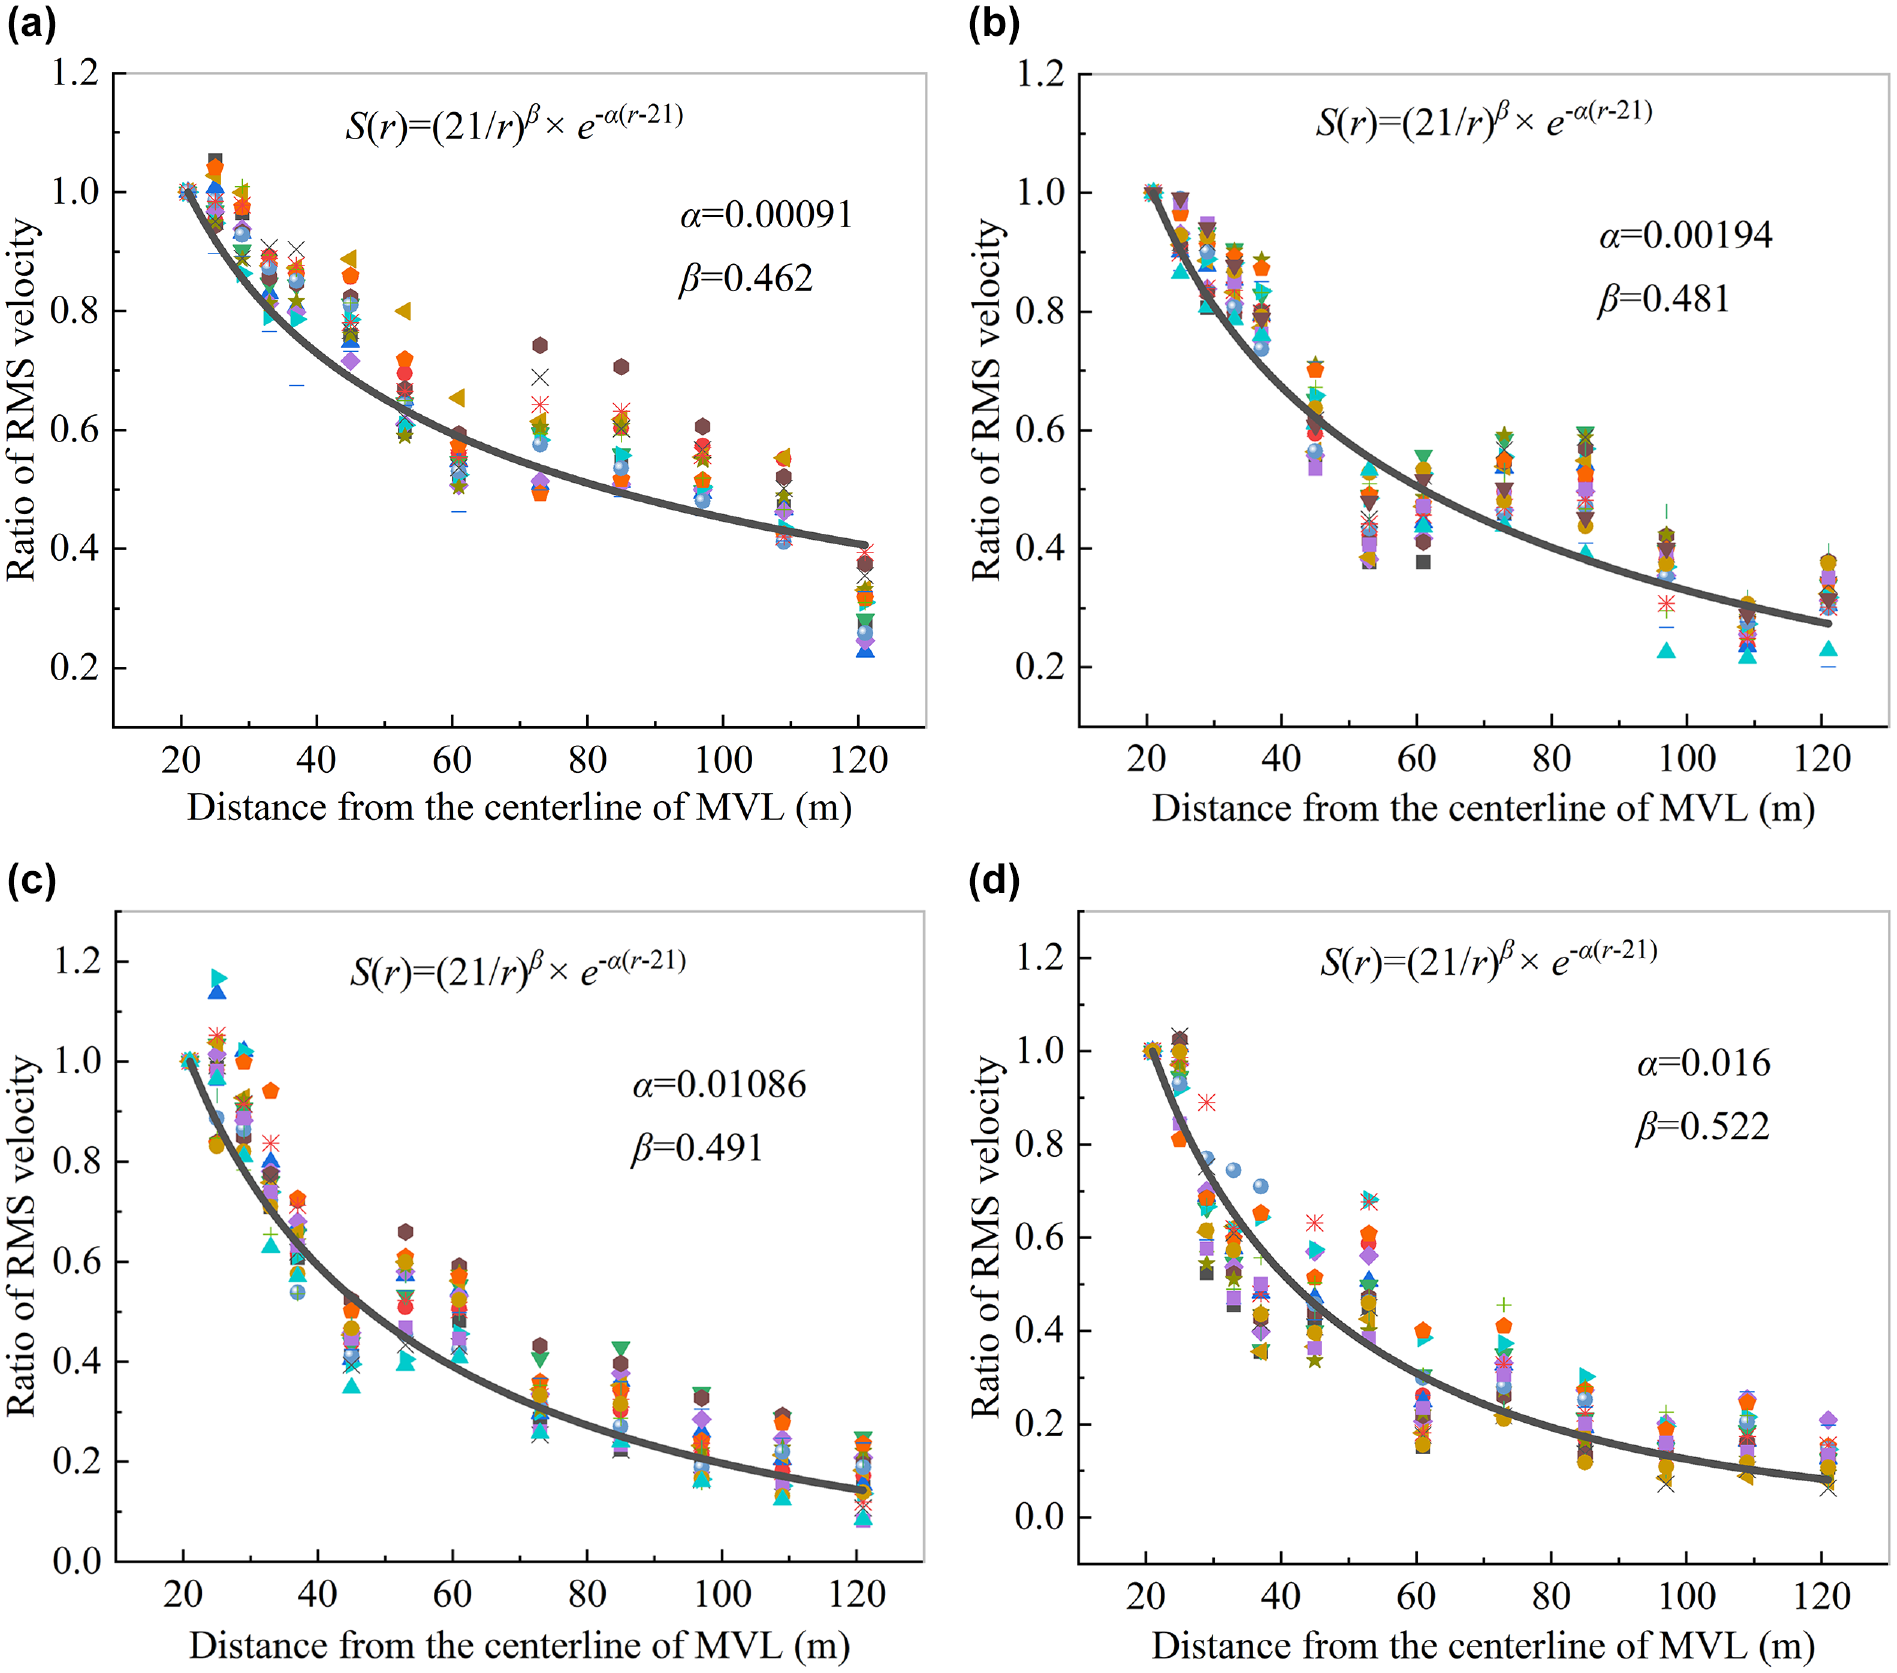
Attenuation fitting of root mean square (RMS) velocity with different frequency: (a) 10 Hz, (b) 12.5 Hz, (c) 16 Hz, and (d) 20 Hz.
The propagation of traffic-induced vibration from the source depends on the distance from the receiver, frequency of vibration, topography between the source and the receiver, and the soil and other geotechnical characteristics of the ground. In particular, the soil absorption plays a decisive role in vibration attenuation with distance, which is reflected in the attenuation coefficient α in Equation 5. Data from Sweden ( 49 ) and the United Kingdom ( 50 ) indicate that dry sand and gravel soils have the highest capability to absorb vibration, while soft clay of peat has the lowest. The significant influence of the soil type on the propagation of ground vibration is roughly illustrated in Figure 16 ( 44 ). In this paper, the on-site top soil is mainly silty clay and falls in between sand and soft clay, and the attenuation tendency with distance obtained from the experimental accords with that in Figure 16. In addition, the experimental results show that the absorptive effects of soils in attenuating ground vibration are also highly frequency dependent. The higher frequency components of the ground vibrations attenuate much more rapidly with distance than the low-frequency components.
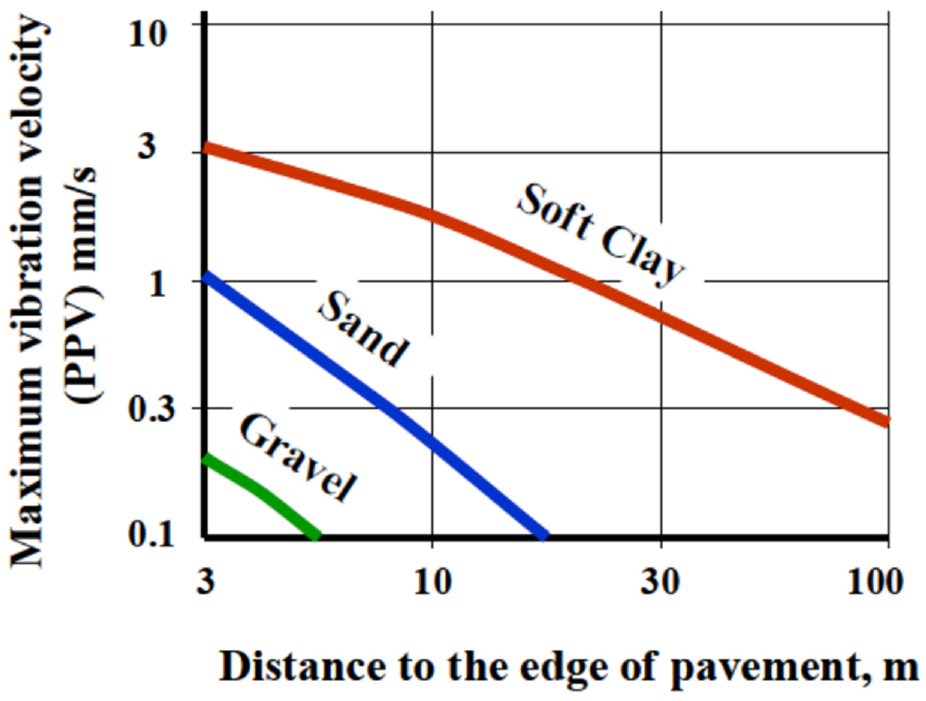
General effect of soil type on the propagation of vibration ( 44 ).
Assessment of Ground Vibration
Assessment of Environmental Vibration in Urban Areas
The assessment standard of environmental vibration is based on GB10070-88, issued by the State Environmental Protection Administration of China, according to the measuring methods of GB10071-88. These two standards continue to be widely used in China ( 33 , 51 ).
In the national standard, the vibration level of z-direction (VLz), which is consistent with the international standard ISO2631-1 ( 52 ), is used as assessment index in the form of:

where
According to different types of urban environmental areas, VLz has different limit requirements in GB10070-88, and the specific details are presented in Table 6.
Allowance Values of Environmental Vibration (GB10070-88)
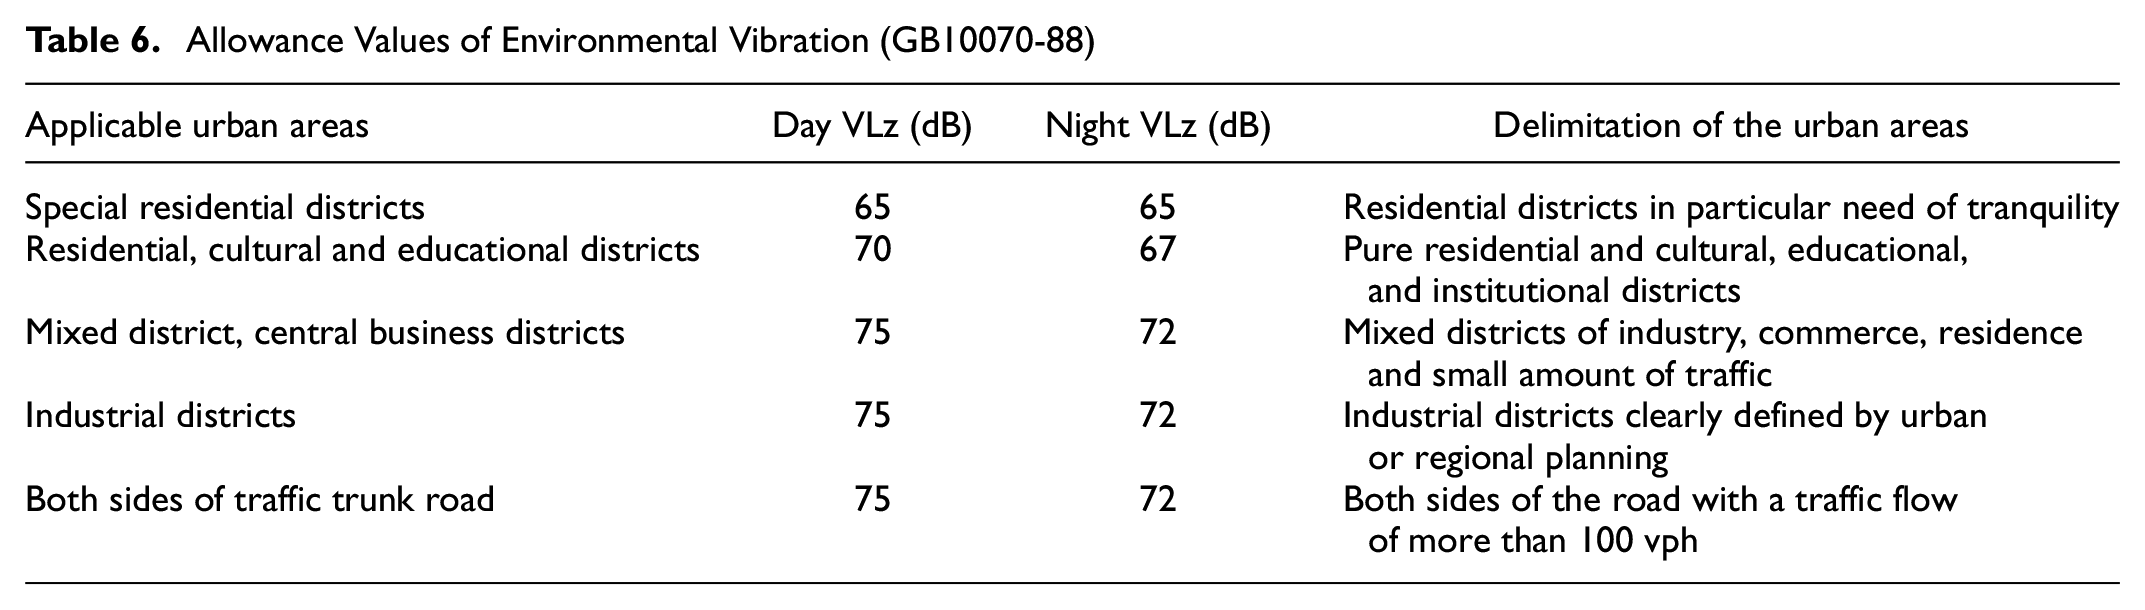
By using all the 13 testing points shown in Figure 5, the signal of the vertical vibration acceleration is measured from 9:30 a.m. to 9:30 p.m. Since the test is mainly in the daytime, the ground vibration is evaluated according to three limit values of 75 dB, 70 dB, and 65 dB in daytime.
Figure 17 shows the vertical acceleration level by one-third octave band induced by a vehicle group. By comparing the weighting acceleration levels in Figure 17 and the no-weighting acceleration levels in Figure 12f, one can find that both of them have two peaks corresponding to similar frequency band ranges, in which the larger peak corresponds to the center frequency of 10 Hz to 12.5 Hz and the smaller peak to 2.5 to 4 Hz. As the distance D increases, the two peak acceleration levels present the general attenuation trend.
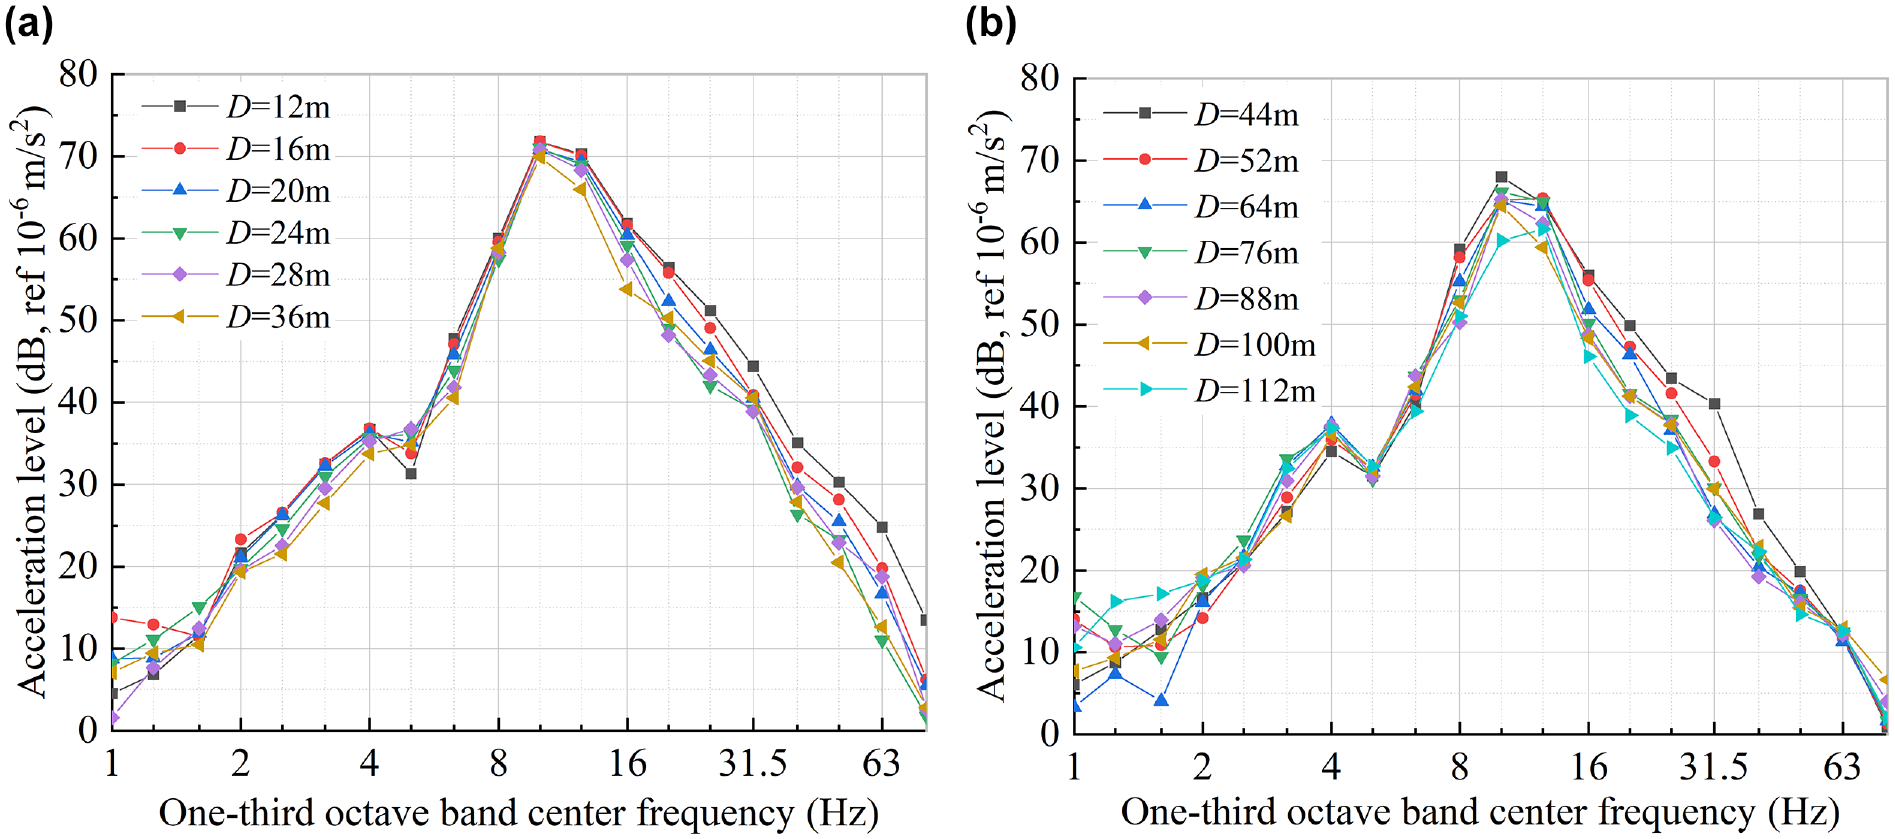
Vertical acceleration level with frequency weighting by one-third octave frequency, from the testing points within the distance D: (a) 12-36m and (b) 44-112m.
The vertical vibration levels at each testing point induced by the group of vehicles containing trucks or buses and the group of cars are shown in Figure 18, a and b , respectively. On the whole, the vehicle groups containing buses or trucks cause a larger vibration response than the group of cars. By comparing the vibration levels with the allowance values in GB10070-88, it can be found that the vibration responses induced by some trucks or buses meet the limit of 75 dB only beyond D = 36 m, meet the limit of 70 dB only beyond D = 88 m, and cannot meet the limit of 65 dB when the distance D is even more than 112 m. However, the vibration response induced by the group of cars can meet the limits of 75 dB, 70 dB, and 65 dB when the distance from the edge of MVL is beyond 12 m, 36 m, and 88 m, respectively.
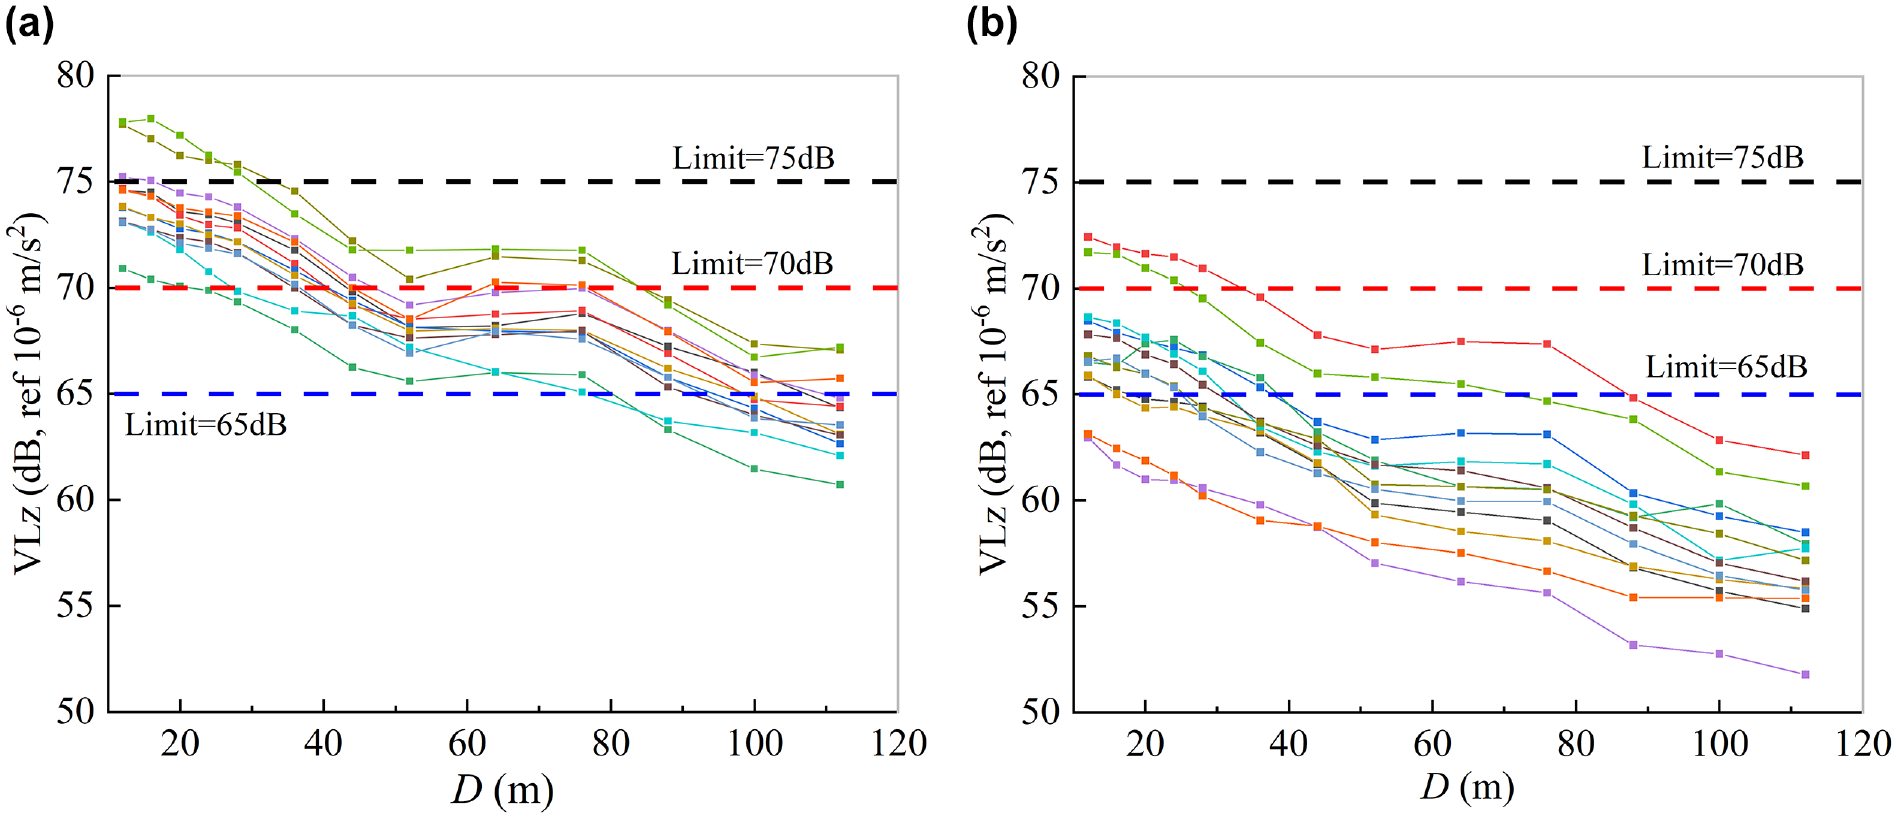
Vibration level of z-direction (VLz) in the vertical direction: (a) groups of vehicles containing trucks or buses and (b) groups of cars.
Assessment of Micro-Vibration for Precise Instruments
Different from the standard of environmental vibration in urban areas, the micro-vibration assessment of sensitive instruments requires stricter standards to ensure their normal operation. In the research, the BBN criteria ( 39 , 53 ) are commonly used to evaluate the micro-vibrations induced by traffic loads on the ground and in surrounding buildings.
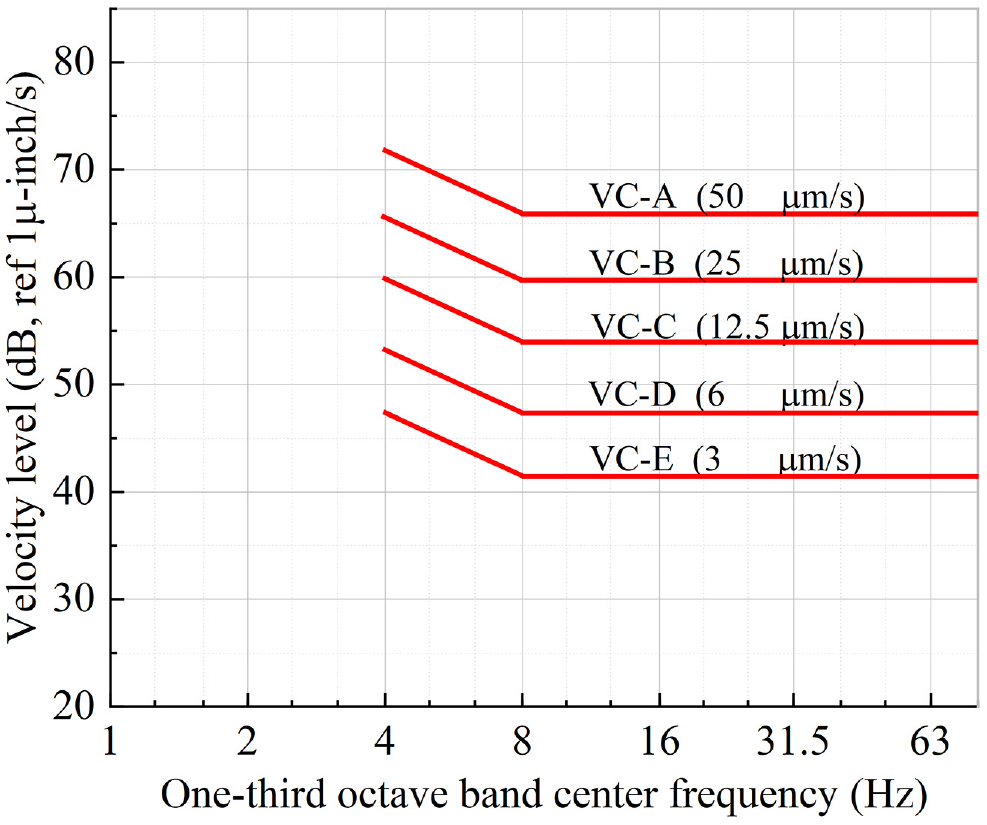
In the BBN criteria, the one-third octave velocity spectrum is the basis of vibration analysis, as shown in Figure 19. The vibration limits adopt the velocity level in dB with the referenced of 1 μ-inch/s, in which five polylines from VC-A to VC-E correspond to different sensitivity levels. In the frequency range of 8 to 80 Hz, the allowable velocities from VC-A to VC-E are from 50 μm/s to 3 μm/s, indicating that the VC-E is the strictest. Since the frequencies of 4 to 8 Hz are usually lower than the lowest resonant frequency of sensitive instruments, the vibration limits in BBN are relatively relaxed in this frequency band.
During the period from 9.30 a.m. to 9.30 p.m. in the experiment, the vibration sensors are arranged to detect in three directions at distances D = 12 m, 20 m, 36 m, 44 m, 52 m, 64 m, 88 m, and 100 m. The most unfavorable ground vibrations are effectively extracted by groups of 13 to 17 vehicles.
The velocity levels along with three different directions are presented in Figure 20, a–c , respectively, in which the black and blue data points correspond to the vehicle groups of trucks or buses and those of cars, respectively. It can be seen that the dominant vibration peaks lie in the frequency range of 10 to 12.5 Hz and most of them exceed the limits stipulated in the BBN criteria. Although there exist smaller peaks in the frequency range of 2 to 4 Hz, the velocity levels of ground vibration in three different directions do not exceed the VC-E level at the distances D = 12 m, 44 m, and 100 m.
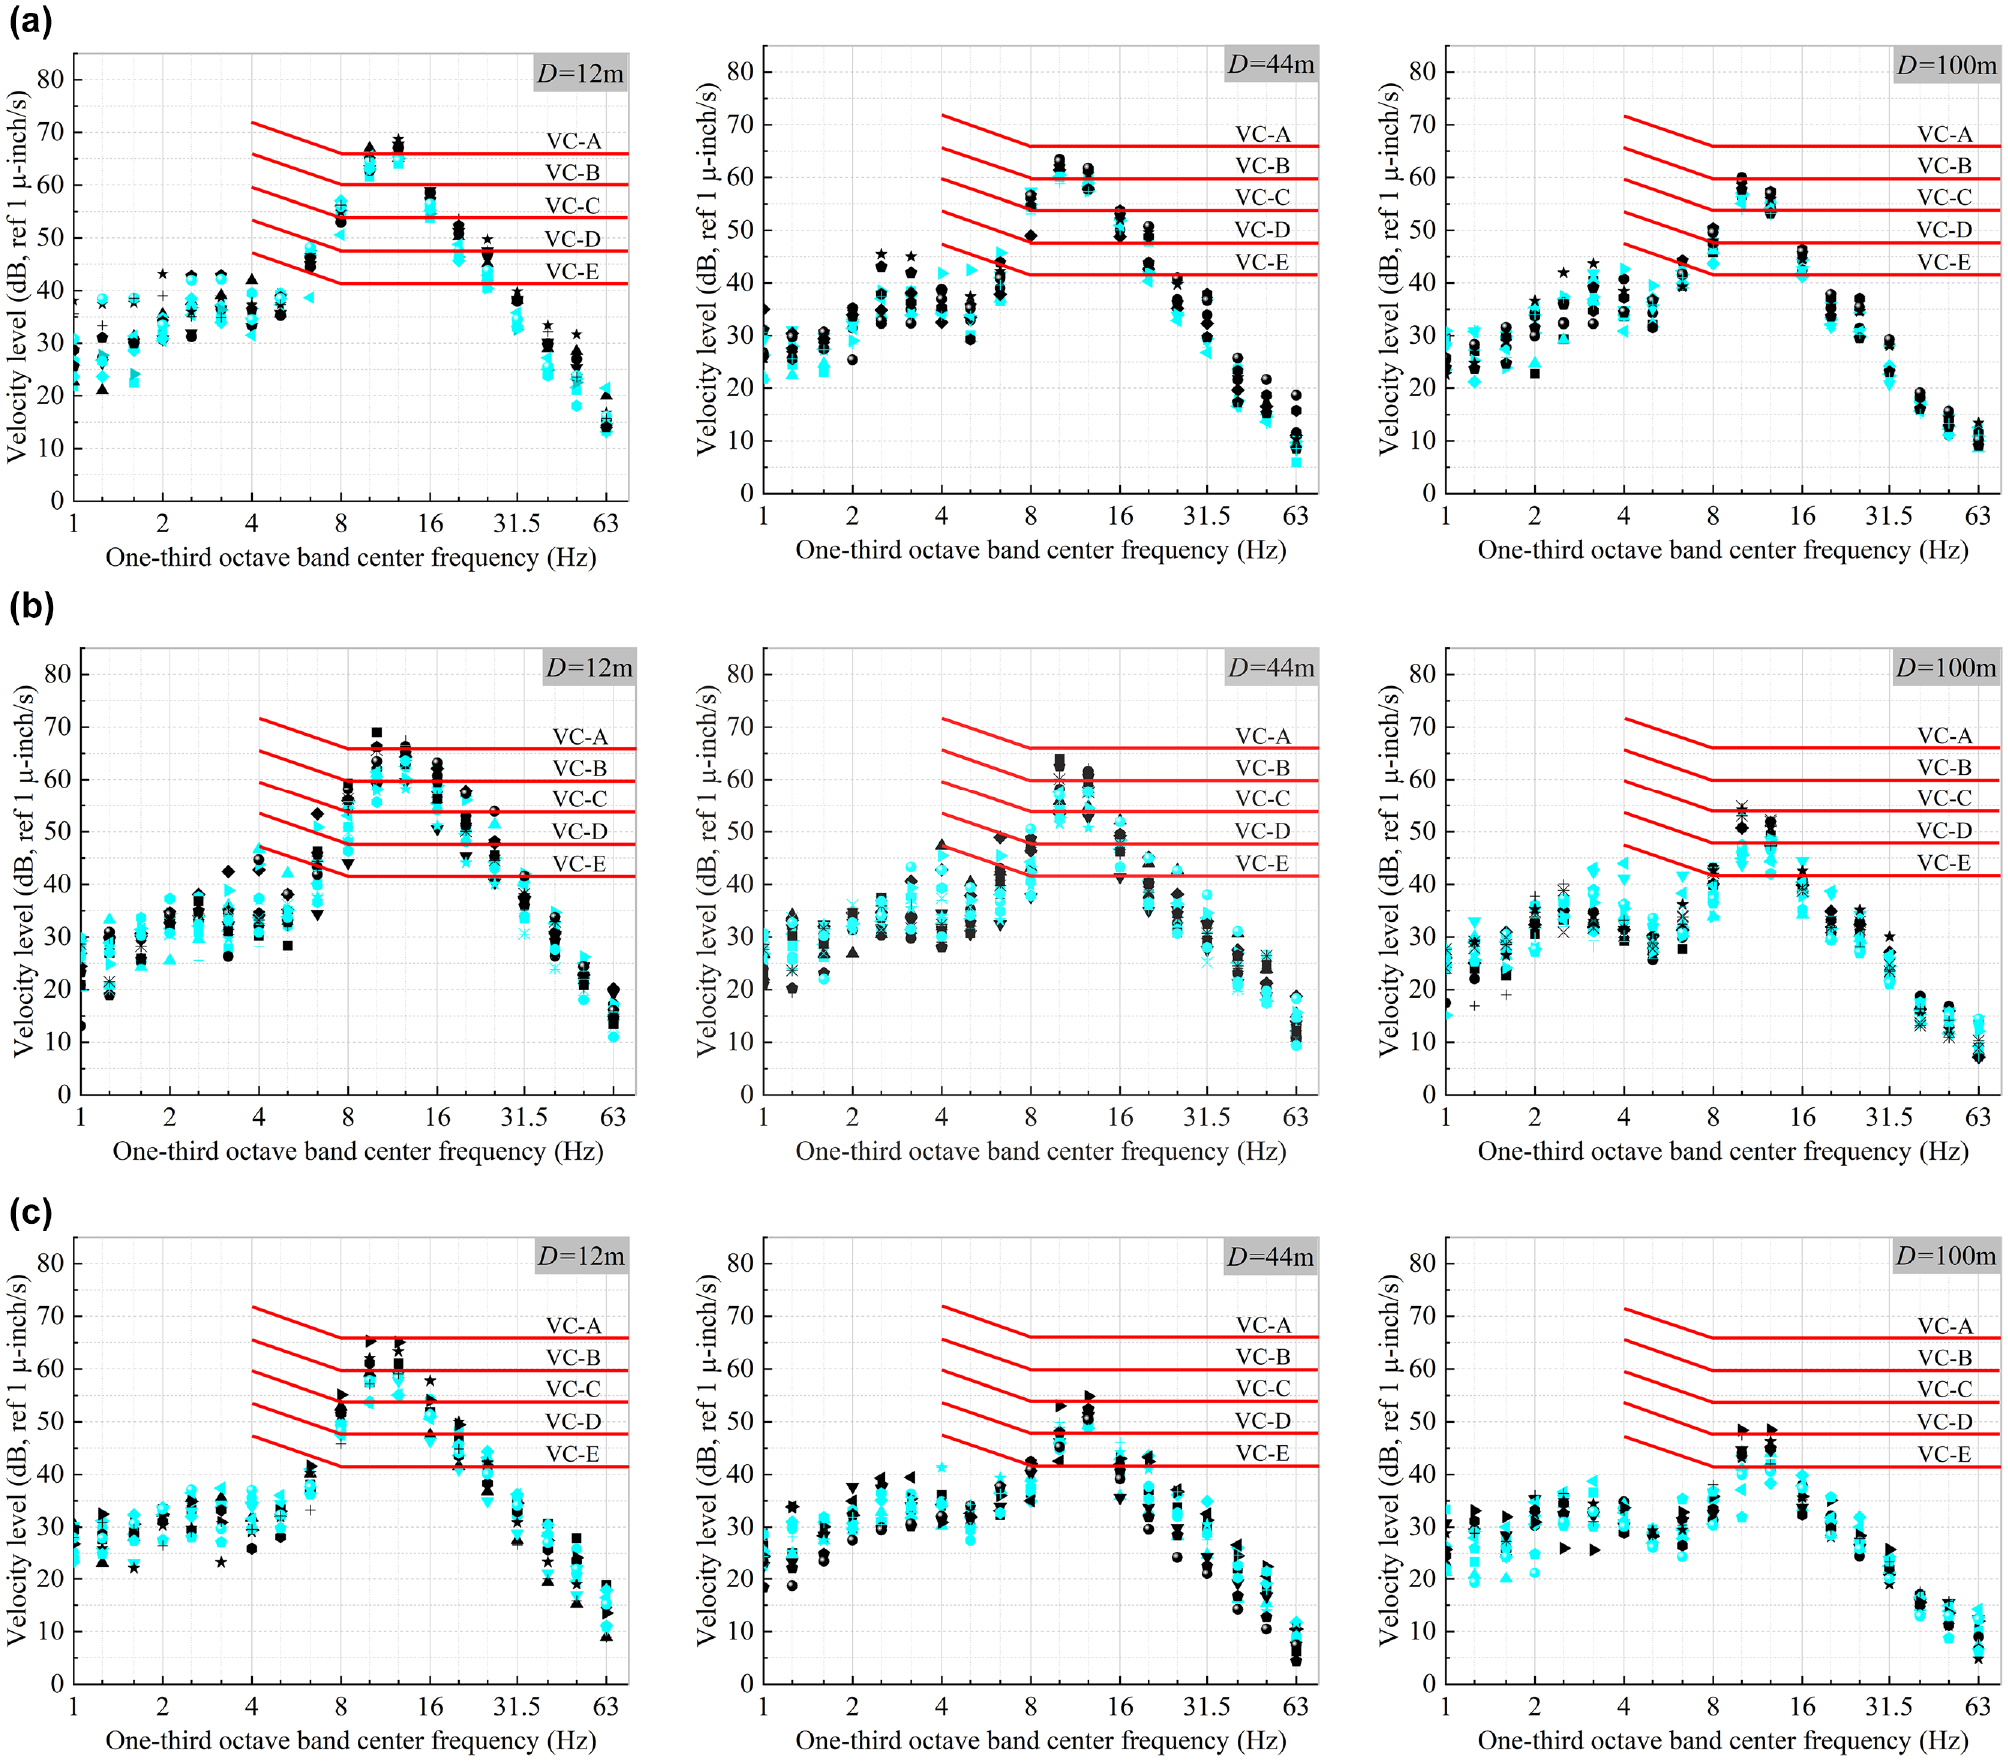
Velocity level in three directions at the distances D = 12 m, 44 m, and 100 m: (a) vertical, (b) transverse, and (c) longitudinal.
The most unfavorable vibration among all unfavorable vibrations induced by different typical vehicle groups should be chosen in the vibration assessment. So, the assessment can be drawn that the vehicle groups containing buses or trucks can cause a larger vibration response than the car groups. The vertical and transverse ground vibrations at the distance of D = 12 m exceed the VC-A level and those at the distances of D = 44 m lie between the VC-B and VC-A levels. Particularly, it should be noted that even at the distance of 100 m, some of the vertical ground vibrations exceed the vibration limits of VC-B level for the precise instruments, and some of the transverse ground vibrations lie between VC-B and VC-D. In the longitudinal direction, the ground vibrations are smaller than in the other directions. Even so, the vibrations at the distance of D = 12 m lie between the VC-B and VC-A levels, between the VC-C and VC-B levels at the distance of D = 44 m, and between the VC-D and VC-C levels at the distance of D = 100 m. Although the vibration responses induced by the car groups are smaller, the vertical, transverse, and longitudinal ground vibrations at the distance of D = 12 m exceed the allowances of VC-B. Even at the far distance of D = 100 m, the vertical, transverse, and longitudinal ground vibrations can respectively exceed the limits of VC-C, VC-D, and VC-E. Obviously, the traffic vehicles driving on the urban trunk road can propagate vibrations to the far distance greater than 100 m and cannot be neglected because it might be a crucial influencing factor in the planning and design of some high-tech workshops.
Conclusion
This paper focuses on the environmental vibration induced by vehicle loads running on an urban road by an on-site experiment. The statistical analysis of the vehicle information and the ground vibrations under different working conditions and signal-collecting periods have been carried out, in which the characteristics and attenuation law of ground vibrations are analyzed and the vibration levels are assessed based on the national environmental vibration standard and the BBN criteria for precise instruments, respectively. The main conclusions are as follows:
The ground vibrations in the time domain have obviously great vibration peaks, and the phenomenon of multi-peak concentration in a short time period is attributed to the combination of vibration waves induced by vehicles close to each other. Based on the correlation coefficients, the traffic volume of total vehicles makes a great contribution to vibration energy reflected and the groups of vehicles containing buses and trucks correspond to greater vibration compared with groups of cars.
There exist two vibration peaks in the spectra of ground vibrations induced by road traffic, the larger peak lies in 10 Hz to 12.5 Hz (close to the bouncing frequency of vehicle wheels) and the smaller peak in 2.5 to 4 Hz (close to the bouncing frequency of vehicle bodies).
The attenuation laws with the distance are fitted by the Bornitz model in the one-third octave band frequency domain. The ground vibrations with high frequencies attenuate faster than those with low frequencies, and in the free field vibrations on the ground surface are mainly attenuated by the power of 0.5 in the form of Rayleigh wave.
The environmental vibrations induced by road traffic exceed the allowance values of 75 dB when the distance from the edge of MVL is 36 m. For the assessment of precision instruments, the velocity level in the vertical vibration is greater than those in the other two directions, which exceed the VC-A level at the distance of D = 12 m and lie between the VC-B and VC-A levels at distances of D = 44 m and 100 m. Even at a distance of 100 m, some of the vertical ground vibrations exceed the vibration limits of VC-B level for precise instruments. Therefore, road traffic moving on the urban road is a crucial influencing factor and should be predicted and evaluated in the planning and design of some high-tech workshops.
Footnotes
Acknowledgements
The authors wish to thank Meng Ma and Guilan Yu for their support with this research, and are also grateful for the grants by the National Natural Science Foundation of China (51978043) and the Natural Science Foundation of Beijing Municipality (8222024).
Author Contributions
The authors confirm contribution to the paper as follows: study conception and design: Y. Cao, Z. Li; data collection: Z. Li; analysis and interpretation of results: Y. Cao, Z. Li, C. Yang; draft manuscript preparation: Y. Cao, Z. Li, C. Yang. All authors reviewed the results and approved the final version of the manuscript.
Declaration of Conflicting Interests
The author(s) declared no potential conflicts of interest with respect to the research, authorship, and/or publication of this article.
Funding
The author(s) disclosed receipt of the following financial support for the research, authorship, and/or publication of this article: The research is supported by the grant of National Natural Science Foundation of China (51978043) and Natural Science Foundation of Beijing Municipality (8222024).
Data Accessibility Statement
The data that support the findings of this study are available from the corresponding author, Zhe Li, on reasonable request.
