
Abstract
The paper evaluates an Eco-Cooperative Automated Control (Eco-CAC) system on a large-scale network considering a combination of internal combustion engine vehicles (ICEVs), hybrid electric vehicles (HEVs), and battery-only electric vehicles (BEVs) in a microscopic traffic simulation environment. We used a novel integrated control system that: (1) routes ICEVs, HEVs, and BEVs in a fuel/energy-efficient manner; (2) selects vehicle speeds based on anticipated traffic network evolution; (3) minimizes vehicle fuel/energy consumption near signalized intersections; and (4) intelligently modulates the longitudinal motion of vehicles along freeways within a cooperative platoon to minimize fuel/energy consumption. The study tested the system using the INTEGRATION software on the Los Angeles (LA), U.S., downtown network for three different demand levels: no congestion, mild congestion, and heavy congestion. The results demonstrated that the Eco-CAC system effectively reduces vehicle fuel and energy consumption, travel time, total delay, and stopped delay in heavily congested conditions. However, different vehicle compositions produced different results. In particular, the maximum energy consumption savings for BEVs (36.9%) for a current vehicle composition occurred at a 10% market penetration rate (MPR) of connected automated vehicles (CAVs) in mild congestion, while the maximum savings for a future vehicle composition (35.5%) occurred at a 50% CAV MPR in no congestion. The system reduced fuel consumption for ICEVs and HEVs by up to 5.4% and 6.3% at a 25% CAV MPR in heavy congestion for current and future vehicle compositions, respectively. However, the system increased total fuel consumption by up to 4.6% at a 50% CAV MPR in no congestion for a current vehicle composition. The study demonstrates that the effectiveness of the Eco-CAC system depends on traffic conditions, including congestion level, network configuration, CAV MPR, and vehicle composition.
Keywords
The objective of this study is to evaluate the performance of an Eco-Cooperative Automated Control (Eco-CAC) system in reducing vehicle fuel/energy consumption by integrating various vehicle control strategies with connected automated vehicle (CAV) applications. Specifically, the Eco-CAC system routes vehicles in a fuel/energy-efficient manner by balancing traffic flow entering congested regions, selecting vehicle speeds based on anticipated traffic network evolution to avoid or delay the breakdown of a sub-region, minimizing local fluctuations in vehicle speeds (also known as speed volatility), and enhancing the fuel/energy efficiency of internal combustion engine vehicles (ICEVs), battery-only electric vehicles (BEVs), and hybrid electric vehicles (HEVs).
The Eco-CAC system integrates four controllers: an eco-routing controller, a speed harmonization (SPD-HARM) controller, an Eco-Cooperative Adaptive Cruise Control at signalized intersections (Eco-CACC-I) controller, and an Eco-Cooperative Adaptive Cruise Control for uninterrupted flow (Eco-CACC-U) controller ( 1 – 12 ). Eco-routing is a technique that finds the most energy-efficient route. Traditionally, drivers determine their route to minimize travel time based on urgency, experience, and current information, including estimated travel time, trip distance, and other trip-related factors. Drivers typically do not consider energy and environmental impacts in their routing decisions ( 13 ). Eco-routing can improve vehicle energy efficiency and reduce vehicle emissions by determining the most energy- and eco-friendly route. Furthermore, eco-routing can be a valuable feature for BEVs because of their limited battery capacities and driving ranges, particularly when a charging area is not immediately available. A more detailed description of the eco-router that was used can be found in Wang et al. and Rakha et al. ( 1 , 2 ). The SPD-HARM controller regulates the flow of traffic approaching network bottlenecks. In earlier work, a robust SPD-HARM controller was developed that identifies bottlenecks dynamically and then controls the speed of CAVs to disperse congestion ( 3 , 4 ). The Eco-CACC-I system computes a fuel/energy-optimized speed profile both upstream and downstream of a signalized intersection. The objective is to minimize the total fuel consumed while traveling from a predefined distance upstream of a signalized intersection to a distance downstream of the intersection. Eco-CACC-I employs dynamic programming to discretize the solution space and solve the optimization problem to compute the optimum speed profile (as described in detail in Refs. 5–9). The Eco-CACC-U controller, also referred to as vehicle platooning, intelligently modulates the longitudinal motion of vehicles within a cooperative platoon by minimizing fuel and energy consumption, as described in detail in Bichiou et al. ( 12 ). The Eco-CACC-U controller attempts to maintain a desired time headway between the vehicles by minimizing the spacing error between the current conditions and the desired following policy in different traffic situations.
Within the Eco-CAC system, the strategic controller extends traditional eco-routing and SPD-HARM systems to a fully integrated, network-wide controller that identifies bottlenecks and controls the flows approaching the bottlenecks in real-time. This strategic controller (eco-router and speed controller) computes the energy/fuel-optimum route and vehicle optimum speeds (upper and lower bounds) required to regulate the flow of traffic approaching downstream sub-networks, bottlenecks, or both, thus preventing or delaying the breakdown of traffic and mitigating traffic congestion. The eco-router computes optimum eco-routes using a vehicle-specific feedback controller. Unlike a predictive controller, a feedback controller can capture the impact of the other lower-level controllers on the vehicle energy consumption and does not require a link-specific analytical energy/fuel consumption function, which is often difficult to develop, inaccurate, and not vehicle-specific. Instead, the eco-router controller uses information shared by other CAVs to compute the link cost estimates. The Eco-CAC system also includes two local controllers: the Eco-CACC-I and Eco-CACC-U controllers. The Eco-CACC-I controller computes energy-optimum vehicle trajectories through signalized intersections using traffic count and signal phase and timing (SPaT) data. The Eco-CACC-U controller employs fuel/energy-efficient platooning strategies along uninterrupted road facilities such as highway sections. For this study, the fully functional Eco-CAC system was implemented in a traffic simulation environment to enable testing at a network level.
The energy consumption patterns of ICEVs, BEVs, and HEVs differ significantly according to driving cycles. A previous study found that BEVs are more energy efficient on low-speed arterial trips compared with highway trips ( 14 ). For instance, the study demonstrated that fuel consumption rates on a Freeway G cycle and a Local cycle were very similar for a test ICEV, but that a BEV’s energy consumption rates on these two cycles were significantly different. The study demonstrated that the difference was because of the energy recovered during braking and that the BEV recovered a higher amount of energy on the Local cycle ( 14 ). Also, an HEV operates in electric vehicle (EV) mode when the speed is lower than a specific speed and the required power is lower than a specific power. A regenerative braking system is a main BEV and HEV feature, and BEVs and HEVs can recover more energy in urban arterial driving conditions with increased braking operations, while ICEVs’ fuel efficiency is higher in uninterrupted freeway operational conditions. The different energy consumption patterns of ICEVs, BEVs, and HEVs will require different eco-driving strategies. This study investigates the impacts of CAV applications on these three vehicle types on a single large network.
The contribution of this study is to evaluate an Eco-CAC system that operates various CAV applications, at the same time considering multiple vehicle powertrains on a large-scale network. Most previous studies tested a single CAV application on a small network, but this study tests multiple CAV applications on a large network to evaluate the synergistic impacts of multiple CAV applications. Further, most studies have tested CAV applications using a single vehicle powertrain. This study tests the impacts of multiple applications considering three powertrains—ICEVs, BEVs, and HEVs—at the same time to identify the impacts of the Eco-CAC system.
The remainder of the paper is organized as follows: the next section is a report on state-of-the-art CAV applications. Then, the paper includes description of the BEV, HEV, and ICEV fuel/energy consumption models that were utilized for this study. The next section describes the simulation model, followed by analysis of the various Eco-CAC simulation options and a demonstration of the results of the simulation model. Finally, the study conclusions are presented.
Literature Review
Several studies have developed and evaluated various CAV applications, including eco-routing, SPD-HARM, Eco-CACC-I, and platooning. For example, Ahn and Rakha investigated the impacts of vehicle route choice on vehicle energy consumption and emission rates for different vehicle types and found that the faster highway route is not always the ideal route choice from environmental and energy consumption perspectives ( 13 ). They also developed a stochastic feedback eco-routing system that builds on vehicle connectivity and quantified the system-wide impacts for various levels of market penetration and congestion in downtown Cleveland and Columbus, Ohio ( 15 , 16 ). That study found that the developed eco-routing model could save network-wide fuel consumption between 3.3% and 9.3% for ICEVs when compared with typical routing strategies that minimize travel time ( 15 , 16 ). Fiori et al. found that BEVs and ICEVs had different fuel/energy-optimized routing characteristics and recommended different routings for different vehicle types ( 17 ). Similarly, Artmeier et al. investigated an energy-efficient path for BEVs with recuperation in a graph-theoretical context, which extended a general shortest path problem ( 18 ). Sachenbacher et al. developed energy-optimal routing for BEVs and explained that standard routing did not work for EVs because of their use of regenerative braking, along with the complexity of several parameters, such as vehicle load and auxiliary usages, as well as battery capacity limitations ( 19 ). Yi et al. studied the energy impact for eco-routing of an EV fleet under different ambient temperatures, and Abousleiman et al. developed an energy-efficient routing model for EVs using an ant-colony-based optimization technique ( 20 , 21 ). Abousleiman and Rawashdeh also investigated various eco-routing algorithms for EVs using heuristic methods based on Particle Swarm Optimization and Tabu Search. Those studies focused on simplified algorithms without proving the implementation with a real-world example ( 22 – 24 ).
Several researchers developed SPD-HARM algorithms to reduce vehicle delay and congestion. Ma et al. summarized various SPD-HARM systems and their potential with emerging technologies (CAVs) ( 25 ). Jin and Jin formulated a variable speed limit control problem and analyzed equilibrium states and their stability with a proportional-integral controller ( 26 ). In addition, Yang and Rakha developed a novel proactive feedback SPD-HARM controller and evaluated the robustness of the proposed algorithm to traffic demand variations ( 27 ). Their study also verified the environmental benefits of the proposed algorithm. Finally, Malikopoulos et al. developed a control strategy for several automated vehicles before they enter a speed reduction zone on a freeway and tested a control problem that can be implemented in real time ( 28 ).
Multiple studies have focused on developing eco-driving algorithms to reduce the vehicle fuel/energy consumption near signalized intersections using CAV technologies ( 29 – 33 ). The eco-driving technique at signalized intersections is also called eco-approach and departure (EAD). These eco-driving strategies provide recommendations to individual drivers or vehicles so they can adjust vehicle maneuvers appropriately to reduce fuel/energy consumption in response to real-time traffic information. Most of the studies focused on developing eco-driving strategies for a single intersection control and ICEVs. For example, Asadi and Vahidi developed a vehicle adaptive cruise control system to reduce fuel consumption and idle time at stop lights; researchers adapted an optimization-based control algorithm and used short-range radar and traffic signal information predictively to schedule an optimum velocity trajectory for the vehicle ( 34 ). Hao et al. developed EAD algorithms to reduce fuel consumption and emissions that adapted to the dynamic uncertainty for actuated signal and real-world traffic ( 30 ). While most previous Eco-CACC-I studies focused on ICEVs, a few studies have investigated eco-driving strategies for BEVs near signalized intersections ( 31 , 35 , 36 ). Zhang and Yao proposed an eco-driving model that provides a velocity profile for EV eco-driving according to the current vehicle status information and SPaT information ( 36 ). Wu et al. proposed an analytical model that estimates a time-dependent optimal velocity profile for an EV by systematically considering road characteristics and real-time traffic conditions to minimize the electricity usage along a chosen route ( 37 ). The model considers the impact of the presence of intersection queues in both temporal and spatial dimensions.
For Eco-CACC-U control, many researchers have taken a systematic approach to test and evaluate that particular technology ( 38 – 41 ). Lammert et al. evaluated fuel consumption results of two Class 8 tractor-trailer combinations platooned together compared with their stand-alone fuel consumption ( 42 ). They tested various speeds, distance gaps, and the mass of the vehicles to determine the best combination leading to the lowest fuel consumption. Smith et al. developed a model-predictive control-based approach for vehicle platooning in an urban traffic setting ( 38 ). Their study involved experiments performed with real test vehicles on a closed track and demonstrated that vehicle platooning has the potential to increase throughput significantly at intersections. Ellis and Gargoloff highlighted the unintended consequences of platooning on the vehicles, particularly heavy trucks ( 43 ). Using computational fluid dynamics, they stressed the significant aerodynamic drag reduction. However, they noticed that if the trucks are too close (i.e., 5 m gap), the air flow going through the engine is significantly reduced which results in the fans of all trucks behind the lead being continuously engaged. Jiang et al. proposed a platooning control method based on the virtual mass-spring-damper theory to improve the platoon’s system safety in mixed traffic flows consisting of CAVs and human-driven vehicles (HDVs) ( 39 ). The study tested two types of mixed platoons composed of five CAVs and one HDV by using CarSim and Matlab/Simulink and found that the inter-vehicle spacing errors do not amplify as they propagate along the platoon. The control method effectively improved the stability and safety of the mixed vehicular platoon ( 39 ).
While several researchers have tested individual CAV applications, these studies were not conducted on large urban networks considering multiple CAV applications working together. Further, most previous studies considered a single vehicle powertrain in evaluating their CAV applications without considering various vehicle types traveling concurrently. To address this gap, we evaluated multiple CAV applications running concurrently on a large network to determine the synergistic impacts of the various CAV applications considering multiple-vehicle powertrains. Moreover, one of the major benefits of BEVs is their regenerative braking system, which allows for the recovery of energy while braking. Most studies assumed a regenerative braking factor mainly dependent on the vehicle speed or an average regenerative braking energy efficiency while testing BEVs. This study enhances previous efforts with the application of a microscopic BEV energy consumption model that can capture instantaneous braking energy regeneration, which is not available in most BEV energy models.
Energy Consumption and Delay Estimation
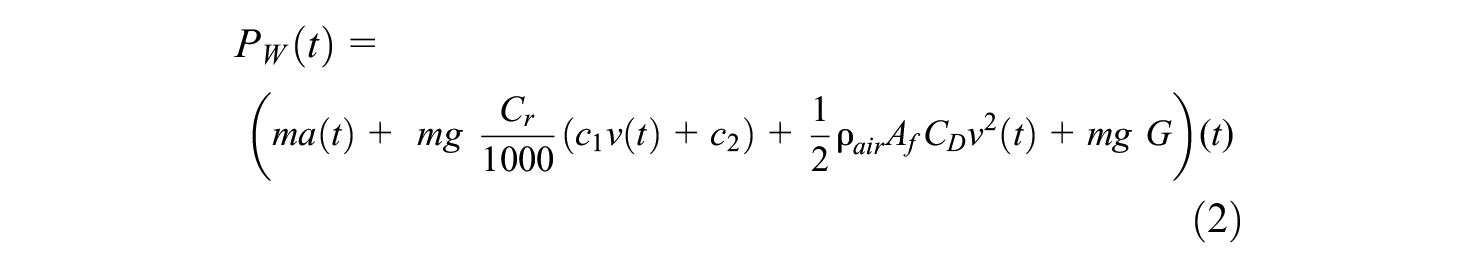
We used the Virginia Tech comprehensive power-based fuel consumption model (VT-CPFM) to estimate the instantaneous fuel consumption rate of ICEVs and considered a 2019 Toyota Camry as a representative ICEV. The VT-CPFM was selected because of its simplicity, accuracy, and ease of calibration ( 44 , 45 ). This fuel model uses instantaneous power as an input variable and can be easily calibrated using publicly available fuel economy data (e.g., Environmental Protection Agency [EPA]-published city and highway gas mileage). Thus, the calibration of model parameters does not require gathering any vehicle-specific field data. The VT-CPFM is formulated in Equation 1.

where
a 0, a1, and a2 = the model parameters that can be calibrated for a particular vehicle using publicly available information provided by the manufacturer (details of the calibration steps can be found in Rakha et al. [ 44 ]), and
PW(t) = the instantaneous power (kW) at the wheels that is computed using Equation 2.
Carbon dioxide (CO2) emissions were estimated using the carbon balance equation. Given that the molecular weight of carbon is 12 g/mol, and the molecular weight of CO2 is 44 g/mol, CO2 contains 27.3% (12/44) carbon. Similarly, carbon monoxide (CO) is composed of 42.9% carbon and, according to the Code of Federal Regulations Title 40 Part 86 (40 CFR 86), hydrocarbon (HC) emissions contain 86.6% carbon by weight. Given that typical gasoline contains approximately 86.4% carbon and has a density of 738.79 g/l (or 2,800 g per gal), there are 638.31 (0.864 × 738.79) grams of carbon in a liter of gasoline. Because the absolute value of CO2 emissions is significantly higher than HC and CO emissions, these can be ignored and the prediction of CO2 emissions becomes directly related to fuel consumption levels ( 46 ). Consequently, CO2 emissions in g/s were computed by multiplying the fuel consumption rate in l/s by 2,338 (638.31/0.273) to compute CO2 emissions in g/s.
The Virginia Tech comprehensive power-based EV energy consumption model (VT-CPEM) was selected to estimate BEV energy consumption levels ( 14 ). For this study, we utilized a 2013 Nissan Leaf as the BEV as validation data were only available for this vehicle. The VT-CPEM is a microscopic, power-based BEV energy model developed to estimate the instantaneous energy consumption of BEVs. The model uses instantaneous speed, acceleration, and grade information as input variables. The outputs of the model are the energy consumption (kWh/km), the instantaneous power consumed (kW), the instantaneous energy regenerated (kW), and the final state of charge of the electric battery (%). The VT-CPEM has a simple structure that allows implementation into other modeling tools, including microscopic traffic simulation models and in-vehicle/smartphone applications for real-time eco-driving and eco-routing. One of the major advantages of the VT-CPEM is that it captures instantaneous braking energy regeneration, which is not available in most EV energy models. The model estimates the power at the wheels using Equation 2.
where
m = vehicle mass,
The power consumed by the battery


The VT-CPEM was validated against experimental data and found to accurately estimate energy consumption, producing an average error of 5.9% relative to empirical data. A more detailed description of the model is provided in the literature ( 14 ).
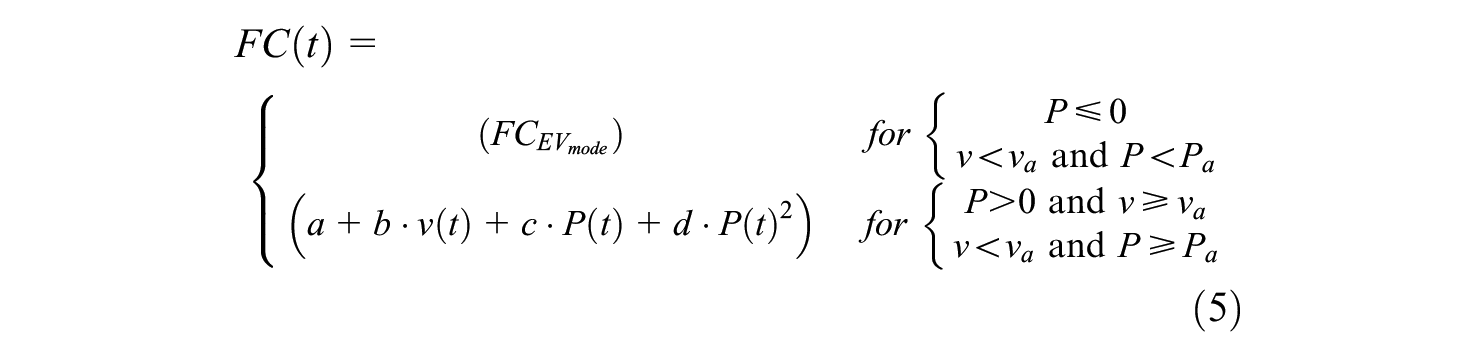
The team utilized the HEV fuel consumption model that is formulated in Equation 5, and a 2011 Toyota Prius was considered as a representative HEV in this study. The model was developed after analyzing field data and HEV energy consumption behaviors. First, the amount of fuel consumed is proportionally related to both the vehicle power and speed. Second, the HEV operates in EV mode when the power is less than 0. Third, the HEV utilizes only an electric mode when the speed is lower than an EV mode speed (va) and the required power is lower than a specific power (Pa).
where
FC(t) = fuel consumption rate (l/s),
FCEV_mode = fuel consumption rate (l/s) in EV mode and estimated as average fuel consumption in EV mode,
P(t) = instantaneous total power (kW), and
v = instantaneous vehicle speed (km/h).
Statistical analysis of the empirical data revealed that the optimum values for va and Pa are 32 km/h and 10 kW, respectively. A detailed description of the HEV fuel consumption model is provided in Ahn and Rakha ( 51 ).
The vehicle delay (

The stopped delay (

Simulation Model Development
In this study, we integrated four applications—eco-routing, SPD-HARM, Eco-CACC-I, and Eco-CACC-U—to develop the Eco-CAC system. We utilized a travel time user equilibrium traffic assignment based on the Frank-Wolfe algorithm as the base case traffic assignment for comparison purposes.
The study utilized a multi-objective (MO) eco-routing model to reduce both travel time and fuel/energy consumption. A detailed description of the MO eco-routing model is described in Ahn et al. ( 53 ). That previous study found that the eco-routing can reduce BEV energy consumption by up to 28.1% but also increased travel time up to 285.5% compared with the travel time optimum routing option. The study applied the MO eco-routing model that uses a link cost function that addresses the specification of driver value of time and the cost of fuel/energy on specific links. The study found that the MO eco-routing strategy could reduce vehicle fuel/energy consumption effectively with minimum impacts on travel times.
The SPD-HARM controller regulates the flow of traffic approaching network bottlenecks. The study utilized a previously developed robust SPD-HARM controller that identifies bottlenecks dynamically and then controls the speed of CAVs to disperse traffic congestion (
4
,
54
). The typical structure of a controller is composed of a nominal part, similar to a feedback linearizing or inverse control law, and additional terms aimed at dealing with model uncertainty. The developed robust nonlinear controller is designed based on the consideration of both the nominal model and some characterization of the model uncertainties. This SPD-HARM controller, based on a sliding mode controller, was applied only to freeway sections. Abdelghaffar et al. designed an SPD-HARM controller that regulates vehicle speeds in a speed harmonization zone to maintain downstream link vehicle speeds at the speed of capacity (
4
,
54
). The SPD-HARM controller is dynamic, does not require prior knowledge of bottleneck locations, and delivers recommended speeds to the vehicles on the network. The congestion levels on the freeways are monitored and fed to the controller, which then results in speed recommendations for the vehicles on the upstream link if the current link is congested. If the average density of link (l),
An Eco-CACC-I controller that computes a fuel/energy-optimized speed profile both upstream and downstream of a signalized intersection was developed through multiple previous studies. The controller minimizes the total fuel/energy consumption within a predefined distance upstream of the intersection to a distance downstream of the intersection. In addition, various constraints are constructed using the relationship between vehicle speed, acceleration, deceleration, and traveled distance. The algorithm computes the optimum vehicle speed profile starting from upstream to downstream of a signalized intersection by incorporating vehicle dynamics and fuel consumption models. When a vehicle is approaching a signalized intersection, the vehicle may accelerate, decelerate, or cruise (maintain its current speed) depending on its speed, distance to the intersection, signal timing, or other factors. Considering that the vehicle may or may not need to decelerate when approaching the traffic signal, two cases are considered to develop the Eco-CACC-I strategies:
• Case 1: A vehicle can proceed through the intersection during a green indication without decelerating (either by maintaining a constant speed or accelerating to a higher speed and maintaining that speed).
• Case 2: A vehicle must decelerate and maintain that lower speed to traverse the intersection during the green indication.
The two cases describe the vehicle’s optimum trajectory to minimize its energy/fuel consumption while traversing the intersection. After the vehicle passes the stop line, the vehicle attempts to accelerate to the speed limit downstream of the intersection. (More details of the Eco-CACC-I algorithm are provided in Refs. 5, 7, 8, 10, 11, 55–57.)
The current research team developed an Eco-CACC-U controller that intelligently modulates the longitudinal motion of vehicles within a cooperative platoon by minimizing fuel and energy consumption. A controller is necessary to sustain a constant time gap between two consecutive vehicles. The controller’s objective is to maintain a constant/desired time gap,


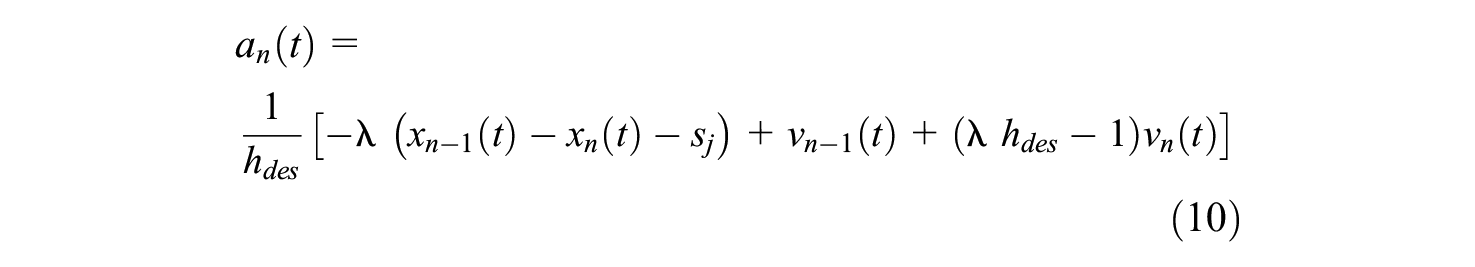
Equation 10 uses a linear car-following model and requires knowledge of the difference in position between two consecutive vehicles as well as their respective velocities, which can be achieved by having sensors on the vehicles or through vehicle-to-vehicle communication. The presented controller has one hyper-parameter (
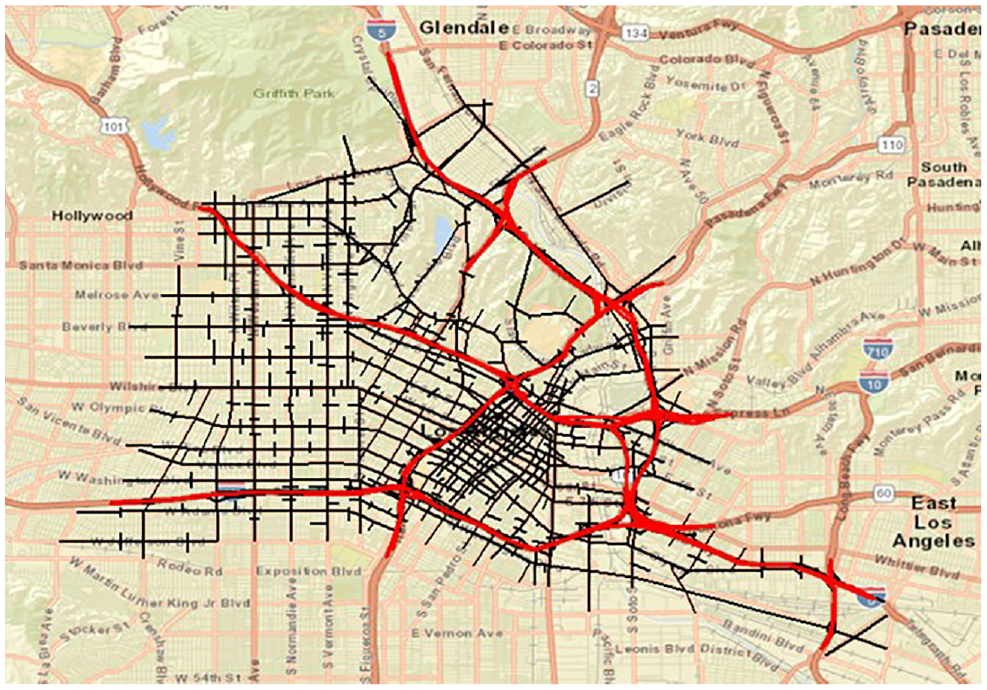
The study developed a simulation model considering a calibrated network of downtown Los Angeles (LA), California, to evaluate the Eco-CAC system, as shown in Figure 1. The Eco-CAC applications were implemented and evaluated within the INTEGRATION microscopic traffic simulation software. INTEGRATION is an agent-based microscopic traffic assignment and simulation software that was conceived in the late 1980s and continues to be developed at The Virginia Tech Transportation Institute (2, 52, 60–67). It was conceived as an integrated simulation and traffic assignment model that tracks the movement of individual vehicles every 0.1 s. This allows for the detailed analysis of car-following and lane-changing movements and captures shock wave propagations. The software also permits considerable flexibility in representing spatiotemporal variations in traffic conditions. In addition to estimating vehicle stops and delays, the simulation model can also estimate the fuel consumed by individual vehicles and the vehicular emissions ( 46 , 52 , 68 , 69 ). The INTEGRATION software incorporates a variable power model that computes the vehicle’s tractive effort, aerodynamic, rolling, and grade-resistance forces ( 70 , 71 ). The INTEGRATION model has not only been validated against standard traffic flow theory, but it has also been utilized for the evaluation of large-scale real-life applications (62, 52, 68, 72–77).
Los Angeles (LA) test network.
The network was calibrated to collected local traffic counts in LA, as described in Du et al. (
78
). We then computed the most likely origin-destination (OD) demand that matched the observed flows. There are several advantages to using real-world networks. First, these networks reflect real-world traffic conditions in large metropolitan areas under typical peak demand levels. Second, each network contains a range of road types, including multiple interstate highways, highway ramps, major arterials, and local connectors. Third, the network includes traffic control infrastructures, such as stop signs and traffic signals using optimized signal timing plans. All traffic signal timing data were coded in the simulation model. The LA test network includes interstates I-5, I-10, I-710, I-110, and U.S. Route 101, which all serve the downtown area. The network is composed of more than 3,500 links with a traffic demand of roughly 144,000 vehicles per hour (vph) during the morning peak hour. The LA network was constructed using 1,624 nodes, 3,556 links, 457 traffic signals, and 81,858 OD pairs. The traffic demand was estimated using the QueensOD software, which computes the most likely time dependent static traffic assignment and OD demand by iteratively minimizing the error between the observed traffic counts obtained from selected loop detectors and the corresponding estimated traffic volume (
79
). Dynamic OD demands were then estimated using an iterative procedure described in Yang and Rakha (
80
). The estimated OD demands provided a good match to the field observed traffic counts with an
ECO-CAC Simulation Using Single Vehicle Types
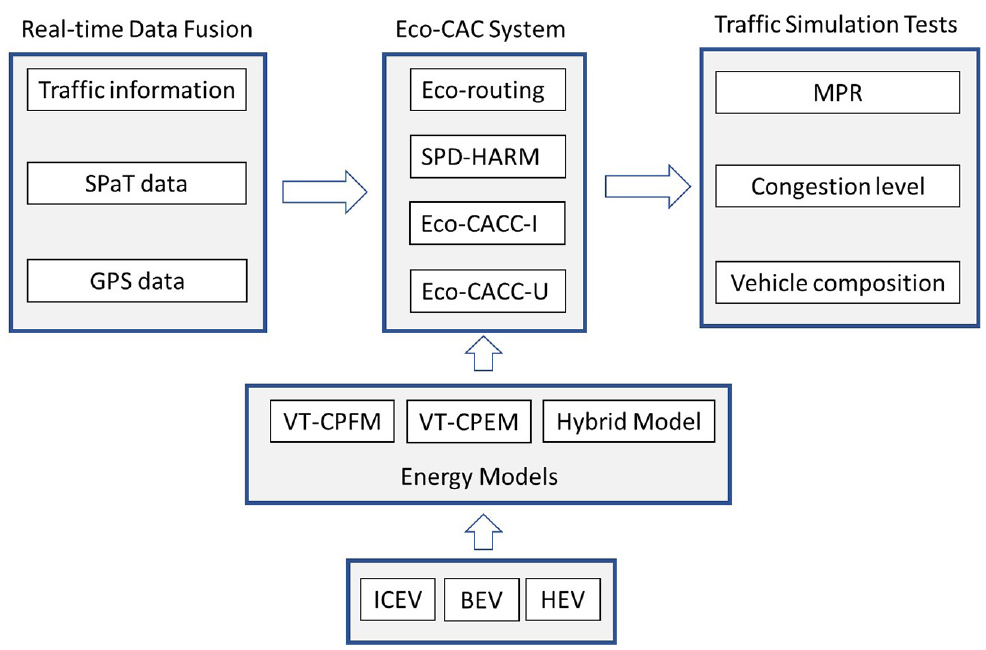
The study evaluated the integrated Eco-CAC system on the LA network using the INTEGRATION simulation software. Figure 2 presents a flowchart that highlights the data flow, Eco-CAC applications, energy models, and traffic simulation scenarios that were conducted in this study.
Eco-Cooperative Automated Control (Eco-CAC) study diagram.
The simulation was repeated 10 times with different seeds to capture the stochastic nature of traffic conditions. All results reported are averages across the 10 random seeds. The study tested three different congestion levels: no congestion, mild congestion, and heavy congestion conditions, which represent 25%, 50%, and 100% of weekday morning peak traffic demands, respectively. For the base case scenarios, the average travel time and the average delay per vehicle were 461.7 s and 91.7 s for the no congestion case, 514.4 s and 138.96 s for the mild congestion case, and 929.4 s and 455.9 s for the heavy congestion case, respectively. For the base case scenarios, the Eco-CAC system was not applied to the test network. The study tested various CAV market penetration rates (MPRs), including 1%, 2%, 5%, 10%, 20%, 25%, 50%, 75%, and 100%. For example, for the 25% CAV MPR scenario, 25% of the vehicles utilize the Eco-CAC system while the remaining 75% of vehicles do not use the Eco-CAC system.
Figure 3 demonstrates that the Eco-CAC system produces fuel consumption savings for ICEVs on the LA network in heavily congested conditions. The study found that the Eco-CAC system reduces ICEV fuel consumption between 2.3% and 6.1% (p-value < 0.01) in the heavily congested conditions but also increases fuel consumption by up to 7.4% (p-value < 0.01) in low and mild congestion. The t-tests indicate that the results are statistically significant. Figure 2 also shows that the Eco-CAC system reduces travel time by up to 8.9% (p-value < 0.01), total delay by up to 21.9% (p-value < 0.01), and stopped delay by up to 67.7% (p-value < 0.01). In particular, the Eco-CAC system effectively reduces travel time and total delay in heavily congested conditions but increases those measures of effectiveness in low and mild congestion. For stopped delay, the Eco-CAC system mostly reduces vehicle stopped delay for all congestion levels and all CAV MPR cases except in a few cases for the mild congestion levels. Figure 2 also shows that the Eco-CAC system reduces ICEV CO2 emissions in heavily congested conditions but increases CO2 emissions in low and mild congestion conditions, which is similar to the fuel consumption results. The results indicate that the Eco-CAC system is most effective in congested conditions and is not recommended when the roadways are not congested. The Eco-CAC is not effective in low and mild congestion because the Eco-CAC controls may implement unnecessary controls on CAV vehicles and increase fuel consumption, travel time, total delay, stop delay, and CO2 emissions. The total delay was computed as the sum of delay across all vehicle trips that were completed within the simulation period compared with the free flow speed. The estimation of vehicle delay was computed each time step. The stopped delay was computed for all instances that a vehicle speed is less than or equal to 1 km/h.
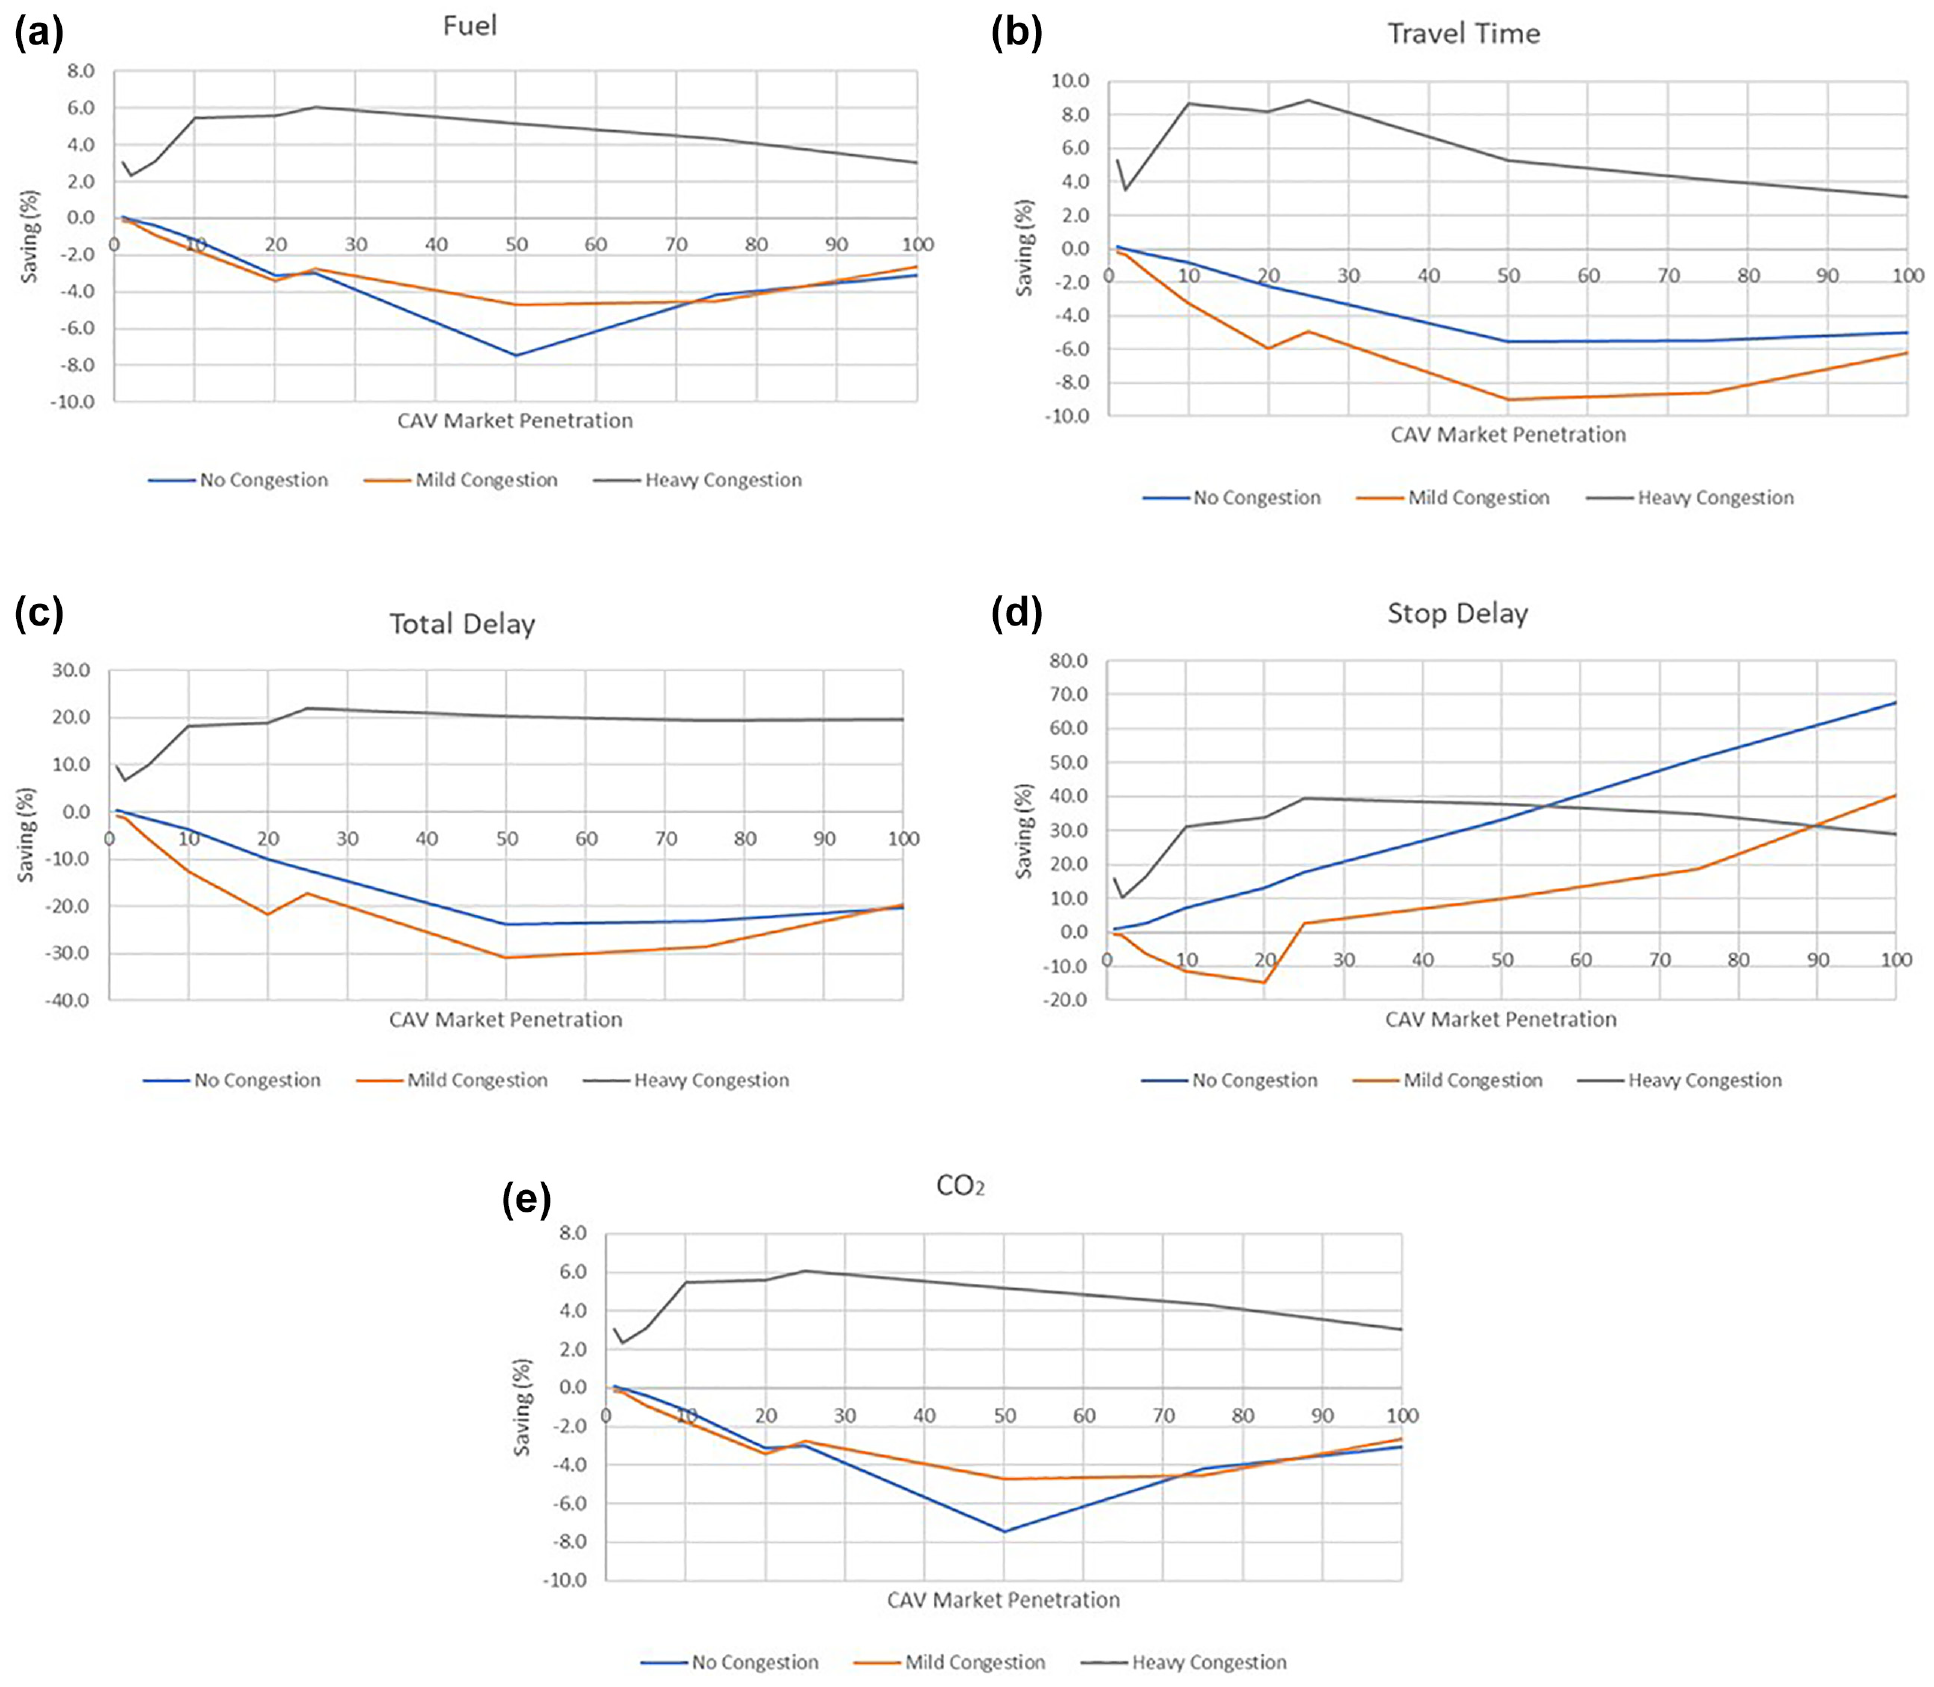
Eco-Cooperative Automated Control (ICEV Eco-CAC) results for different connected automated vehicle (CAV) market penetration and congestion levels: (a) ICEV fuel consumption, (b) ICEV travel time, (c) ICEV total delay, (d) ICEV stopped delay, and (e) ICEV CO2 emissions.
Figure 4 illustrates the impacts of the Eco-CAC system for BEVs compared with the base cases. The simulation results indicate that the Eco-CAC system significantly reduces the energy consumption of BEVs by up to 30.5%. The t-test produces a p-value of 0.000, indicating the energy savings of the Eco-CAC system are statistically significant. In particular, the Eco-CAC system can reduce BEV energy consumption for all congestion levels with all CAV MPR cases. The BEV energy savings increase as CAV MPRs increase. However, while the system marginally reduced travel time by up 3.9% (p-value < 0.01), total delay by up to 12.5% (p-value < 0.01), and stopped delay by up to 10.3% (p-value = 0.042) in heavily congested conditions, the Eco-CAC system mostly increased travel time, total delay, and stopped delay for BEVs for all congestion levels. These results are also statistically significant. The study found that the Eco-CAC system adversely affects travel time, total delay, and stopped delay for BEVs. It appears that BEVs utilize energy-efficient routes, which increases their travel time, total delay, and stopped delay. While the MO eco-routing focuses to reduce both energy consumption and travel time, the Eco-CAC system operates to minimize the energy consumption of the entire network. Thus, while BEVs utilize energy efficient routes, the system inevitably increased the travel time, total delay, and stopped delay of BEVs to reduce the energy consumption, in this study. Figure 3 does not include CO2 emission results, as we considered BEVs to be zero emission vehicles (ZEV). The study analyzed CO2 emissions produced during the vehicle operation mode without considering wall-to-tank analysis to include fuel/energy production, fuel/energy transport, and fuel/energy distribution. (The life-cycle assessment studies of greenhouse gas of BEV are found in Refs. 81–84.)
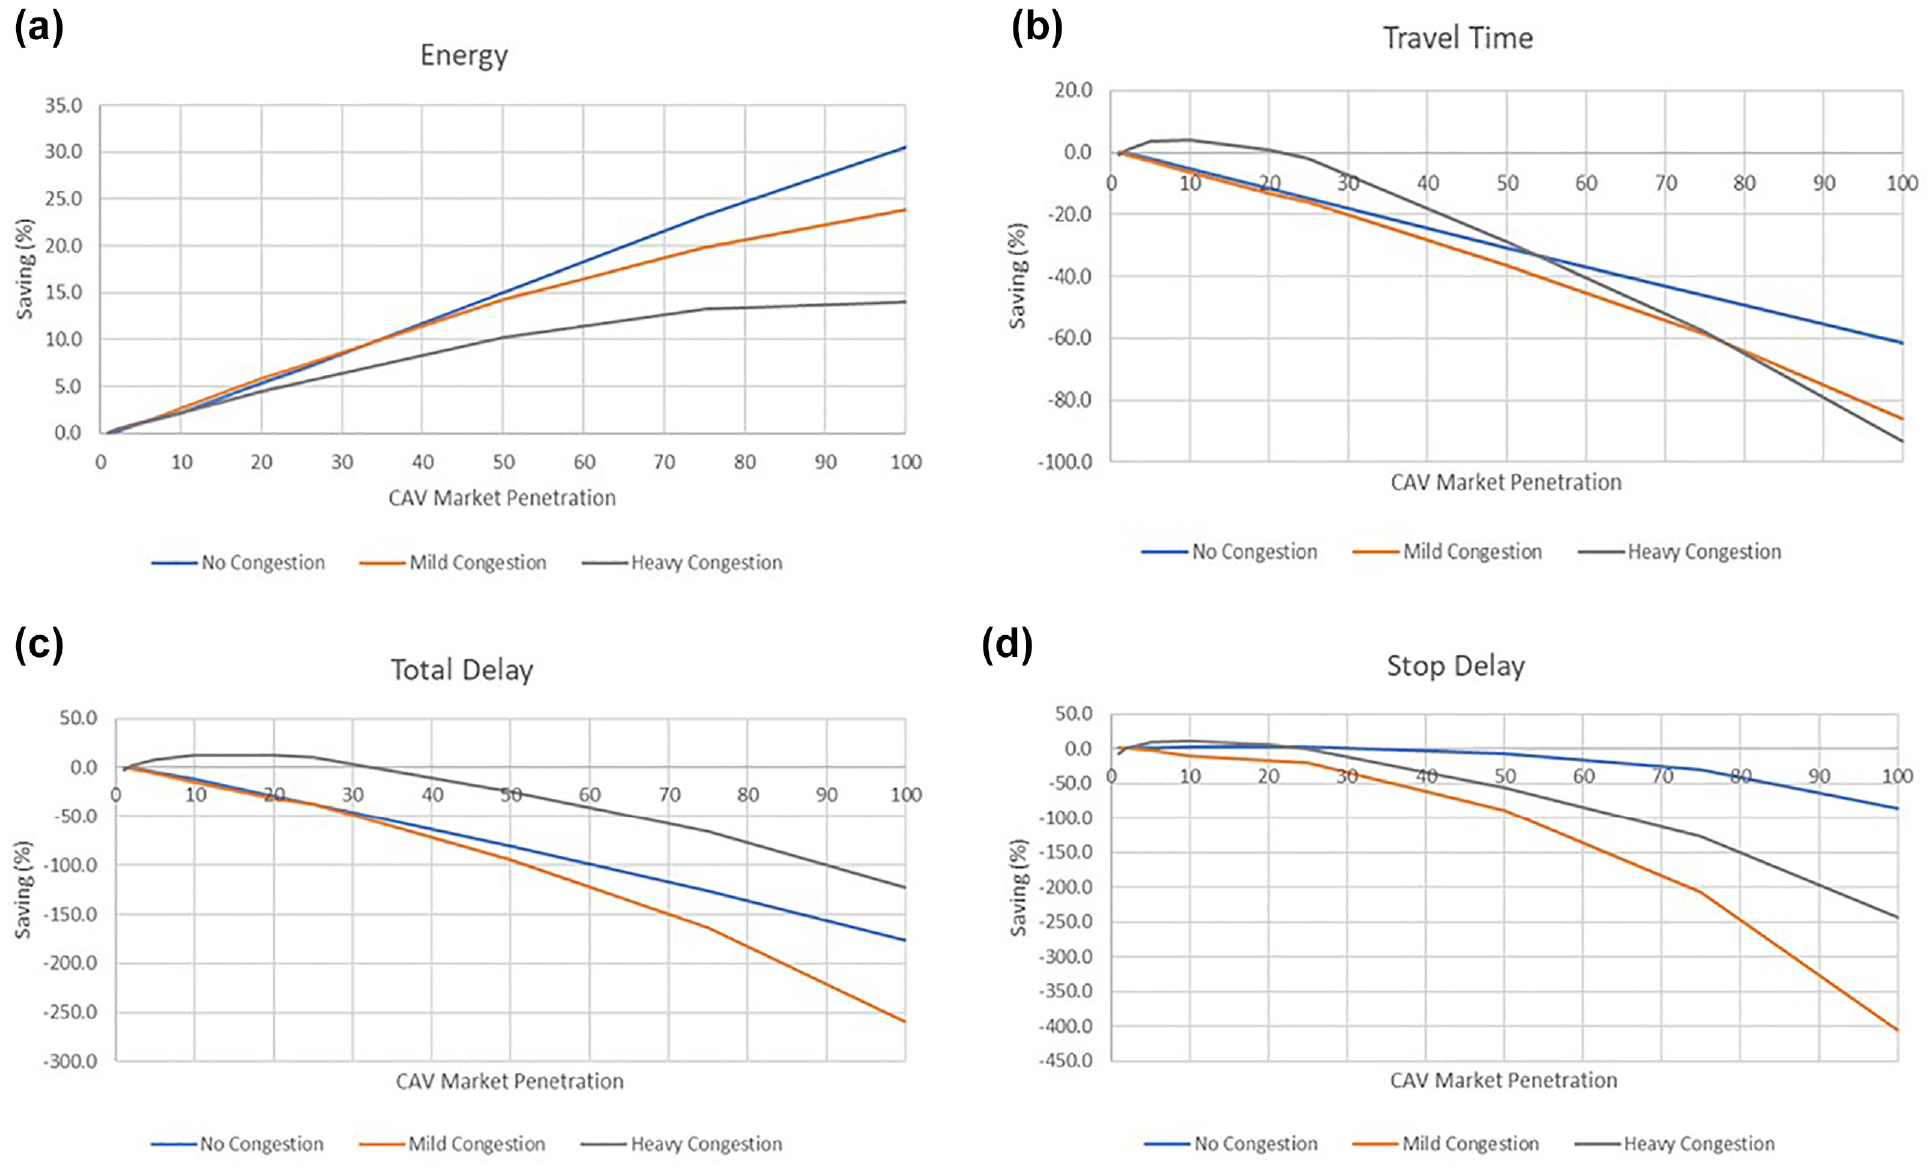
Battery-only electric vehicle (BEV) Eco-Cooperative Automated Control (Eco-CAC) results for different connected automated vehicle (CAV) market penetration and congestion levels: (a) BEV energy consumption, (b) BEV travel time, (c) BEV total delay, and (d) BEV stopped delay.
Figure 5 illustrates the impacts of the Eco-CAC system on fuel consumption, travel time, total delay, stopped delay, and CO2 emissions when HEVs are assigned to the LA network. Figure 4 shows that the Eco-CAC system generates very different results for HEVs compared ICEVs and BEVs. The study found that the Eco-CAC system improves HEV fuel efficiency by up to 4.1% (p-value < 0.01) in the mildly congested condition. For most cases, the Eco-CAC system does not significantly affect HEV fuel consumption in heavily congested conditions. The fuel savings produced by the Eco-CAC system increase as a CAV MPR increases for low and mildly congested conditions. Figure 4 also shows that the Eco-CAC system reduces travel time by up to 6.2% (p-value < 0.01) and total delay by up to 17.5% (p-value < 0.01) in heavily congested conditions. However, the simulation results show that the Eco-CAC system increases travel time and total delay in low and mildly congested conditions. The Eco-CAC system also reduces stopped delay for most cases. For low and mild congestion cases, the savings in stopped delay increase as CAV MPR increases. The maximum stopped delay savings of HEVs, 67.9% (p-value < 0.01), are observed at 100% CAV MPR and no congestion. The study also found that the Eco-CAC system reduces HEV CO2 emissions in low and mildly congested conditions, similar to the fuel consumption results.
Hybrid electric vehicle (HEV) Eco-Cooperative Automated Control (Eco-CAC) results for different connected automated vehicle (CAV) market penetration and congestion levels: (a) HEV fuel consumption, (b) HEV travel time, (c) HEV total delay, (d) HEV stopped delay, and (e) HEV CO2 emissions.
ECO-CAC Simulation Using Composite Vehicle Types
The study constructed two vehicle compositions to represent the current and future vehicle compositions of the LA network. The current vehicle composition of 86.8% ICEVs, 7.7% BEVs, and 5.5% HEVs was constructed based on 2019 vehicle sales data in California ( 85 ). In addition, we used a future vehicle composition of 50% ICEVs, 30% BEVs, and 20% HEVs based on future EV sales forecast data ( 86 ). We assigned CAVs to BEVs, HEVs, and ICEVs in order. For example, 50% CAV MPR consists of 30% CAV BEVs, 20% CAV HEVs, and 50% non-CAV ICEVs for the future vehicle composition scenario.
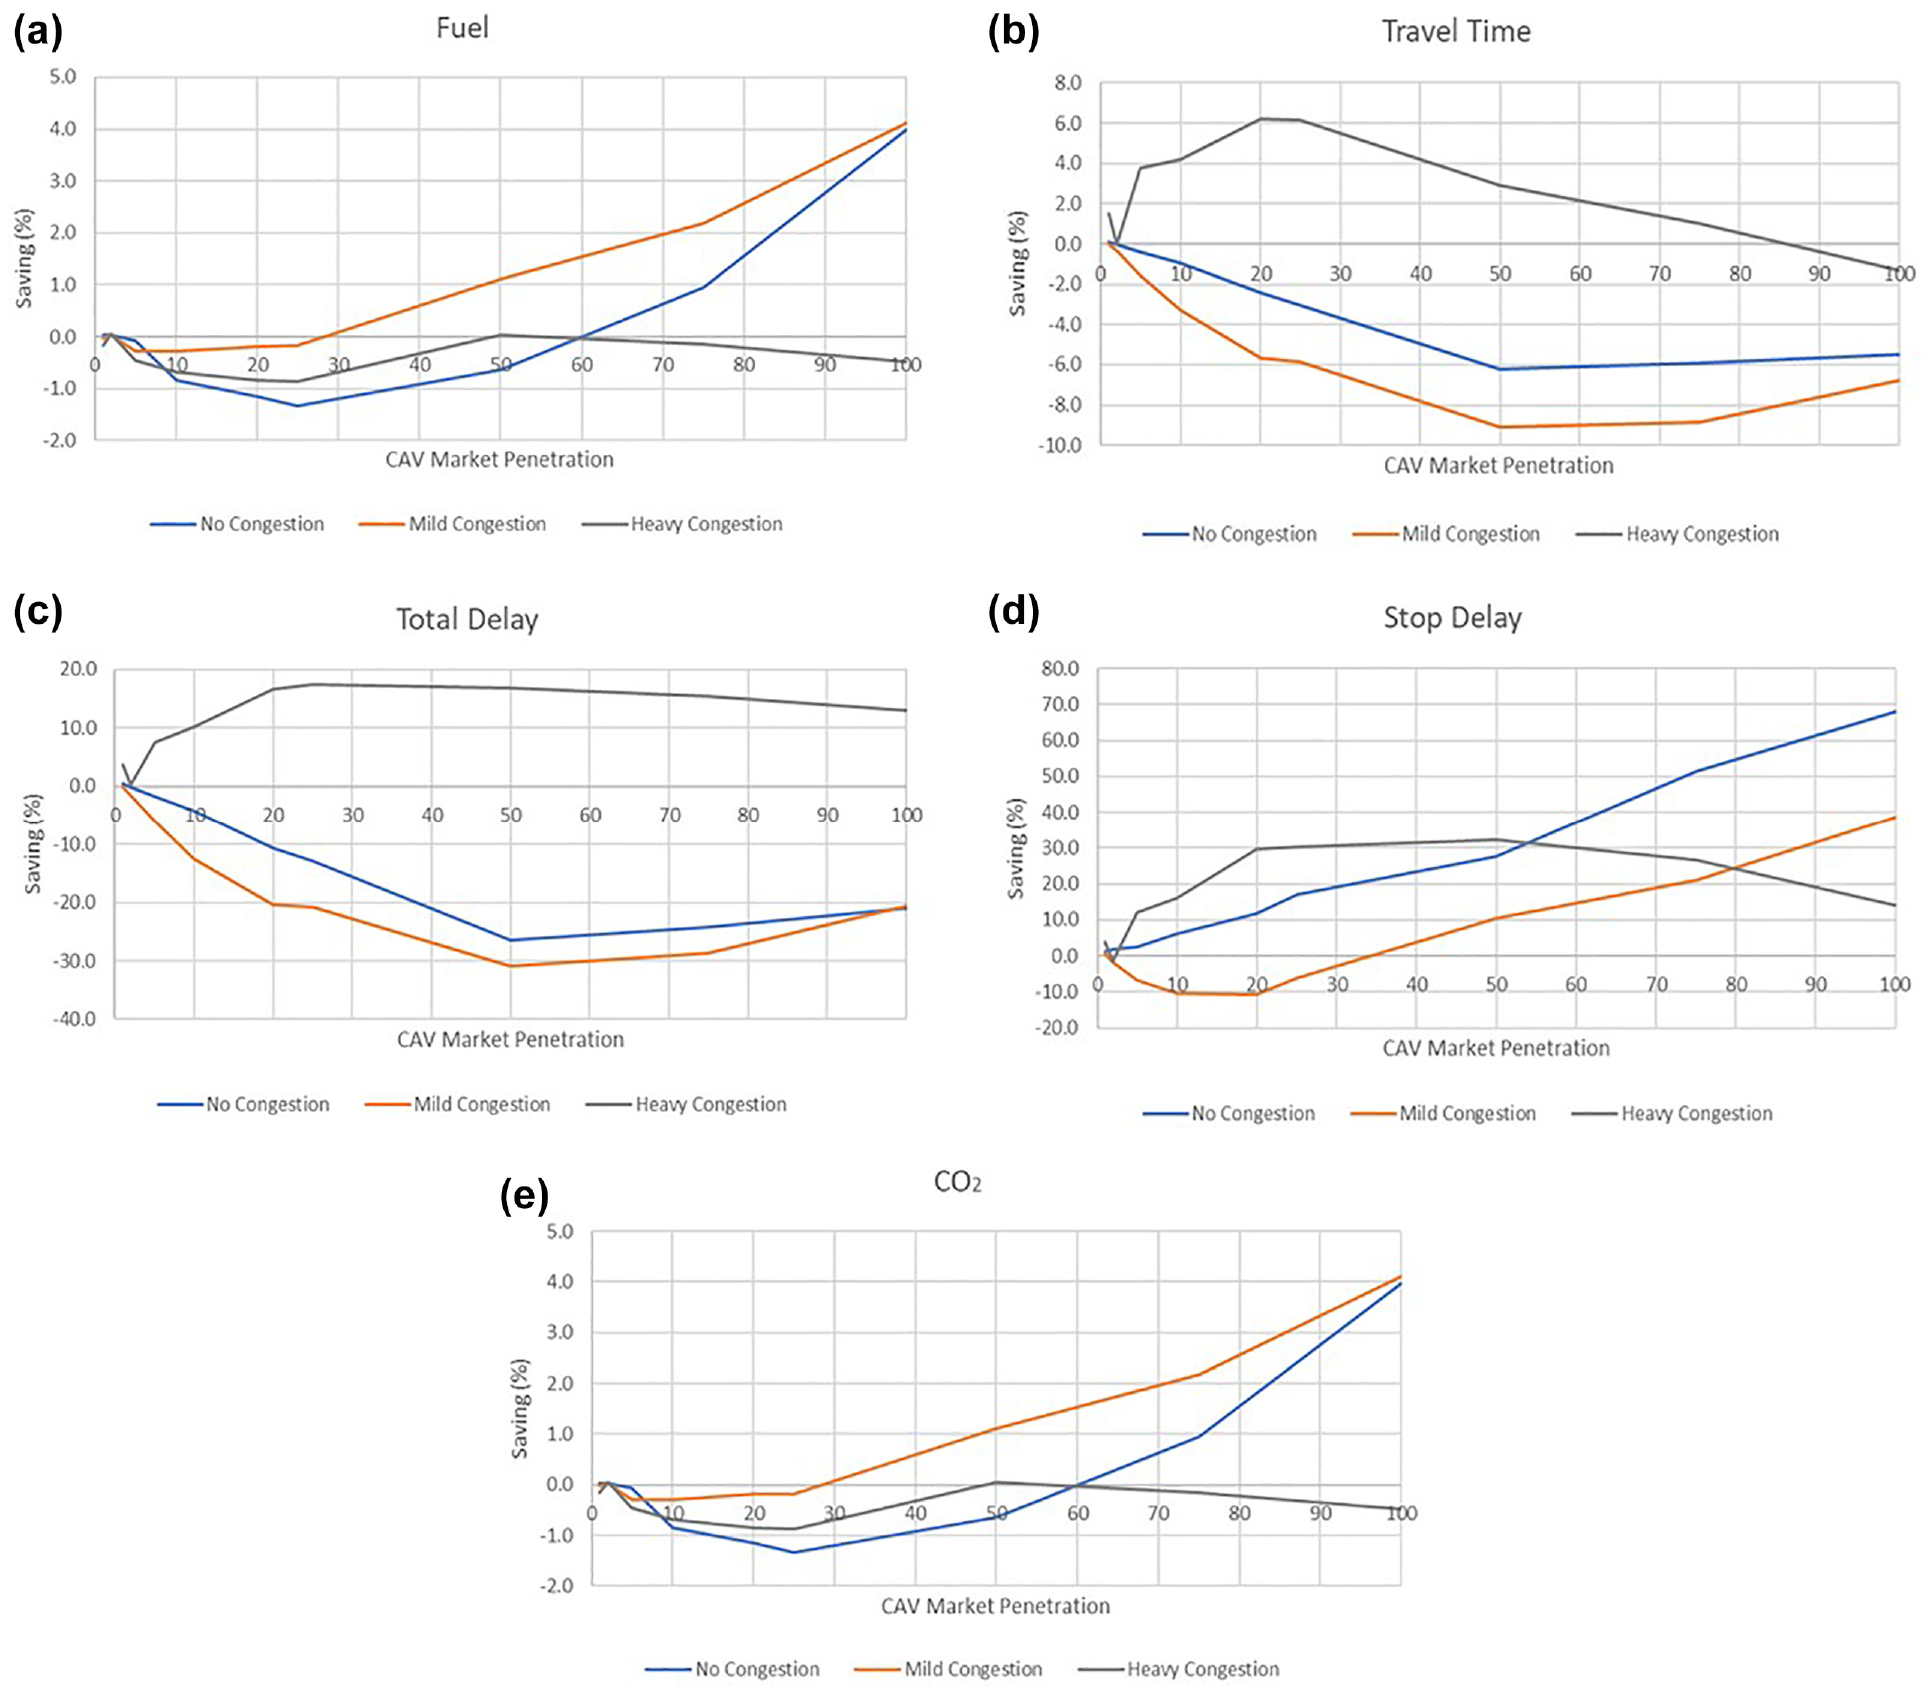
Figure 6 illustrates the impacts of the Eco-CAC system with the current vehicle composition scenario. The simulation results show that ICEVs and HEVs can experience fuel consumption savings of up to 5.4% (p-value < 0.01) at a 25% CAV MPR in heavily congested conditions, and BEVs can experience energy savings of up to 36.9% (p-value < 0.01) at a 10% CAV MPR in mildly congested conditions. We performed t-tests and found the benefits of the Eco-CAC system are statistically significant. Figure 5 shows that the impacts of the Eco-CAC system on fuel consumption and BEV energy consumption are considerably different on the same LA network. The Eco-CAC system reduces the fuel consumption of ICEVs and HEVs in heavily congested conditions but increases the fuel consumption in low and mildly congested conditions. For BEVs, the Eco-CAC system reduces energy consumption in all congestion levels, and the energy savings patterns of different congestion levels are almost identical. The simulation results also show that the Eco-CAC system reduces the average travel time by up to 7.3% (p-value < 0.01) and total delay by up to 22.2% (p-value < 0.01) at a 25% CAV MPR in heavily congested conditions. However, the study found that the Eco-CAC system negatively affects travel time and total delay in low and mildly congested conditions. Figure 5 also shows that the Eco-CAC system effectively saves the stopped delay for vehicles in the LA network. In particular, the Eco-CAC system reduces stopped delay for all congestion levels, and the maximum stopped delay savings of 62.2% (p-value < 0.01) are observed at a 100% CAV MPR with no congestion. Figure 5 also shows that the Eco-CAC system reduces CO2 emissions in heavily congested conditions, similar to the results of fuel consumption.
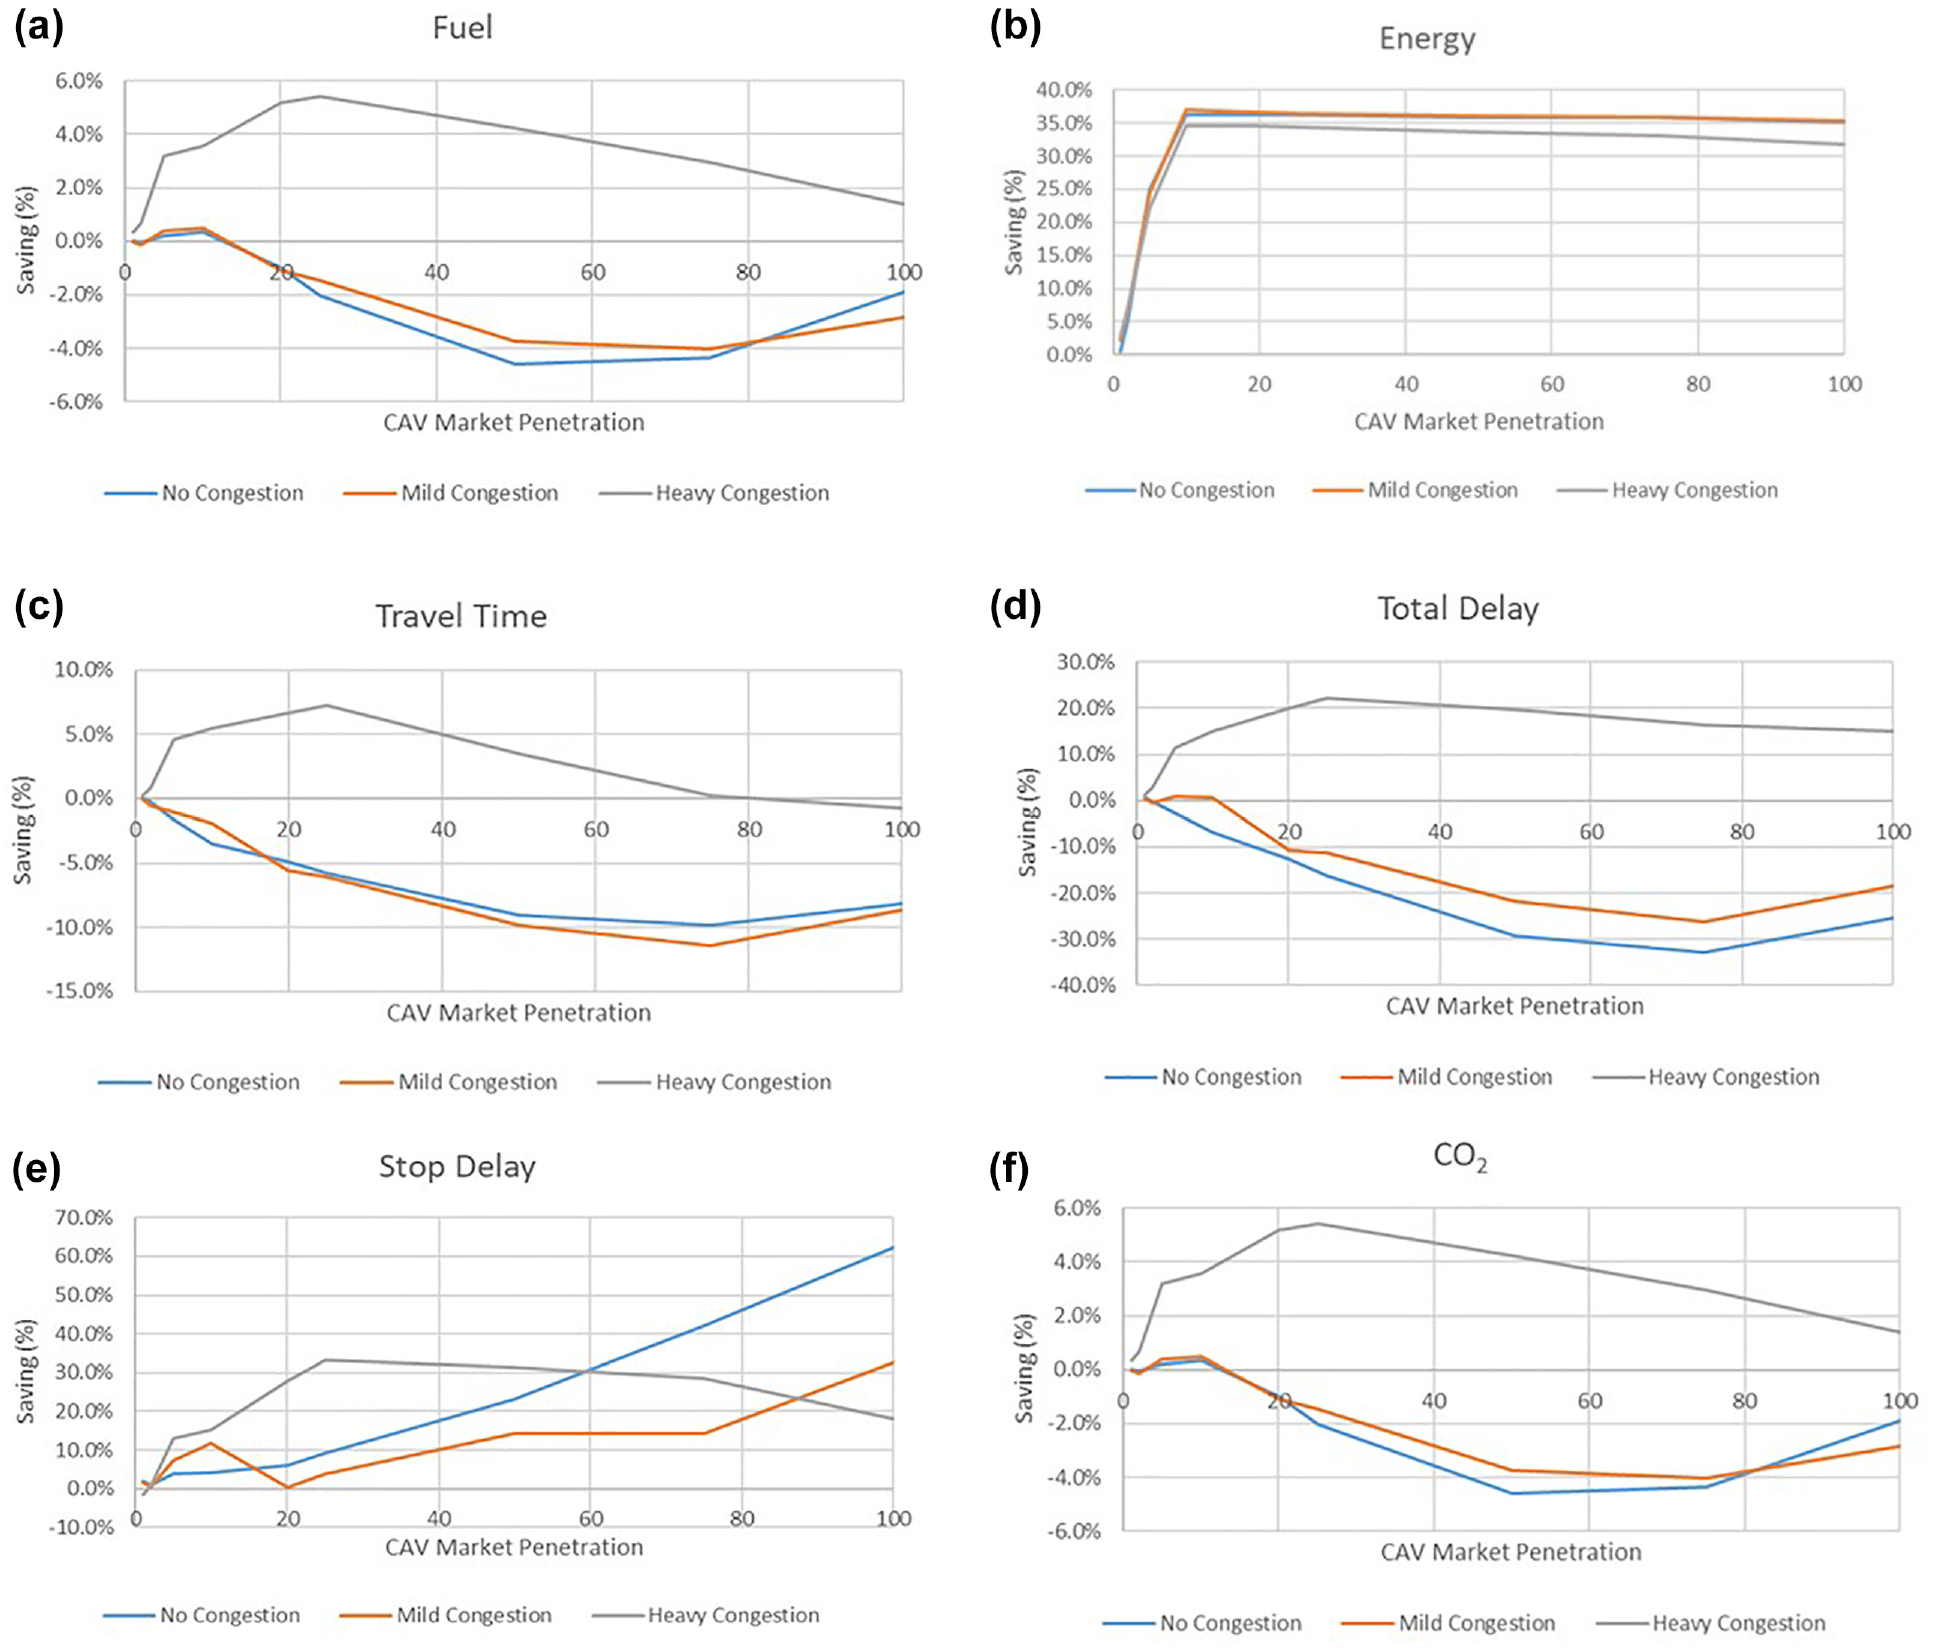
Eco-Cooperative Automated Control (Eco-CAC) results for different connected automated vehicle (CAV) market penetration and congestion levels with current vehicle composition: (a) Fuel consumption, (b) Energy consumption, (c) Travel time, (d) Total delay, (e) Stopped delay, and (f) CO2 emissions.
Figure 7 illustrates the impacts of the Eco-CAC system for the future vehicle composition scenario, which includes 50% ICEVs, 30% BEVs, and 20% HEVs on the LA network. Figure 6 shows that a different vehicle composition produces different impacts on the same network. In particular, the Eco-CAC system reduces the network fuel consumption by up to 6.3% (p-value < 0.01) at a 25% CAV MPR in heavily congested conditions. In addition, the system reduces fuel consumption by up to 1.7% in mildly congested conditions, which is different from the current vehicle composition results, where the Eco-CAC system increases fuel consumption for mild congestion. The results show that the Eco-CAC system reduces BEV energy consumption by up to 35.5% (p-value < 0.01) at a 50% CAV MPR with no congestion. The figure demonstrates that the Eco-CAC system effectively reduces BEV energy consumption by more than 5% compared with the base case for all congestion levels when the CAV MPR is greater than 10%. Figure 6 shows that the Eco-CAC system reduces travel time in some heavily congested cases and increases travel time in no congestion and mild congestion cases. In heavily congested conditions, the Eco-CAC system increases travel time when the CAV MPR is greater than 60% compared with the base case. The Eco-CAC system also reduces the total delay in heavily congested conditions but increases it during the no congestion and mild congestion conditions. Figure 6 also shows that the Eco-CAC system mostly reduces stopped delay at all congestion levels. The results demonstrate that the Eco-CAC system reduces stopped delay by up to 44.3% (p-value < 0.01) at a 100% CAV MPR in the no congestion case.
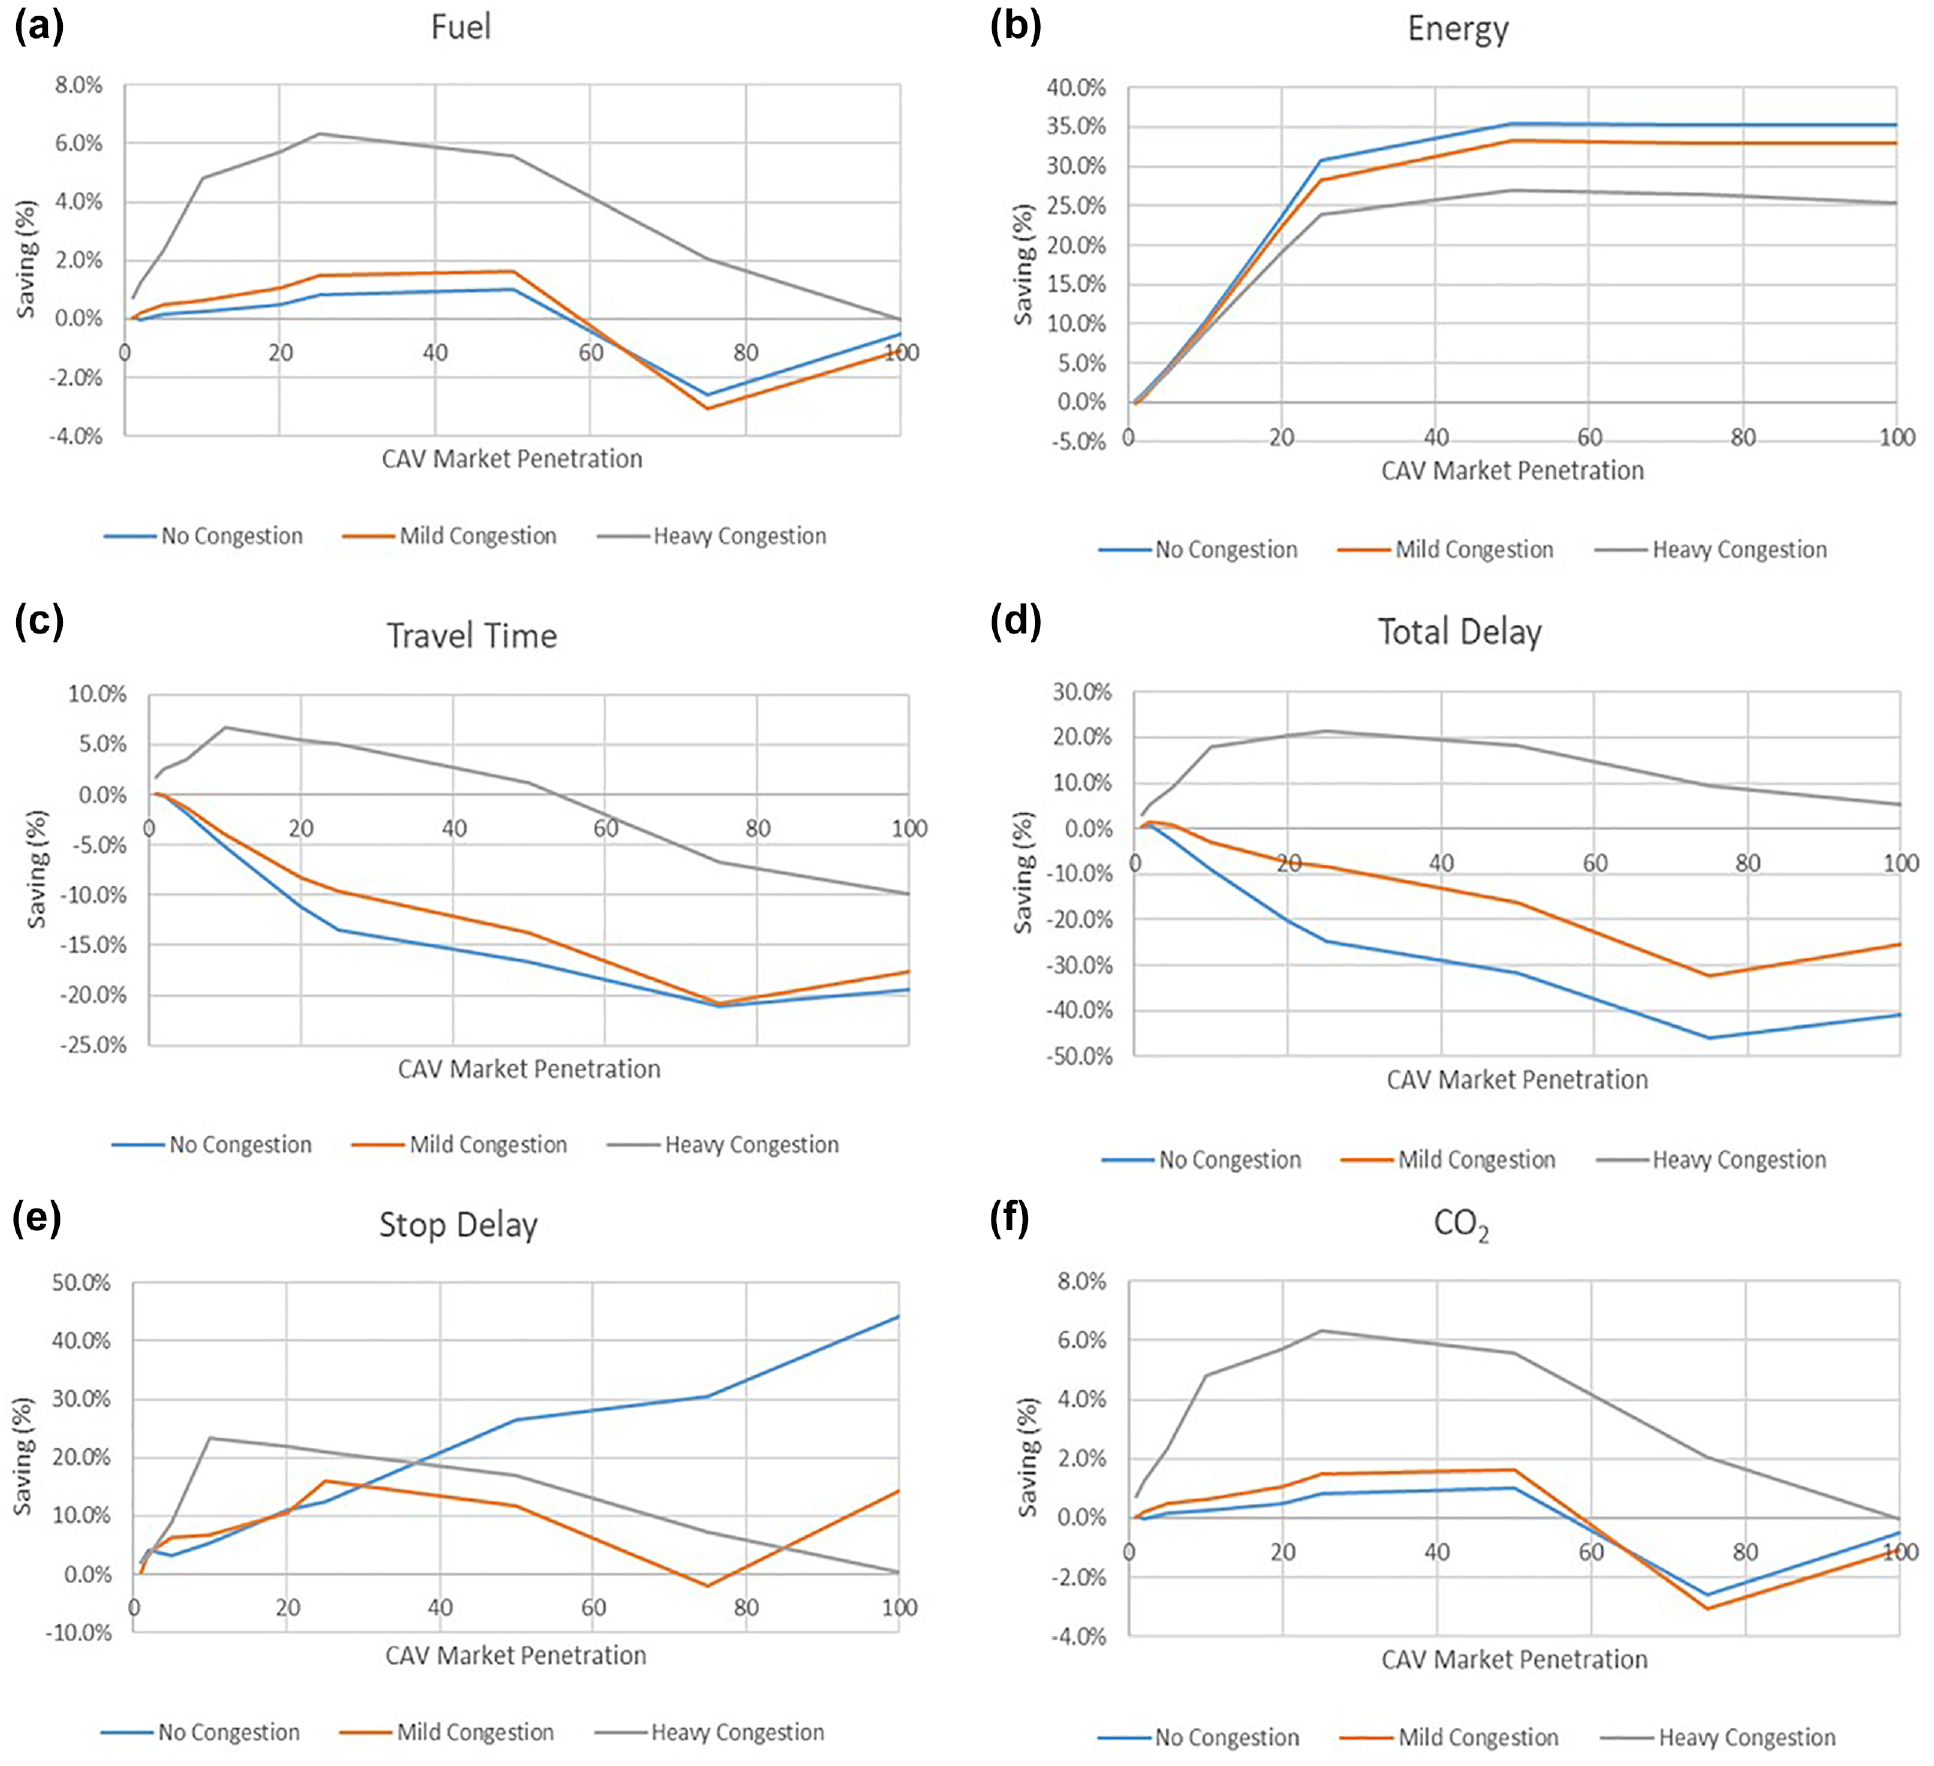
Eco-Cooperative Automated Control (Eco-CAC) results for different connected automatic vehicle (CAV) market penetration and congestion levels with future vehicle composition: (a) Fuel consumption, (b) Energy consumption, (c) Travel time, (d) Total delay, (e) Stopped delay, and (f) CO2 emissions.
Conclusions
The study evaluated the Eco-CAC system that integrates vehicle control strategies with CAV applications. Specifically, the Eco-CAC system includes an eco-router, an SPD-HARM controller, an Eco-CACC-I controller, and an Eco-CACC-U controller. The Eco-CAC system was implemented and tested using the INTEGRATION software on the LA network for three different demand levels: no congestion, mild congestion, and heavy congestion.
The simulation study found that the Eco-CAC system reduces fuel consumption by up to 16.8%, energy consumption by up to 36.9%, travel time by up to 21.7%, total delay by up to 43.1%, stopped delay by up to 68.7%, and CO2 emissions by up to 16.8%. The study found that different vehicle types generate different benefits. For example, the Eco-CAC system reduces fuel consumption, travel time, total delay, stopped delay, and CO2 emissions for ICEVs in heavily congested conditions. However, the controllers negatively affect ICEV fuel consumption, travel time, total delay, stopped delay, and CO2 emissions for no or mild congestion. Consequently, we recommend that the system only be activated on this test network when congestion occurs. For BEVs, we found that the impacts of the controllers are different from those for ICEVs. In particular, the Eco-CAC system improves the energy consumption but negatively affects travel time, total delay, and stopped delay for all congestion levels.
The study also tested the Eco-CAC system considering current and future vehicle composition on the LA network. The study found that the Eco-CAC system effectively reduces fuel and energy consumption, travel time, total delay, and stopped delay in heavily congested conditions for both vehicle compositions. However, we found that different vehicle compositions produce different results. Specifically, the maximum energy consumption savings of BEVs (36.9% saving) for the current vehicle composition were observed at a 10% CAV MPR in mild congestion, while the maximum savings for the future vehicle composition (35.5%) were observed at a 50% CAV MPR with no congestion. In relation to the travel time, the maximum travel time savings were observed at 25% and 10% CAV MPRs in heavy congestion for current and future vehicle compositions, respectively. The study found that the developed Eco-CAC system effectively reduces the fuel and energy consumption, travel time, total delay, stopped delay, and CO2 emissions for ICEVs, BEVs, and HEVs for specific scenarios. The effectiveness of the Eco-CAC system and the controllers depends on the traffic conditions, including the level of traffic congestion, the network configuration, the CAV MPR, and the vehicle composition. In particular, the Eco-CAC system increases fuel and energy consumption, travel time, total delay, and stopped delay in some study scenarios based on the combinations of vehicle types, CAV MPRs, and congestion levels. We found that the Eco-CAC system maximizes the benefits between 15% to 40% CAV MPR. While the Eco-CAC system reduces fuel and energy consumption, total delay, stopped delay, and CO2 emissions, we found the Eco-CAC system is not effective at a 100% CAV MPR because the Eco-CAC controls may create unnecessary controls on CAV vehicles and reduce the overall performance.
As is often the case with similar studies, further research is warranted. Specifically, we recommend a further study that investigates the optimum coefficients for the developed controllers that can reduce fuel/energy consumption and travel time considering different combinations of controllers, various vehicle types, CAV MPRs, different congestion levels, and different network configurations. We also recommend performing a small-scale field test to evaluate the feasibility of the developed Eco-CAC system. We expect that the Eco-CAC system can significantly save fuel/energy consumption and reduce travel time and delays on urban networks.
Footnotes
Acknowledgements
The authors acknowledge the following researchers who developed different components of the Eco-CAC system: Hao Chen, Hossam Abdelghaffar, Youssef Bichiou, Karim Fadhloun, Maha Elouni, and Ihab El-Shawarby.
Author Contributions
The authors confirm contributions to the paper as follows: study conception and design: K. Ahn, H. Rakha; data collection: K. Ahn; analysis and interpretation of results: K. Ahn, J. Du, M. Farag, H. Rakha; draft manuscript preparation: K. Ahn, H. Rakha. All authors reviewed the results and approved the final version of the manuscript.
Declaration of Conflicting Interests
The author(s) declared no potential conflicts of interest with respect to the research, authorship, and/or publication of this article.
Funding
The author(s) disclosed receipt of the following financial support for the research, authorship, and/or publication of this article: This work was funded by the Department of Energy through the Office of Energy Efficiency and Renewable Energy (EERE), Vehicle Technologies Office, Energy Efficient Mobility Systems Program under award number DE-EE0008209.