
Abstract
When bus priority control is implemented, if there is a bus station between upstream detector and downstream signalized intersection, it will lead to the unpredictability of bus dwell time caused by the stochastic number of passengers waiting at the station. This uncertainty means that the bus’s arrival time at the intersection cannot be predicted quite accurately. Therefore, the signal priority control strategy made in advance may fail, which brings about a negative impact on the operation for both buses and cars at the intersection. To solve this problem, this paper proposes a two-stage transit signal priority (TTSP) control method. The first stage is robust optimal signal control (ROC) and aims to minimize bus delay expectation and variance. Bus delay expectation and variance calculation models considering the uncertainty of bus dwell time and the uncertainty of buses in line ahead in an exclusive bus lane are proposed based on mathematical statistics theory to formulate the stochastic process of bus operation. However, extreme situations cannot be avoided by the first-stage control completely. To make up for the deficiency of ROC, this paper adds the second-level real-time priority control, which is enabled in the case of the first-stage control failure to ensure the priority of public transit. The simulation test results show that the proposed TTSP method preforms better in reducing bus delay expectation, from 9.2 s to 3.2 s, reaching 65.2%. In addition, bus delay standard deviation decreases from 8.3 s to 3.9 s by 53.1%, improving the reliability of bus operation.
Keywords
Transit signal priority (TSP) was first proposed by Salter and Shahi ( 1 ), and it has been applied to give buses signal priority ( 2 ) by changing the signal timing at intersections. A control method ( 3 ) called conditional signal priority (CSP) plays an important role in improving large headways by giving signal priority to buses arriving later than schedule. Therefore, it is essential to obtain precise traffic data like bus arrival time during their dynamic running for CSP, which determines the effectiveness of signal optimal directly. In fact, some devices to collect traffic data, such as global positioning system (GPS) and automatic vehicle location (AVL), can offer dynamic traffic information for bus signal priority control. Many dynamic control methods have been proposed based on real-time data ( 4 – 8 ).
Bus travel time and passengers’ demand are usually regarded as constant values in most literature related to dynamic control ( 9 – 12 ). They do not take into full consideration the stochastic factors of the buses operation process when the control system generates the optimal control plan. Stochastic factors are the main reason leading to large bus headway or bus bunching, which should be taken into account when making the TSP control plan. In other words, the extension of considering stochastic factors not only decides the effectiveness of signal priority plan but also influences the feasibility of the control plan in reality ( 13 ). Therefore, it is necessary to consider the bus running as a random process especially in signal optimal control. To solve these problems, different signal priority control methods considering the random process of buses running ( 14 ) have been developed. In these studies, some main factors, such as bus dwell time at stations and delay at intersection, are considered in the bus travelling process. However, verification of validation and analysis of robustness for the method are often ignored. Robustness and reliability play important roles in relation to improving bus service. Therefore, to achieve robust optimal signal control (ROC) for buses, this paper proposes a two-stage transit signal priority (TTSP) control method to analyze both randomness and robustness in the bus operation process.
Bus bunching is a serious problem in the process of bus operation, in that bus headway is chaos leading to low public transit service level. The concept of bus bunching was proposed by Newell and Potts ( 15 ). Bus bunching may bring many negative influences for bus systems, such as longer passenger waiting times and unreliable service. To reduce bus bunching and balance headways, many methods have appeared in bunching research. These methods can be divided into two categories: (a) station control, like bus holding ( 16 – 21 ), skipping ( 22 ), and injection ( 23 ), and (ii) inter-station control, like signal control ( 24 – 30 ) and speed control ( 31 – 33 ).
Bus holding is always used to prevent buses from bunching ( 16 – 19 ) by lengthening its forward headway in station control. However, it works only when buses arrive earlier than scheduled. At the same time, holding balances bus headways at the cost of increasing bus travel time and decreasing the effectiveness of bus running ( 34 ). Different from bus holding, CSP strategies overcome the barriers in holding and offer a priority opportunity for buses arriving later than scheduled by applying them to the bus with a large headway ( 35 – 37 ).
In recent years, more advanced detectors and technologies have been introduced to the public transit system, and so more real time data can be collected for decision support for the bus control plan. They can achieve dynamic data updates of running buses easily and accurately. Dynamic control methods are proposed based on feedback from detectors ( 35 – 38 ). However, these studies focus on the control effectivity of signal priority and ignore stochastic factors in bus running, causing deviation between reality and simulation ( 34 ). To improve the effectiveness of CSP, some scholars have predicted the time buses arrive at intersections by taking full advantage of detecting technology and considering stochastic process of bus operation ( 26 – 28 ). Truong et al. ( 26 ) coordinated road space priority and TSP in random bus lines and compared the control effects between a coordinated method and a single method at an intersection. Zeng et al. ( 28 ) constructed a dynamic signal priority control model and proved the effectiveness of their method under stochastic environment. Truong et al. ( 13 ) used GPS to detect the bus running time from an intersection upstream and proposed an advanced signal priority control method considering the stochastic factors in bus operation and establishing a model to calculate the total bus delay expectation. At the same time, many studies still stress the analysis of optimal effects ( 8 – 13 ).
TSP approaches bring better effects by regarding bus running as a stochastic process, which is closer to a real scenario. However, most methods focus on the analysis of optimal control effectiveness and ignore the robustness of the control process. Although verification of models and analysis of approaches are important for bus system optimization, ensuring the stability of optimal plans is an essential aspect. Few researchers have studied the robustness of optimal methods ( 32 – 34 ). While it is a pity that the objective function does not refer to the robustness in their method. Anderson and Daganzo ( 34 ) compared priority robustness in diverse control methods, such as no control, CSP control, and TSP control. Chow et al. ( 30 ) proposed multi-objective optimal control formulation for bus service reliability with traffic signals, which aimed to obtain the optimum robustness of the bus service and took a sensitivity analysis of key traffic parameters. Fonzone et al. ( 39 ) considered bus dwell time at the station in a stochastic environment but ignored uncertain delays at intersections.
In the previous related research works, the random process is usually described as a certain random distribution directly using the data collected, without analysis of the bus running process influenced by multiple factors insight. In addition, the Monte Carlo method is usually borrowed as a computer-based approach to solve an ROC problem. Although this kind of method can help to establish the optimal solution with a mount of simulations, it requires much time, which is not suitable to be used in a real-time scenario. Therefore, this paper mainly deals with the bus operation priority control, when the bus is late, considering the random process of bus running between the vehicle detector and the signalized intersection. The bus running random process mainly involves the bus dwell time and the queue length in an exclusive bus lane at the intersection, which is formulated based on the space–time analysis of bus operation. Furthermore, a ROC method is proposed to improve the bus delay expectation and deviation. In addition, to further enhance this method, a final-version TTSP is proposed to fix the conditions that the first-stage control method (ROC) failed, when the bus has arrived at the intersection during red time. The main contributions can be summarized as follows:
Considering a stochastic process of bus operation in real scenarios, the stochastic process is described and modeled according to the interaction mechanism of two stochastic factors in bus operation process: the uncertainty of number of passengers waiting at a bus stop and queue length of buses in an exclusive bus lane.
At the method level, this paper mainly proposes two versions of control methods, which are the control methods based on the concept of robust optimization and the two-stage optimization control method combining ROC and dynamic optimization control. The proposed methods can improve the bus delay and develop the success rate of bus priority at intersection.
The methods proposed in this paper are systematically tested in relation to correctness, effectiveness, and best range of application based on contrastive analysis, which can give guidance in engineering practice.
The remainder of this paper is organized as follows. The second section describes the problem to be solved and lists the assumptions about the mathematical models formulated in this paper. The third section shows the establishment process of bus delay expectation and variance calculation models at an intersection. The solution of the optimal control scheme is presented in the fourth section. The fifth section gives an analysis of the simulation results under various control methods followed by the effectiveness and robustness analysis of TTSP. Finally, the sixth section presents some conclusions, including a simulation analysis and limitations of the TTSP control method, which can give some directions for future studies.
Problem Description and Assumption
Problem Description
In common bus priority control, the bus detector is set upstream of the bus station to give enough time for adjusting signal timing. When the vehicle detector finds a bus, the priority control scheme for bus is determined by predicting time bus arriving at the signalized intersection. However, some bus stops are located near signalized intersections, between the detector and the signalized intersection. Because of the uncertainty of passenger numbers getting on and off at the bus stop, the time of the bus arriving at the signalized intersection cannot be accurately predicted. Therefore, this paper formulates a first-level optimal control method based on the idea of robust optimization to improve the success rate of bus priority. However, the first-stage control as an ROC method may still fail. Therefore, this paper adds the detector2 near the signalized intersection shown in Figure 1 to detect bus queue length and bus arrival time. These data from detector2 can reflect in real time whether the first-stage control was successful—that is, whether the bus passed the intersection during green time or with minimal delay. If the first-level control works little or even fails, the second-stage control as a remedial measure is activated so that the bus can pass the intersection as quickly as possible.
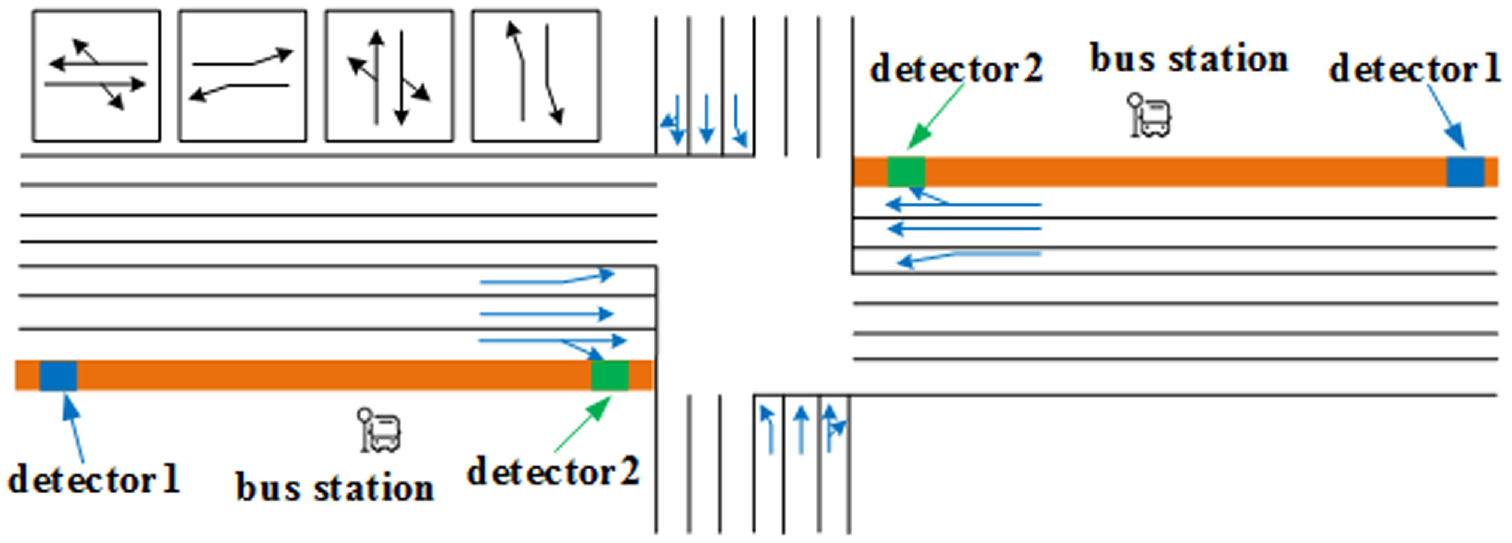
Control scene setting.
Assumptions
This paper deals with the bus priority problem at a single intersection with bus lanes. To establish the bus delay expectation and variance calculation models, the assumptions are as follows:
Buses run in an exclusive bus lane that is located on a trunk road.
The traffic flow at the signalized intersection is unsaturated.
Information, including time bus arrives at detector and bus queue length on bus lane, is kept well updated.
There is no conflict between bus priority requests at the intersection.
Bus Delay Expectation and Variance Calculation Model
As mentioned in problem description, the first-stage control method aims to improve the bus operation efficiency and reliability at the signalized intersection. The index of bus delay represents the bus operation efficiency at the intersection, while the bus delay variance reflects the robustness of the control method. Therefore, the bus delay expectation and variance are the core parameters of the first-stage control model. It is necessary to construct the calculation models of bus delay expectation and variance.
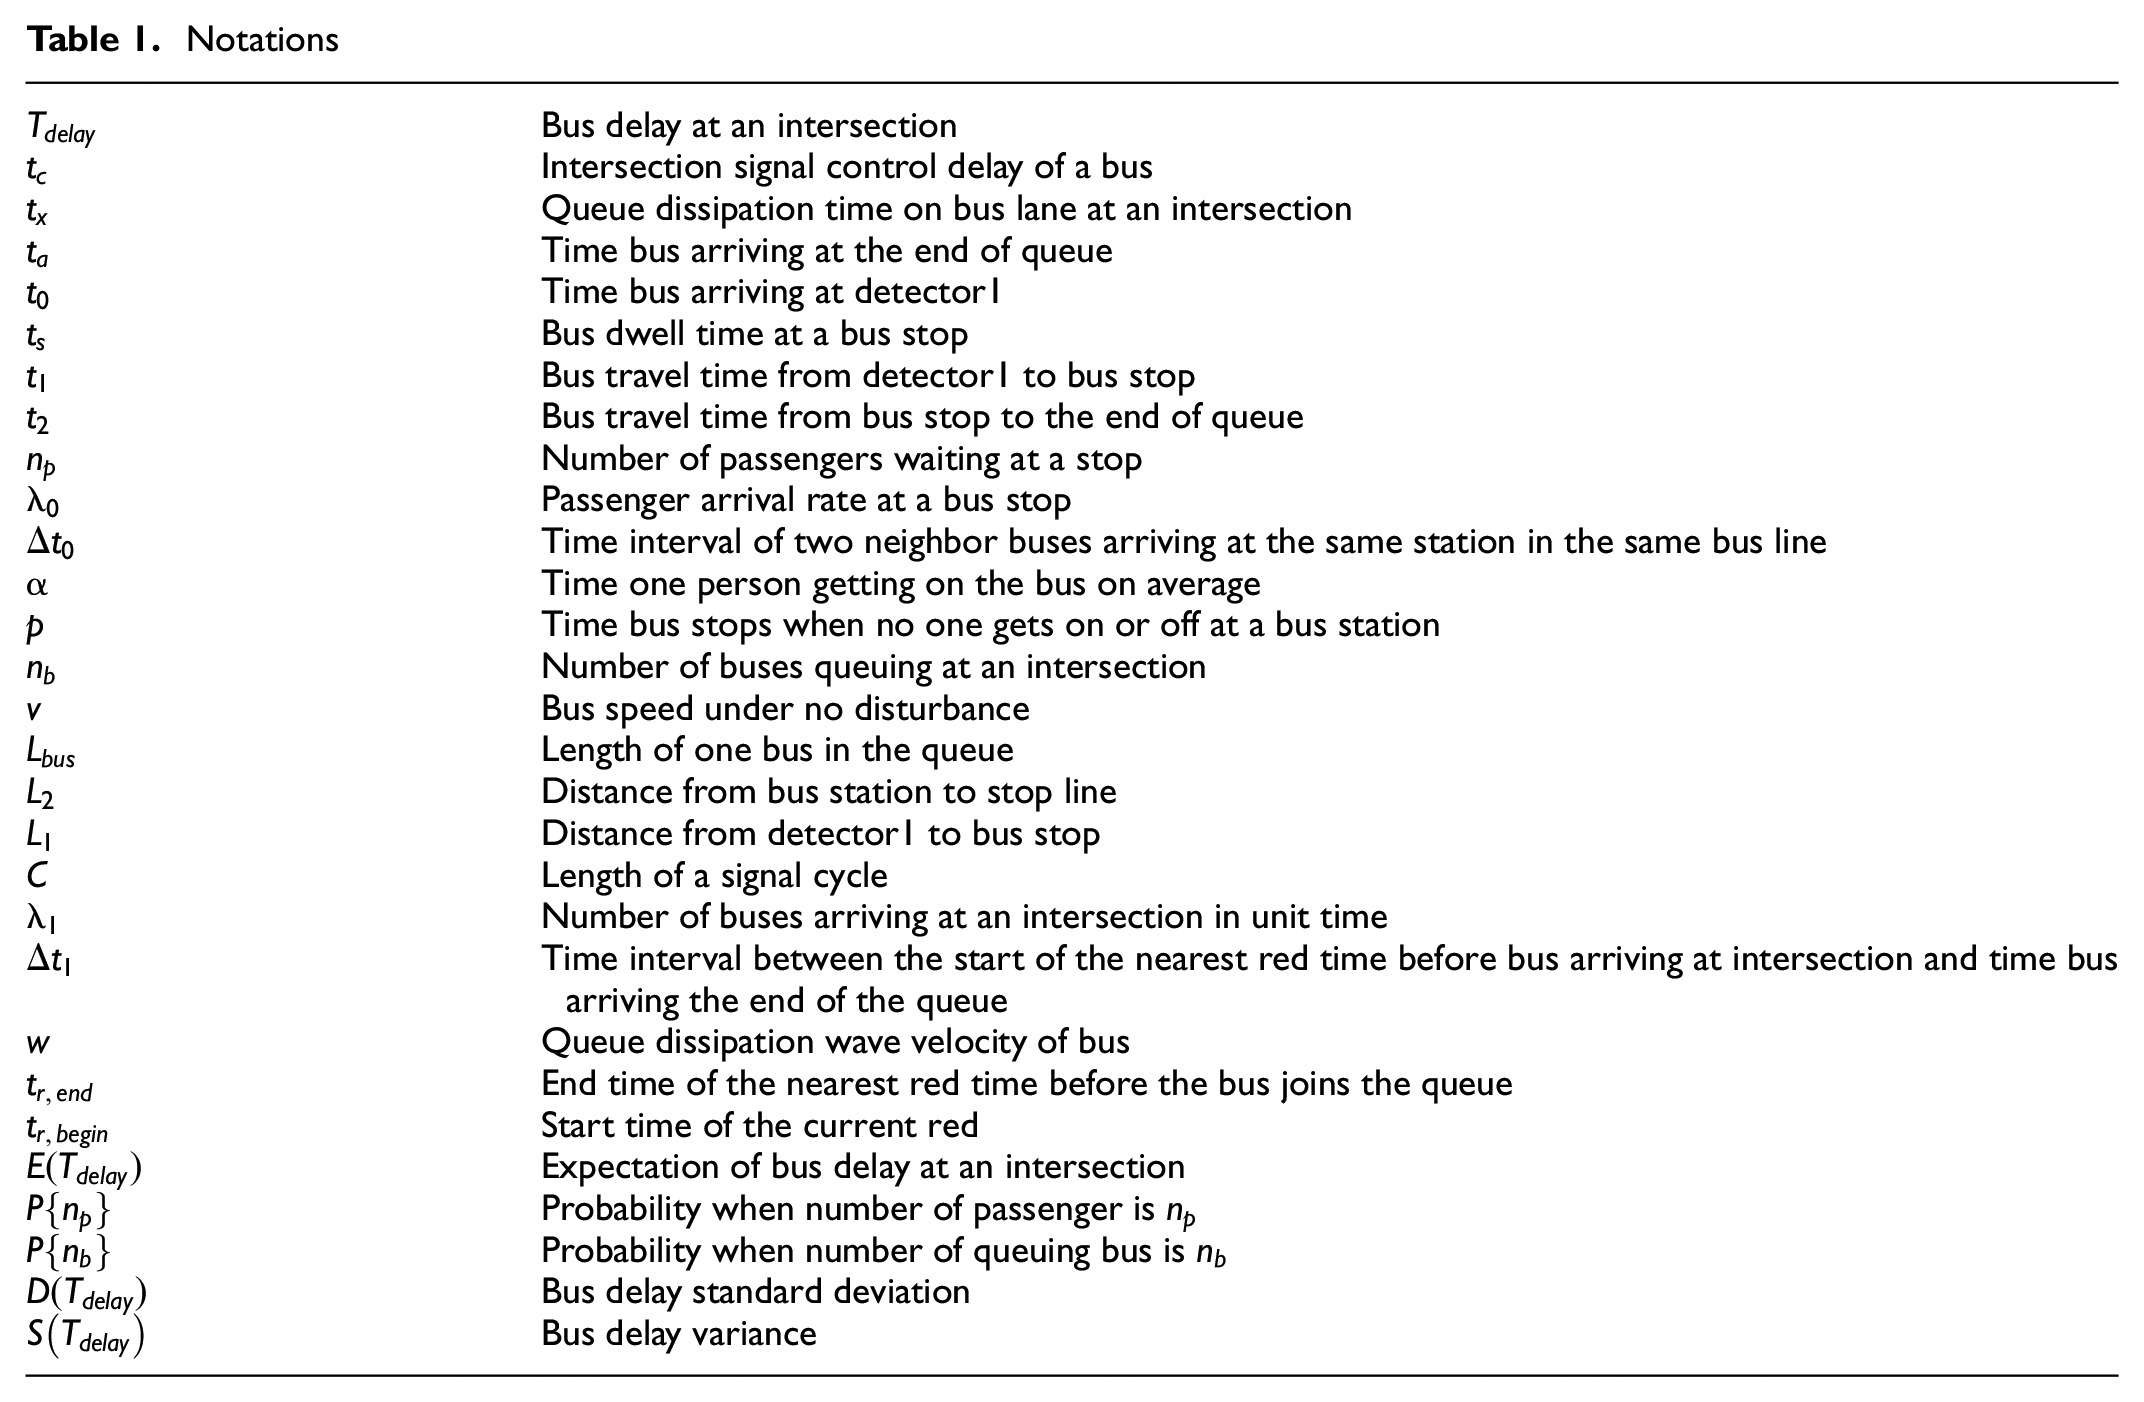
Notation
The notations used in the mathematical models of this paper are concluded in Table 1.
Notations
Bus Delay Expectation Calculation Model
The bus delay

The first part is calculated by the time bus arriving at the end of the queue
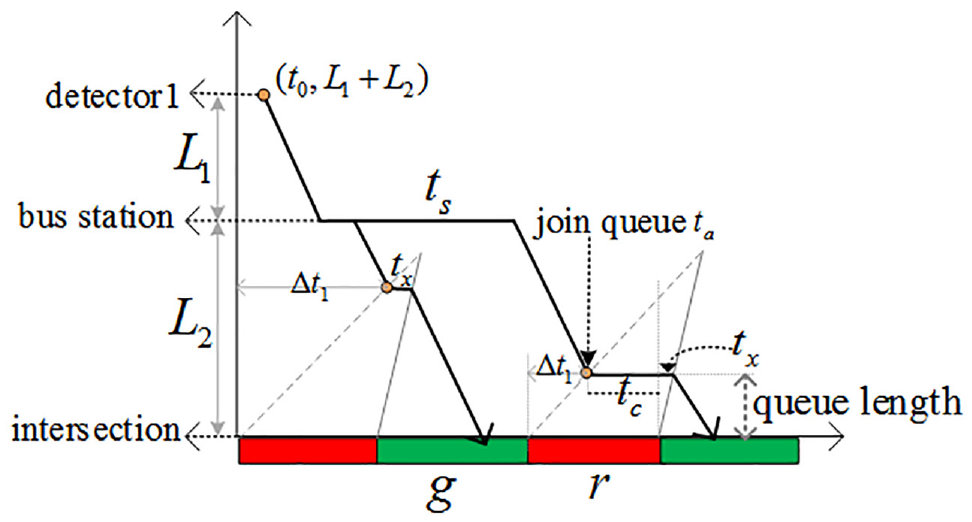
Process of bus operation.
Bus Delay Calculation at Signalized Intersection
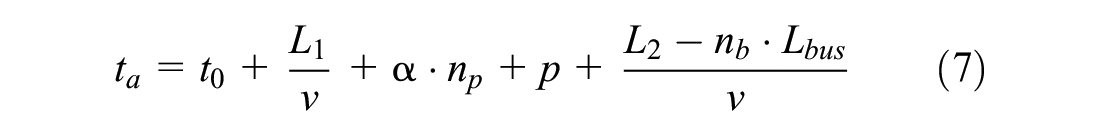
The time the bus arrives at the end of the queue

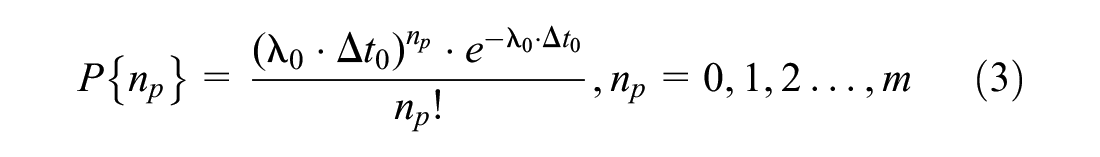
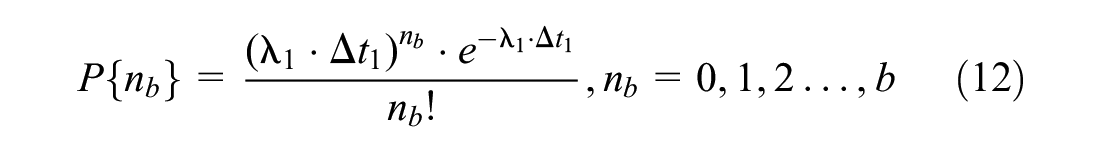
The bus dwell time is related to the number of passengers waiting at the stop. This paper assumes that the number of passengers arriving at bus stop in a certain period follows Poisson distribution
As passengers should pay the fare when they get on the bus, which takes more time than passengers getting off, it can be regarded that there is a positive correlation between bus dwell time and passengers getting on the bus. It takes

Bus travel time from bus stop to the end of the queue

Similarly, bus travel time from detector1 to bus stop

The time the bus arrives at detector1
The intersection signal control delay
(a) If the time
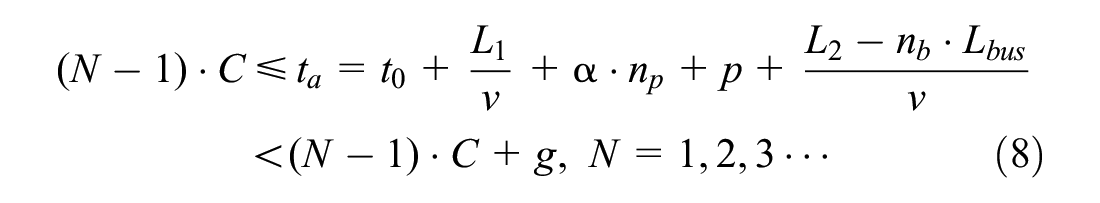
The bus can pass the intersection with no delay shown in Equation 9.

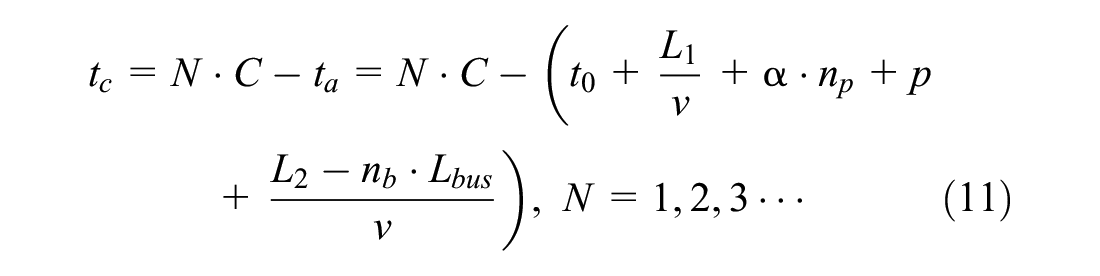
(b) Meanwhile, when the time
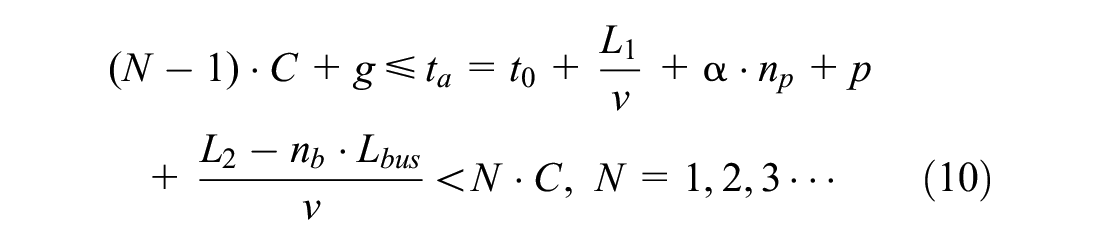
The intersection signal control delay can be calculated by Equation 11.
Queue Dissipation Time
In this paper, it is assumed that the number of buses reaching an intersection follows Poisson distribution
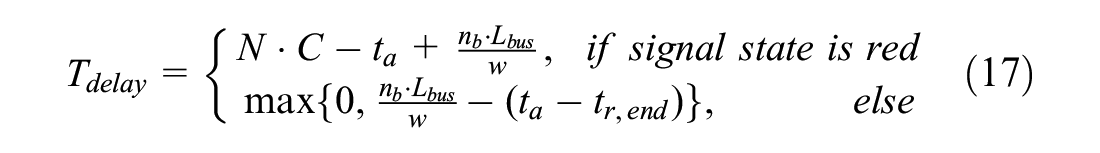
When the bus arrives at the intersection under distinct signal states, the method to calculate queue dissipation time is distinct. The signal state can be identified through Equations 8 and 10. The queue dissipation time is related to queue dissipation wave velocity
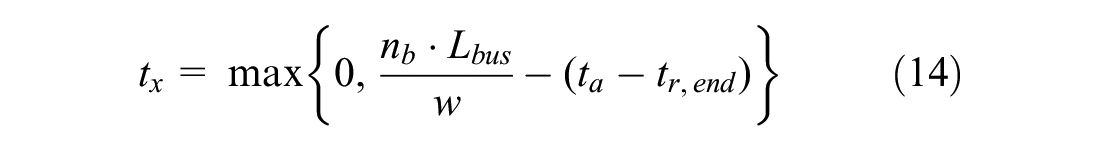
(a) If the signal state is green when the bus arrives at the end of queue, it is necessary to judge whether the queuing buses arriving during the last red have completely dissipated when the objective bus arrives at the end of the queue. The time interval

The queue dissipation time can be written as Equation 14.
(b) If the signal state is red, the queue dissipation time is related to the number of queuing buses ahead of the objective bus. The time interval

The queue dissipation time can be written as Equation 16.

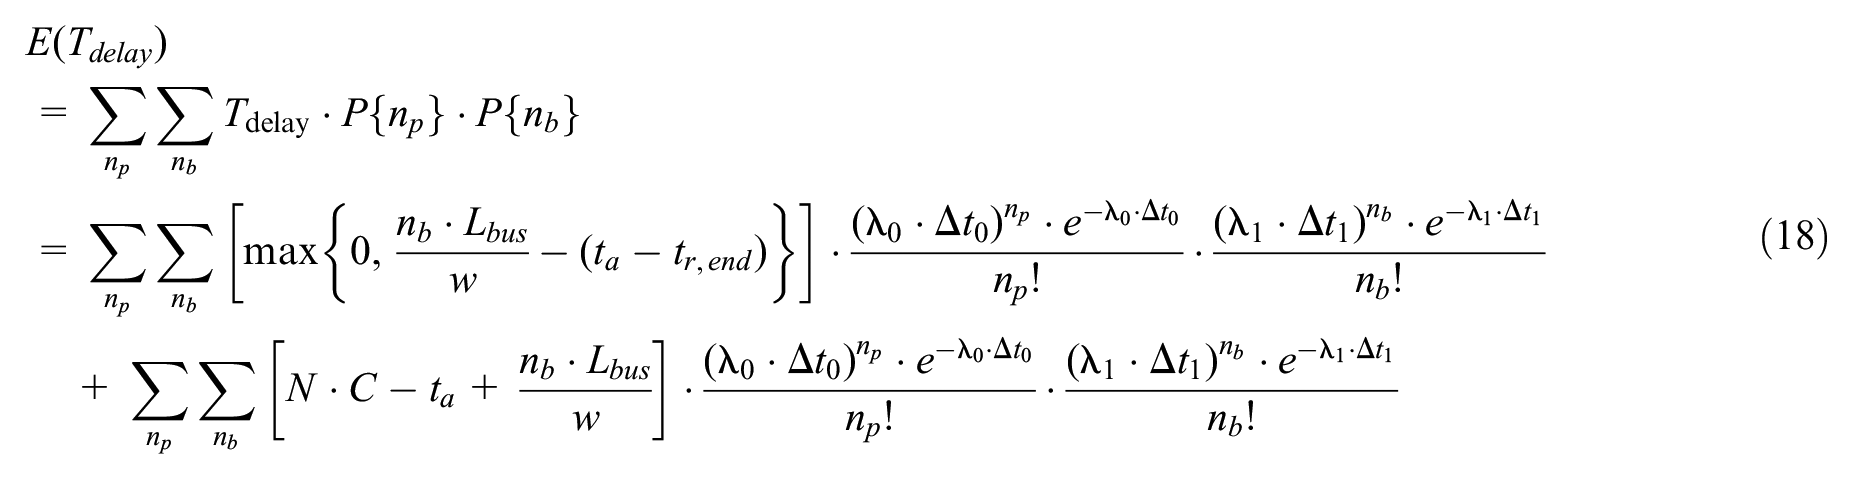
Bus Delay Expectation
Based on the above analysis, Equation 1, used to calculate the bus delay at an intersection
In summary, the expectation of bus delay
Bus Delay Variance Calculation Model
Besides considering stochastic factors by delay expectation in bus travelling, this paper also stresses the robustness of the control method under stochastic road environment. To ensure the effect and stability of the optimal method made by a mathematical model, the bus delay variance
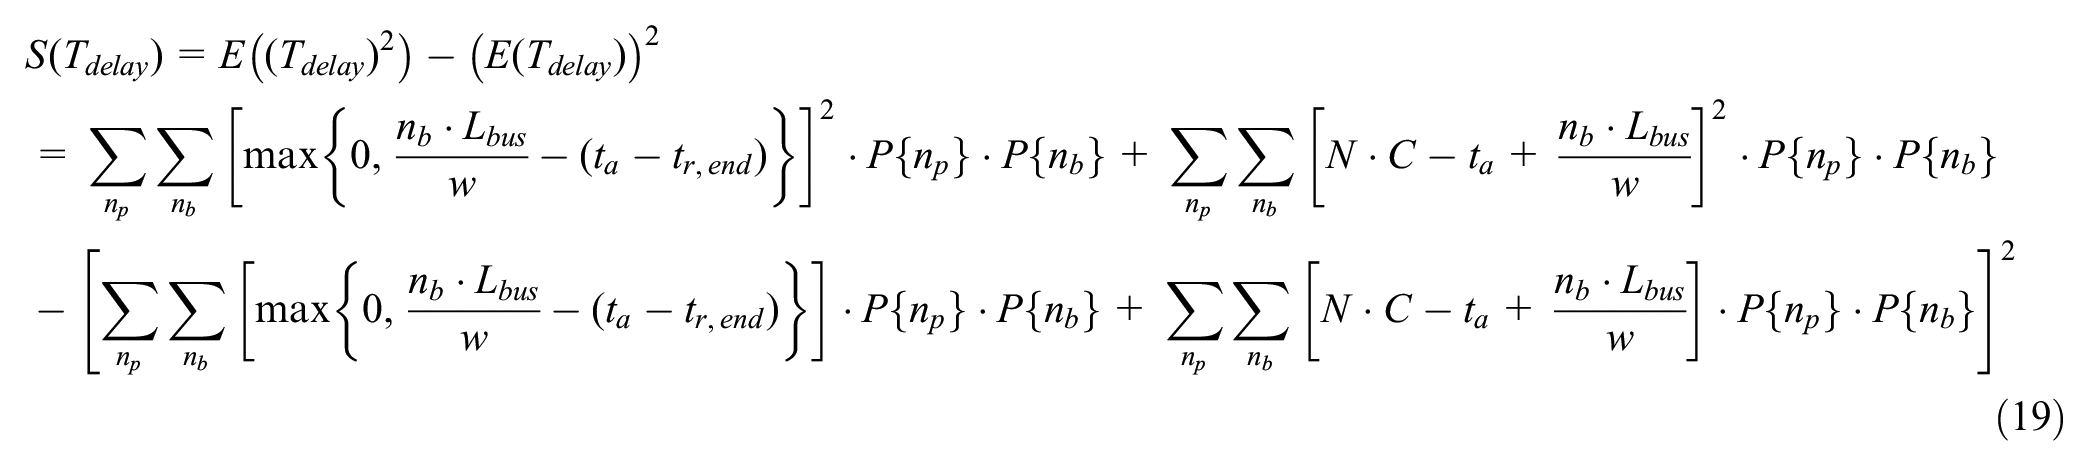
Considering the consistency of quantitative relation, the optimal model chooses the standard deviation (SD) of bus delay

Objective Function and Constraints
First-Stage Optimal Control
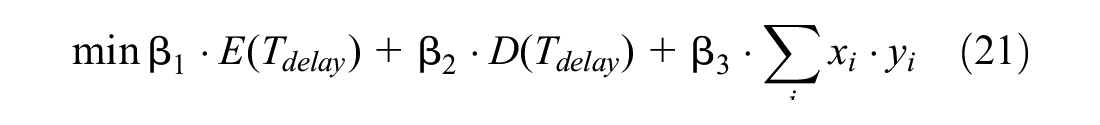
There are three parts in the first-stage control objective function. The first part is the bus delay expectation in the stochastic environment. As one of the performance indicators of bus operation at an intersection, the smaller bus delay expectation represents the higher traffic efficiency of bus at intersection. The SD of bus delay is the second part of the function, which ensures the robustness of the optimal control method and improves the reliability of the bus operation process. The third part is the changing time for different control strategies, considering the adverse influence on other vehicles at the intersection caused by changing the signal timing. Therefore, the objective function is given by Equation 21.


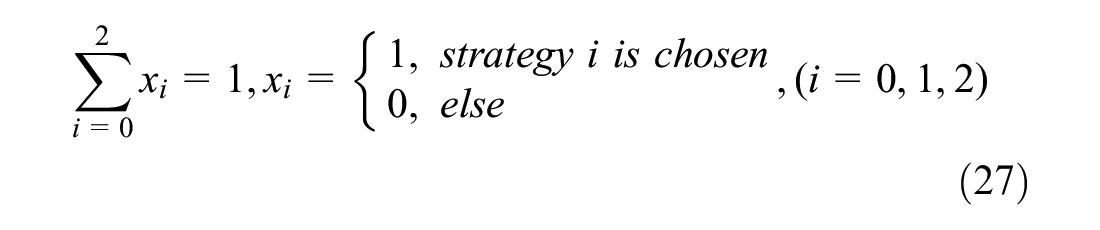
In the constraints,
Second-Stage Optimal Control
Different from first-stage control, second-stage control achieves dynamic and uncertain control based on data from detector2. The objective function of second-stage control is shown in Equation 25.


Similar to the meaning of
Control Process
The implement process of TTSP optimal control is illustrated in Figure 3. The first-stage control is a kind of robust optimality and provides priority for the late buses. It decreases the deviation of bus headways in the same line and improves the stability of bus travelling. To obtain better effects from the priority control method, the second-stage priority control of TTSP can be activated based on real-time data. It is a dynamic optimal control that makes full use of information from detector2 located at the intersections.
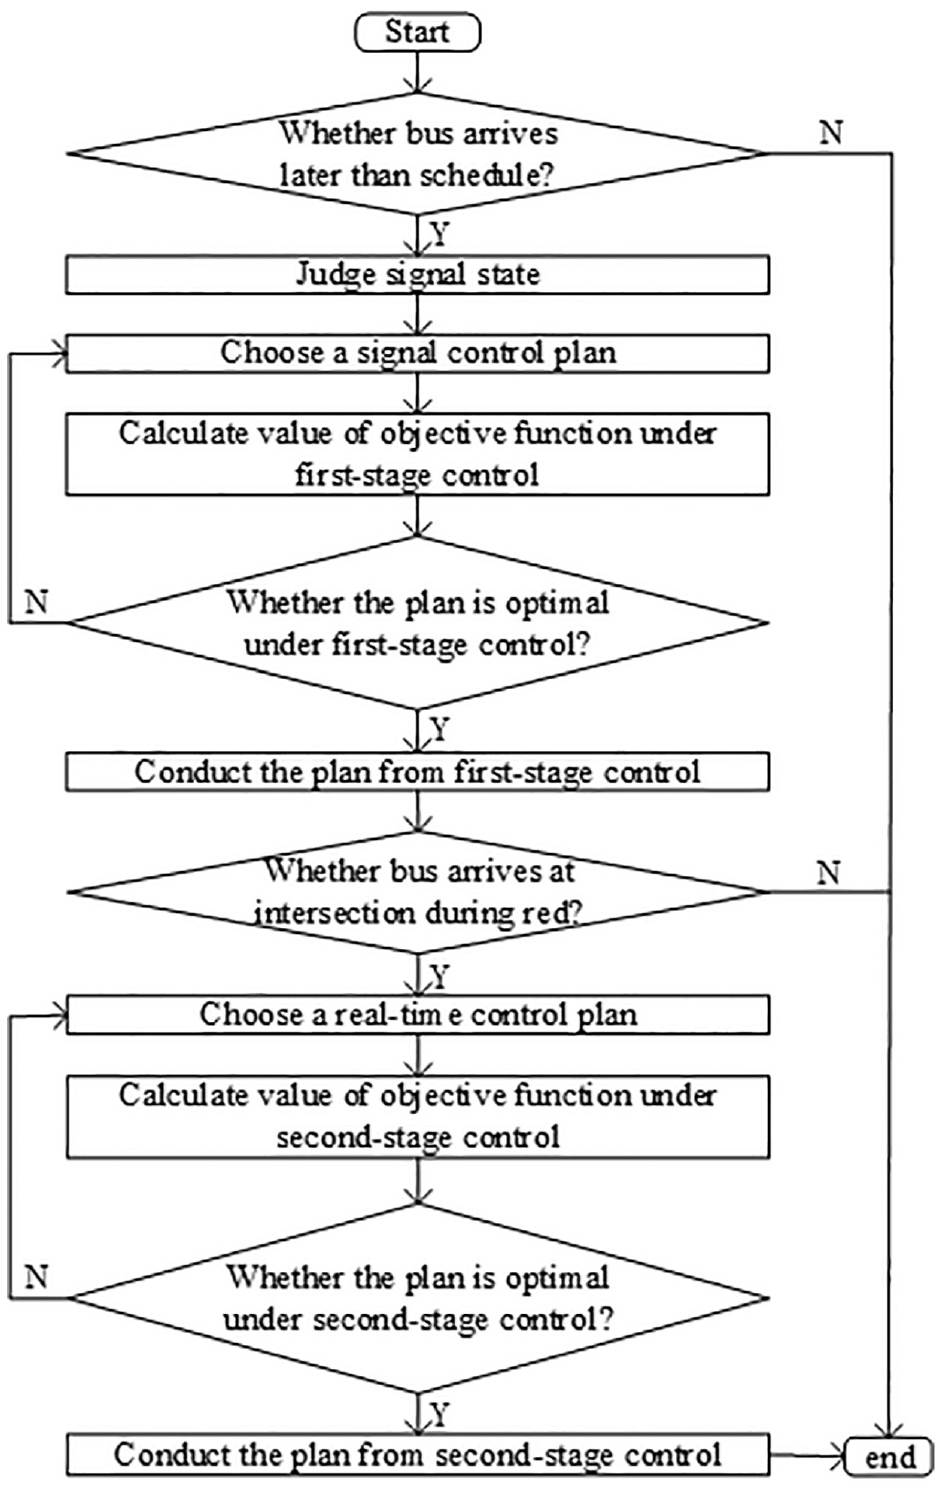
Concrete process of the two-stage transit signal priority (TTSP) control.
Bus arrival time at detector1 later than scheduled is the condition to activate the first-level control. Built on the calculation models of bus delay expectation and variance, the first-stage control considers the stochastic factors in the process of bus operation including bus dwell time and queue dissipation time on the bus lane. When the bus reaches the intersection during red under first-stage control, the second-stage control is activated. The second-stage control gives the bus dynamic control based on the real-time information from the detector2. By comparing the values of objective function under all feasible schemes, the optimal plan is obtained.
Case Study
There are two parts to the case study: the verification of the bus delay expectation and variance calculation models and the results analysis of simulation test. In Verification of the Bus Delay Expectation and Variance Calculation Model the bus delay expectation and variance calculation models proposed in Bus Delay Expectation Calculation Model and Bus Delay Variance Calculation Model are verified by comparing theoretical values with the values from simulation samples. Results Analysis compares the performance of four control methods: no optimization control (NC), deterministic priority control (DC), the first-stage ROC and TTSP control proposed in the paper. The DC method means the operation process of buses and number of passengers waiting at bus stop are assumed as stable. The bus delay of DC can be calculated directly instead of bus delay expectation. As the main control of TTSP, the performance of first-stage robust control is shown in this section.
Verification of the Bus Delay Expectation and Variance Calculation Model
To verify the bus delay expectation and variance calculation models, the Monte Carlo method is used to gain the average of bus delay and variance under a simulation with 1,000 samples. In every sample, both number of passengers waiting at the station and the number of buses queuing ahead of the objective bus are random. Then, the bus delay expectation and SD of sample are compared with results from their theoretical values.
As shown in Figure 4, the average bus delay of sample is compared with the theoretical expectation calculated by the bus delay expectation model. With NC or under ROC, the average bus delay from sample has a highly similar changing trends compared to theoretical bus delay expectation. In other words, the bus delay expectation calculation model can obtain the bus delay at the intersection quite accurately. Discovered by analyzing bus delay using NC and ROC, the first-stage optimal control scheme can decrease the bus delay significantly during about 45 s to 77 s. Even the biggest deviation between NC and ROC reaches 19.5 s under the same time bus detected in the sample, which is reduced from 23.8 s to 4.3 s when
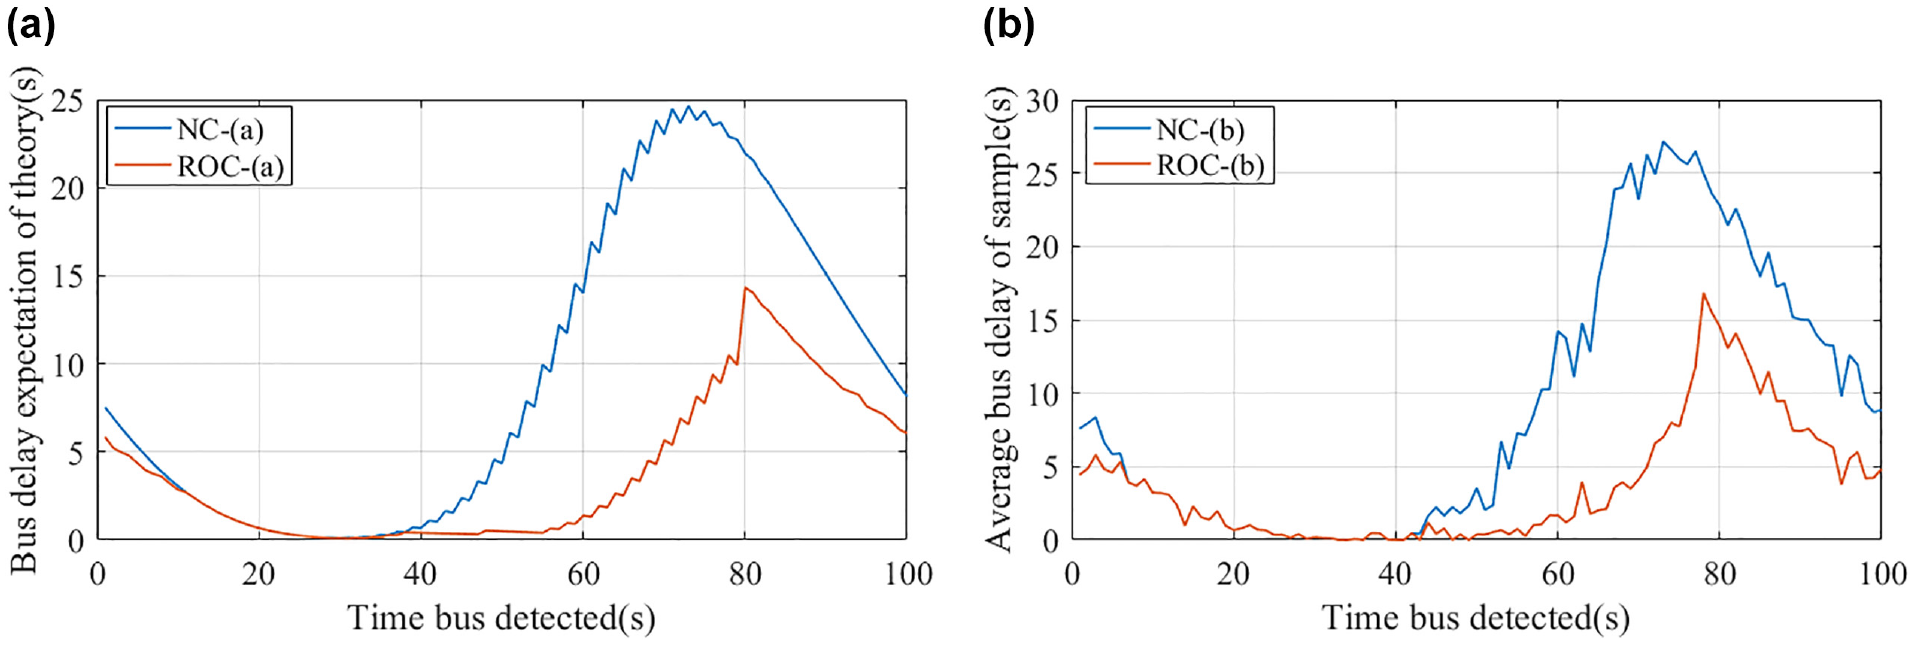
(a and b) Verification of bus delay expectation calculation model.
Meanwhile, the similarity in the changing trend of bus delay SD between Figure 5, a and
b
, illustrates the accuracy of the bus delay variance calculation model. While the exact value of bus delay SD exists, a certain amount of error is allowed. For instance, the value from the sample is 1 s larger than the theoretical value using NC when
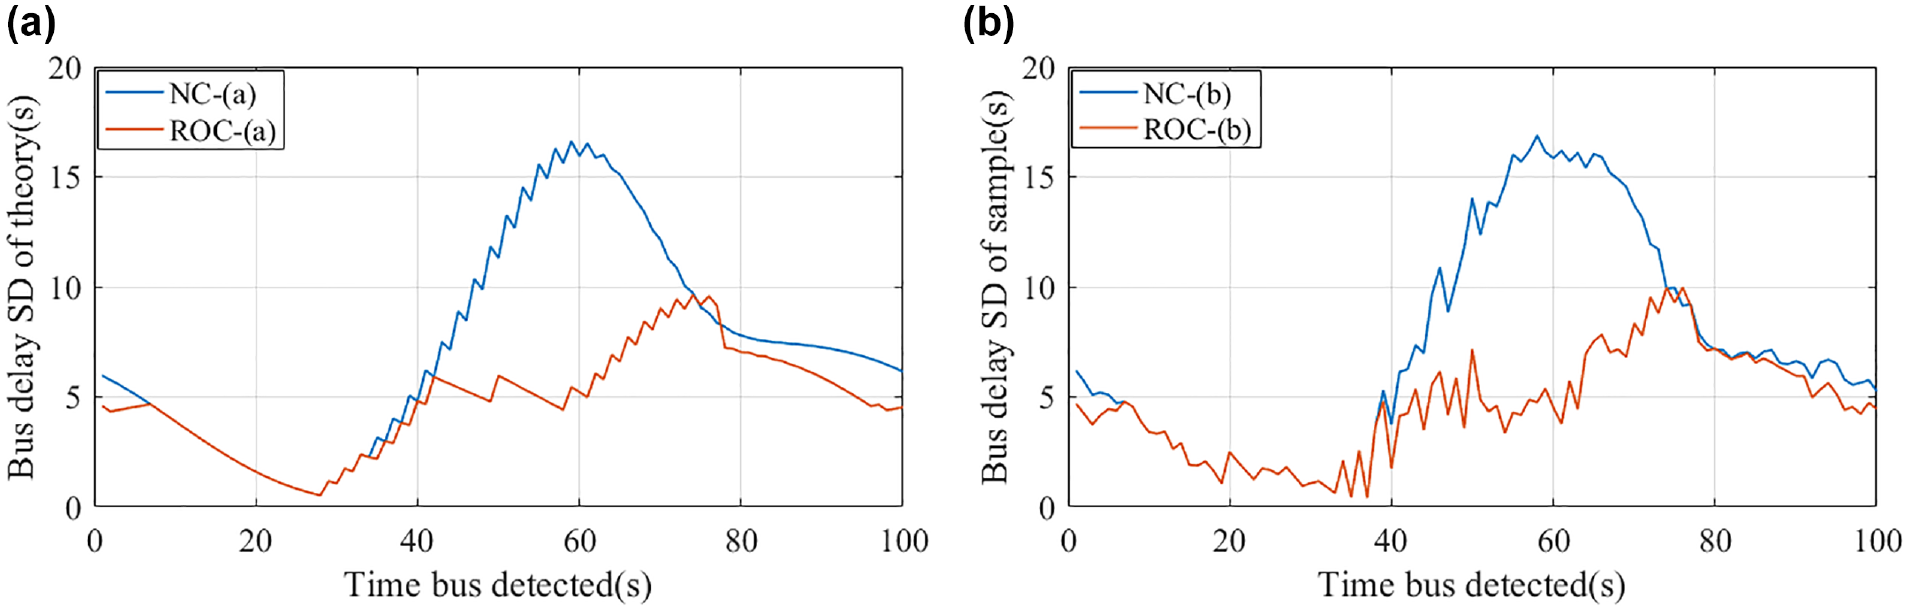
Verification of bus delay standard deviation (SD) calculation model.
According to the analysis above, the bus delay and variance calculation methods proposed in this paper are feasible to calculate the bus delay expectation and variance of bus delay quite accurately. In addition, the first-stage control (ROC) method can significantly reduce bus delay and improve the reliability of bus operation.
Results Analysis
Delay Analysis
Simulation experiments are carried out under three control methods—NC, DC, and TTSP—to evaluate the influence of the TTSP control approach. As the main control of TTSP, the performance of first-stage control, ROC, is also compared with the other three control methods. Figure 6 depicts a visual representation of the bus delay distribution under NC, DC, ROC, and TTSP. When compared to the other two control approaches, it is clear that ROC and TTSP can reduce bus delay at the signalized intersection significantly. The superiority of TTSP can be seen in two ways. (i) The optimal control effect of TTSP control in reducing bus delay expectation is better. Under the four control approaches, the average bus delay at the intersection is 9.2 s, 5.9 s, 4.0 s, and 3.2 s, respectively. Using DC, ROC, and TTSP, improvement percentages of bus delay reach 44.5%, 54.5%, and 65.2%, respectively, implying that the priority effect of TTSP is about 1.5 times that of DC for bus. (ii) The robustness of TTSP is noteworthy. The medians and range of 50 percent quantiles are smaller under ROC and TTSP control than under the other two control methods. Meanwhile, the TTSP method reduces the maximum of bus delay significantly compared with ROC, which means the second-stage control can make up for the deficiency of ROC well. The results demonstrate that TTSP can reduce bus delay expectation and SD, enhancing bus operation reliability.
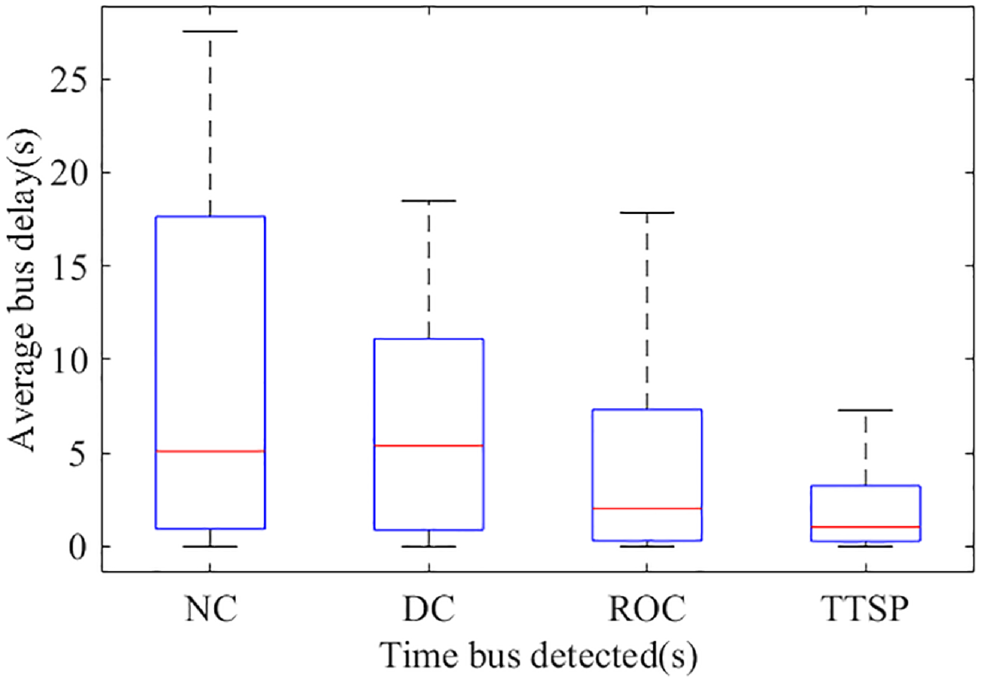
Comparison of average bus delay at the intersection.
Figure 7 compares the outcomes of the four control approaches for bus delay: SD, NC, DC, ROC, and TTSP. It illustrates that the SD of bus delay has a variable similar tendency to the average intersection delay box diagram in Figure 6 for ROC and TTSP. The bus delay SD in maximum and median drops dramatically with ROC and TTSP control, as seen in Figure 7. Using DC, however, the upper quartile of bus delay SD increases. It means that DC control has a negative impact on bus operation reliability, and that the bus priority control methods fail more frequently. Under the four control methods, the average SD of bus delay at the intersection is 8.3 s, 8.1 s, 5.3 s, and 3.9 s, respectively. Compared to NC, the mean of bus delay SD decreases by 53.1% using TTSP. It just reduces by 2.9% using DC and 36.5% under ROC. The TTSP method can reduce this by an extra 20% bus delay compared to using DC. In relation to bus operating reliability, the TTSP control method outperforms the DC control method.
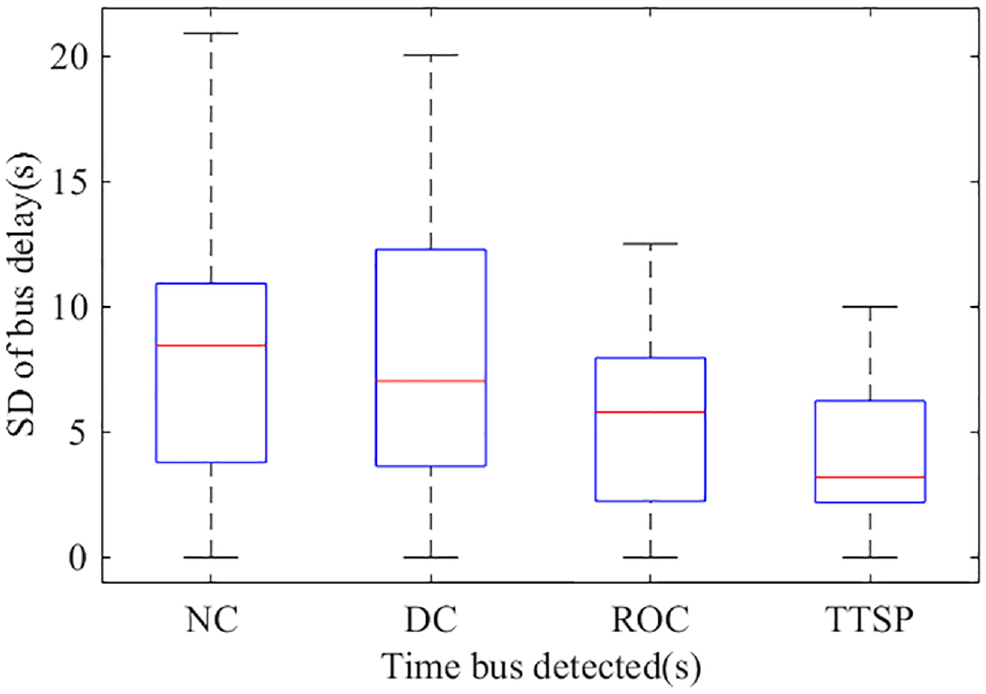
Comparison of bus delay standard deviation (SD).
Average car delay and average passenger delay can measure the influence of the control method on all the users at the signalized intersection, whose findings are shown in Figure 8. The values of passenger numbers in a bus and a car are set to 60 and 1.25, respectively, in the simulation. All three control methods, DC, ROC, and TTSP, increase the average car delay in the signalized intersection, as shown in Figure 8. Under the original signal timing scheme, the average car delay is 31.2 s. The three control approaches add 2.2 s, 2.4 s, and 4.8 s to the car delay, respectively, limiting the negative impact on cars in the intersection into 5 s, about 15% using TTSP. All three control policies improve the intersection’s per capita traffic efficiency by reducing average passenger delays, compared to using NC. They reduce the average passenger wait from 7.05 s to 6.48 s, 6.17 s, and 5.89 s, respectively. The improvement for passenger delay reaches 16% under TTSP. Under ROC and TTSP, bus delays are reduced significantly, from 9.2 s to 4.0 s and 3.2 s, respectively.
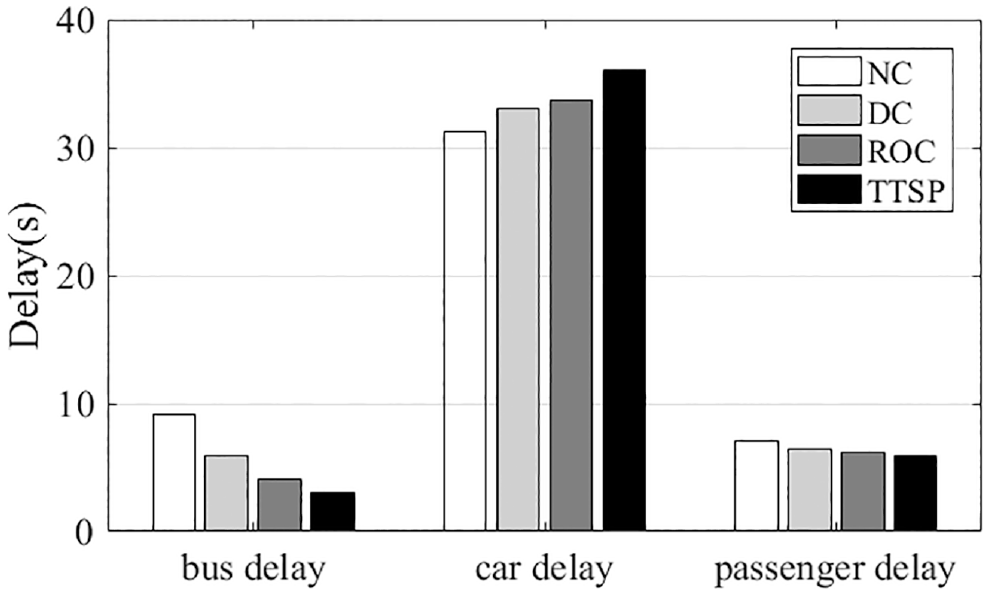
Average delay of all road users at the intersection.
First-Stage Control Result Analysis
First-stage TSP control (ROC), as the main control of TTSP control, strives to decrease bus delay expectation and SD. Therefore, in this section, the performance of the first-stage transit signal priority control method (ROC) is evaluated and compared with others. Two alternative control approaches, including NC and DC. The signal timing plan is presented in Table 2 for the three control methods with the same control parameter. The green time for bus passing phase of the control signal cycle is labeled
Signal Timing Plan under Different Control Methods with the Same Control Parameter
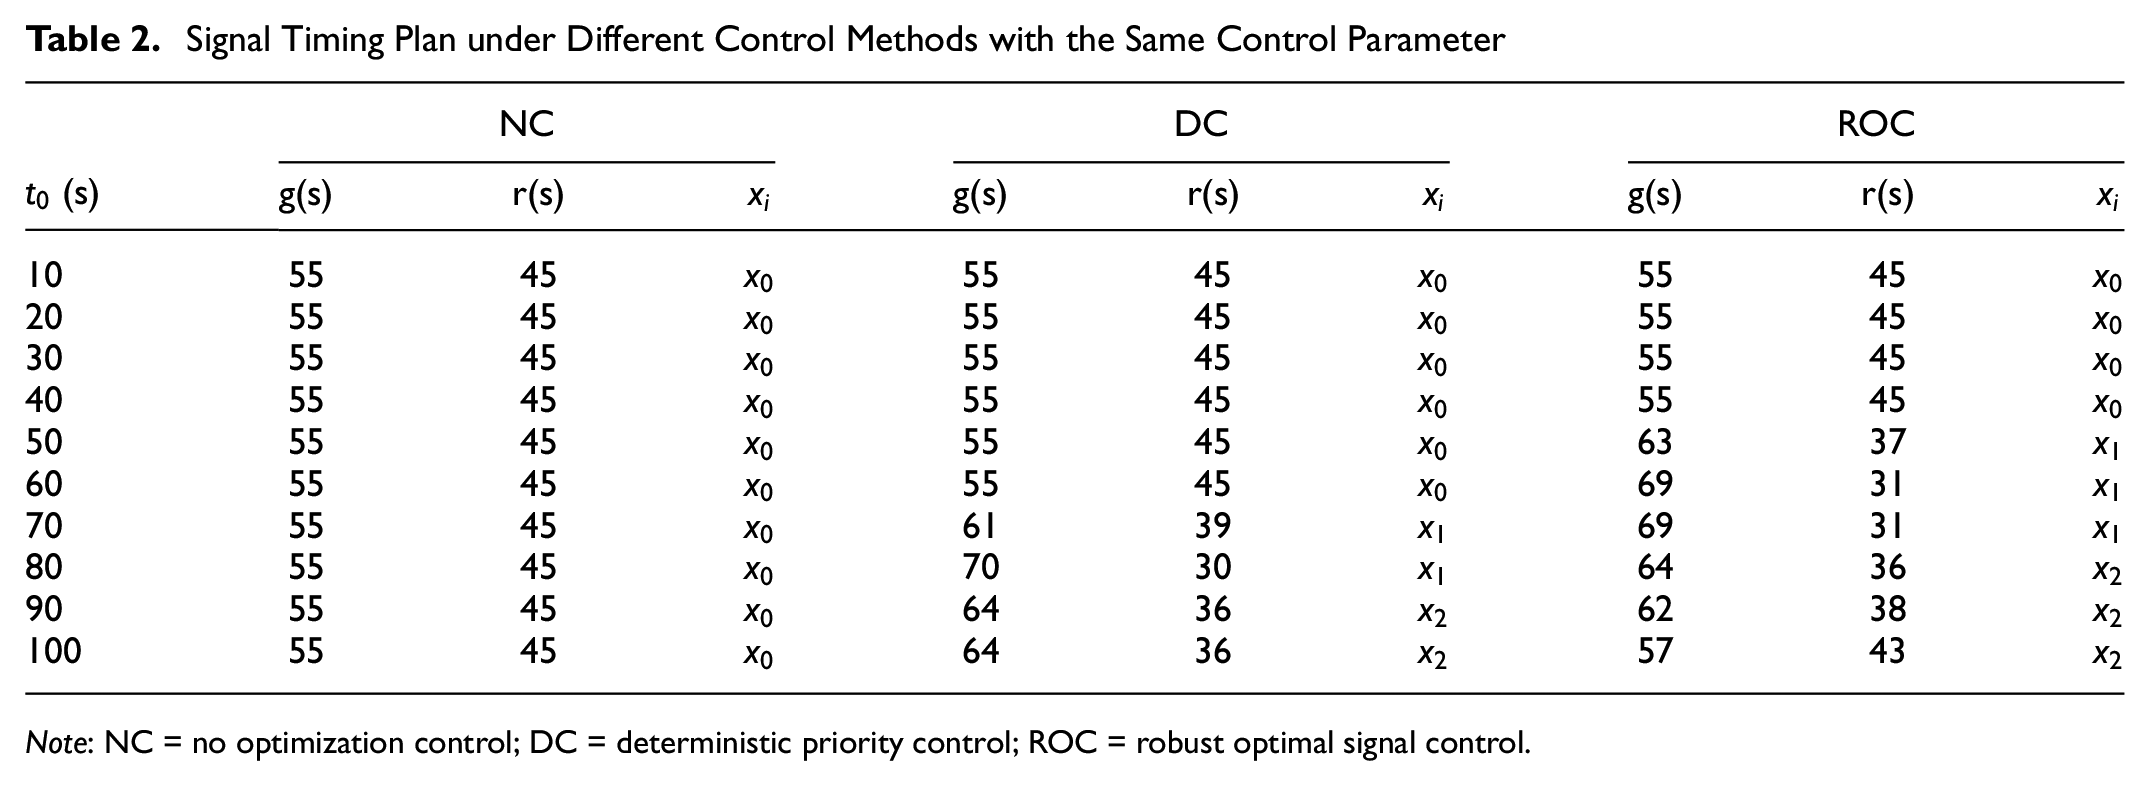
Note: NC = no optimization control; DC = deterministic priority control; ROC = robust optimal signal control.
In the simulation experiment, the signal plan in Table 2 is used to obtain several quantities of interest under various control methods, such as bus delay expectation, bus delay SD, average car delay, average passenger delay, and change value of signal control plan (Δt) shown in Table 3. When the time bus detected is less than 40 s, all three control methods use the same control plan. The change value of the signal control plan using ROC is a little larger than that of DC throughout the time the bus was detected, from 50 s to 60 s; however, the bus delay expectation and SD under ROC are substantially less than those of DC. When
Delay of all Road Users under Different Control Methods
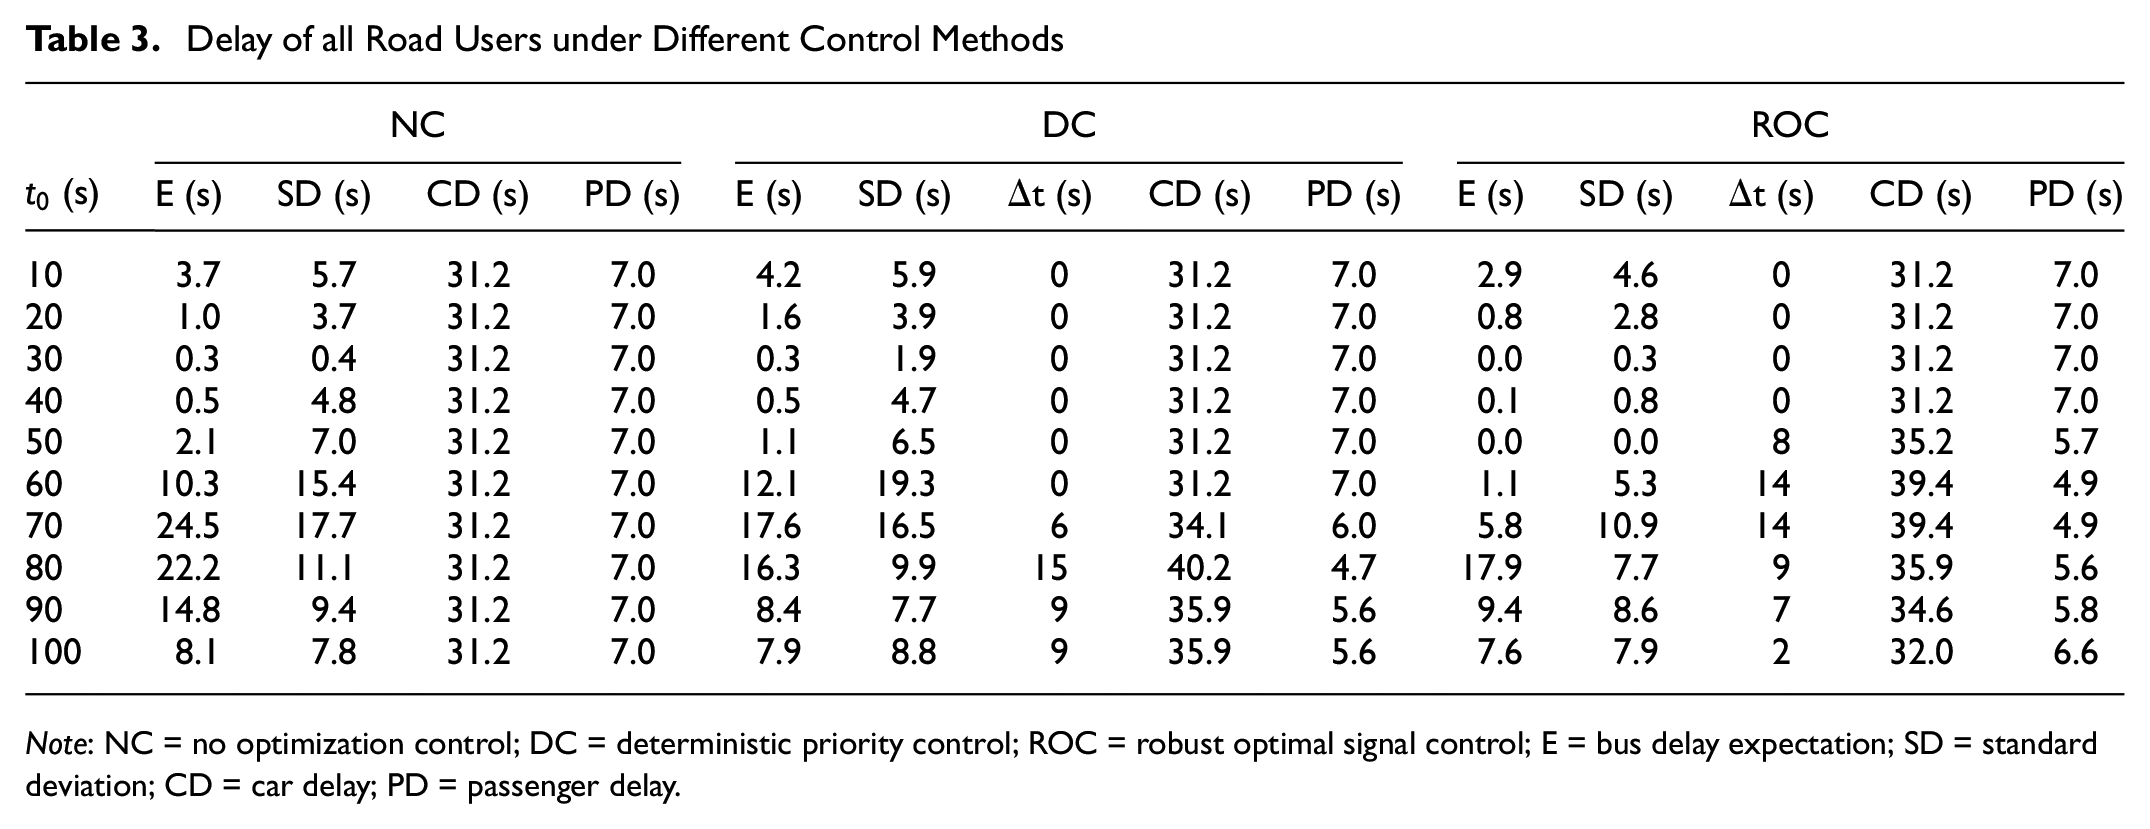
Note: NC = no optimization control; DC = deterministic priority control; ROC = robust optimal signal control; E = bus delay expectation; SD = standard deviation; CD = car delay; PD = passenger delay.
Relationship Between Priority and Bus Delay Analysis
To compensate for the deficiency of robust optimum control in this paper, a second-stage transit signal priority control is added. It is activated as a real-time control technique only when the first-stage control fails. Figure 9 depicts the link between the number of second-stage controls enabled and bus delay improvement effects compared with ROC in 100 simulation experiments. When
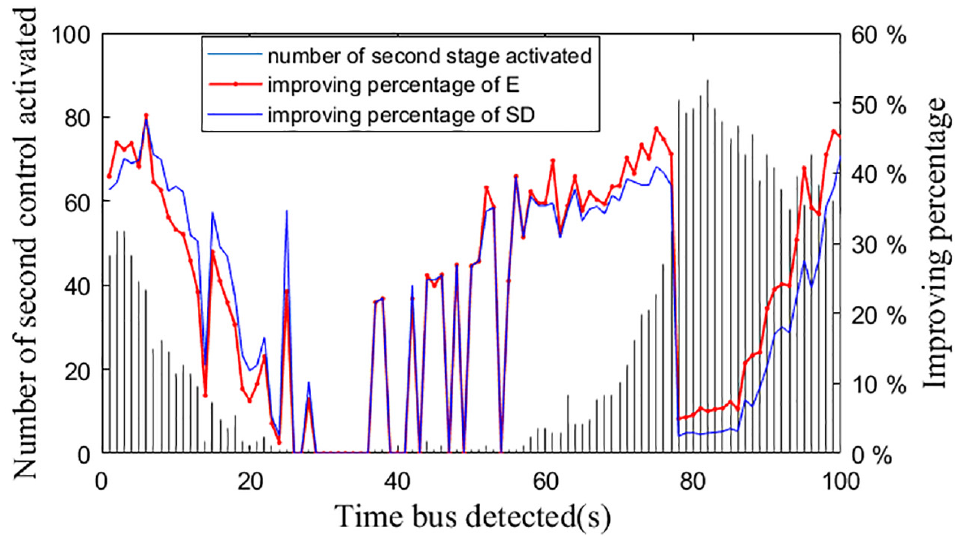
Relationship between number of second-stage control activated and bus delay.
There is a substantial positive association between priority time and bus delay reduction under first-stage control, second-stage control, and two-stage control described in Figure 10. The red line indicates the average red break time of 100 simulation experiments, while the green line shows the green extension time in the optimal control scheme. The average bus delay reduction under different TTSP control stages is represented by the blue line.
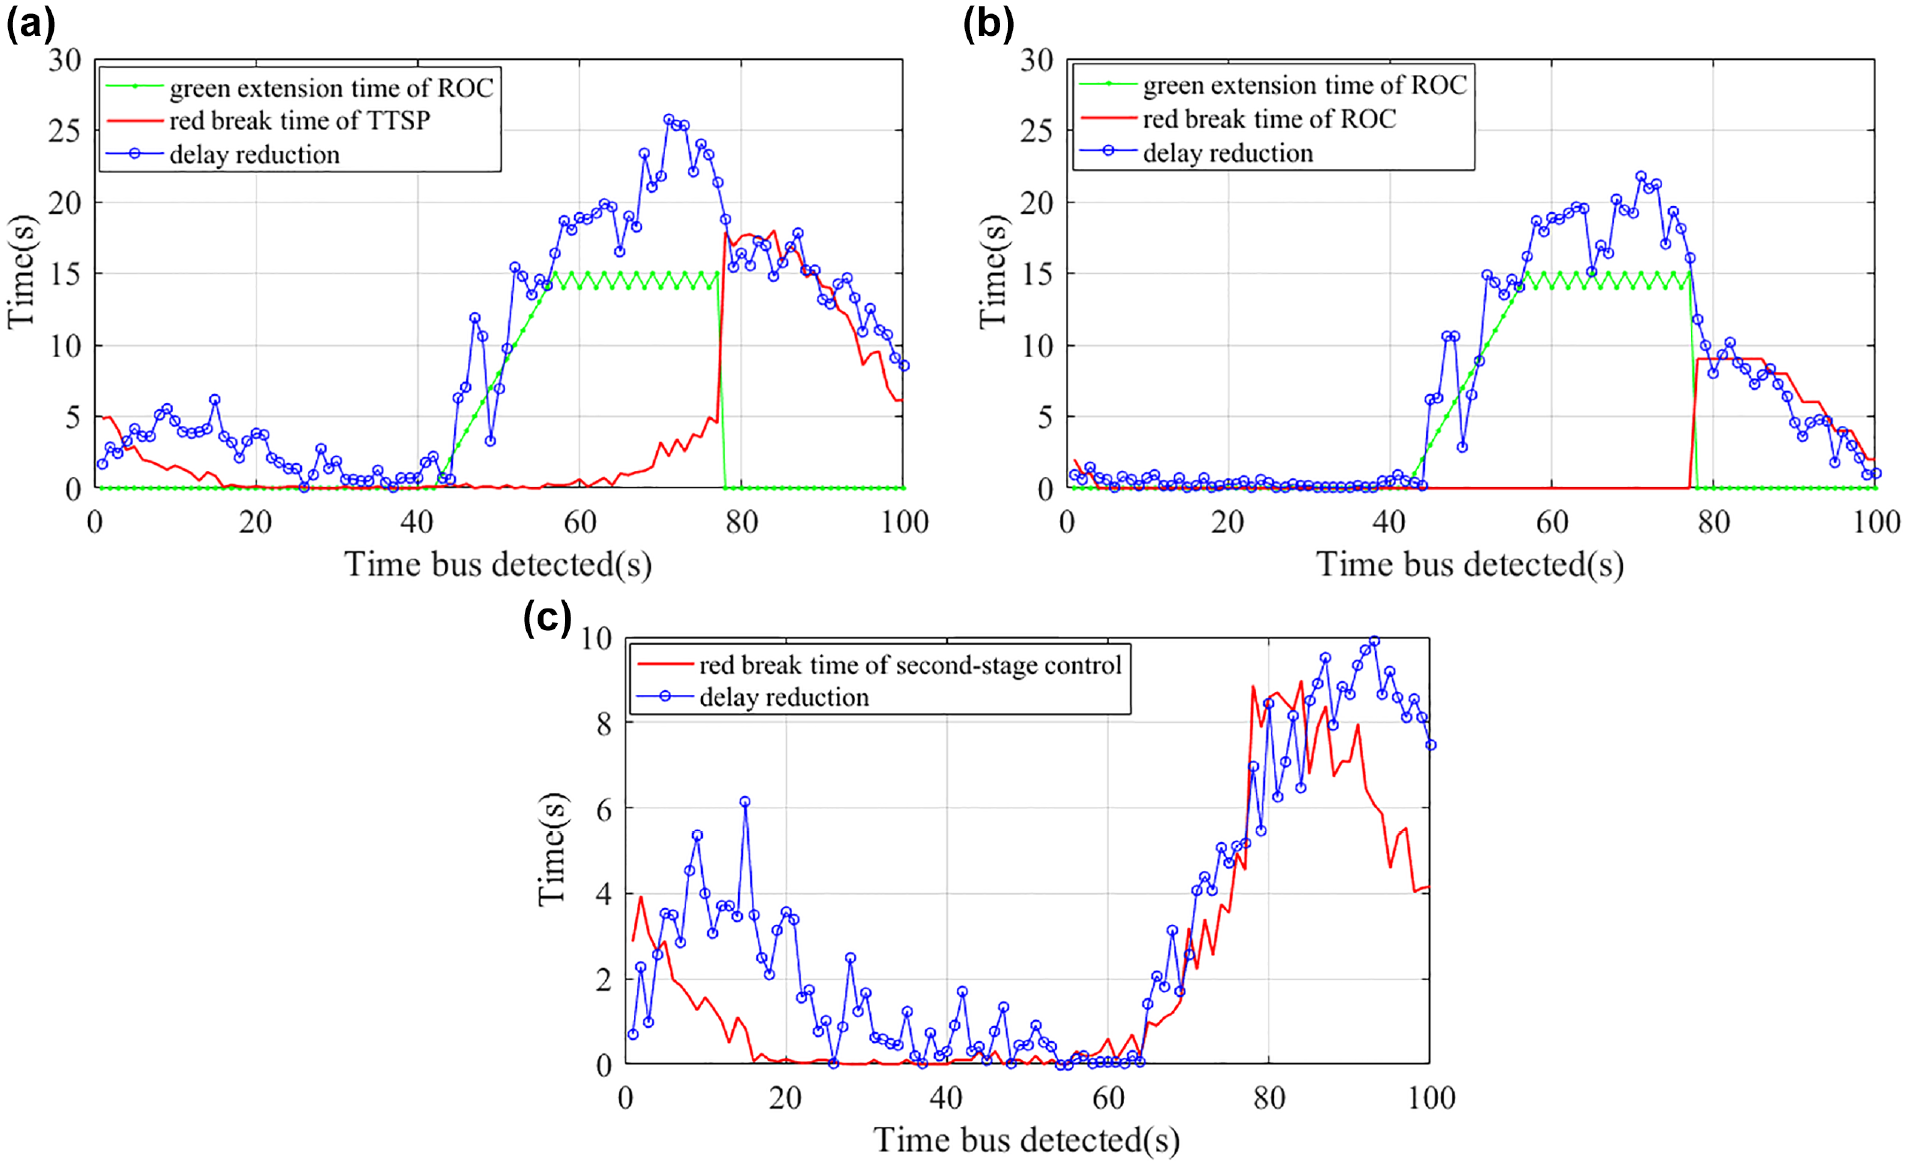
Relationship between priority time and bus delay reduction: (a) relationship under two-stage control, (b) relationship under first-stage control, and (c) relationship under second-stage control.
Figure 10a shows that under TTSP control, the value of bus delay reduction is much larger than the priority time when
Conclusion
This work has provided a TTSP control method that takes into account the randomness and robustness of the bus operation process to alleviate the problem of large headways and bus bunching. The first stage is robust optimum control with the aim of minimizing bus delay expectation and variance. Bus delay expectation and variance caculation model proposed bus delay expectation and variance calculation models considering the uncertainty of bus dwell time and the number of buses queued ahead. To compensate for the deficiency of the first-stage control, a second-stage control based on real-time traffic information was proposed. Objective function and constraints provides insight into the TTSP control procedure. According to case study, the TTSP control method outperforms DC in relation to bus delay by about 20% and can improve the reliability of bus operation by 53%. Average passenger delay using TTSP is reduced the most out of the compared policies. Under TTSP control, there is a considerable positive link between priority time and bus delay reduction.
However, there are still some limitations to using the TTSP approach. First, the objective bus controlled by TTSP operates on the bus lane, limiting applicability range of TTSP. Future research should consider the situation of a bus running in mixed traffic. Second, there is a signal priority in TTSP for large headways only when the bus is late. Buses that operate ahead of schedule may be considered in future investigations.
Footnotes
Author Contributions
The authors confirm contribution to the paper as follows: study conception and design: S. Liang, R. Leng; data collection: S. Liang; analysis and interpretation of results: H. Zhang, J. Zhao, S. Liang, R. Leng; draft manuscript preparation: S. Liang, R. Leng, H. Zhang, J. Zhao. All authors reviewed the results and approved the final version of the manuscript.
Declaration of Conflicting Interests
The author(s) declared no potential conflicts of interest with respect to the research, authorship, and/or publication of this article.
Funding
The author(s) disclosed receipt of the following financial support for the research, authorship, and/or publication of this article: This work is partially supported by Natural Science Foundation of Shanghai (20ZR1422300), National Natural Science Foundation of China (Grant NO. 71801153, 71801149) and China Postdoctoral Science Foundation (Grant NO. 2020M671173).