
Abstract
Recently, the necessity to redefine the mode selection model (modal split model) has emerged owing to the diversification of transportation systems. In addition to socio-economic factors, preference factors and user characteristics significantly affect the selection of transportation mode. Therefore, user preferences are reflected in the modal split model. The latent class model is highly descriptive, and its suitability can be improved. With the advent of high-speed rail (Great Train eXpress [GTX]), Seoul has established a competitive and complementary relationship for the demand of passengers between general and great express rail. Therefore, a modal split model reflecting the characteristics of the GTX, which is redefined by applying a latent variable to the stated preference analysis, is necessary. Latent class analysis uses the Bayesian information criterion and log-likelihood to distinguish the travel property (Cluster1), station property (Cluster2), and transfer property (Cluster 3). After comparing the time values for each cluster, the GTX preference is analyzed based on the inner and outer circle situations. A model that accurately reflects the characteristics and preferences of passengers is proposed in this paper. In the future, strategies can be established for the inner and outer circle situations, and higher operational efficiency can be achieved by combining the GTX and subway.
Keywords
Calculations for the existing modal split models are performed by considering travel time, travel cost, and socio-economic factors as the main variables. However, the necessity to redefine the appropriate modal split model has emerged recently owing to the advent and diversification of a new transportation mode. In this study, an evaluation technique used by the current government is applied to the modal split model, which is primarily used to predict transportation demand. In fact, various studies are being conducted to mimic reality by incorporating various variables in the current modal split model, which reflects only general socio-economic indicators ( 1 , 2 ). Typically, not only individual socio-economic attributes, but also individual preferences significantly affect the selection of transportation ( 3 , 4 ). Therefore, models using variables that reflect user preferences as well as socio-economic factors are to be developed. The latent class model is descriptive and can improve the suitability of the modal split model ( 5 ). The Great Train eXpress (GTX) is currently under construction in Seoul as a new high-speed rail. The GTX connects major hubs in Seoul and Gyeonggi-do in a 30-min period. It is similar to the cross rail in London, the regional express rail in France, and the Reseau Express Metropolitan (REM) in Canada. The cross rail of London increases London’s rail capacity by 10% and transports approximately 1500 passengers per train; furthermore, it can be accessed by 1.5 million people in central London within 45 min ( 6 , 7 ). Meanwhile, Canada’s REM, which was once used as a car or taxi, aims to provide access to the Montreal International Airport ( 8 ). Therefore, the GTX can enhance people’s life quality by improving the transportation systems in Seoul, thereby solving chronic traffic problems and reducing travel time. Owing to the advent of the GTX, which is a new transportation system, it is envisioned that passengers are more likely to prefer using the subway and GTX than the other public transportation. Therefore, competition and complementary relationships between the subway and GTX will be formed. For regional railways, a modal split model was established to distinguish between subway and high-speed rail. However, Seoul’s railway modal split model cannot distinguish different transfer effects, and an application was established using the same variable between the above-mentioned transportation systems. However, spatial correlations might not be reflected accurately ( 9 – 11 ).
Therefore, using the modal split model of the subway for the GTX can result in errors. Therefore, a mode sharing model that reflects the characteristics of a high-speed rail is to be developed. In this study, the modal split model for the GTX was redefined using latent class analysis (LCA), which can reflect individual characteristics and preferences. The share rates of the outer and inner circles were obtained based on a stated preference (SP) survey about changes in the use of the metropolitan railway because of GTX operation. The Bayesian information criterion (BIC), a determinant for model selection, and the log-likelihood (LL) value, which indicates the fit of the model, were classified, and the latent variables were derived. The modal split model was applied in a few case studies via LCA. In addition, the application of the GTX enabled the comparison of preference differences between public transportation and in-vehicle time values through distance.
Literature Review
SP Survey and Modal Split Model Implementation via LCA
In previous studies, models have been developed for various fields by applying preference factors to LCA. In various cases, LCA is applied to the modal split model. Galdames et al. ( 3 ) conducted a survey of commuters to acquire socio-economic data and preference factor data to investigate the role of preference factors in the modal split model. In this study, by performing LCA based on path analysis, both preference factors and socio-economic data were considered and used for the discrete choice model. People’s travel behavior and mode choice can be explained by considering preference properties as a latent variable. Therefore, the consideration of latent variables demonstrates the practical importance of travel costs and service levels in a person’s decision-making process ( 3 ). Madanat et al. ( 12 ) identified variables by applying LCA to determine factors affecting the thinking about road detours when a driver encounters traffic congestion. Therefore, the attitude toward path switching and the reliability of information provided by the radio traffic report or changeable message sign are important explanatory variables for path switching ( 12 ). Wen and Lai ( 13 ) reported that the latent class model performed better than the existing MultiNomial Logisitc (MNL) model. In addition, they explained that if individual socio-economic and travel characteristics are included as variables, then the suitability of the latent class model can be further improved ( 13 ). In another study by Wen et al. ( 14 ), railway access mode choice was investigated using survey data obtained from Taiwan. Consequently, LCA was proposed, and the results showed that the proposed model provided better explanations than other models with regard to both alternative patterns and preference heterogeneity. They identified user preferences with regard to individual aspects using a modal split model based on socio-economic and travel characteristics. In addition, the suitability of LCA was investigated, and highly explanatory results were obtained ( 14 ). Tawfik and Rakha ( 15 ) reported that selection behavior differed by individual; therefore, a segmented model should be developed. Accordingly, a route-choice model for drivers was presented via LCA. The class for the model was classified based on the demographics, personality, and selection characteristics of 20 drivers. In addition, it was reported the route-choice model using LCA performed better than the hierarchical behavior model ( 15 ). Ben-Akiva et al. ( 5 ) simulated preference factors as a latent variable affecting the decision-making process. Comparing the choice model with and without the latent variable (preference factors), it was discovered that integrating the latent variable improved the suitability of the choice model significantly ( 5 ). Prato et al. ( 16 ) reported that modeling alternative processes for each individual when selecting a path was complex. Therefore, a methodology that appropriately applies factor analysis to path selection is proposed in this paper. Individual behavior data were acquired from a survey conducted on individual commuters; subsequently, the data were analyzed ( 16 ). Walker ( 17 ) explicitly incorporated an atypical concept as a preference indicator to develop a more realistic behavior model. Behavioral researchers emphasized the importance of factors that affect behaviors, such as situation, knowledge, and attitude ( 17 ). In addition, the current conceptual and methodological frameworks for integrating preference factors that affect decision making in the selective model into explanatory variables are developed by modeling the above-mentioned factors as latent variables. Afghari et al. ( 18 ) proposed a latent class model that is consistent with “multiple-risk process” theory based on the geometric characteristics of a road, the spatial characteristics of the surrounding environment, and driver behavior factors. A methodological approach for estimating the Bayesian latent class model was proposed considering engineering and unobserved spatial factors. This implies that the latent class model can consider spatial correlation ( 18 ). The current modal split model is presented by the integration of in-vehicle and out-vehicle times within the overall travel time. Within the framework, it is effective to categorize the transfer effect or spatial correlation into different factors and analyze them simultaneously. Therefore, LCA is more descriptive than other models because it considers various factors and preferences. In addition, the latent variable is derived primarily from satisfaction surveys to analyze unobservable preferences and individual characteristics.
LCA is used not only in the modal split model, but also in the transit and freight sectors. Cerwick et al. ( 19 ) developed a model using mixed logit and LCA to investigate the relationship between the severity of large truck crashes and their contributing factors; subsequently, they investigated the differences between the models. After comparing the models, the latent class model was discovered to be more suitable. In transportation and freight, a survey was conducted to investigate the LCA and people’s preferences ( 19 ). Román et al. ( 20 ) analyzed preferences when performing mode choices for freight transport. Kim et al. ( 21 ) conducted a study using preference surveys from 190 New Zealand freight forwarders and companies to understand the decision-making process when making mode-choice decisions. Based on LCA, mode-choice decisions differ depending on the transport distance and shipment size. Therefore, LCA is used in preference and SP surveys. In addition, mode-choice decisions can be achieved appropriately using preference surveys and LCA.
LCA Using Structural Equation Modeling
A study was conducted to identify the relationship between the latent variable and the variable available in the LCA through structural equation modeling (SEM). Hurtubia et al. ( 22 ) proposed a method where preference metrics are introduced to the general discrete choice model, which considers only quantitative variables, such as travel time and cost. Recognizing the importance of users’ lifestyles, attitudes, and perceptions, a model was developed using a structural equation ( 22 ). Kim et al. ( 23 ) reported that structural equations best describe the underlying relationship between variables, and they analyzed the severity of collisions based on factors contributing to collision accidents. The standardized coefficient from the LCA is useful for assessing the relative importance of latent factors to the severity of collisions ( 23 ). Wen et al. ( 24 ) developed a structural equation to determine passenger loyalty to intercity bus services and explained the causal relationship between latent factors. Outwater et al. ( 25 ) predicted an expanded ferry service by adding variables to consider the importance of passengers’ attitudes and various markets in mode-choice modeling. Therefore, SEM was performed, which rendered it easy to identify the causal relationship between traffic behavior and the socio-economic profile of passengers ( 25 ). Wang and Qin ( 26 ) analyzed the relationship between factors that contribute to the severity of collisions and the severity of a single vehicle crash via SEM. This is because the complex relationships between variables can be investigated by simultaneously processing both endogenous and exogenous latent variables ( 26 ). Spada et al. ( 27 ) hypothesized a theoretical route for analyzing the relationship among COVID-19 (Coronavirus), population density, and climate. In addition, it was tested via SEM, a statistical technique, for correlation analysis. Consequently, climate factors and population density were discovered to be correlated with COVID-19 ( 27 ). Al-Mahameed et al. ( 28 ) acquired more than 60 expansionary variables pertaining to pedestrian and bicycle collisions in highways to establish relationships between pedestrian and bicycle collisions and expansionary variables. SEM that incorporated exploratory factor analysis (EFA) and confirmatory factor analysis (CFA) was performed. Consequently, important latent variables (e.g., road and degree of activity) that affected the frequency of collisions were revealed ( 28 ).
Methods
Introduction of the SP Survey
The SP technique can be defined as a series of techniques that establish virtual scenarios via statistical experimental planning and provide individuals with individual preferences ( 29 ). In other words, it is a technique that investigates an individual’s preference and intention that are psychologically inherent in a hypothetical situation. The SP survey provides individual respondents with an alternative based on hypothetical situations. A hypothetical alternative is expressed as an explanatory variable representing the alternative, that is, a service or characteristic. Alternative configurations are generally combined with experimental planning; therefore, respondents order their choices in the order of importance or grade them on a scale for each alternative. Alternatively, they can select a preferred alternative. This SP survey technique allows data independence to be maintained. Using the experimental planning method, the correlation can be excluded, and questions without interaction between two variables can be designed and presented to the respondents. In addition, data about new situations that do not exist can be obtained. In fact, the demand for new transportation that does not exist in the current market can be estimated by presenting fees and travel times for virtual new transportation based on experimental plans. Therefore, when SP data are used, the unit of the attribute variable is determined in advance and presented to the respondent. This affords the advantage of no measurement error from the attribute variables when inputting data or constructing a model.
Theory of Relevance
The modal split model, based on the existing SP survey, was calculated using the out-vehicle, in-vehicle, access, and wait times. However, a modal split model using invisible user characteristics has been developed recently. In this study, the modal split model was redefined using LCA, which applies latent variables to the SP survey.
A latent variable means an intrinsic characteristic that cannot be measured directly, such as a respondent’s preference for an examination question, that is, a variable with potential characteristics that cannot be observed. LCA is modeled based on potential characteristics. This can reveal people’s traffic behavior by reflecting their preference for mode choice. It can cluster variables, including various exogenous variables, such as demographics. Furthermore, it improves the explanatory power of the model by reducing the error caused by non-missing factors and is more suitable than other models ( 3 , 17 ). This enables a reasonable interpretation by analyzing the behavioral preferences of users. Therefore, efforts to consider preference properties as latent variables have been continued, and studies that use latent variables in the mode choice process are currently in progress. Owing to the advantages and characteristics of LCA, a model was developed by adding a latent variable to the existing modal split model. Previously, travel time, travel cost, and socio-economic factors were used in LCA; however, the model was redefined in this study by considering individual characteristics, as shown in Figure 1.
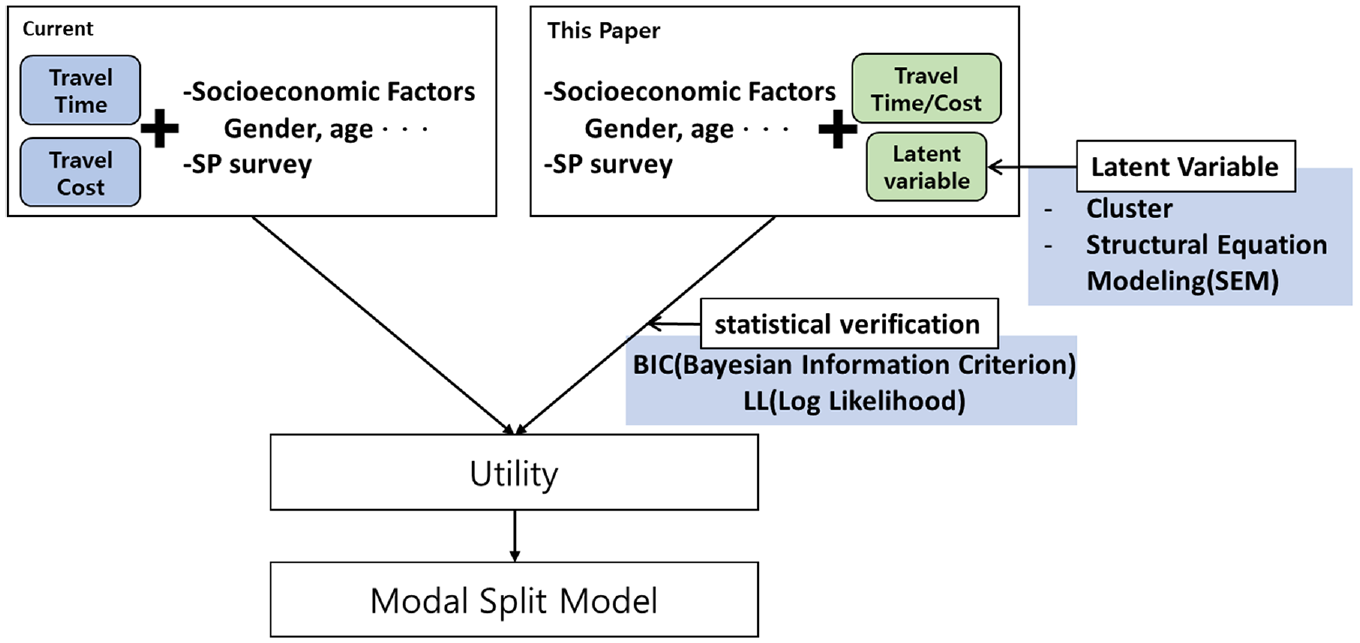
Schematic illustration of the modal split model.
A SP survey is intended for accumulating personal preferences or opinions about specific transportation systems and behaviors in hypothetical situations to serve as a basis for conducting a preference survey for new transportation choices in the future. A SP survey exhibits the following characteristics.
Provides respondents with an option based on hypothetical situations.
Each alternative attribute is presented by the analyst based on the respondents’ current situation.
Each alternative configuration is combined based on the experimental design.
A hypothetical alternative is expressed as a service or characteristic of the explanatory variable.
Respondents provide their preferences about three components: choice, ranking, and figures.
Based on the existing case, the SP survey requires 75–100 samples in each group ( 30 ). When r responses are obtained from an individual, the required number of samples (n) is divided by the number of questions and determined by the actual number of samples. The minimum number of samples is shown in Equation 1 if multiple responses are obtained from n respondents r times ( 31 ):

where n is the number of samples;
Table 1 shows the minimum number of samples based on the proportion (p) of the population at the 95% confidence level, relative errors of 5% and 10%, and number of multiple responses (r).
Minimum Number of Samples Based on Proportion of Population (p), Relative Error (a), and Number of Questions (r)

The design process is illustrated in Figure 2. The purpose of investigating the transportation preference is to create a modal split model that reflects the characteristics of the new transportation system; therefore, the survey targets and number of samples were determined. The preferred expressions for choice, ranking, and rating were subsequently provided. The selection method is the most realistic SP expression method and is widely used in transportation; therefore, this method was used to conduct the survey. The choices for routes and transportation were assumed when applying SP techniques in the general transportation sector. The demands for routes and transportation were estimated by assuming routes and transportation with different travel times and costs, and the willingness to pay because of reduced travel time was estimated. Subsequently, the attribute variables and levels were determined. The variable that describes the selection alternative is known as the attribute variable. After determining the selection situation and the number of selection alternatives, the attribute variable that describes the selection alternative was set. In this study, the attribute variable was analyzed by organizing the travel time (outside, in-vehicle time, total travel time) and travel cost (car fare and operation cost). When the attribute variable and level were determined, the level of each variable was determined by the level change, considering the width of the change around the reference level. The experimental design is a technique that economically identifies the optimal conditions of a product by selecting several factors that affect the characteristics of transportation and conducting experiments to identify their relationships. In this case, a survey was conducted using 16 orthogonal arrangements and questionnaires with 14 two-level attribute values ( 31 ). In this study, the number of clusters was set to add a latent variable, and SEM was performed to establish relationships between variables. Statistical significance was confirmed using the BIC and LL.
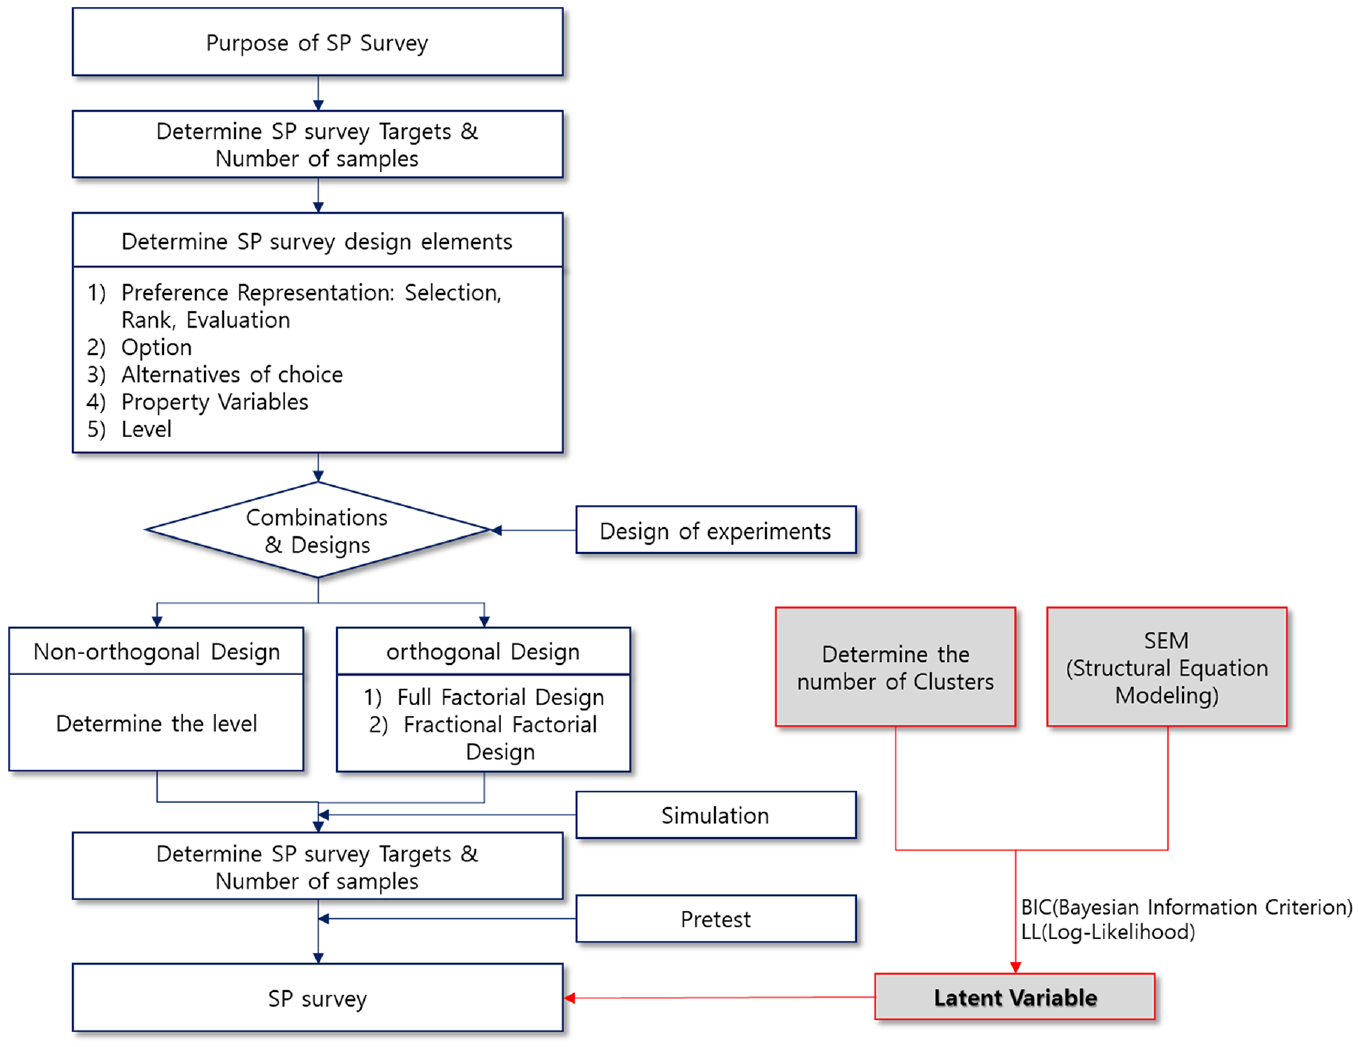
Design process with stated preference and latent class.
The latent class model is represented by the following equation. In this study, SP investigation was conducted, followed by LCA using Equation 2:
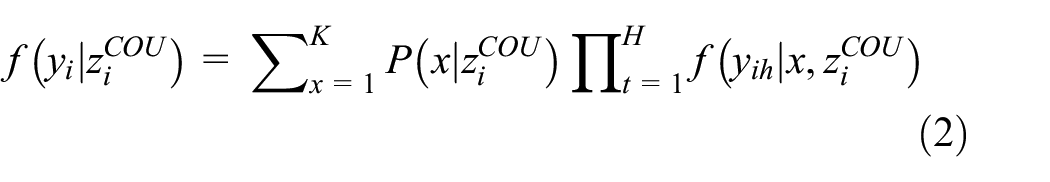
where x is the latent class;

where
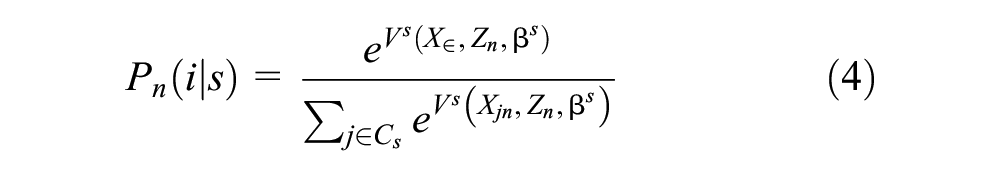
For example, the probability that an individual (n) belongs to a latent class (s) and selects transportation (i) is expressed as shown in Equation 4:
Because the class to which an individual belongs is unknown, reverse inference is performed based on individual characteristics, as shown in Equation 5:

where
Finally, the probability of an individual selecting an alternative (i) is expressed as shown in Equation 6 ( 33 ):

Therefore, the latent variable calculates the modal split and is useful for deriving a single group or type from multivariate category data. The components that represent latent class models as structural equation models include latent variables, measured variables, and measurement errors. Latent variables are difficult to observe directly, and in this study, they were described as propensities for traffic behavior or preference factors. Measured variables, such as responses to each item in the questionnaire, can be observed directly. Furthermore, they are used to indirectly measure the latent variables. “Error” refers to measurement error, and arrows indicate causality. In the case of K, the association between the two variables is shown, where a larger size indicates a higher association, as shown in Figure 3.
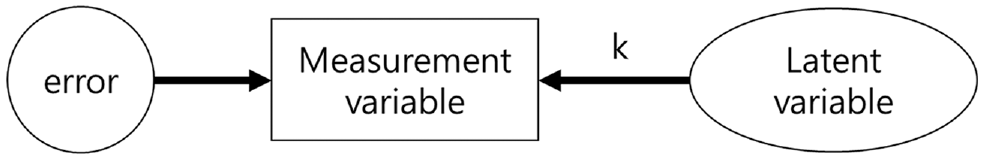
Relationship between latent and measurement variables.
This can be expressed via SEM, CFA, and EFA. For CFA, the appropriateness of maintaining a factor coefficient that is not theoretically applicable to zero is assessed statistically. This does not account for all observed variables. The covariance between the latent variables and error covariance between the measured variables can be explained. However, in this study, a new latent variable was created; therefore, EFA was applied based on the characteristics of the latent variable describing all the observed variables. The EFA process is shown in Figure 4, where “factor” is a latent variable factor, x1–x9 are measured variables, and e1–e9 are error variance (unique variance).
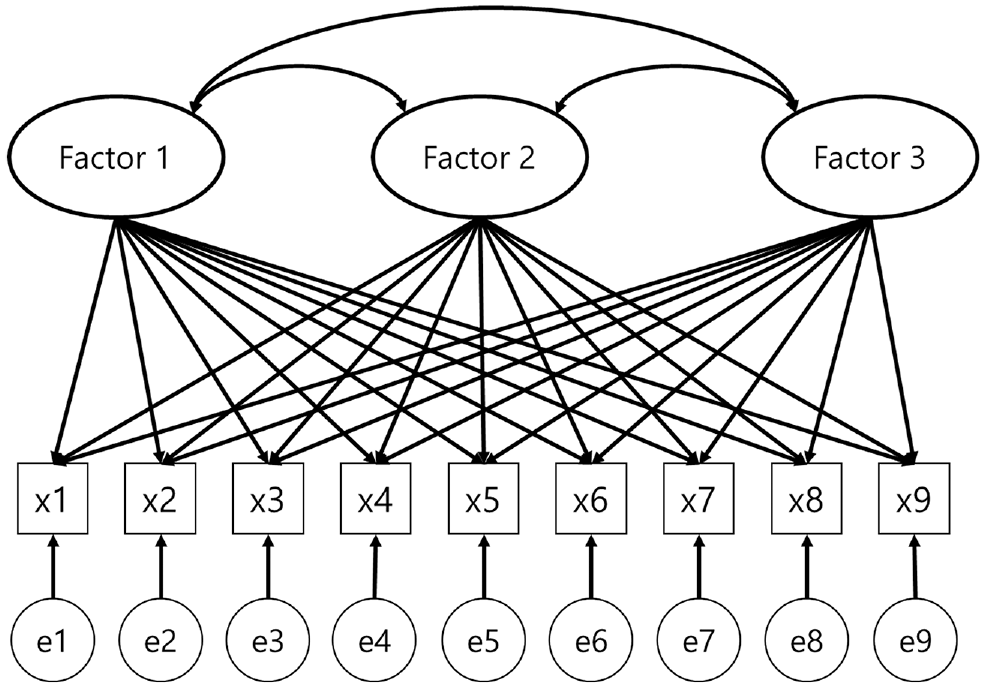
Exploratory factor analysis model.
Each latent variable was set to one for standardization. All measurement variables were assumed to exert an effect. It can be regarded as a realistic model in which the latent variable that describes the measurement variable already exists ( 34 ).
In addition, the three-step estimation method was used in the LCA employed in this study ( 35 ).
The Latent Class (LC) model was developed for a set of response variables. The latent class number was determined by comprehensively considering the feasibility of information compatibility, statistical verification (
The subjects were assigned to the latent class based on their posterior class membership probabilities. This involves estimating the most likely latent variable and determining the most likely group.
The association between assigned class membership and external variables was investigated using simple cross-tabulations or multiple logistic regression analysis.
Finally, the BIC and LL, which are typically used to evaluate the adequacy of the latent class model, were applied. This can be expressed as shown in Equation 7 ( 37 ):

where
Case Study
In the case study, a preference survey about transportation choices affected by the operation of the GTX was conducted to override the modal split model of the GTX. The GTX is constructed at a considerable depth, unlike the existing subway. It is a fast-traveling, out-of-vehicle, and time-consuming transportation. Users’ preferences or preference factors can affect the choice of the GTX. However, in general, the modal split model is built based on the travel time and transportation cost. Therefore, the modal split model of the GTX was estimated via LCA, which can reflect people’s preference factors and personalities. Therefore, the survey was designed by selecting the choice among SP expression methods. When applying the SP technique, it was primarily assumed that route selection and transportation selection situations were selected. The demand for routes and transportation were estimated by assuming routes or transportation with different travel times and travel costs, and the willingness to pay because of reduced travel time was estimated ( 27 ). An online survey was conducted on 1000 metropolitan railway users within and outside the GTX sphere of influence. Assuming a confidence level of 95%, a relative error of 5%, a population ratio of 0.35, nine responses, and a reserve rate of 10%, a total of 660 minimum samples and 330 samples per survey point were calculated. Accordingly, a survey was conducted using 1000 samples. Based on the residential location and GTX usage behavior of the users, the representative routes were established by classifying them into an inner circle (Gyeonggi–Gyeonggi, Seoul–Seoul) and an outer circle (Gyeonggi–Seoul), as shown in Figure 5.
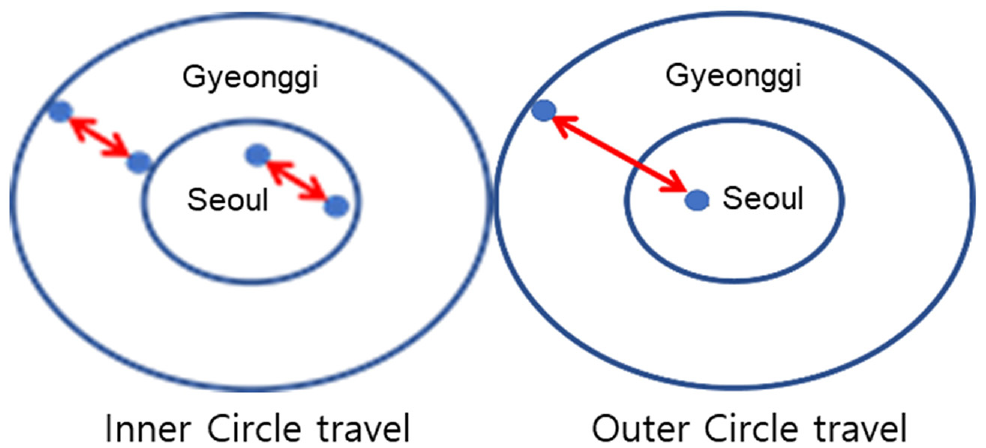
Selected survey points.
The SP survey combined attribute variables and levels via the design of experiments (DOE) to create a hypothetical situation. Therefore, the attribute variable of the survey that describes the effects of future environmental changes, such as the GTX, on metropolitan railways was composed of the travel time (out-of-vehicle time, in-vehicle time, and total travel time) and travel cost (operating cost). The results based on the inner and outer circles combined are presented in Table 2.
Results Based on Combination of Inner and Outer Circles
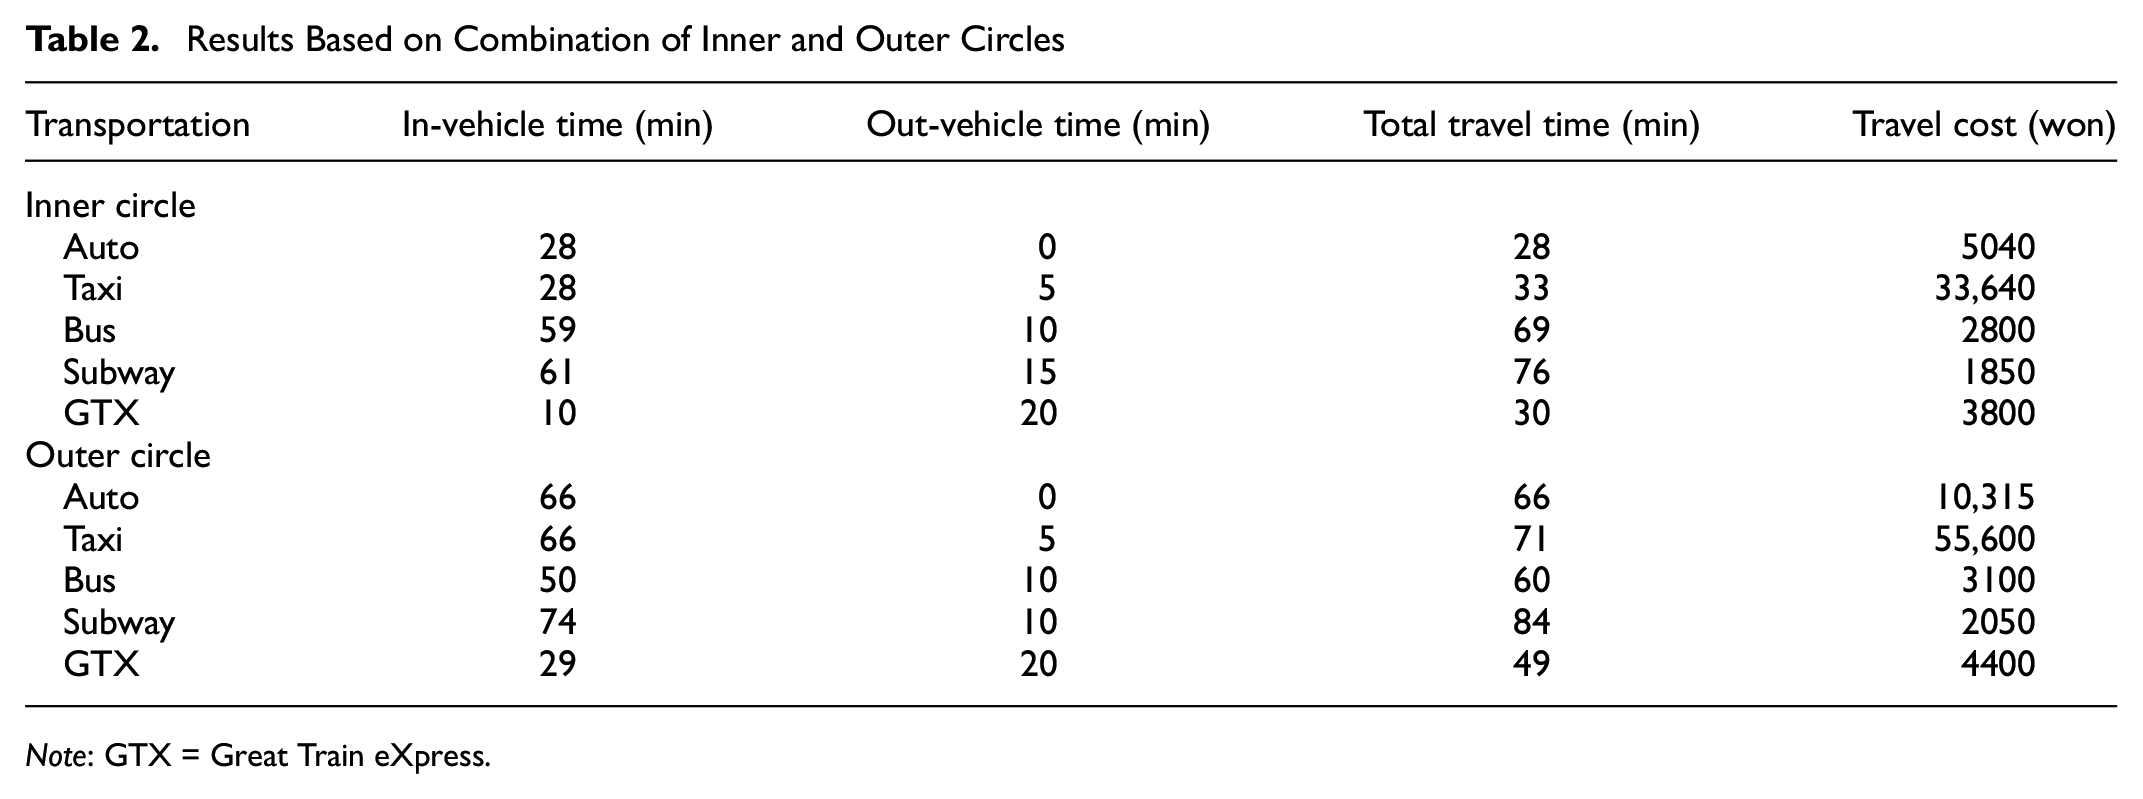
Note: GTX = Great Train eXpress.
When the attribute variable and level were determined, the change in the level was assumed to occur near the reference level. As the level change of the attribute variable required the question presented to the respondent to include a realistic preference, realistic level values for the SP survey design had to be set. The DOE is a technique that economically identifies optimal conditions for targets by selecting various factors that affect their characteristics and conducting experiments to identify their relationships ( 27 ). Therefore, a survey was conducted using 16 questions with 14 values of two-level attributes (Table 3).
Orthogonal Array for Stated Preference Survey Questionnaires
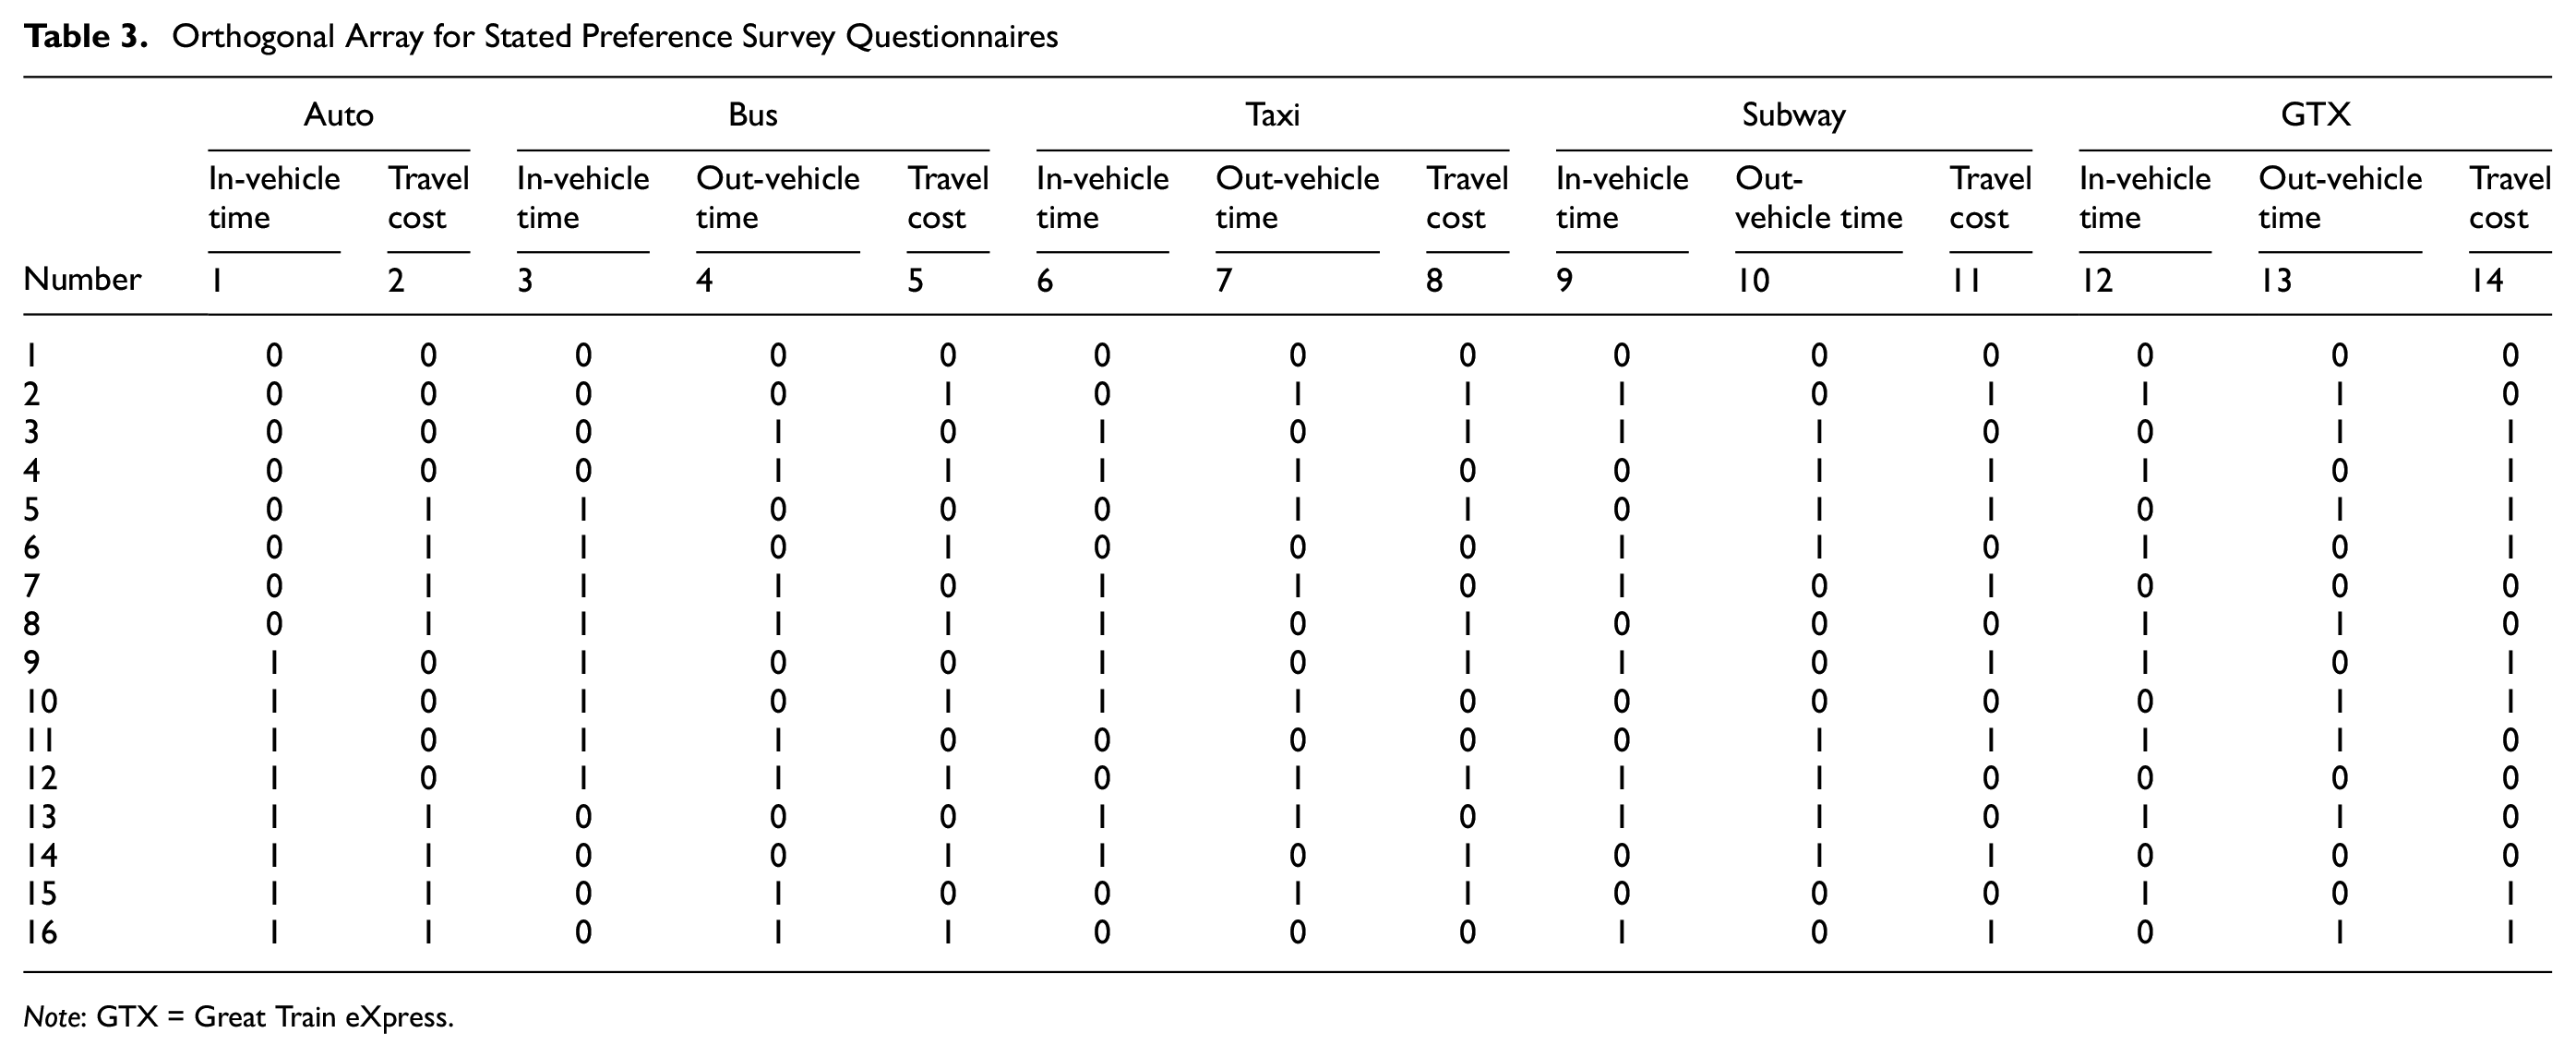
Note: GTX = Great Train eXpress.
In the SP survey, variables such as age and residence were considered. The age and mode characteristic variable values were applied to the model as consecutive values (Table 4). Subsequently, the BIC and LL were used to derive the number of latent variables. In general, to determine the number of latent classes, the information criteria were considered quantitative. Similarly, the significance and interpretation of the model parameters were considered qualitative. The BIC was used to determine the number of classes in the LCA, where three of the four classes were discovered to be the most appropriate. The GTX is characterized by being deeper than existing transportation. Although it can guarantee a short in-vehicle time, it may require a long out-of-vehicle time. In this survey, the questions listed in Table 4 were posed, and the latent class (i.e., latent variable) was obtained to distinguish them based on the user’s propensity. Accordingly, the latent class was classified into three categories, GTX travel property, GTX station property, and GTX transfer property, which reflect the meanings of preferring reduced total travel time, transportation access, and a minimum transfer, respectively, as shown in Table 5.
Personal and Transportation Characteristic Variables
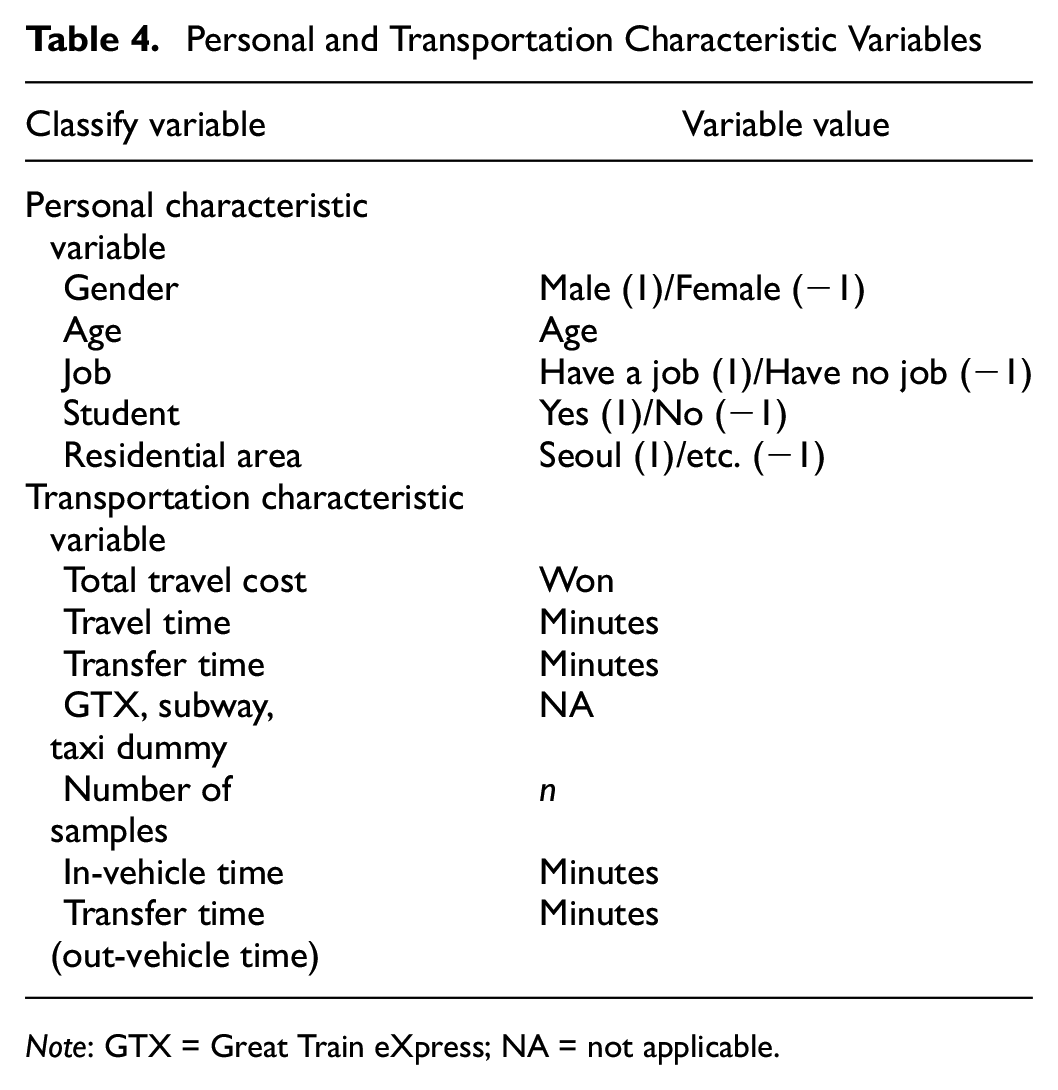
Note: GTX = Great Train eXpress; NA = not applicable.
Definition of Latent Variables and Related Questionnaires
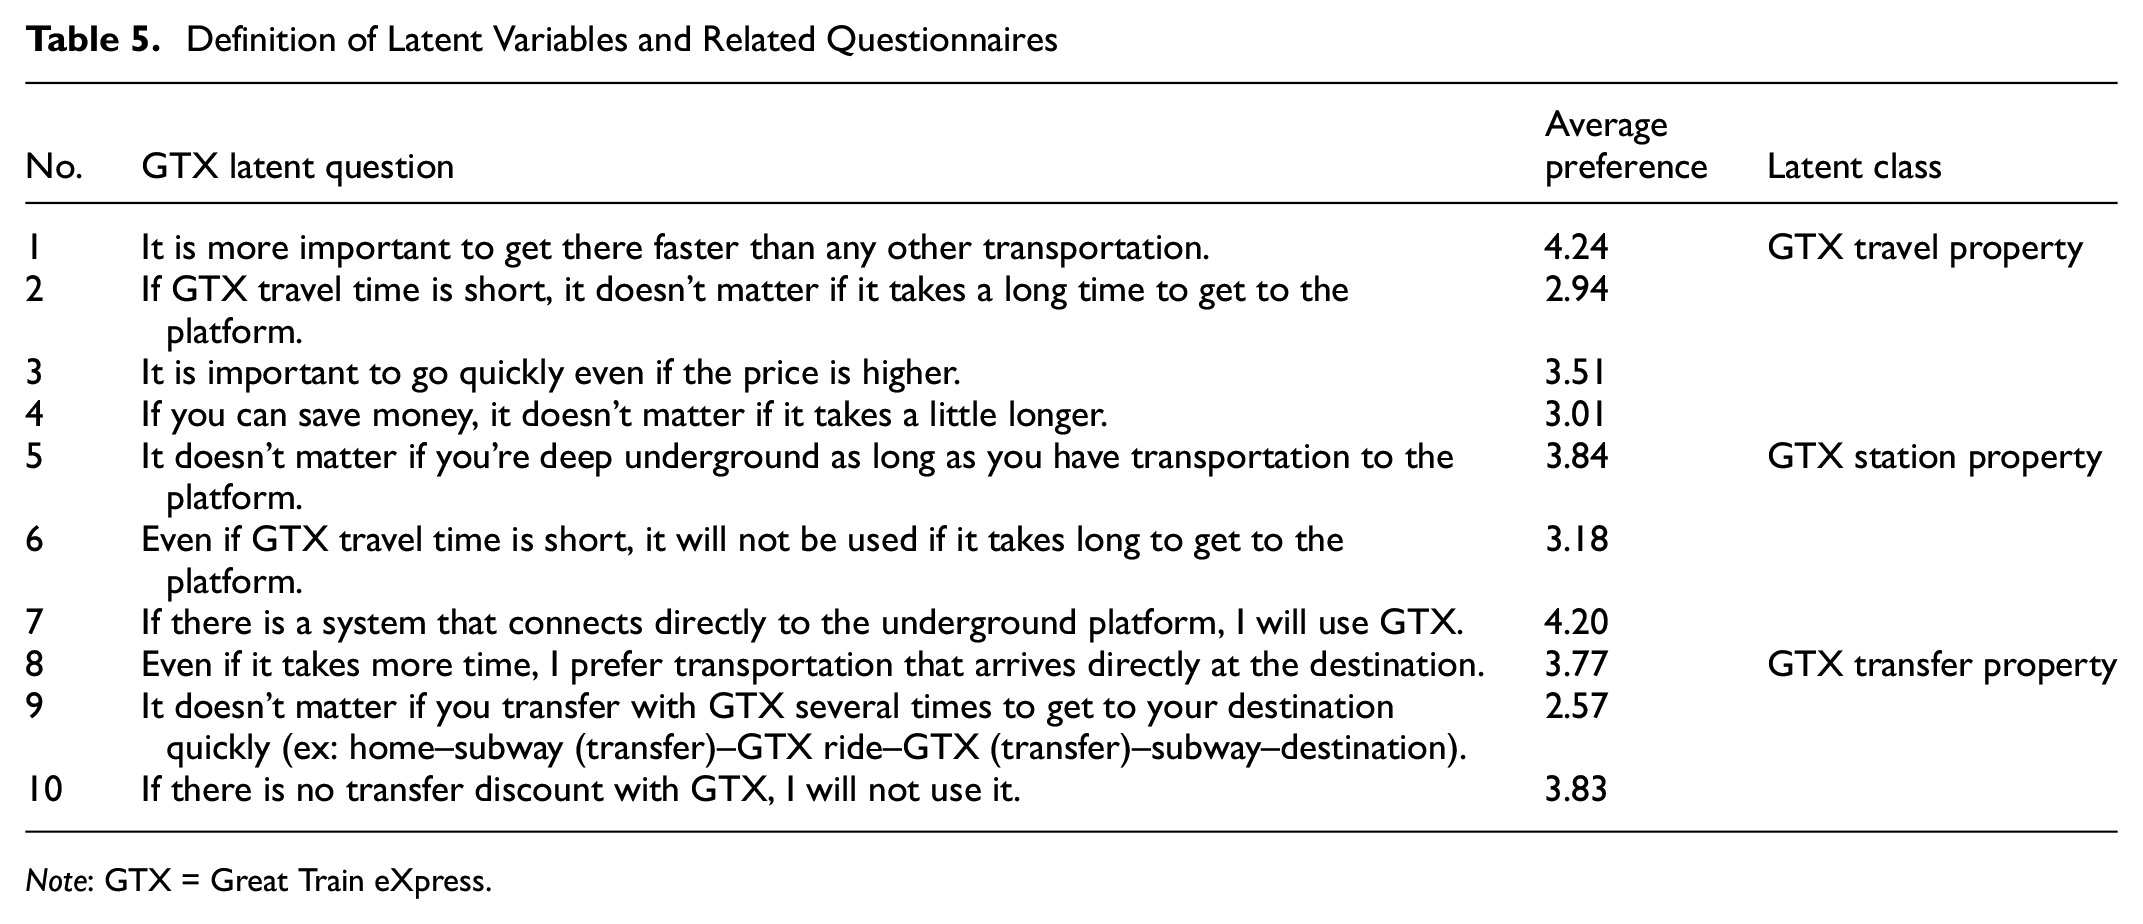
Note: GTX = Great Train eXpress.
Results
The results shown in Table 6 were obtained by integrating the SP model and the latent variable with the values shown in the SP model for 1000 people. For each inner and outer circle alternative, the coefficients of the modal split model, t-value, and LL were estimated. In both the inner and outer circle situations, the users preferred auto more than the other systems. With regard to gender, a higher preference was obtained for males than females. With regard to age, users aged 30–40 years preferred the GTX. The analysis considering SP + latent revealed the preference by including the latent variable in the modal split model. The results of two analyses were compared by adding latent variables to the SP and SP model analyses. The LCA categorized the cluster into three groups to determine people’s preferences for the future introduction of the GTX. It was discovered that transfer minimization with an estimated value of approximately −0.01784 was important to the inner circle, whereas the station position with an estimated value of approximately −0.0262 was more important to the outer circle. This implies that the smaller the number of transfers, the better the accessibility to the station, and the higher the use of the GTX. Therefore, factors such as GTX transit time, accessibility, and transfer minimization will affect the usage of the GTX. In addition, the statistical significance of the two models was verified using LL, the BIC, and chi squared. The higher the LL, the lower the BIC, and the more statistically significant the model. Statistical estimates indicated LL values of approximately −15,859 and −17,234 for the SP models and −15,712 and −17,205 for the SP and latent variable models. The BIC values were approximately 1.986 and 2.158 for the SP model alone, and approximately 1.970 and 2.156 when the SP model contained a latent variable.
Results of Model Estimation
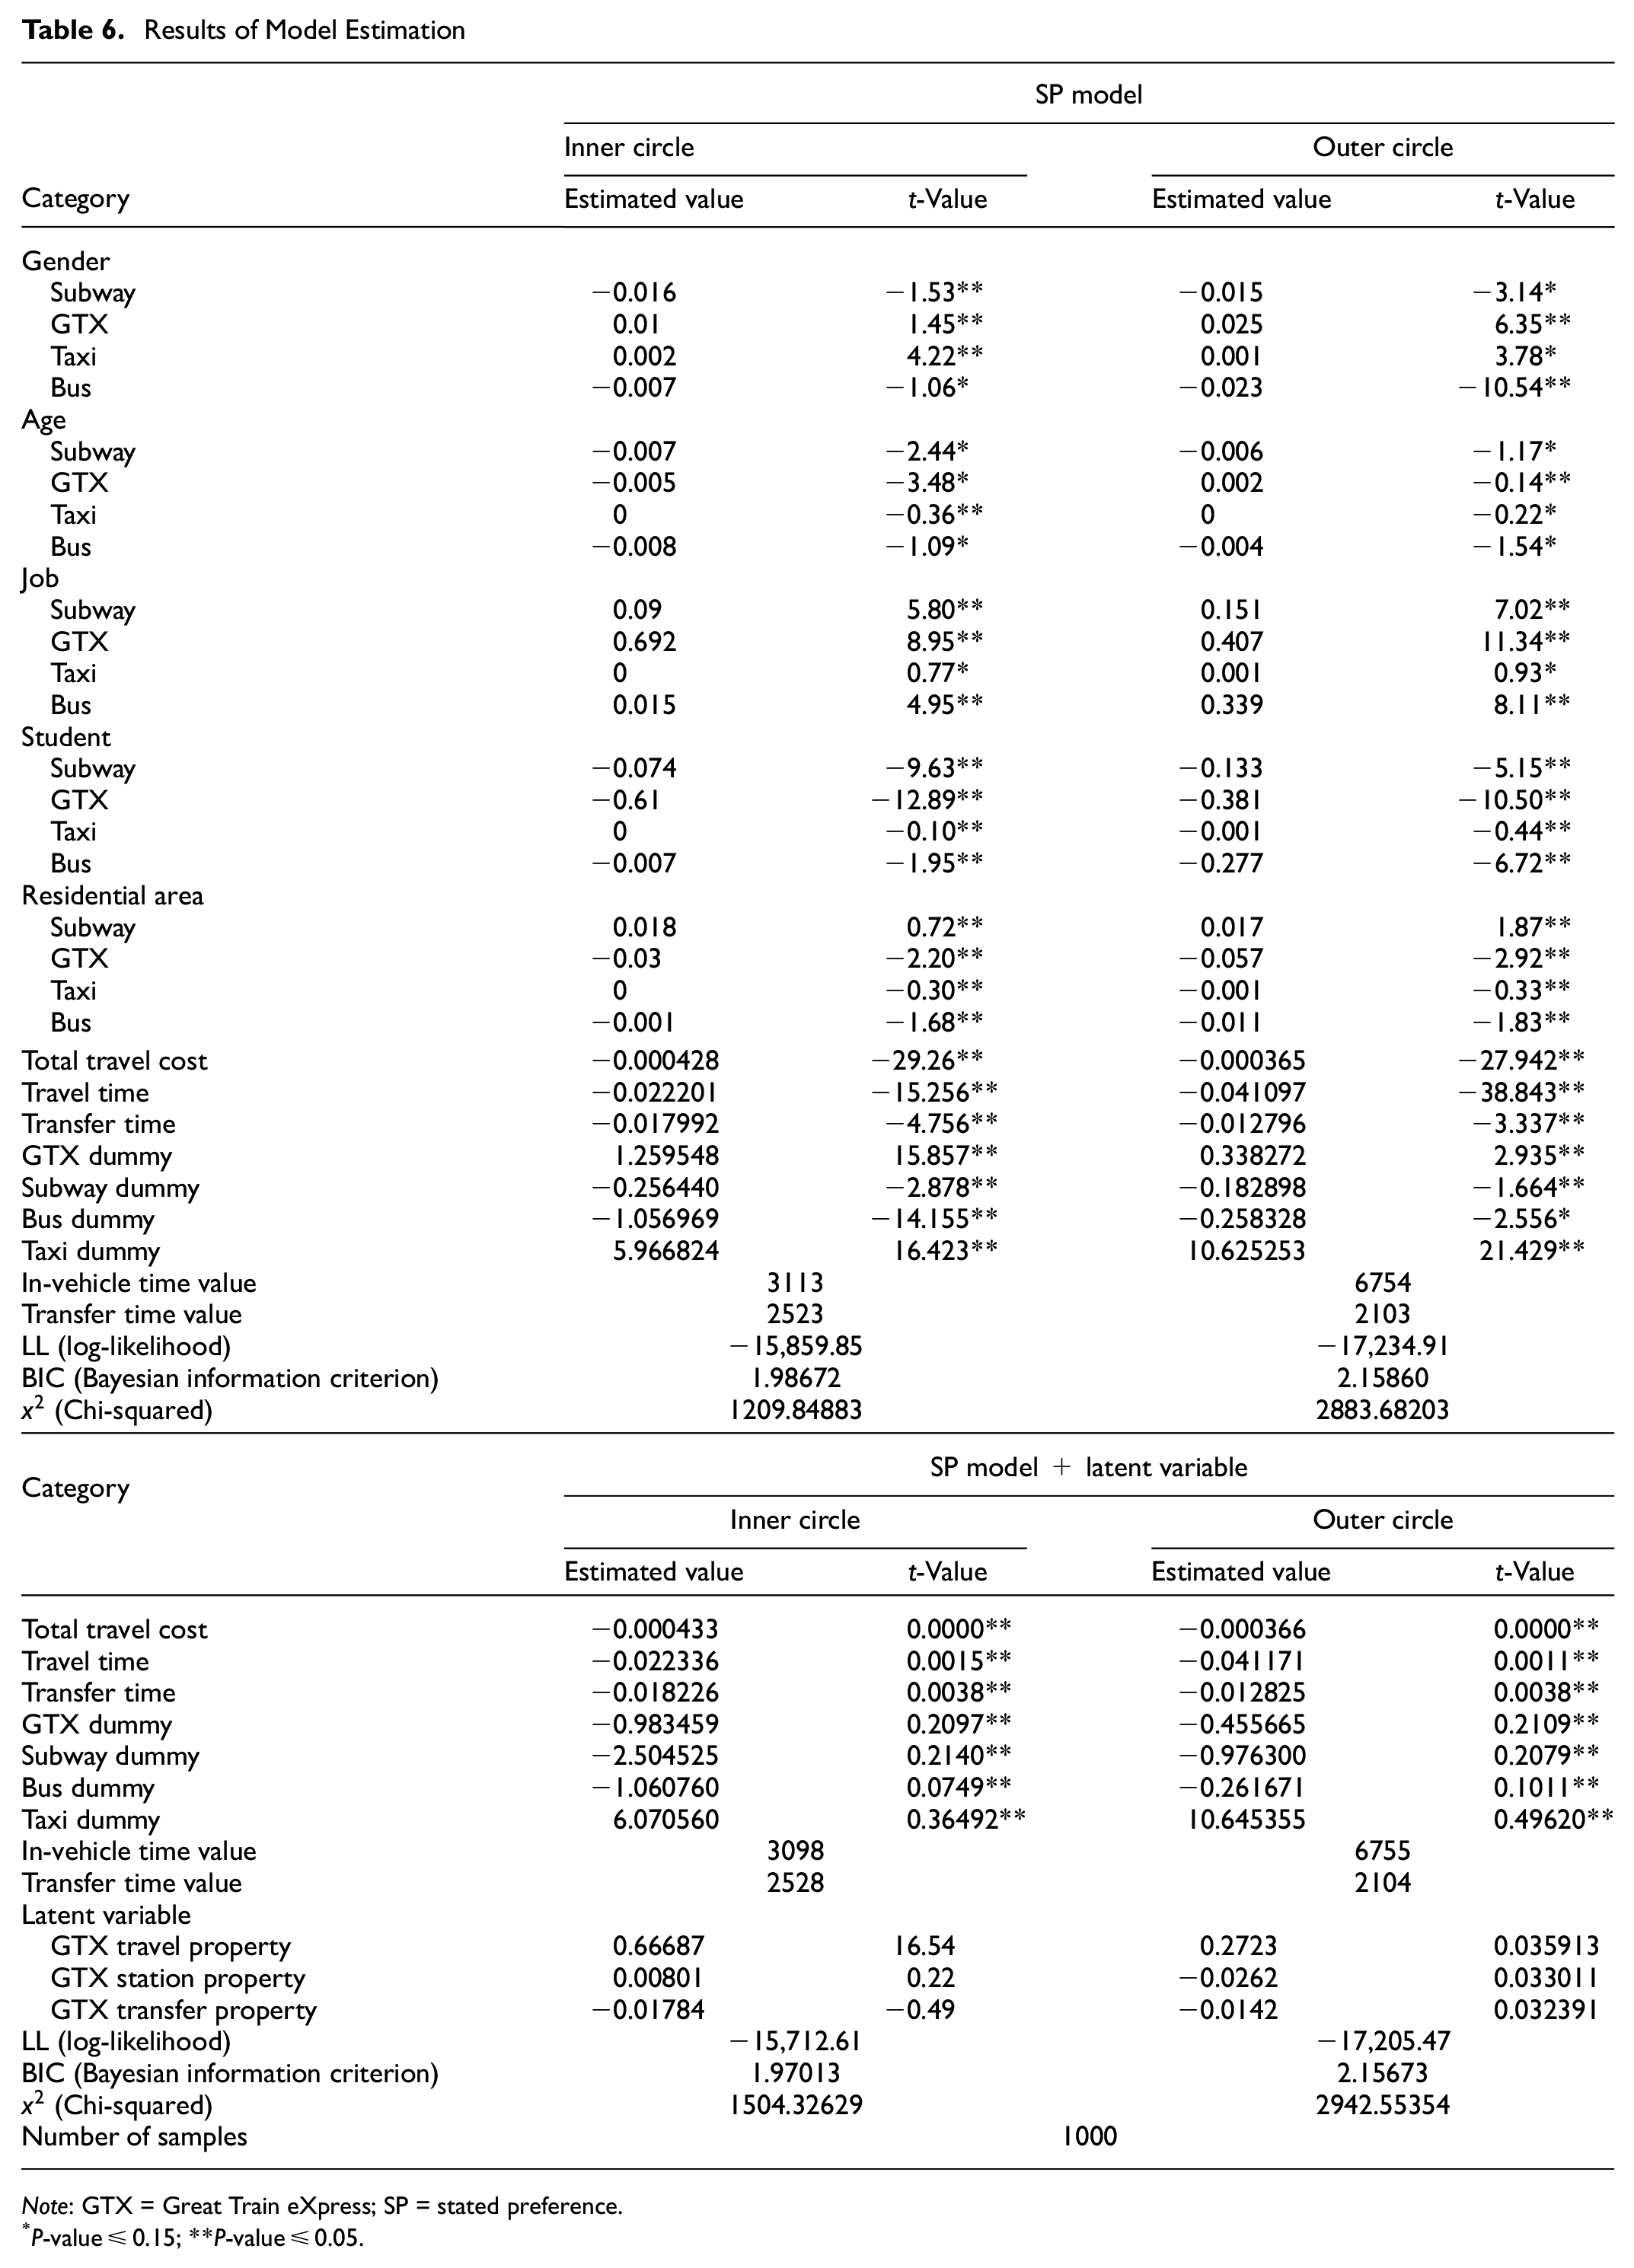
Note: GTX = Great Train eXpress; SP = stated preference.
P-value ≤ 0.15; **P-value ≤ 0.05.
Tables 7 and 8 show preferences for subway (with GTX), bus, auto, and taxi, for the inner circle and outer circle. When comparing the two situations, the GTX’s preference was higher in the outer circle than in the inner circle. This shows that although the travel cost and travel time differed in the two situations, the benefits of the GTX were more emphasized when traveling to different boundaries. Next, preference according to the basic state, SP model, and SP + latent variable was analyzed. As a result of analyzing the basic state, in the inner circle situation, the preferences were auto, bus, subway (with GTX), taxi. However, in the outer circle situation, the preferences were auto, subway (with GTX), bus, taxi. In addition, the same results were observed in the SP model. When comparing the basic state and SP model (SP + latent model), the mode change to subway (with GTX) increases because the suitability of the model improved. In the SP + latent (travel property), the auto preference decreased compared to the basic state, and subway (with GTX) preference increased. In addition, when comparing the GTX travel property and GTX station property, the transfer preference was lower. As a result, the preference has increased in the SP model and the SP + latent model including the GTX.
Preference for Each Model
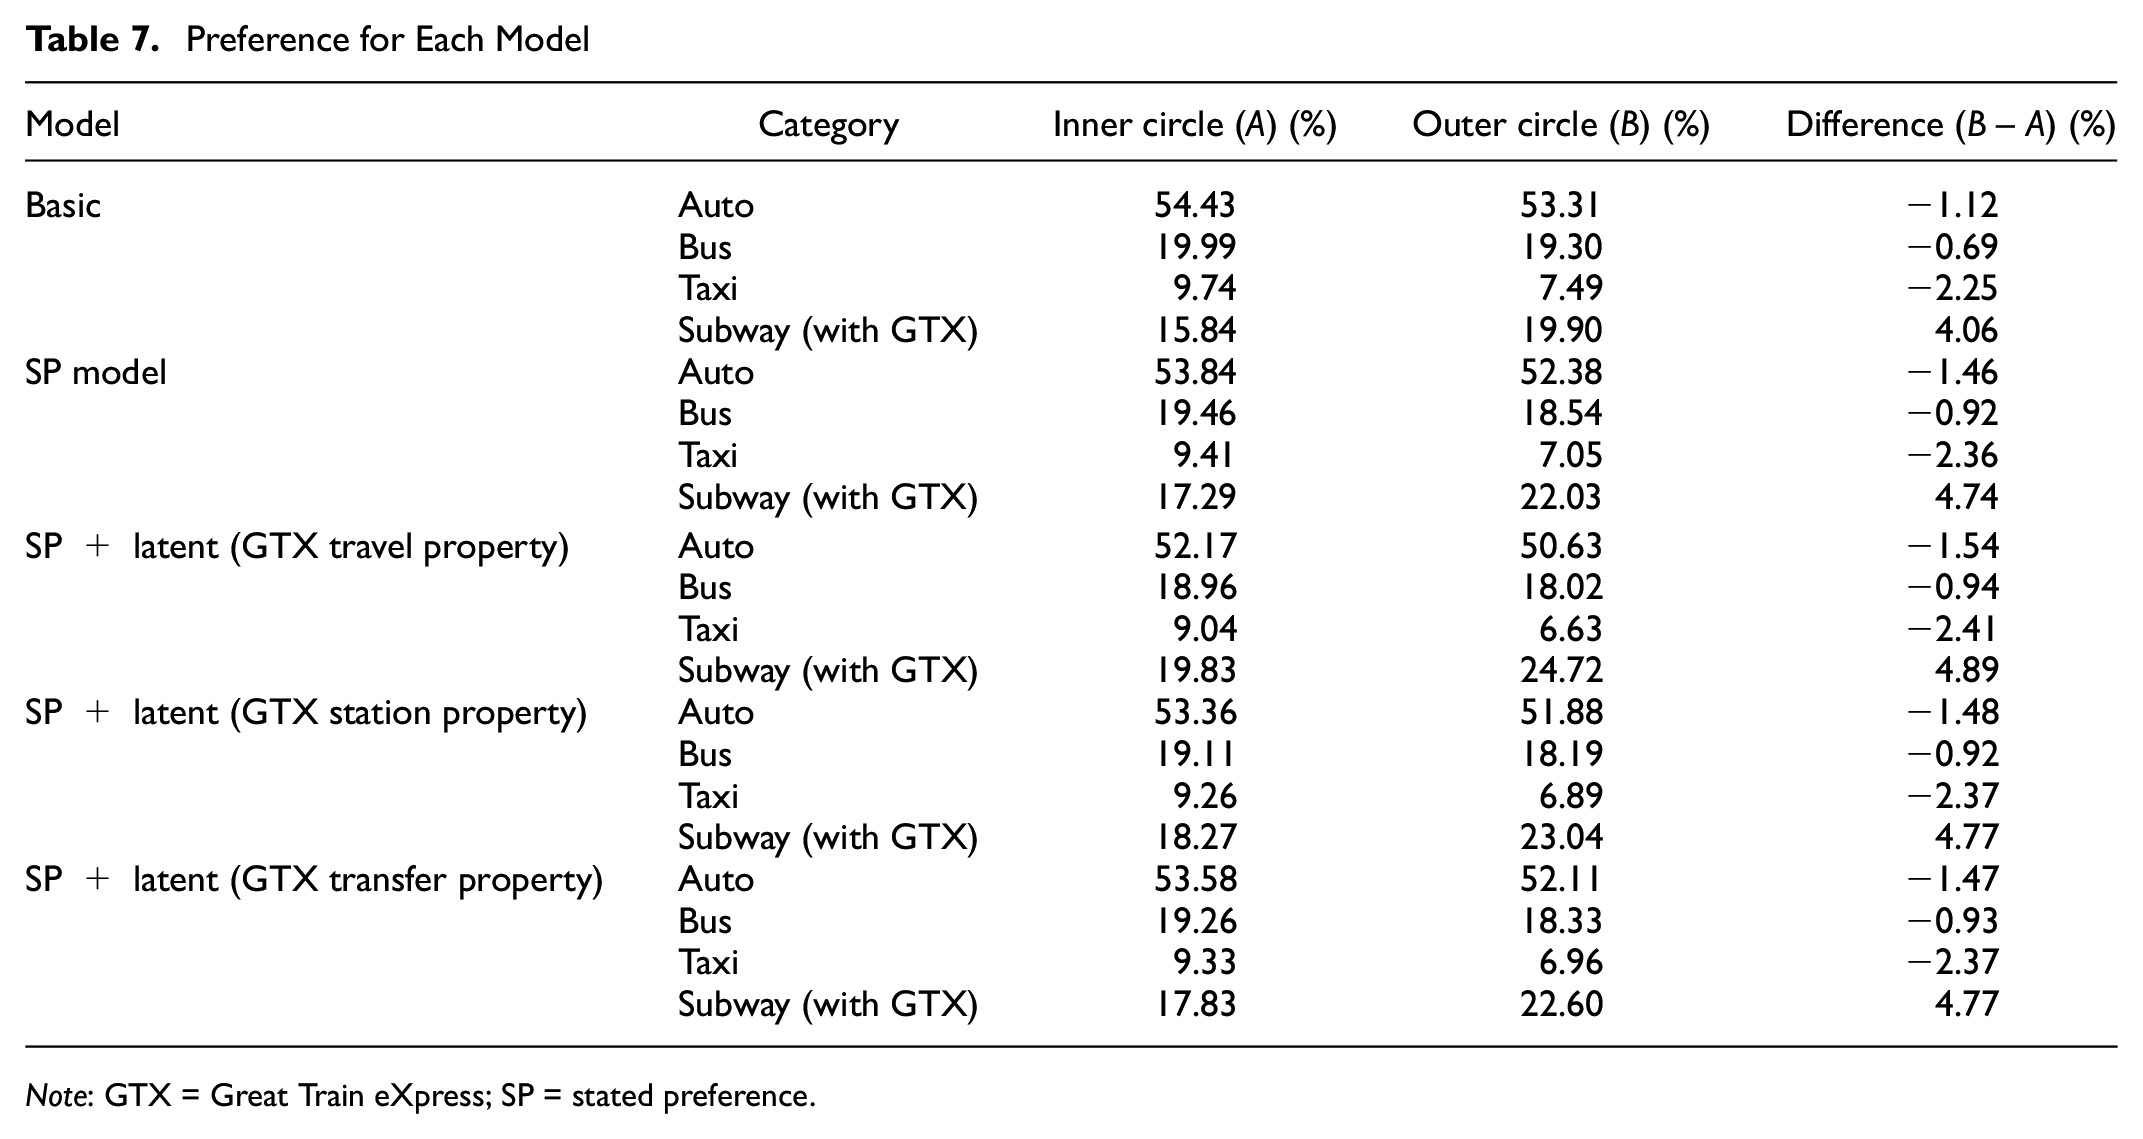
Note: GTX = Great Train eXpress; SP = stated preference.
Difference From Basic State
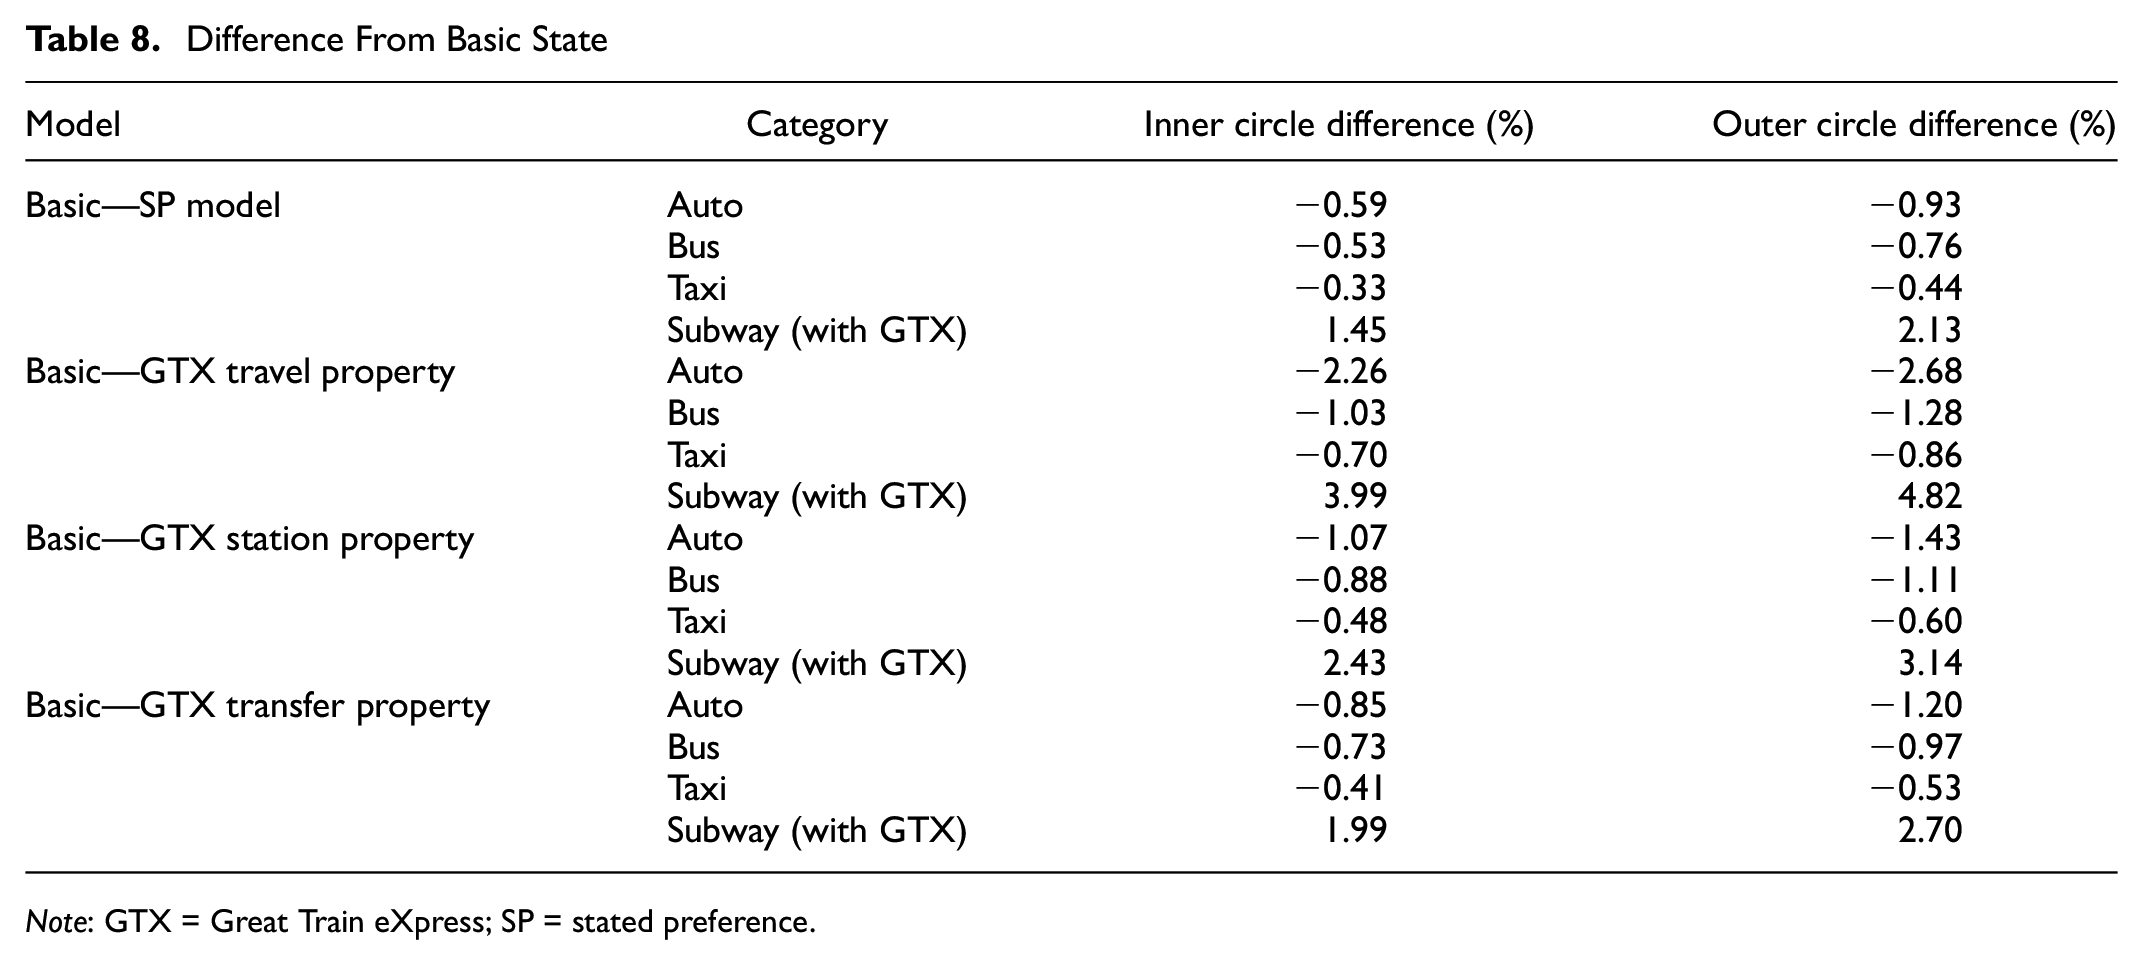
Note: GTX = Great Train eXpress; SP = stated preference.
This shows that the degree of fit for the model was higher when the latent variable was applied. Therefore, the addition of the latent variable afforded higher effectiveness and improved the fit of the model. These results are similar to those of previous studies that explain people’s traffic and behavior with regard to the choice of mode of transportation. Moreover, it supports the conclusions of Wen et al. ( 14 ), Tawfik and Rakha ( 15 ), and Ben-Akiva et al. ( 5 ), which indicate that latent models are superior to other modal split models, as they reflect people’s preferences. The t-statistic values of each dummy variable were included in P-value ≤ 0.05 and P-value ≤ 0.15; therefore, including the latent variable was appropriate.
The modal split models of the GTX and other modes of transportation are expressed as follows (Equations 8–12):

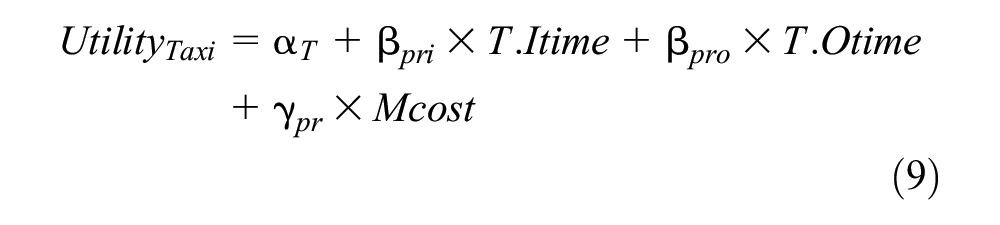


where
Conclusion
In this study, the modal split model was redefined by adding latent variables, including preferences that have not been sufficiently explained by existing socio-economic and transportation attributes. People’s potential travel behavior significantly affects the mode choice ( 4 ). In other words, mode choice behaviors that cannot be sufficiently explained by individual socio-economic attributes and mode attributes can be explained using latent variables. In existing studies about mode choice, less realistic components in the current modal split model were rectified by adding a constant value to the coefficient ( 2 ). Therefore, in this study, practical components were added based on theory by including values that reflect people’s preference factors as constants. Consequently, the explanatory power was higher when a latent variable was added compared with the modal split model based on the existing SP model. This was confirmed via a case study, and models for subway and other new modal split models were derived based on the construction of the GTX in Seoul. A SP survey was conducted on 1000 potential users of the GTX, and factor analysis was performed for the LCA to define the latent variables. In particular, the latent variable was used to classify the cluster into three categories based on the BIC and LL values to determine people’s preferences for the future introduction of the GTX. Subsequently, the inner and outer circles were categorized based on the boundaries to derive dummy and estimated values. The LCA results showed that factors such as GTX transit time, access to station, and transfer minimization can affect the GTX demand and modal split models. In particular, transfer minimization was more important to the inner circle, whereas access to station was more important to the outer circle. Passenger traffic behavior was quantified effectively by applying a latent variable to the SP model. Furthermore, statistical analysis confirmed that a more accurate and reasonable analysis of mode choice behavior can be realized when the modal split model is improved by the incorporation of a latent variable. Therefore, it was discovered that LCA, which supplements the disadvantages of the SP model, is appropriate for analyzing the selection behavior for new transportation.
This study is useful for suggesting a model that can accurately reflect the characteristics and preferences of passengers by redefining the modal split model of the new mode, such as higher-speed rail. By performing Stated Preference Analysis (SPA) using latent variables, it is envisioned that strategies for the inner and outer circle situations will be established in the future, and that operational efficiency can be achieved by combining the GTX and subway. In addition, a more reasonable modal split model can be derived by considering the preferences of each user for the new transportation mode. The model used in this study is specific to Seoul. However, socio-economic indicators and transportation characteristics are different not only in Seoul but also in each country, so different surveys should be conducted to derive the parameters even if the same methodology is applied. A more realistic model can be constructed by reflecting the socio-economic indicators and preference characteristics of each country. In addition, it is envisioned that the accuracy of the model will be improved using more samples to reflect individual preferences and characteristics. Therefore, many samples are required, and in future studies, the accuracy of the model can be improved by adding respondents to various transportation users.
Footnotes
Author Contributions
The authors confirm contribution to the paper as follows: study conception and design: D. Ku and M. Choi; data collection: H. Oh and S. Lee; analysis and interpretation of results: D. Ku, S. Na, M. Choi, H. Oh, M. Choi, H. Oh; draft manuscript preparation: D. Ku, H. Oh, S. Lee. All authors reviewed the results and approved the final version of the manuscript.
Declaration of Conflicting Interests
The author(s) declared no potential conflicts of interest with respect to the research, authorship, and/or publication of this article.
Funding
The author(s) disclosed receipt of the following financial support for the research, authorship, and/or publication of this article: This paper was financially supported by the Korea Ministry of Land, Infrastructure, and Transport (MOLIT) as an Innovative Talent Education Program for Smart City, the Basic Study, and Interdisciplinary R&D Foundation Fund of the University of Seoul (2019) and the Ministry of Education of the Republic of Korea and the National Research Foundation of Korea (NRF-2017R1D1A1B06032857).