
Abstract
The advent of vehicle-to-everything (V2X) communication technology, as well as driving automation that is happening at a rapid pace, enables the potential for transforming the transportation system. The near future will, therefore, bring the coexistence of human-driven vehicles (HVs), connected vehicles (CVs), and connected and automated vehicles (CAVs). Correspondingly, platoon management based on V2X communication is expected to improve traffic capacity and fuel efficiency. However, there is a lack of analysis of the impact of platoon management on heterogeneous traffic combined with CVs. Moreover, V2X communication limitation is usually dismissed in existing studies. To address these limitations, this paper explores the impact of platoon management on the capacity of heterogeneous-traffic environments under different CV and CAV market penetration rates (MPRs) with the fundamental diagram considering V2X communication limitations, and further studies the changes in capacity and fuel efficiency of traffic combined with different platoon sizes. Firstly, in light of platoon management, we propose the heterogeneous traffic configurations through distribution characteristics of nine types with simulated models. Secondly, the fundamental diagram considering platoon management with V2X communication limitation is proposed under different CV and CAV MPRs. Thirdly, numerical simulations are conducted to demonstrate the impact of platoon size on the changes in capacity and fuel efficiency of traffic. Conclusions are drawn from the results of the simulations: with the cooperation of CVs and CAVs, the traffic capacity and the fuel efficiency will be promoted, particularly under high CV MPR or high CAV MPR environments.
Keywords
Enhancing fuel efficiency and reducing emissions has become a critical focus of transportation research. Because the connectivity and automation of vehicles have been enhanced dramatically, connected and automated vehicles (CAVs) are expected to promote the intelligent transportation system to enhance traffic safety and throughput, as well as fuel efficiency ( 1 – 4 ). Vehicles are allowed to drive under partial or full automation using information from onboard sensors through vehicle-to-everything (V2X) communication ( 5 ). More specifically, CAVs can optimize their trajectory to improve vehicle operating efficiency by exploiting the shared look-ahead traffic information ( 6 ). Predictably, the CAV market penetration rate (MPR) will gradually increase in the next decade ( 7 ). Meanwhile, the number of connected vehicles (CVs) that allow the exchange of information through different communication channels is also increasing steadily; CVs upgrade human-driven vehicles (HVs) with connected-vehicle communication technology. Thus, there should be a long-term heterogeneous traffic scenario where HVs, CVs, and CAVs coexist.
Owing to V2X communication, CVs and CAVs are guaranteed to exchange vehicle information (i.e., vehicle type, speed, position, acceleration, etc.) and perform collaborative tasks. Simulation results and field experiments uncover that traffic-flow stability and capacity could be affected by CAVs ( 8 – 12 ). However, in existing studies, the research on heterogeneous traffic flow was mainly focused on discussing the influence brought by CAVs under different CAV MPRs in an environment where just CAVs and HVs were mixed ( 10 , 13–16). Some other publications dismissed the car-following behavior differences between a mixture of vehicle categories ( 17 , 18 ). To the best of our knowledge, very few efforts have been undertaken to explore the stability in the context of heterogeneous traffic composed of HVs, CVs, and CAVs on the road. However, there is a considerable difference between the car-following behaviors of CAVs, CVs, and HVs. Thus, it is necessary to capture the performance of different types of vehicles in the heterogeneous traffic and explore the interaction between them.
A platoon is made up of a leader and none or several followers, and the followers usually maintain a smaller and approximately constant time headway. Particularly, it is generally accepted that the cooperatively controlled CAV can maintain a shorter time headway between vehicles ( 19 ). Therefore, continuously connected vehicles in a platoon could coordinate through V2X communication to improve traffic efficiency. Most of the previous studies on platoons consisting of CAVs have assumed that the CAV string can be infinitely long ( 20 , 21 ). This assumption might be unreasonable, since there exists the limitation of the communication distance of the V2X protocol equipped by CVs. For better information processing and to prevent communication abnormalities, it is reasonable for a long platoon to be split into sub-platoons and follow the platoon management strategy. This suggests that CVs/CAVs beyond the V2X communication range form a new type of CV/CAV which fails to achieve the communication gain from the platoon leader and become a new leader of a sub-platoon ( 22 , 23 ). Thus, when the CV MPR and CAV MPR are not too low, there will be multiple sub-platoons led by different leaders in a CV platoon string.
To date, most of the existing research is concentrated on the influence of CAVs on the capacity and stability of heterogeneous traffic flow ( 24 – 26 ). However, under platoon organization, and ignoring the impact of CVs, these researches lack a comprehensive construction of theory.
This paper focuses on the impact of platoon management on heterogeneous traffic, where the behaviors of CVs, CAVs, and HVs are differentiated. Moreover, the V2X communication limitation is taken into consideration during platoon management. The main contributions of this paper are twofold: 1) We developed a theoretical formula of macroscopic fundamental diagram with platoon management combined with V2X communication limitation under different CV and CAV MPRs, and 2) We examined the impacts of platoon size on the traffic capacity and fuel efficiency change with MPRs.
The remainder of the paper is outlined as follows. The next section specifies some basic concepts and models on the platoon management strategy for heterogeneous traffic used in the following analyses beforehand. The section after that entails a theoretical derivation of the fundamental diagram considering V2X communication limitation. The penultimate section describes the simulation set-up and the associated results. The final section draws conclusions and provides an outlook on future research.
Platoon Management for Heterogeneous Traffic
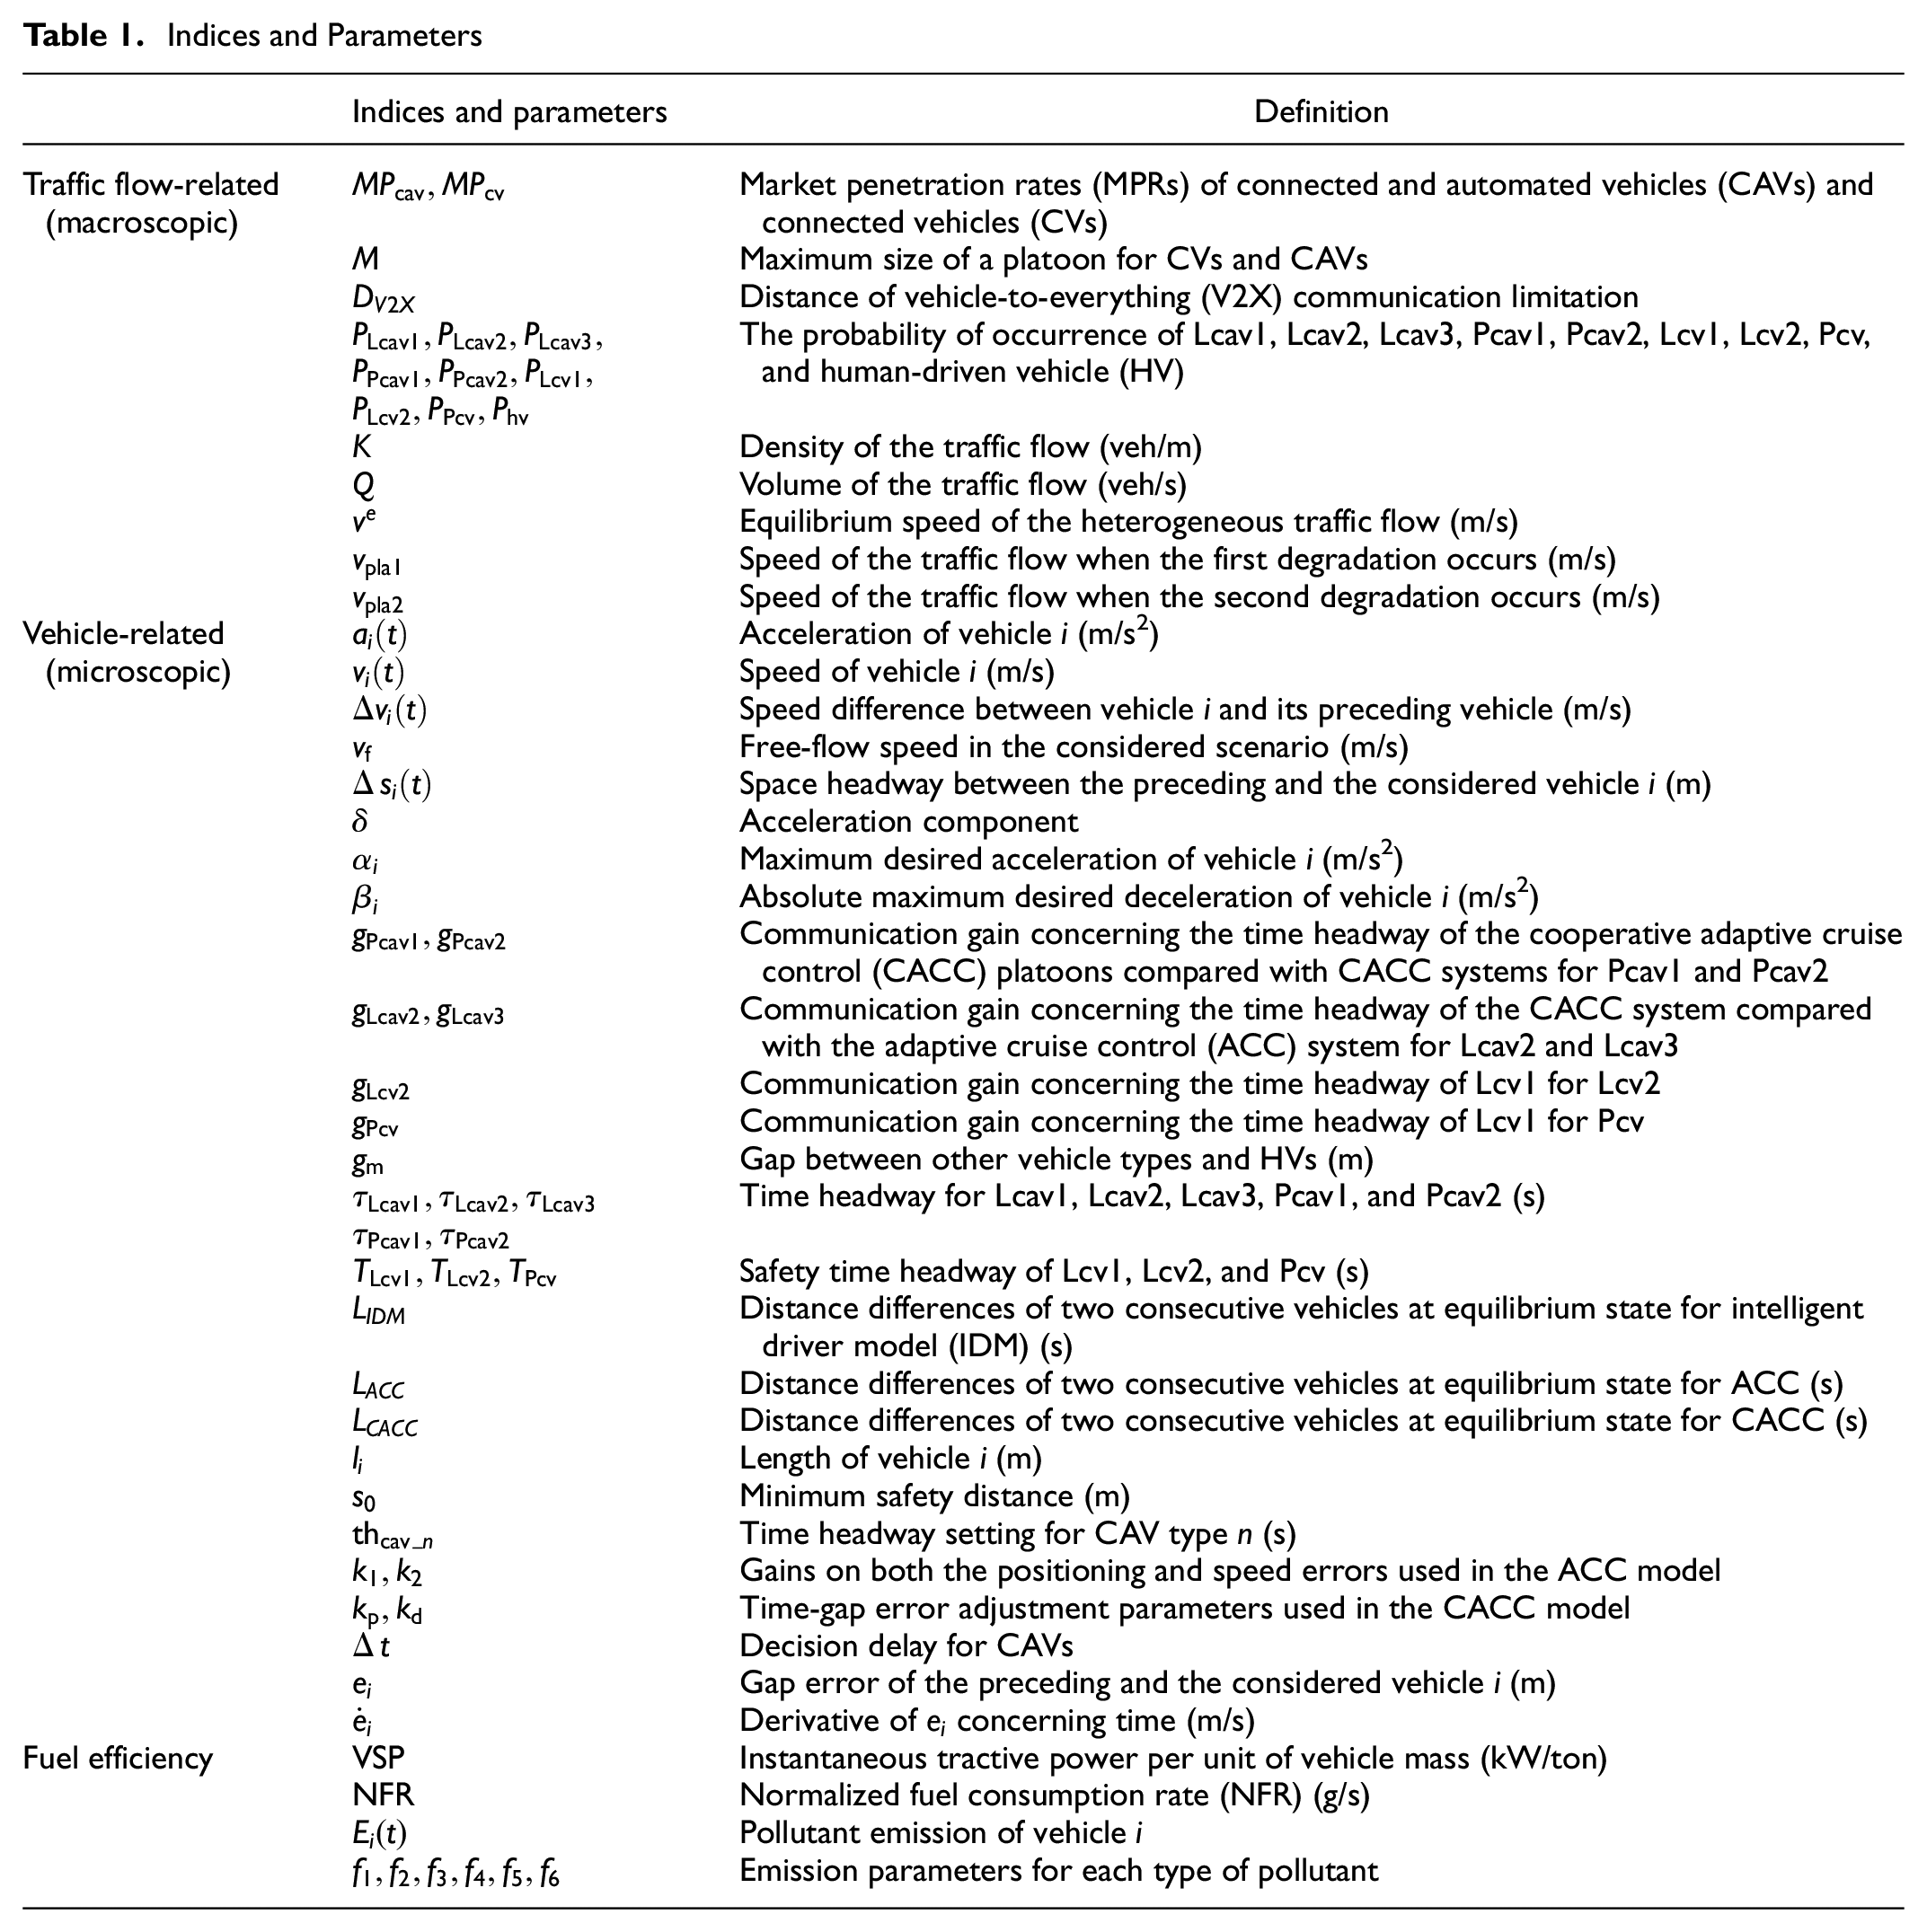
This section presents a platoon management strategy of heterogeneous traffic with the limitation of the maximum V2X communication bandwidth in a single-lane-road setup and elaborates on the distribution characteristics. Table 1 lists the indices and parameters utilized hereafter and presents their definition.
Indices and Parameters
Platoon Management Strategy
Thanks to the introduction of V2X communication, vehicles connected to networks (CVs and CAVs) can develop platoons. With the aim of avoiding forced communication abnormalities, CVs and CAVs have to be split into several small platoons when their numbers exceed the limit of the maximum V2X communication bandwidth, then the rest of the vehicles will form new platoons, thus forming a larger platoon string. In Figure 1a, the dynamic information flow topology (IFT) of each platoon is predecessor following (PF), whereas the IFT between each platoon is predecessor-leader following (PLF) ( 25 , 27 ). Vehicles send their “type” information to the following vehicle and send their “state” information (i.e., position, speed, and acceleration) to vehicles inside the platoon through V2X. The speed difference and the gap between a preceding HV and a following CV or CAV can be measured by radar equipment on vehicles. As shown in Figure 1b, vehicles connected to networks can compare the information from radar and V2X. As such, a CV or CAV can judge whether the preceding vehicle is an HV and confirm it is a leader in a platoon.

Schematic of heterogeneous traffic platoon management: (a) dynamic information flow topology (IFT) setting for heterogeneous traffic and (b) schematic diagram of vehicles judging whether the preceding vehicle is a human-driven vehicle (HV).
The heterogeneous traffic has been categorized into nine types of vehicle. Figure 2 illustrates different vehicle types and their time headway in heterogeneous traffic:
Human-driven vehicle (HV): Regular cars maneuvered by human drivers.
Leader connected automated vehicle 1 (Lcav1): The leading CAV of the first platoon following an HV that merely transmits information to its following vehicles.
Leader connected automated vehicle 2 (Lcav2): The leading CAV of the following platoons following a platoon that merely obtains information from its preceding vehicle that is a CAV.
Leader connected automated vehicle 3 (Lcav3): The leading CAV of the next platoon follows a platoon that merely obtains information from its preceding vehicle that is a CV.
Platoon connected automated vehicle 1 (Pcav1): The CAV inside the platoon obtains information from both the preceding vehicle and the platoon leading vehicle (the preceding vehicle is a CAV).
Platoon connected automated vehicle 2 (Pcav2): The CAV inside the platoon obtains information from both the preceding vehicle and the platoon leading vehicle (the preceding vehicle is a CV).
Leader connected vehicle 1 (Lcv1): The leading CV of the first platoon following an HV that merely transmits information to its following vehicles.
Leader connected vehicle 2 (Lcv2): The leading CV of the following platoons following a platoon that merely obtains information from its preceding vehicle.
Platoon connected vehicle (Pcv): The CV inside the platoon obtains information from both the preceding vehicle and the platoon leading vehicle.

Vehicle types with different time headway in heterogeneous traffic: (a) human-driven vehicles (HVs), (b) connected vehicles (CVs), and (c) connected and automated vehicles (CAVs).
On the basis of the composition of the heterogeneous traffic described above, the gap between vehicles is presented below. During driving, human drivers cannot maintain a constant time headway. Thus, the parament
The five types of time headway for CAVs can be expressed in light of the time headway of Lcav1 as Equation 1, while the three types of safety time headway set for CVs can be formulated as Equation 2.


where
Distribution Characteristics
The proportions calculation process of each type of vehicle is formulated in this part. Provided that the maximum number of vehicles in the platoon is M and there are only three categories of vehicles (HVs, CVs, and CAVs), the probability of CVs is denoted by


where
P Lcav1 = the probability of occurrence of Lcav1,
P Lcav2 = the probability of occurrence of Lcav2,
P Lcav3 = the probability of occurrence of Lcav3,
P Pcav1 = the probability of occurrence of Pcav1,
P Pcav2 = the probability of occurrence of Pcav2,
P Lcv1 = the probability of occurrence of Lcv1,
P Lcv2 = the probability of occurrence of Lcv2,
P Pcv = the probability of occurrence of Pcv, and
P hv = the probability of occurrence of HV.
Thus, the probability of each type of vehicle can be calculated. The proportion of Lcav1 means the probability of a CAV following an HV, which is calculated as:

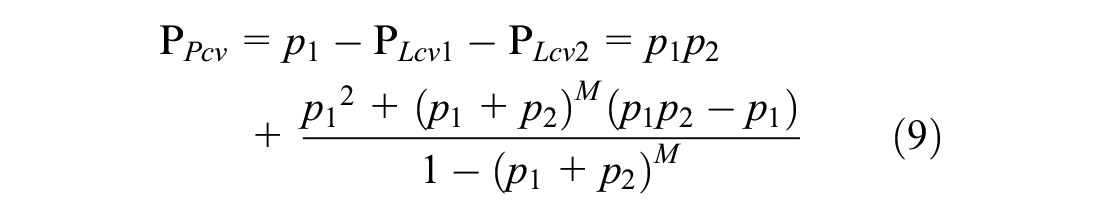
Similarly, the proportion of Lcv1 means the probability of a CV following an HV, which is calculated as Equation 7:

When the number of CVs mixed with CAVs exceeds the maximum platoon number,
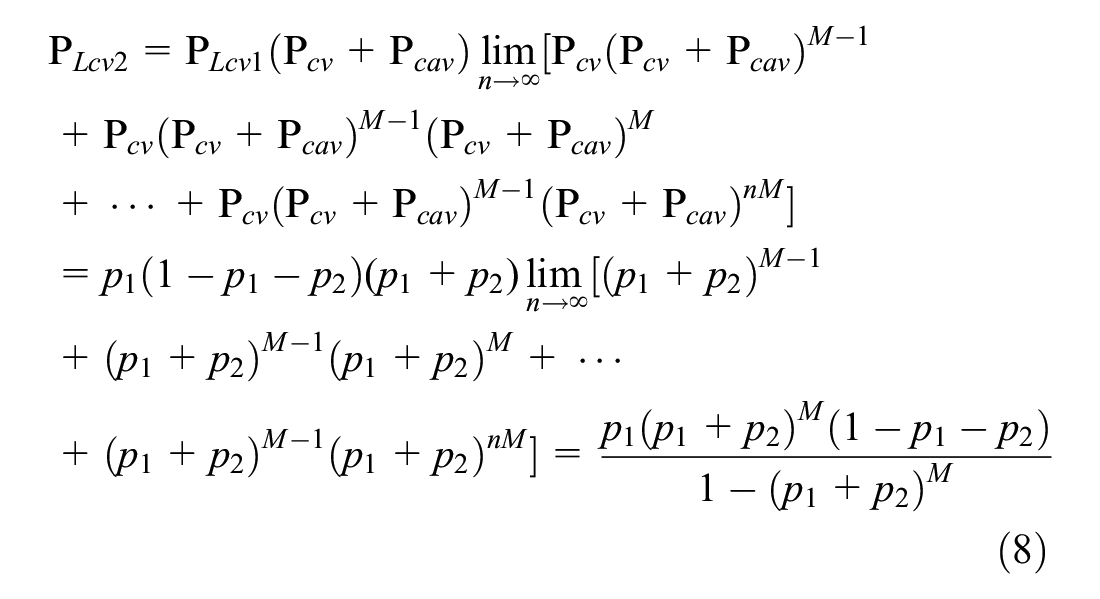
For CAVs, there are two relationships between Lcav2, Lcav3, and Pcav2:

The proportion of Lcav3 is the sum of the probabilities of the leading platoon vehicle following a CV apart from the first platoon.

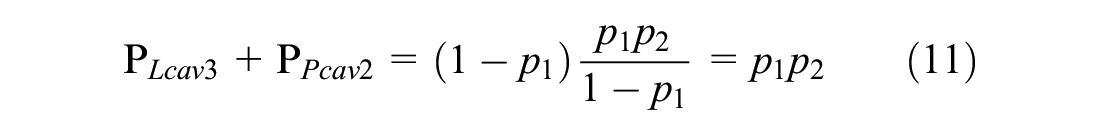
Therefore, the proportion of the Lcav2 and Pcav2 can be calculated by Equations 10 to 12:


As a consequence, the proportion of Pcav1 is:
Fundamental diagram of heterogeneous traffic: (a) pure vehicles environment, (b) connected vehicles (CVs) mixed with human-driven vehicles (HVs) environment, (c) connected and automated vehicles (CAVs) mixed with HVs environment, and (d) CVs mixed with CAVs environment.
Modeling of Heterogeneous Traffic
As mentioned previously, car-following models are widely used in traffic dynamics modeling. Various car-following models have been developed in traffic theoretical analyses and simulations. It is of importance to introduce proper car-following models to model different vehicle categories.
Recently, the IDM has been widely used for traffic flow ( 28 ). In this study, the IDM is selected to simulate HVs for the following reasons: (1) the IDM shows clearly the intuitive physical meaning and provides collision-free behaviors and smooth traffic flow; (2) it is of great realism compared with other controllers when capturing the dynamics of different congestion levels; and (3) it is a sophisticated model that has been used to model the longitudinal dynamics of HVs in many existing studies ( 29 – 32 ).
The IDM used for HVs can be described by the following equation:
where
For the sake of non-participation of HVs in the network, the time delays of HVs do not change with the application of CVs and CAVs. Parameters and values for HVs are shown in Table 2 (
33
,
34
). Note that, for the purpose of better capturing the dynamics of HVs, the parameter
Parameters and Values in Intelligent Driver Model (IDM) for Human-Driven Vehicles (HVs) and Connected Vehicles (CVs)

The equilibrium distance differences of two consecutive vehicles in IDM is described as:

Considering that CVs are driven by human beings, we still use IDM to formulate CVs’ longitudinal dynamics, as Equation 16. Table 2 demonstrates parameters and values for CVs.
Two models for CAV vehicles (i.e., adaptive cruise control [ACC] model and cooperative adaptive cruise control [CACC] model) have been calibrated by the PATH laboratory. In this study, Lcav1s is simulated by the ACC model; meanwhile, the CACC model is used for simulating other CAVs ( 25 ). The ACC model is presented as Equation 17.

Lcav1 is controlled by the ACC model and senses the state of the preceding HV in the same way as Lcv1. The CACC model is expressed by Equation 18. The specific parameters and values used in the ACC and CACC models are presented in Table 3.
Parameters and Values in Adaptive Cruise Control (ACC) and Cooperative Adaptive Cruise Control (CACC) Models for Connected and Automated Vehicles (CAVs)


The equilibrium distance differences of two consecutive vehicles in ACC and CACC are described as:

Fundamental Diagram and Fuel Efficiency
Characteristics of Fundamental Diagram
At equilibrium state, it is necessary to satisfy the following equation:

Supposing that the number of vehicles in the traffic flow is sufficient, the density and flow of the traffic flow can be expressed as:

According to the definition of traffic flow density on the fundamental diagram, the volume of heterogeneous traffic can be calculated as:

Considering the V2X communication limitation, the platoon manage mode will change under two circumstances. When the traffic speed reaches


Characteristics of Fuel Efficiency
Assume that all vehicles in the traffic flow are petrol cars. According to Song’s study, for the purpose of analyzing the relationship between fuel consumption and vehicle activities, the parameter VSP (instantaneous tractive power per unit of vehicle mass [kW/ton])is proposed that can be simplified as ( 35 ):

VSP that considers the power needed to overcome aerodynamic drag and rolling resistance and to increase the kinetic and potential energy of the vehicle, is defined as the instantaneous tractive power per unit of vehicle mass. To avoid the random errors that would result from the data-containing process, the VSP values are binned into bins of 1 kW/ton, as shown in Equation 24.

where

The average NFR for the traffic flow can be averaged by using the time fraction in each VSP bin, as shown in Equation 29:

where
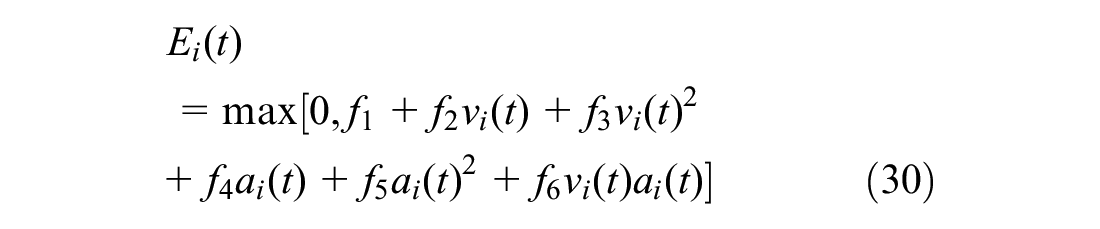
where
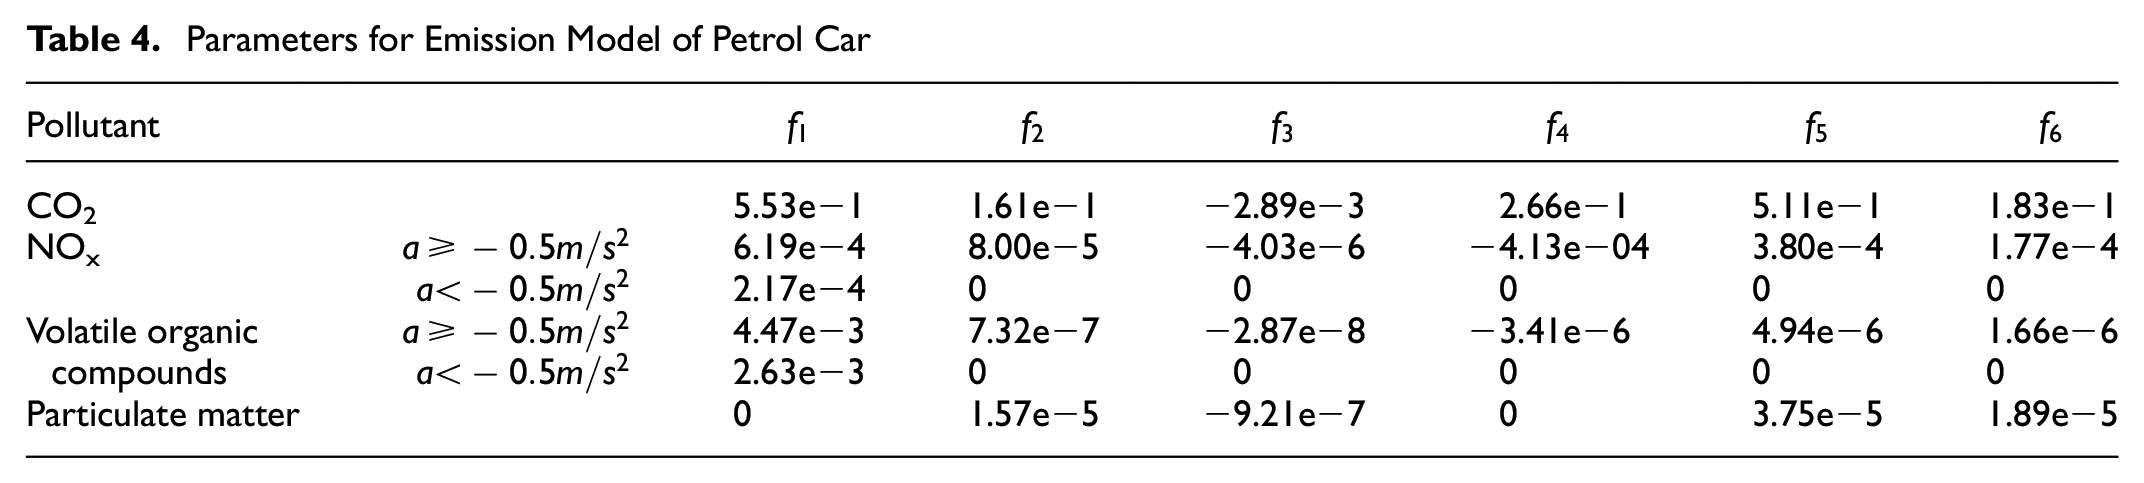
Parameters for Emission Model of Petrol Car
Simulation Evaluation
Based on the platoon management of heterogeneous traffic flow detailed in Platoon Management for Heterogeneous Traffic, this section presents the changes of platoon management on traffic capacity under V2X communication limitation. Then the influences on fuel efficiency are explored under different CV and CAV MPRs. In this study, the distance of V2X communication limitation is defined as 100 m. Meanwhile, there is only a single lane for vehicles and there is no overtaking and lane changing.
Capacity Changes on Fundamental Diagram
Assuming that the size of a platoon is five vehicles. Figure 3 shows the critical values for the fundamental diagram of heterogeneous traffic under different environments without V2X communication limitation. Moreover, the traffic flow volume reaches the capacity when the traffic flow density hits the critical value. In Figure 3a, intuitively, CAVs could better promote the capacity of roads, while CVs enable a slight increase in road capacity in contrast with conventional HV. Further, as shown in Figure 3, b and c , with the increase of CV MPR and CAV MPR, the critical value density and the capacity of roads are both growing. Nevertheless, in an environment where only CAVs and CVs exist, CVs would decrease road capacity. In addition, the fundamental diagrams under the environment where CVs, CAV, and HVs coexist are provided in Figures 4 and 5 which demonstrate the same trend.
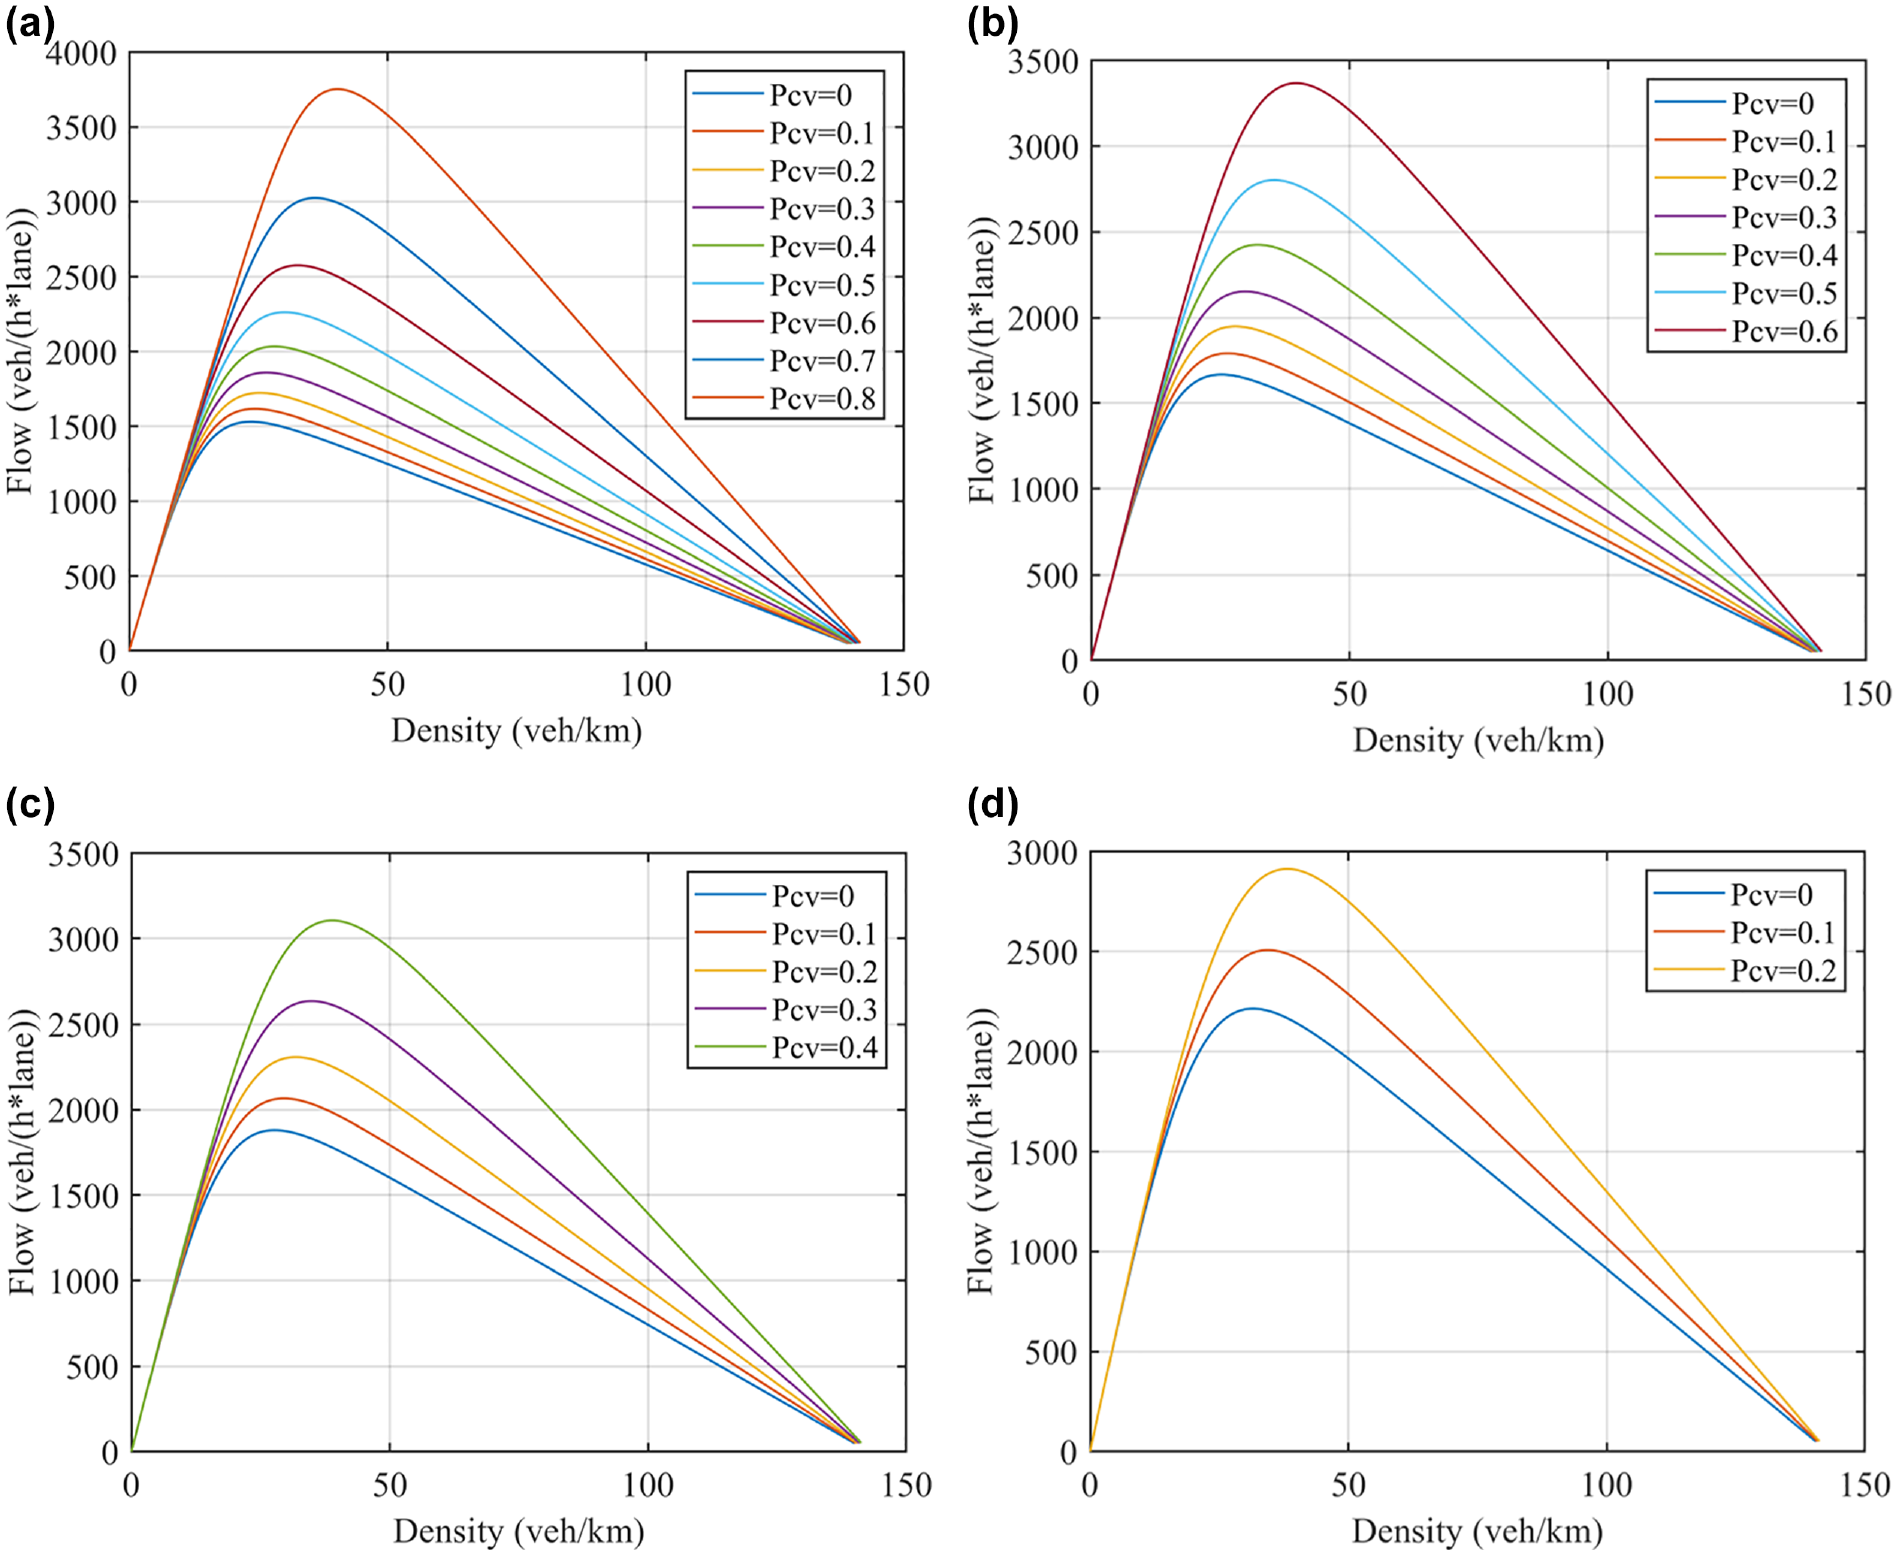
Fundamental diagram of heterogeneous traffic under different connected and automated vehicle (CAV) market penetration rate (MPR): (a) CAV MPR is 20%, (b) CAV MPR is 40%, (c) CAV MPR is 60%, and (d) CAV MPR is 80%.
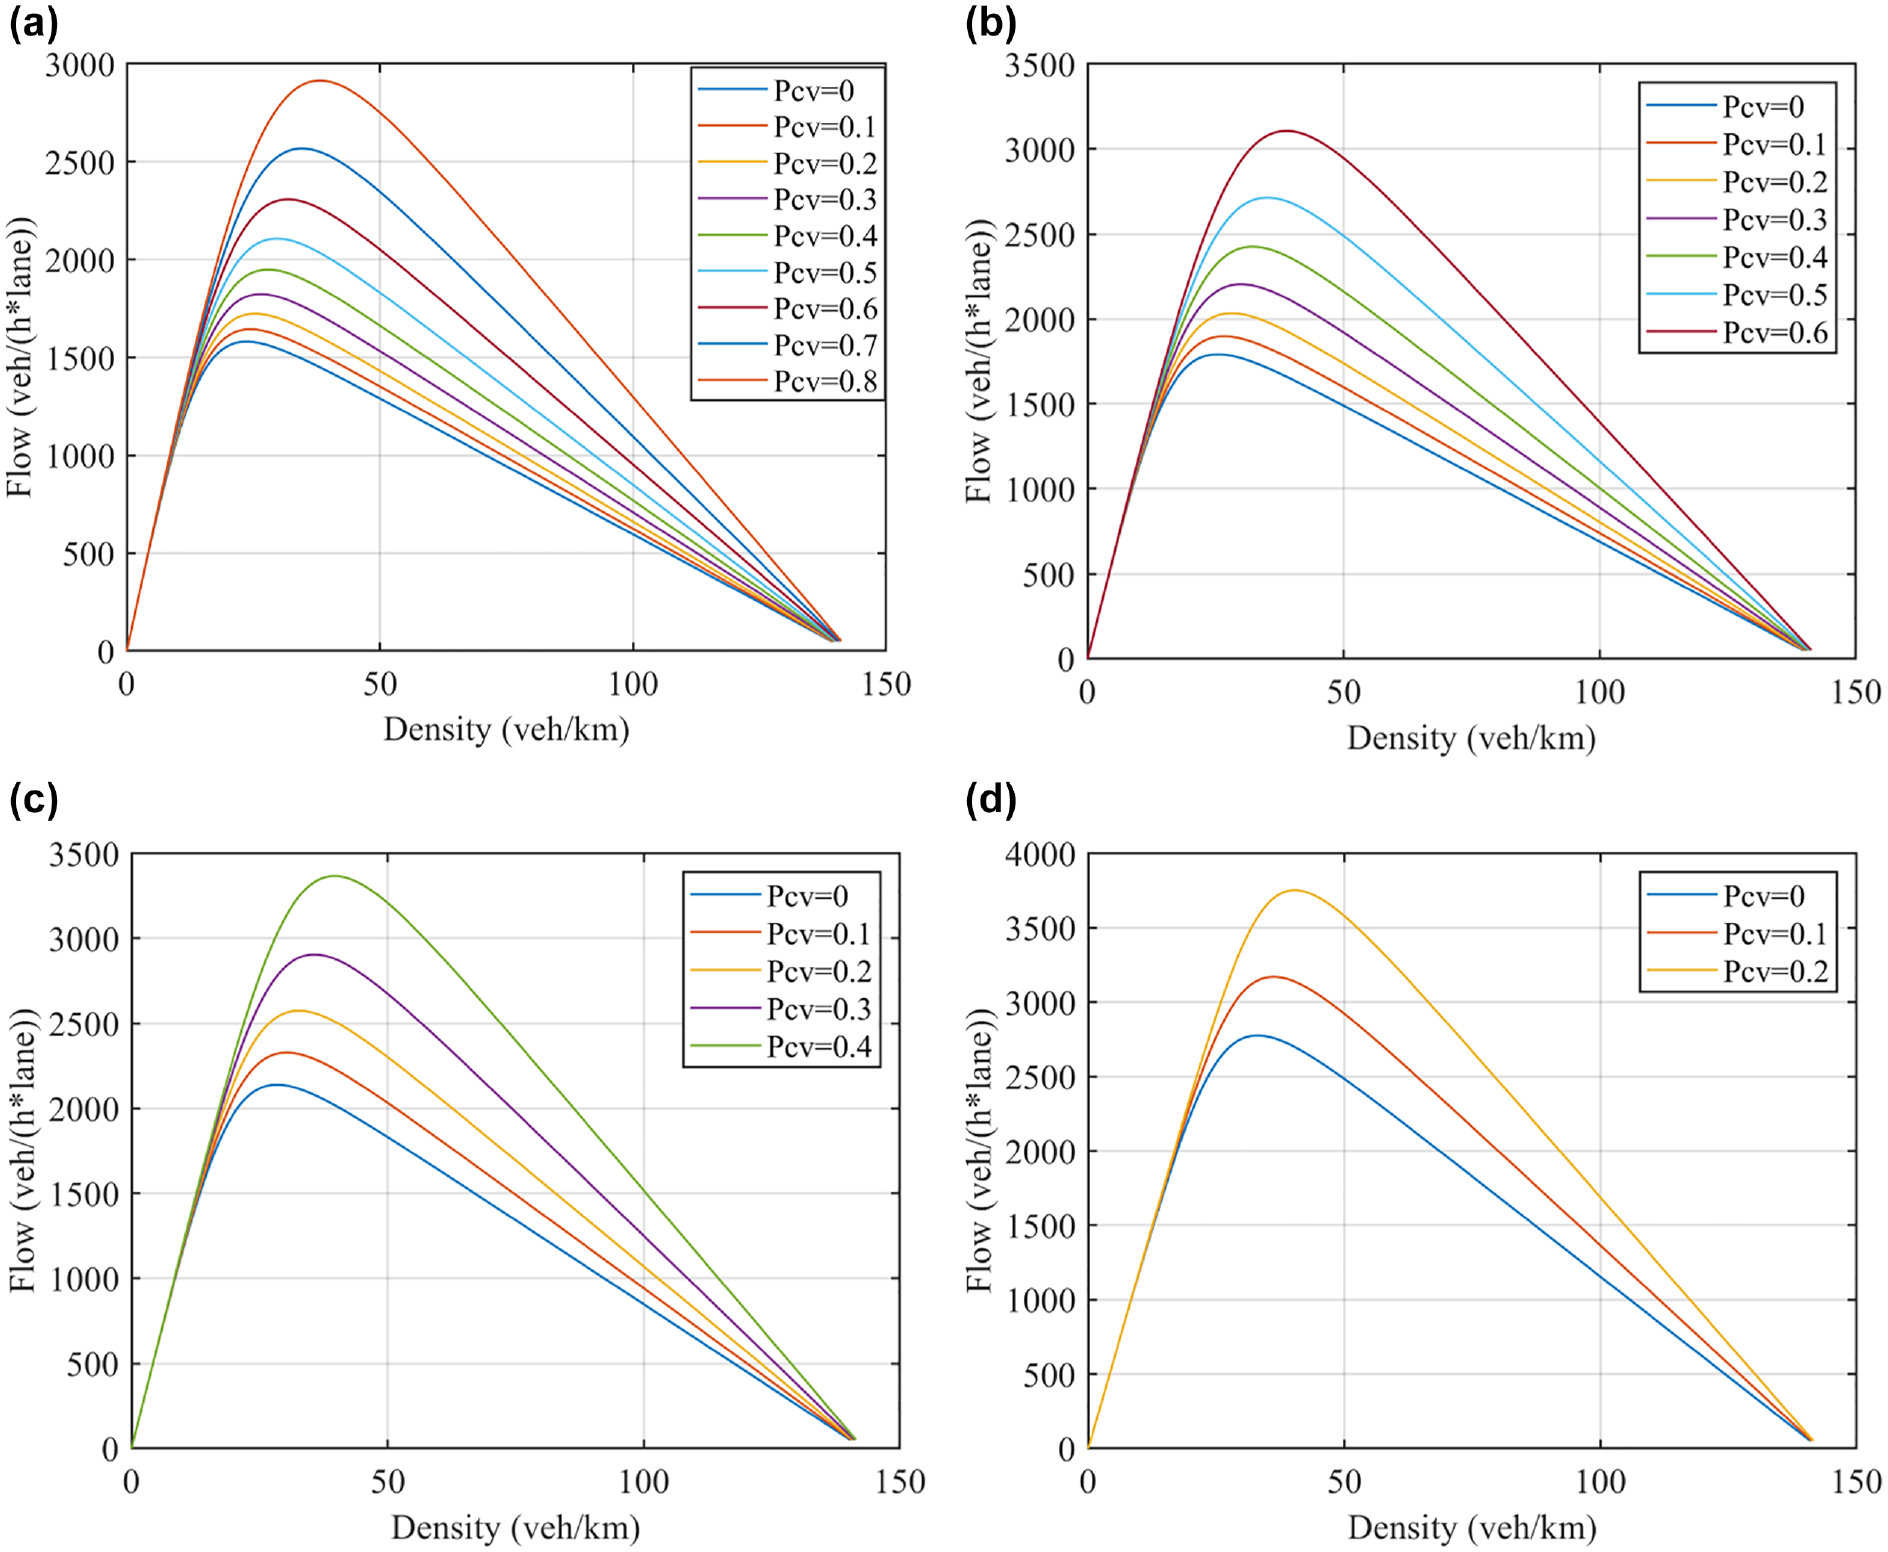
Fundamental diagram of heterogeneous traffic under different connected vehicle (CV) market penetration rate (MPR): (a) CV MPR is 20%, (b) CV MPR is 40%, (c) CV MPR is 60%, and (d) CV MPR is 80%.
When taking V2X communication limitation into consideration, Figure 6, a and b , illustrate the fundamental diagram of heterogeneous traffic under different CV MPR and CAV MPR, respectively. More specifically, traffic flow in Figure 6a is composed of HVs and CVs, where the road capacity is enhanced when CV MPR rises. Likewise, CAVs could also improve the road capacity for traffic flow, as shown in Figure 6b. As such, the proposed platoon management could increase the capacity of traffic; meanwhile, if the gap of vehicles at equilibrium exceeds the V2X communication limitation, this implies vehicles move fast enough to guarantee the efficiency of traffic. Likewise, the fundamental diagrams considering V2X communication limitation under the environment where CVs, CAVs, and HVs coexist are provided in Figures 7 and 8 which demonstrate the same trend. Furthermore, when the distance of V2X communication increases, the road capacity will also be improved, especially when the sum of CV and CAV MPRs are more than 50%, as shown in Figure 9.
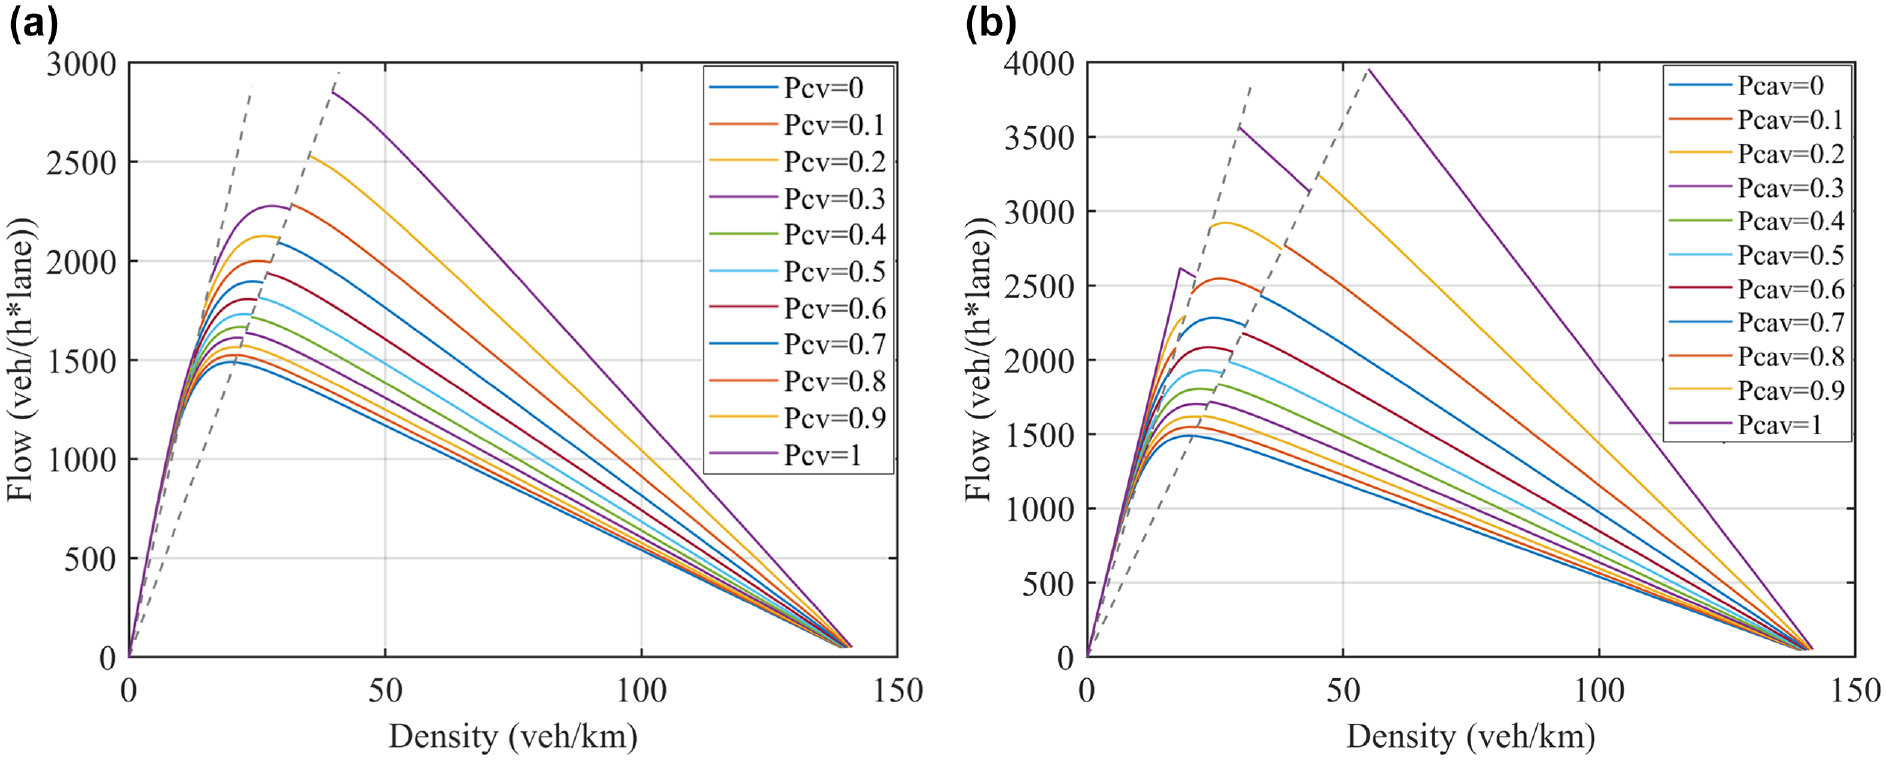
Fundamental diagram of heterogeneous traffic considering vehicle-to-everything (V2X) communication limitation: (a) connected and automated vehicle (CAV) market penetration rate (MPR) is 0% and (b) connected vehicle (CV) MPR is 0%.

Fundamental diagram of heterogeneous traffic under different connected and automated vehicle (CAV) market penetration rate (MPR) considering vehicle-to-everything (V2X) communication limitation: (a) CAV MPR is 20%, (b) CAV MPR is 40%, (c) CAV MPR is 60%, and (d) CAV MPR is 80%.

Fundamental diagram of heterogeneous traffic under different connected vehicle (CV) market penetration rate (MPR) considering vehicle-to-everything (V2X) communication limitation: (a) CV MPR is 20%, (b) CV MPR is 40%, (c) CV MPR is 60%, and (d) CV MPR is 80%.

Heatmap of heterogeneous traffic maximum capacity considering the distance of communication limitation: (a) connected and automated vehicle (CAV) market penetration rate (MPR) is 0% and (b) connected vehicle (CV) MPR is 0%.
Concerning the impact of platoon size on traffic capacity, Figure 10 is the heatmap of the reduction rate of the maximum capacity of various MPR and platoon sizes. When the CV MPR reaches 70%, there would be a significant improvement in traffic capacity, as shown in Figure 10a. Analogously, there would be improved traffic capacity when CAV MPR is over 80%. as shown in Figure 10b. Moreover, when the number of vehicles in a platoon is more than 45, there might be a decrease in platoon capacity. Overall, the size of a platoon when its size is less than 45 vehicles has little influence on the traffic flow under platoon management. Thus, the size of platoon is preferably set less than 45 vehicles.
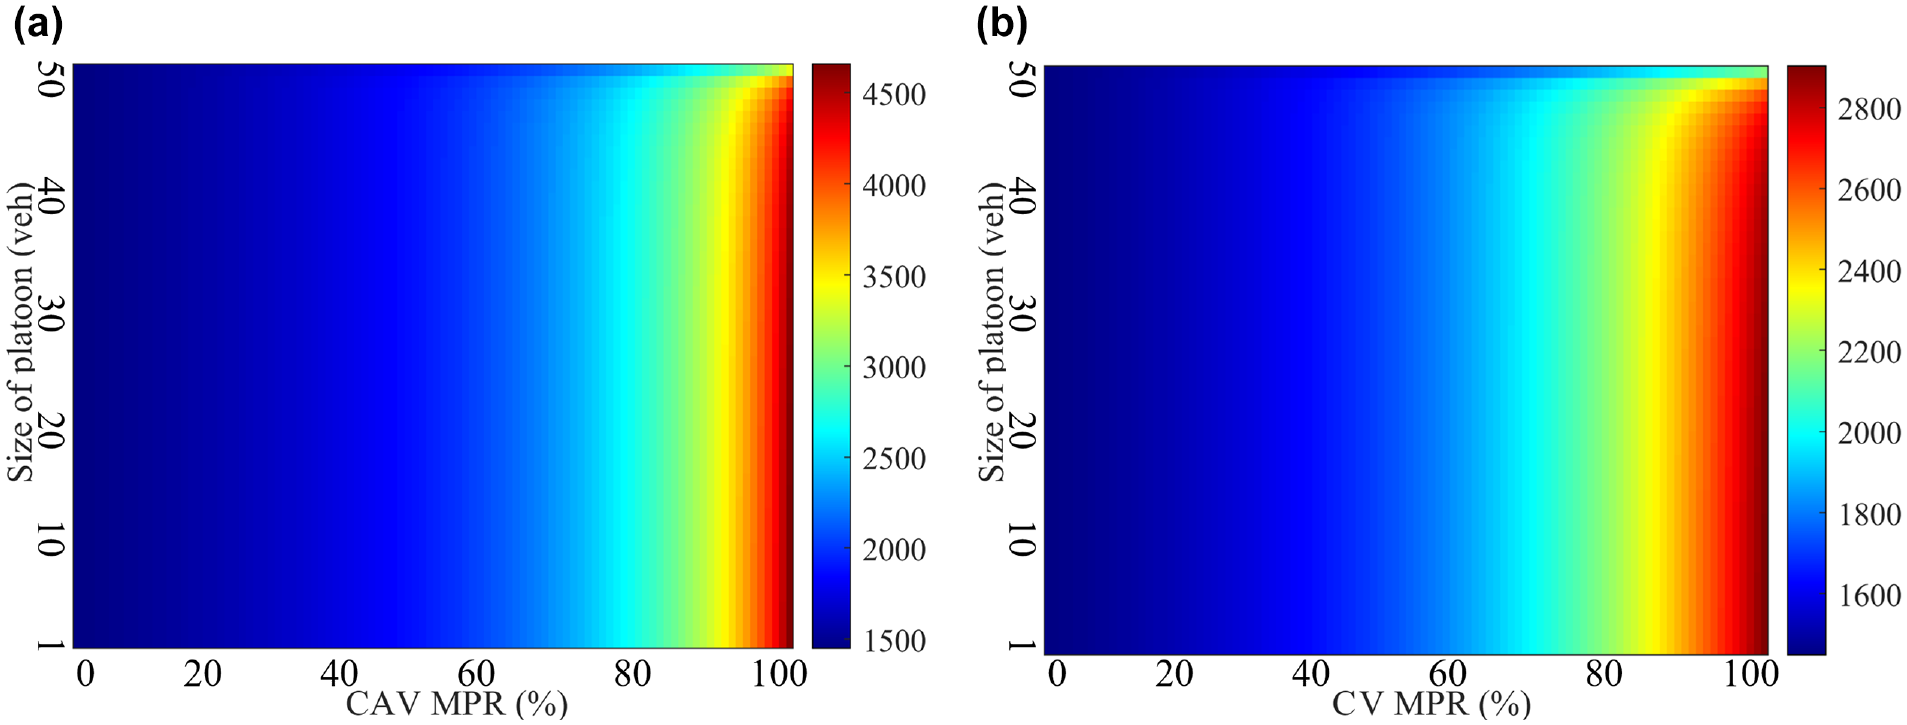
Heatmap of heterogeneous traffic maximum capacity considering the size of a platoon: (a) connected and automated vehicle (CAV) market penetration rate (MPR) is 0% and (b) connected vehicle (CV) MPR is 0%.
Fuel Efficiency
To further explore the impact of CAVs on fuel efficiency, numerical simulations are conducted for traffic oscillation scenarios which will consume more fuel and produce more emissions ( 6 , 37 ). Supposing that there are 500 vehicles that maintain a constant initial velocity of 22 m/s at the initial moment, traveling on an open boundary one-lane road. Then, the first vehicle performs oscillations on a cycle of 4 s, which included a 2 m/s2 deceleration of 2 s and a 2 m/s2 acceleration of 2 s. The simulation takes 200 s with a total of three cycles performed.
Based on Characteristics of Fuel Efficiency, heatmaps of the average emission concerning various CV MPR and platoon size when the CAV MPR is 0% are shown in Figure 11. They indicate that there is a qualitative relationship between MPR and average emission such that with the increase of MPR, the CO2 and volatile organic compounds (VOC) reduction rate decreases but the particulate matter (PM) and NOx increase. However, the size of platoon has little impact on average emission and can be ignored. Moreover, when the CV MPR exceeds 90%, there are less changes in reduction rate of the emissions. In this context, the behaviors of HVs could be affected by CVs so that their fuel efficiency can be enhanced. Figure 12 demonstrate the heatmaps of average emission concerning various CAV MPR when the CV MPR is 0%, which show the similar changing trends and the HVs’ behavior could be affected by CAV.
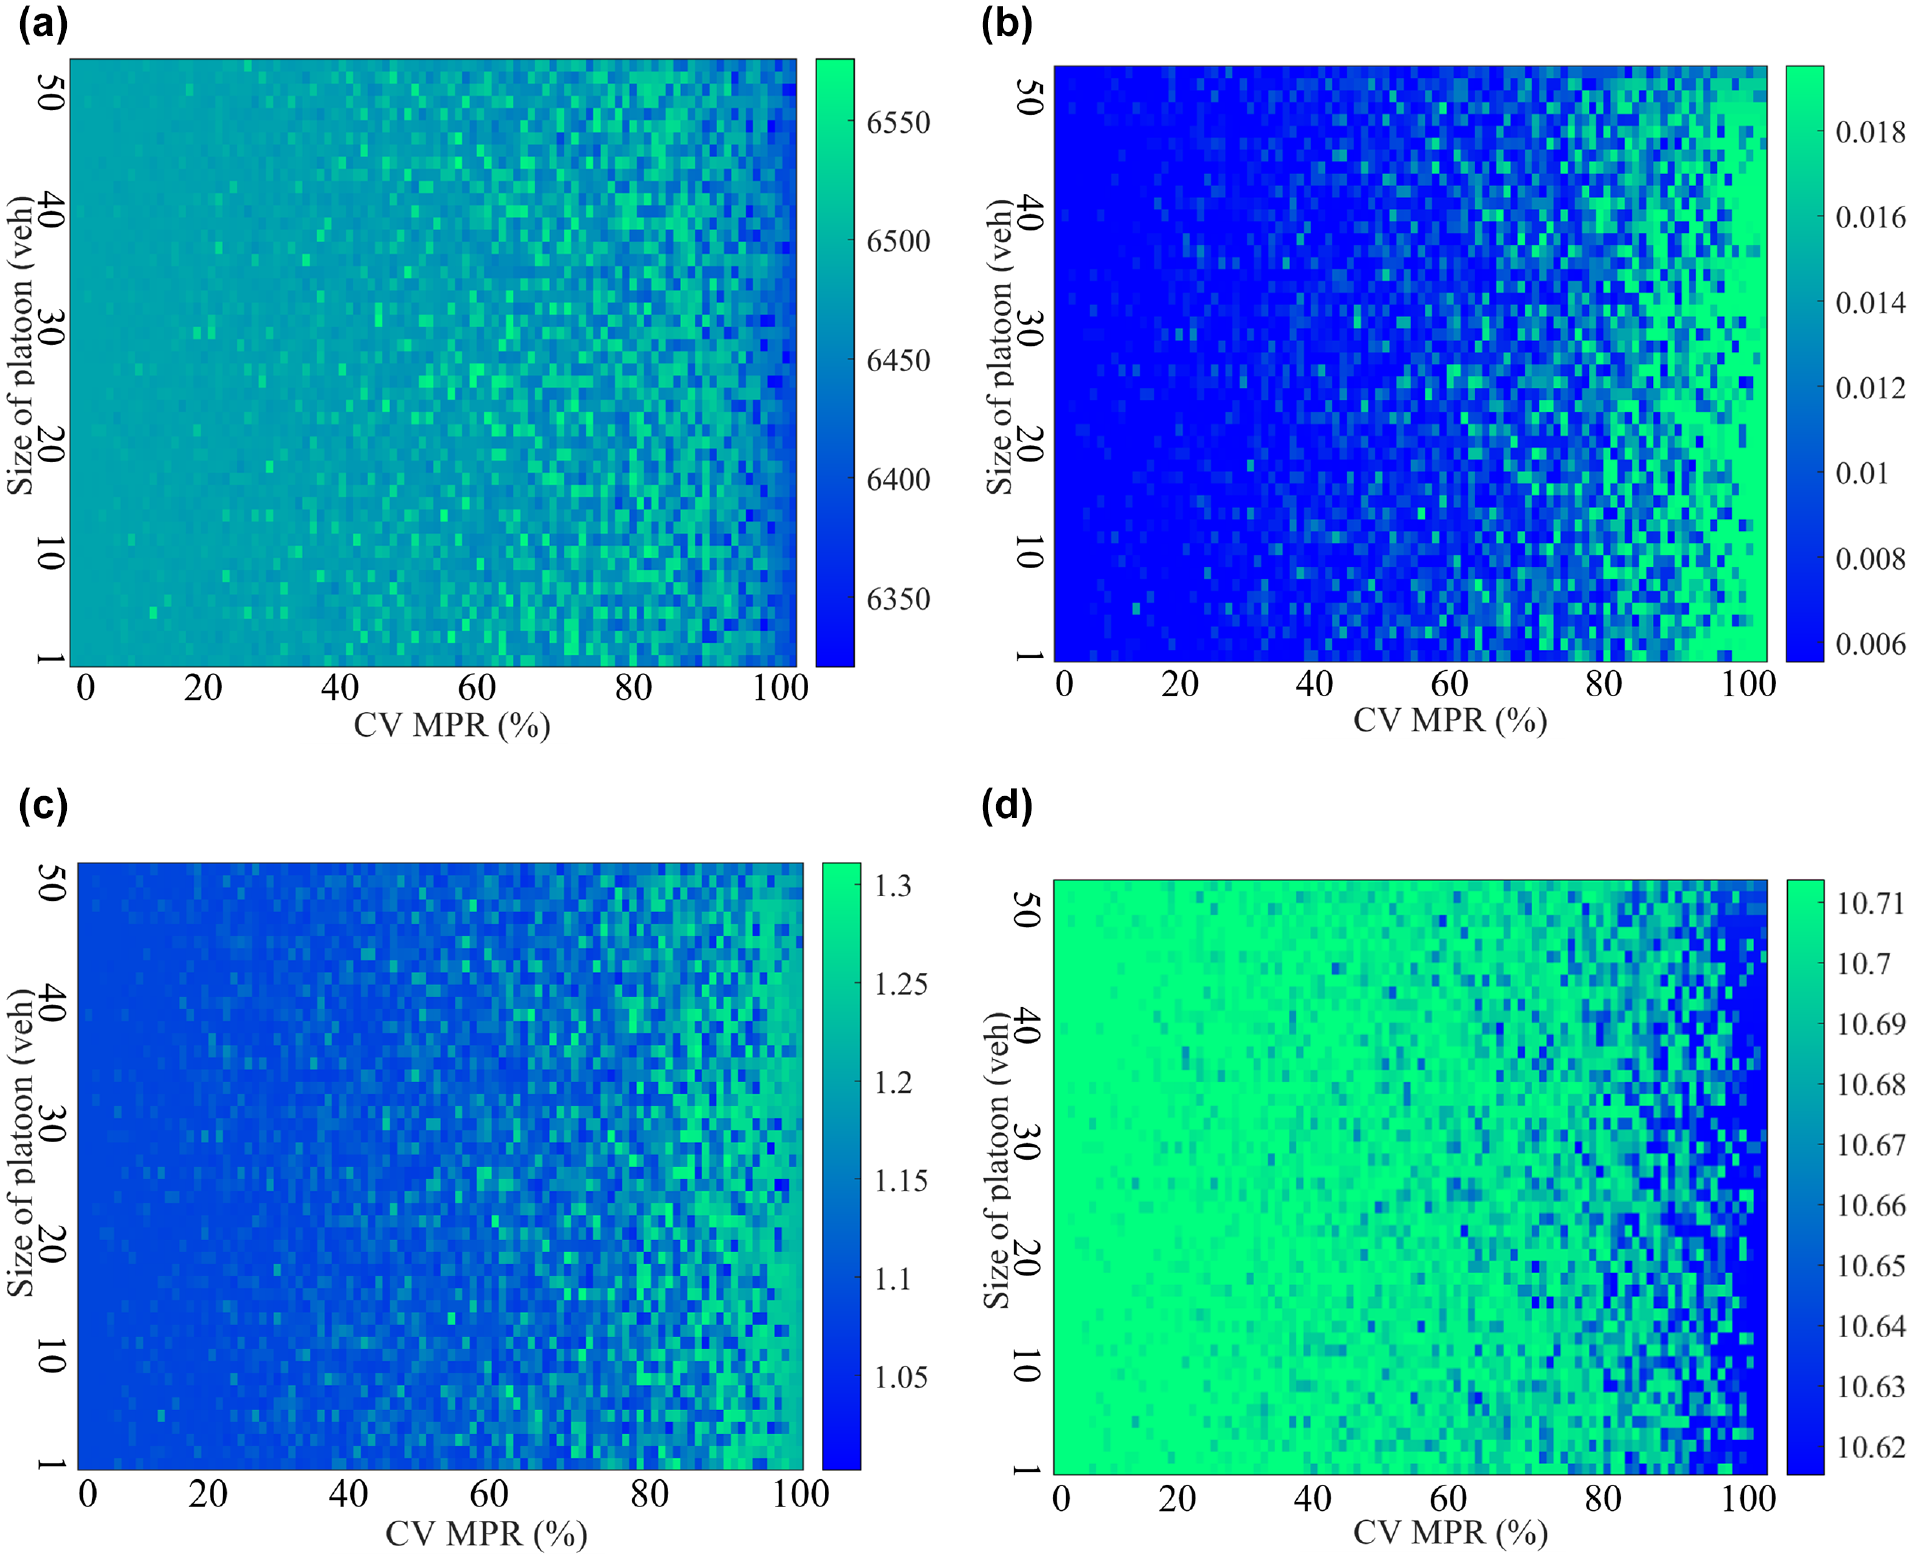
Heatmap of the reduction rate of the emissions concerning various connected vehicle (CV) market penetration rate (MPR) (connected and automated vehicle [CAV] MPR is 0%): (a) CO2, (b) particulate matter (PM), (c) NOx, and (d) volatile organic compounds (VOC).

Heatmap of heterogeneous traffic emissions concerning various connected and automated vehicle (CAV) market penetration rate (MPR) and platoon size (connected vehicle [CV] MPR is 0%): (a) CO2, (b) particulate matter (PM), (c) NOx, and (d) volatile organic compounds (VOC).
Figure 13 shows the heatmaps of average emission concerning various CAV MPR and with CV MPR as 50% under heterogeneous traffic environment when the distance of V2X communication limitation is 100m. Overall, it can be seen that, with higher CV and CAV MPRs, the emissions will decrease.

Heatmap of heterogeneous traffic emissions concerning various connected and automated vehicle (CAV) market penetration rate (MPR) and platoon size (connected vehicles [CV] MPR is 50%): (a) CO2, (b) particulate matter (PM), (c) NOx, and (d) volatile organic compounds (VOC).
Figure 14a demonstrates the heatmap of the fuel consumption concerning the platoon size and various CV MPR when no CAV exist. Similarly, Figure 14b demonstrates the heatmap of the fuel consumption concerning the platoon size and various CAV MPR when no CV exist. Under low MPRs, the effect of platoon management on fuel consumption is not prominent, but the fuel consumption will be developed under high CV or CAV MPRs. The similar changing trends are shown in Figure 14, c and d .

Heatmap of the fuel consumption concerning the platoon size and various market penetration rate (MPR): (a) connected and automated vehicle (CAV) MPR is 0%, (b) connected vehicle (CV) MPR is 0%, (c) CAV MPR is 50%, and (d) CV MPR is 50%.
When the distance of V2X communication limitation changed, the emission and fuel consumption will get changed as shown in Figure 15 with five vehicles in a platoon. The CV MPR and CAV MPR are both set as 10%. It can be found that, with longer V2X communication distance, the emissions and fuel consumptions decrease.
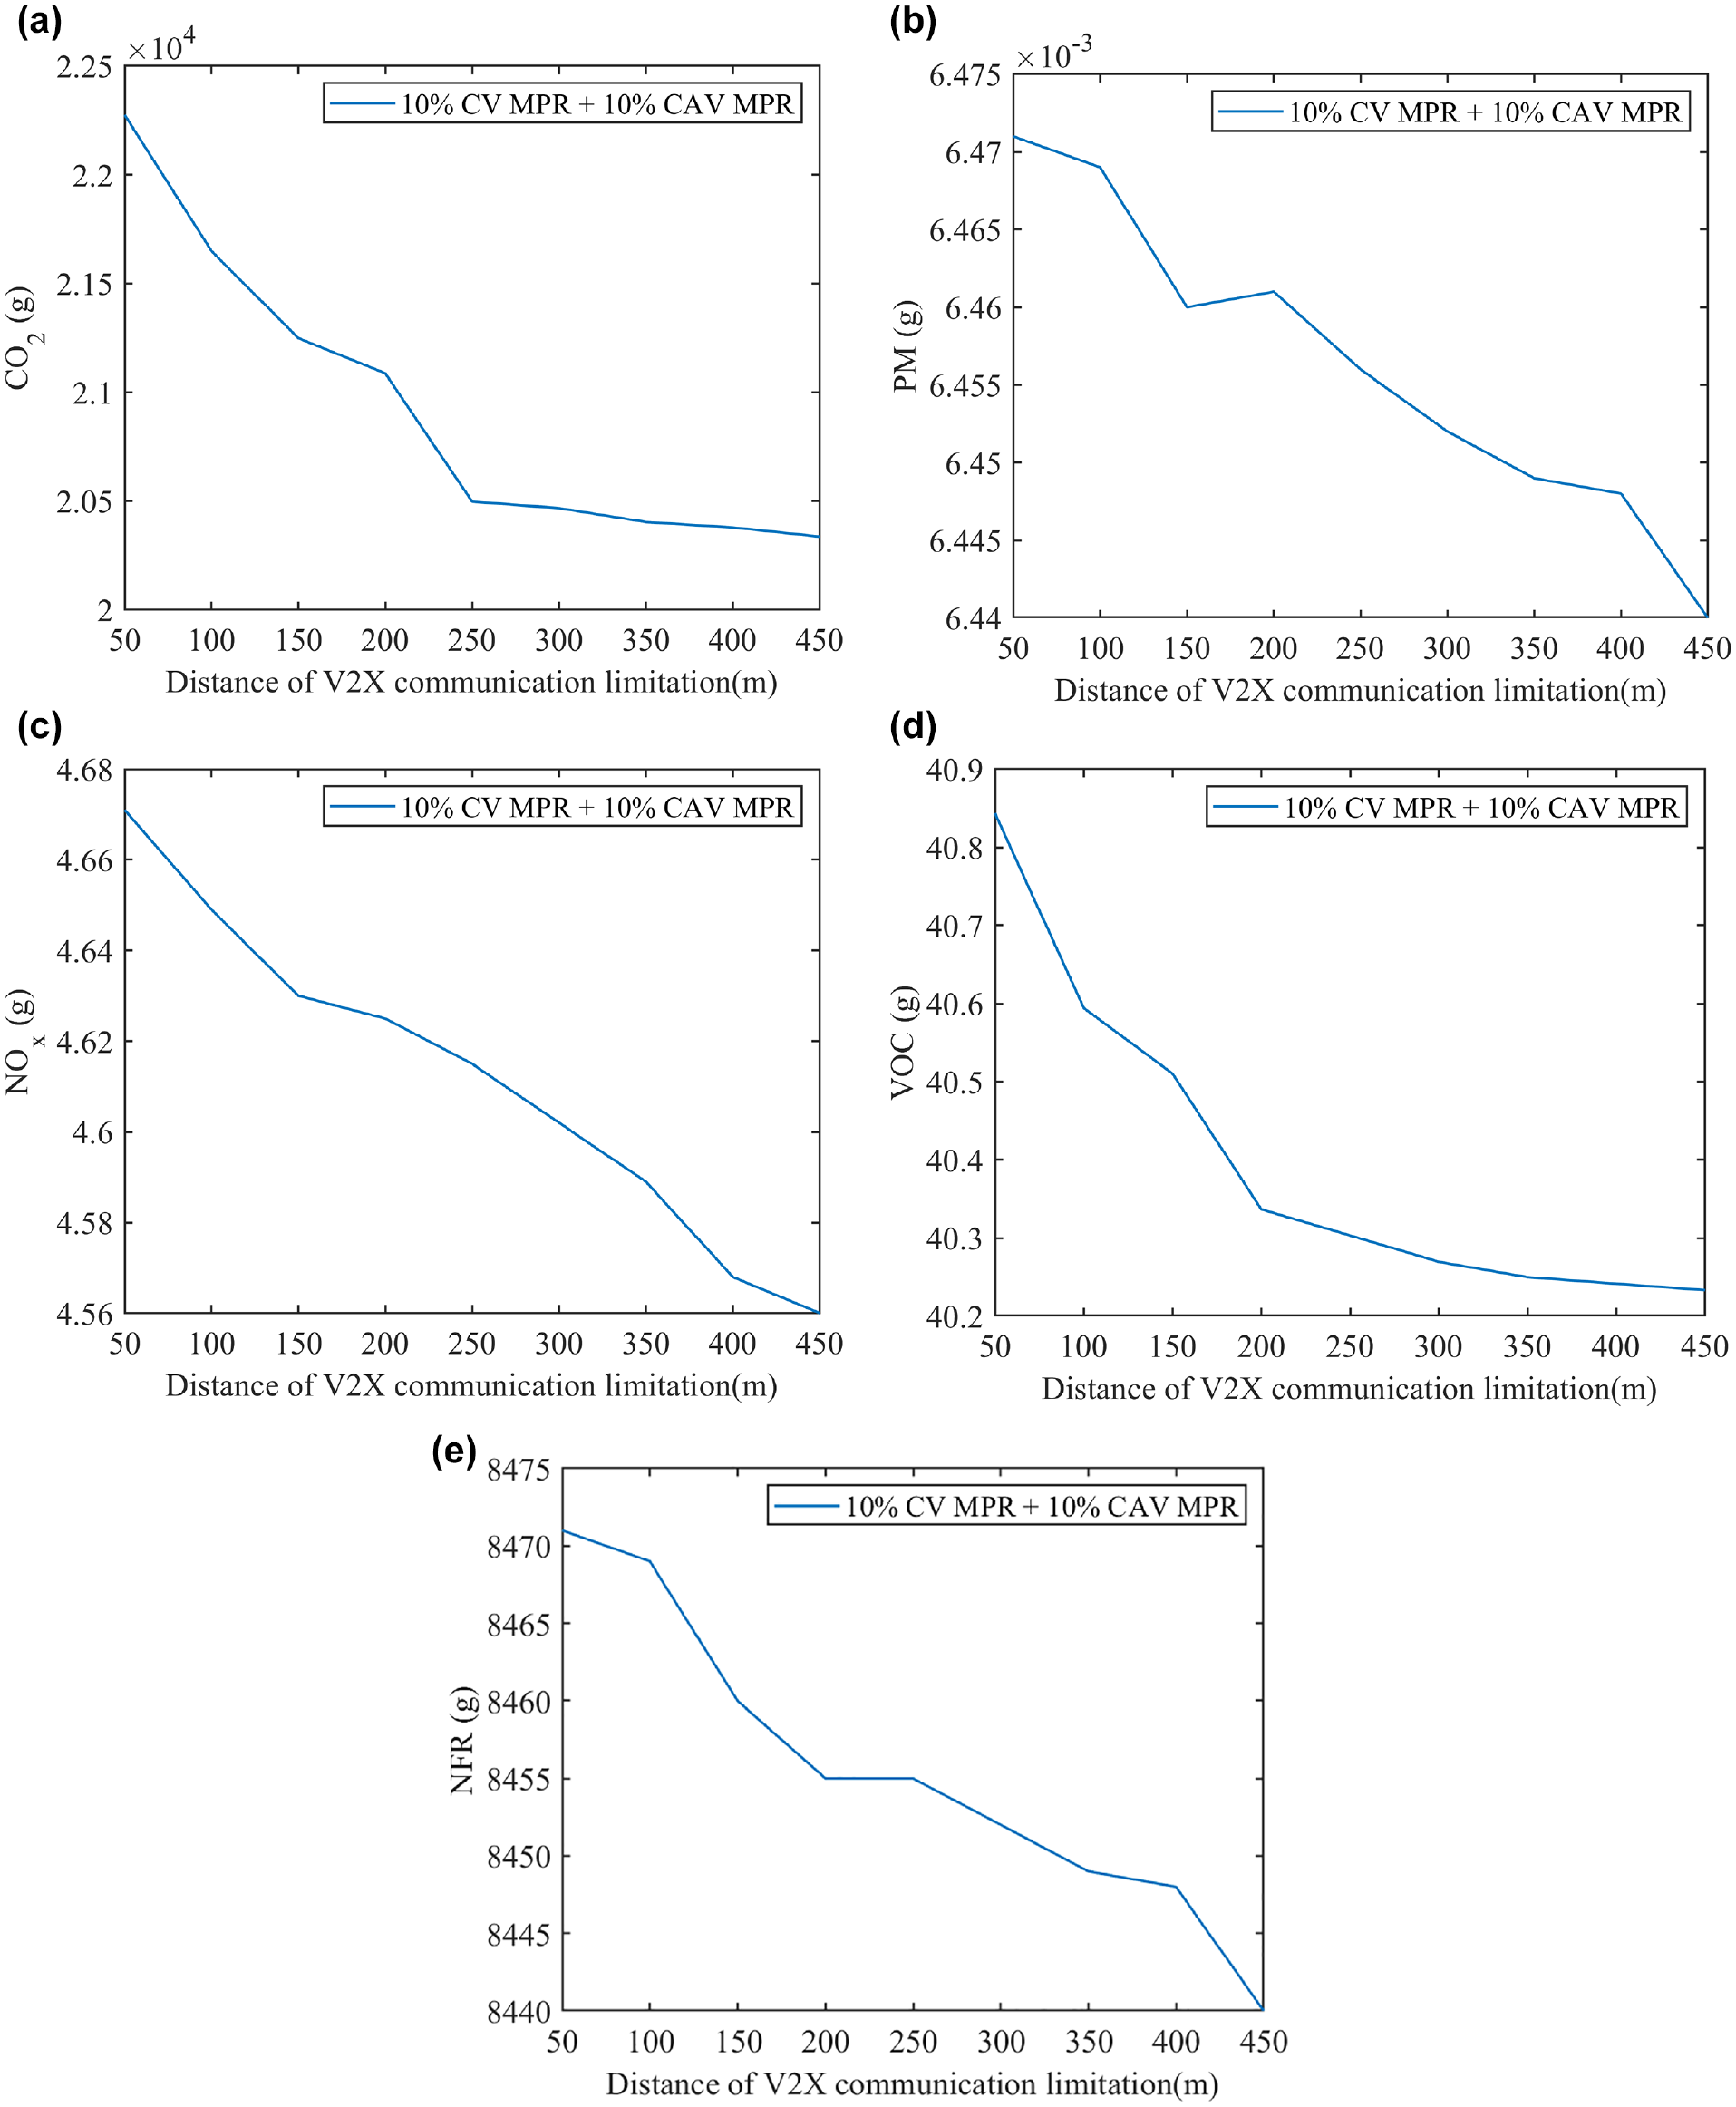
Changes of heterogeneous traffic emissions and fuel consumption concerning vehicle-to-everything (V2X) communication limitation: (a) CO2, (b) particulate matter (PM), (c) NOx, (d) volatile organic compounds (VOC), and (e) fuel consumption.
Conclusions and Future Research
Understanding the impact of platoon control in mixed traffic is considered core for maintaining traffic efficiency and reducing emissions. To date, to investigate the occurrence of mixed traffic capacity by either simulation or analytical method, numerous studies have been conducted. However, most current analytical research has only relied on single-class traffic or mixed-traffic dynamics, including only HVs and CAVs. To contribute to the state-of-the-art, in this study, the capacity of a mixed-traffic scenario that combines HVs and CAVs with CVs was explored under platoon management by fundamental diagram. The analytical and numerical results have indicated that the participation of both CVs and CAVs can bring a positive impact on the mixed-traffic capacity. More specifically, the capacity of mixed traffic would be improved with the involvement of CAVs because they can exchange information with CVs and affect their behavior during driving. Furthermore, the fuel efficiency of mixed traffic composed of HVs, CVs, and CAVs could significantly be improved via sub-platoon management strategy at high CAV and CV MPRs.
Future research could attempt to address more dynamic traffic conditions, for instance, multiple lanes with lane-change behavior. In addition, future study could also conduct field tests to verify the effectiveness of the platoon management and its impact on heterogeneous traffic. Furthermore, efforts should be made to analyze the approach of IFT between vehicles to further advance the platoon management strategy.
Footnotes
Author Contributions
The authors confirm contribution to the paper as follows: study conception and design: X. Author, Y. Author; data collection: X. Author, Y. Author; analysis and interpretation of results: X. Author, Y. Author; draft manuscript preparation: X. Author, Y. Author. All authors reviewed the results and approved the final version of the manuscript.
Declaration of Conflicting Interests
The author(s) declared no potential conflicts of interest with respect to the research, authorship, and/or publication of this article.
Funding
The author(s) received no financial support for the research, authorship, and/or publication of this article.