



Abstract
There has been extensive visual-disability-focused safety research resulting from various factors/conditions that have a significant impact on a driver’s ability to maneuver safely. One such critical condition among the major environmental issues that contribute to traffic crashes is daytime sun glare-induced temporary visual impairment. Nevertheless, the contribution of relevant factors to the choice of potential actions at the time of such crashes has not been widely studied. Approximately 3,000 crashes per year in the United States are attributed to sun glare, which may indicate that the driver had no control over the situation. Thus, this study investigated several factors to identify crashes that occurred, with acceptable certainty, under the direct influence of sun glare over 4 years (2014 to 2017) in Florida—“the Sunshine State.” A multinomial logistic regression model was developed to formulate relationships between crash-related contributing factors and to evaluate the likelihood of alternative actions being adopted by drivers experiencing sun glare. The results indicated that running red lights/stop signs was the most likely action one might take while experiencing this adverse condition, particularly on local roadways. A further consequence of sun glare is that drivers tend to follow the car in front too closely along segments with higher annual average daily traffic. The findings could help safety officials support the use of emerging intelligent transportation system technologies (i.e., automated traffic signal performance measures and cooperative intersection collision avoidance systems) to alert drivers of the possibility of a temporary vision impairment exactly when high-glare conditions exist.
Keywords
Driving is a highly visual activity that requires processing the visual input to maintain vehicle control ( 1 ). To ensure this, one must fully concentrate on the road environment including other road users. However, when the sight distance is reduced owing to external factors like sun glare, even being fully attentive on the road will not be sufficient. This phenomenon happens when the sun is low on the horizon. Direct sunlight exposure at a critical angle (i.e., normally less than 20° between the line of sight and the source of sunlight) could result in a temporary dazzling sensation and temporary blindness for drivers, causing serious traffic safety problems ( 2 ). It is estimated that disruption from sun glare has caused an annual loss of approximately 25 billion rubles in the Russian economy ( 3 ). Similarly, in the UK, an average of 36 deaths are attributed to the sun glare at dawn during peak hour ( 4 ). Glare is also the cause of nearly 3,000 crashes in the United States every year, with drivers temporarily blinded by the sun ( 5 ).
Certain previous studies that have attempted to examine the impact of weather conditions mostly excluded crashes that occurred in clear weather conditions, thereby overlooking sun glare as a potential contributing factor ( 6 – 8 ). For instance, Abdel-Aty et al. examined the impact of crash-related attributes on the severity of crashes caused by visibility obstruction during fog and smoke, whereas sunny weather and the effects of sun glare were still under debate ( 9 ). Alogaili and Mannering revealed that the factor that generally indicated no adverse weather conditions was associated with a reduced impact on “no visible injury” pedestrian-involved crashes ( 10 ). Moreover, several studies have investigated sun glare impact with a health focus. For example, Redelmeier and Raza examined hospitalized patients’ information including surgical procedures and length of stay and introduced the influence of sun glare as a life-threatening contributing factor to motor vehicle crashes ( 11 ). Another cause of visual impairment is oncoming vehicle headlights while driving at night. It has been demonstrated that glare illumination is associated with various nighttime behaviors, such as lane position and changing speed ( 12 , 13 ). Despite all the associated loss and disruption to the economy and traffic safety, to the best of the authors’ knowledge, an extensive, robust statistical analysis to determine the influence of sun glare on driver behavior during the daytime has not been carried out to date.
Ma et al. investigated how sun glare affected pedestrian fatalities between 2003 and 2016, utilizing national traffic crash data from Taiwan as well as sunrise and sunset data from the National Oceanic and Atmospheric Administration (NOAA) ( 14 ). Sun glare was found to be a significant factor in pedestrian fatalities, and the main determinants in those crashes were older pedestrians, male drivers, older drivers, and drunk motorists. McGwin et al. focused on a certain age group (i.e., those between 55 and 85) and highlighted a pattern between visual capability and self-reported difficulty with driving tasks ( 15 ). In contrast, the current research intended to shed more light on the alternative actions that may be taken by drivers while driving under the direct influence of sun glare.
Mitra and Washington studied the impacts of sun glare on intersection-related crashes ( 16 ). They considered glare as a meaningful and neglected variable when explaining crashes that occurred at intersections, and demonstrated that the presence of sun glare enhanced the model’s explanatory power. Choi and Singh used descriptive and contingency analyses on glare-related crashes ( 17 ). Their findings indicated that the roadway profile and the number of lanes significantly contributed to the occurrence of glare-related crashes. They also argued that driver age, time of the day, travel speed, and number of lanes could jointly have the potential to describe such crashes, as these variables correctly classified 80% of the crashes resulting from sun glare. Das et al. analyzed 7 years of traffic crash narrative data from Louisiana (2010 to 2016) to identify crash reports showing evidence of drivers claiming sun glare as the key contributor to the crash ( 18 ). Their data analysis method, which combined cluster- and correspondence analysis, allowed the researchers to identify the major clusters of crash-contributing elements in sun glare-related crashes.
Another study compared actual safety performance under glare and no-glare situations using crash data from signalized intersections in Tucson, AZ ( 19 ). The authors used the data to obtain sunrise and sunset times over the year and used these to determine the crashes for which sun glare might have had an influence. In addition, a statistical assessment was performed on crashes in which sun glare did have an effect. The negative effects of sun glare were found to be milder in the summer season than in early spring, fall, and winter. The findings also revealed some evidence that sun glare had an impact on rear-end and angle-type crashes at signalized intersections, whereas injury severities seemed to be unaffected by sun glare.
Sun et al. presented a safety evaluation for the city of Edmonton, KY to identify the impacts of sun glare on road safety by simulating exposure to sun glare ( 20 ). In the assessment, they considered the corresponding factors with sun position and glare angle to identify monthly potential sun glare windows and obtained glare-prone locations that were visualized on the road network. For the second stage of the analysis, those locations were utilized to distinguish glare-related collisions, and nonglare comparison collisions. A study conducted by Choi and Singh found that sun glare significantly contributed to collision occurrence, particularly at intersections ( 17 ). That contribution was observed during the sunrise on eastbound roads, whereas the westbound direction was much more susceptible to glare at sunset. Finally, they concluded that collisions caused by signal infractions and yielding violations to pedestrians/cyclists were more common near crossings.
Jurado-Piña and Mayora developed a procedure to find the days and times of the year on which sun glare could impair the vision of drivers on a specific section of road, with respect to the location, the geometric road design, and physical environmental attributes ( 21 ). For a specific location, they employed cylindrical charts of the sun and combined those with the line of sight of the driver, the disability glare of the driver represented by glare cones, and terrain configuration. As disability glare was introduced in the charts based on an equation that considered the age of drivers, glare cones were prepared for different ages. In the final plotting, the days and hours that the drivers would experience vision impairment on specified road segments during 1 year were detected. In a follow-up study, the authors also added the effect of shielding elements to the analysis of graphical identification of glare occurrence period ( 22 ). A new methodology was introduced by Churchill et al. to measure continuous glare exposure across an entire road length throughout the year ( 2 ). They established a geometric model for forecasting the locations and periods when solar glare might have an impact on drivers on highways. To demonstrate the accuracy of the findings, this model was applied to a few current highway alignments. Additionally, a statistical analysis of the data on highway congestion was provided, demonstrating how the presence of solar glare would affect traffic speeds for one specific facility. The results suggest that sun glare has a role in traffic congestion, as assessed by mean vehicle speeds.
Despite the existing literature providing valuable insights into the contribution of sun glare to crashes, to the best of the authors’ knowledge, a gap in understanding how various contributing crash-related factors correlate with the potential actions performed by drivers in the event of daytime sun glare exposure still exists. According to the proposed statistical framework presented in this paper, parameter estimates can vary across crash observations. This approach could therefore be used to assess the likelihood of alternative actions being taken by the driver under a variety of circumstances.
Study Area and Data Sources
Florida, known as the Sunshine State, was selected as the ideal case study in which to investigate the impact of sun glare on roadway safety (Figure 1). For the purpose of this study, we filtered the crash dataset to identify crashes that might have been caused by sunlight glare during daylight hours. We used 4 years (2014 to 2017) of Florida crash data, which was acquired from the Florida Department of Transportation Crash Analysis Reporting system ( 23 ). Crash data were derived from points dispersed along the roadway network, each representing a vehicle crash as shapefiles mapped to the geographic information system using longitude and latitude information. There is an attribute in the aforementioned crash database that codes the contributing circumstances at the time of the crash as entered by the officer, which may not be reliable since at-fault drivers may declare sun glare to argue that the incident was beyond their control. Therefore, we elected to establish several additional criteria to identify crashes that had occurred under the direct influence of sun glare to give an acceptable level of certainty. Additionally, in this study we assumed that it is the driver’s responsibility to take the necessary precautions to avoid weather-related crashes and to anticipate potential road hazards. In this case, a driver who encounters sun glare is likely to be held responsible for the injuries and damage caused by the crash. The main components to preparing the sun glare crash dataset included (1) selecting crashes that occurred during clear, sunny weather conditions based on the crash-related attributes from the crash report form, as entered by the officer, (2) discarding any crashes that occurred outside of the window “apparent sunrise/sunset,” window, elaborated in Table 1, (3) considering the travel direction at the time of the crash to select crashes occurring along eastbound and westbound directions during sunrise and sunset, respectively, and (4) removing crashes if the driver was not at fault. All of the extracted filtered crash data, named “sun glare crashes” in this research, have been validated by the previously mentioned attributes representing whether sun glare was a contributing factor.

Sun glare crash locations in Florida State.
Typical Morning and Evening Sun Glare Spans for Florida ( 25 )
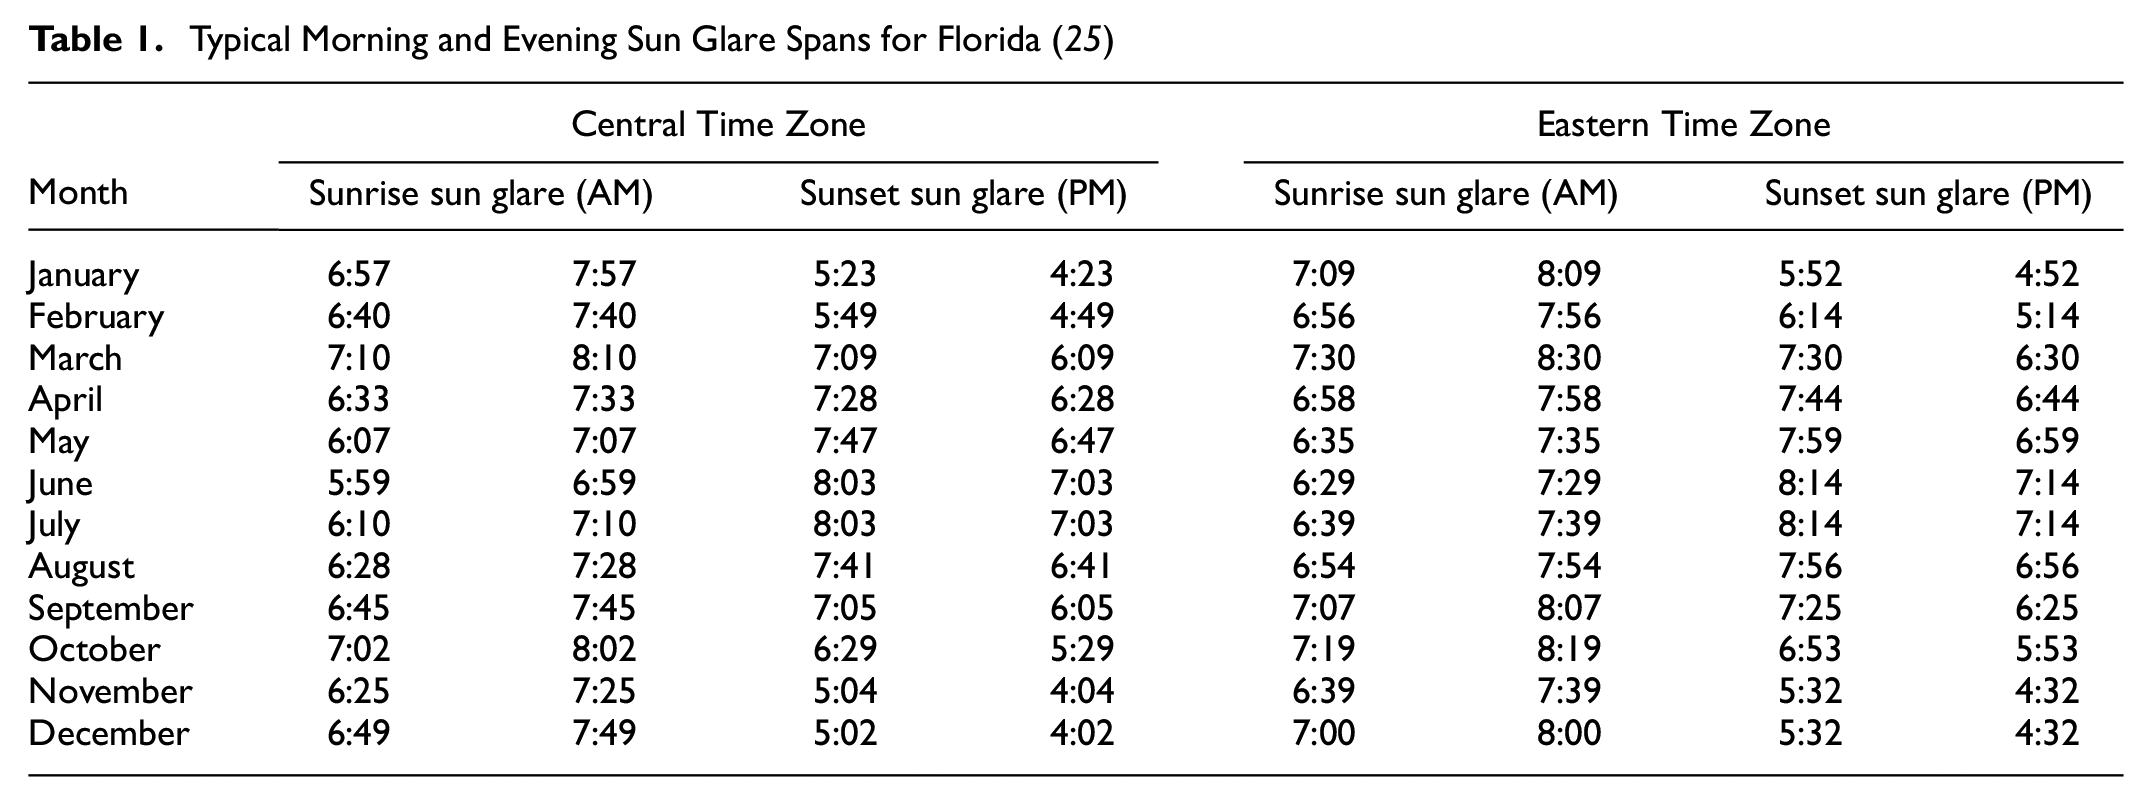
The NOAA solar calculator enables definition of the varying time spans during which the influence of sun glare increase while driving. Based on previous research, it was concluded that driver vision is adversely affected by sun glare when the zenith angle is between 55° and 85° ( 24 ), associated with the span of 1 h right after apparent sunrise for morning glare and 1 h immediately before apparent sunset for evening glare. For a more accurate estimation of the apparent sunrise/sunset, the NOAA solar calculator considers the impact of atmospheric refraction. A series of 1-h intervals for glare crash extraction is presented in Table 1 for every month of a typical year. Most of Eastern Florida is officially in the Eastern Standard Time (EST) zone (UTC−5), whereas a small portion of Northwestern Florida is located within the Central Standard Time (CST) zone (UTC−6). As illustrated in Figure 1, the blue and red lines represent the boundaries of the counties located in EST and CST, respectively. According to the final crash dataset, 1,887 crashes occurred directly under the influence of sun glare between 2014 and 2017 (see Table 2). Totaling 183, Hillsborough County appeared to have the highest number of sun glare crashes.
Table 2 presents the sun glare crash counts for the selected attributes that were taken into consideration in this research with respect to the level of injury. According to the results, severe injury crashes (i.e., fatal, incapacitating, and nonincapacitating) constituted 31% of all crashes, whereas 69% were possible injury or property damage only crashes. The variable “at-fault driver action” represents the at-fault driver’s action at the time of the crash; all possible actions were categorized into the four most common potential actions that might be adopted by drivers who were experiencing sun glare-induced blindness. Among the possible actions, driving in a careless or neglectful manner was ranked first (43%). The majority of sun glare crashes that were front to rear (57%) were attributed to the significant role that intersections played in these crashes. Accordingly, the noticeable percentage of sun glare crashes at intersections (58%) were caused by certain maneuvers that were overrepresented in their vicinity ( 26 ).
Sun Glare Crash Counts With Respect to the Level of Injury

Note: KABCO injury scale in which K = fatal (killed); A = incapacitating injury; B = nonincapacitating injury; C = possible injury; O = property damage only (PDO); dir. = direction; injur. = injury; incap. = incapacitated.
Furthermore, Table 2 indicates sun glare crashes were more likely to occur during the morning mainly because of the strict arrival times required during AM peak hours, which results in more careless driving ( 27 ). The same reasoning was applied when comparing crashes on weekdays and weekends with regards to the sharp decrease (34% on average) in sun glare crashes occurring during weekends. Additionally, major arterials and highways experienced more sun glare crashes (64%) than local roads (36%). A further classification of sun glare crash counts was made based on three continuous variables (i.e., driver age, estimated vehicle speed, and annual average daily traffic [AADT]) which will be explained in more detail in the following section.
Methodology
The main objective of this study was to assess how drivers behave under the influence of daytime sun glare. The first step was to prepare “a mutually exclusive matched dataset” that contained the same number of sun glare crashes (1,887) in their vicinity (50-ft buffer) to eliminate the influence of other traffic and geometric characteristics on crash probability. Based on the spatial selection and using the aforementioned buffer around sun glare crashes, 7,945 crashes were selected. Then, we conducted a random clustered selection procedure to choose 1,887 participants from the entire study area to avoid the impact of sample size on the quantitative comparative analysis (see Figure 1). The random clustered selection procedure was conducted in separate clusters with respect to “manner of collision” and “at-fault driver action.” In other words, the mutually exclusive matched dataset for no sun glare crashes had the same distribution ratio for both of the categories defined for “manner of collision” and “at-fault driver action” variables (see Table 3).
Random Clustered Selection With Respect to Manner of Collision and Alternative Action

To construct this mutually exclusive matched dataset without replacement from the entire population (i.e., “no sun glare crash”) that had occurred in the vicinity of sun glare crashes, we utilized the clustered random sampling function in R-Studio. The sample dataset was verified as being representative of the entire population in relation to unbiasedness and distribution. The statistical techniques used in this study included simple descriptive comparative statistics as well as a multinomial logit regression analysis.
To highlight the differences between these datasets with respect to several factors, including AADT, estimated vehicle speed, and driver age, we conducted a comparative analysis. Furthermore, we categorized the most common possible actions that drivers are likely to take in response to sun glare, as validated by previous research ( 21 , 28 , 29 ). Figure 2a indicates that careless or neglectful operation was the most likely action a driver may take, regardless of the influence of sun glare. However, this action was more frequent among sun glare crashes than those without sun glare. The “Others” category grouped together the remaining possible actions (e.g., improper passing, failure to keep in proper lane, wrong side or wrong way, improper turn, and improper backing) and was considered as reference for the multinomial logistic regression model. This means that the obtained coefficients were normalized and represented in relation to this reference action.
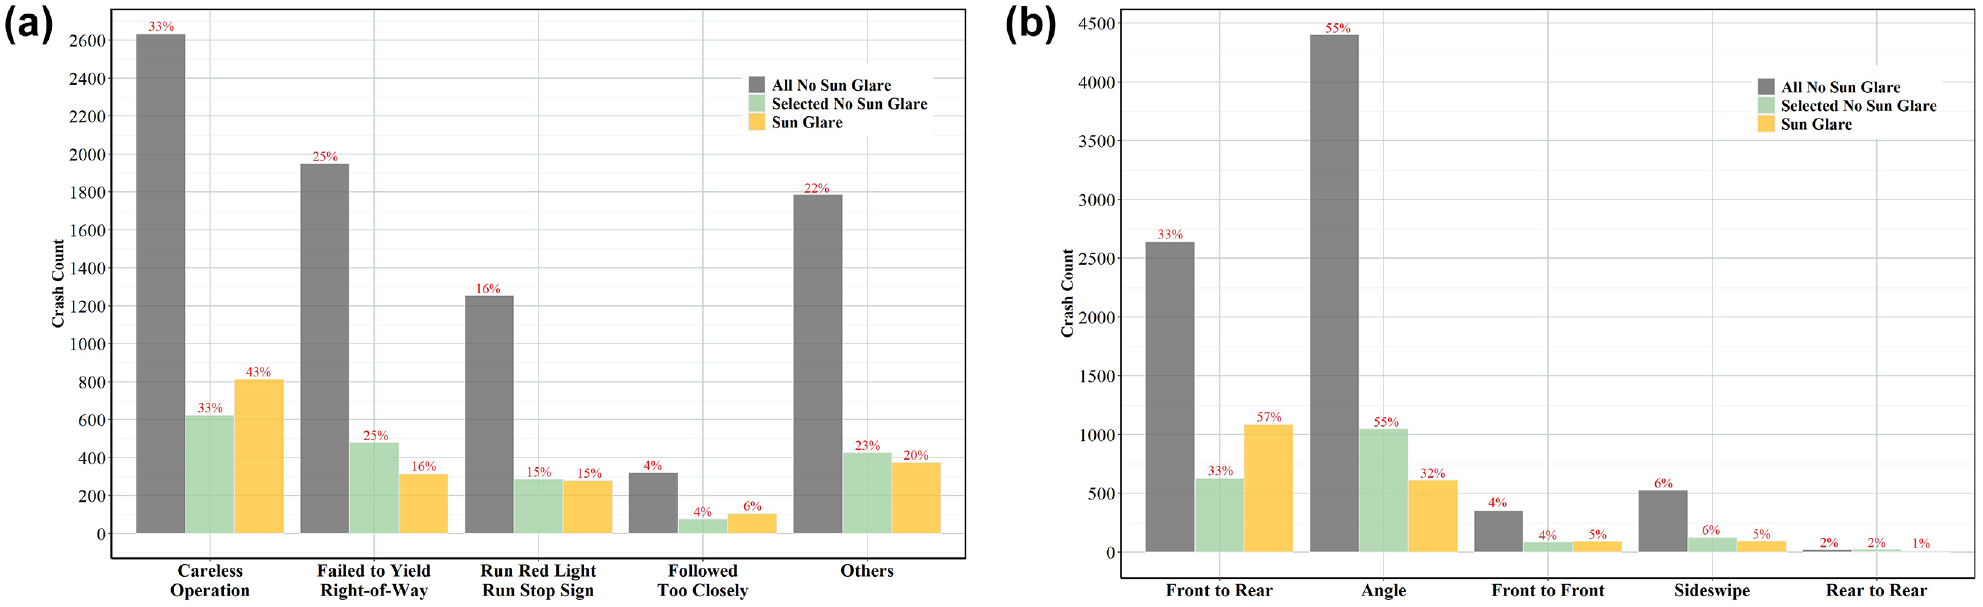
Comparison between sun glare and no sun glare crash frequency in relation to: (a) possible at-fault driver actions and (b) manner of collision.
Since a significant percentage (58%) of the sun glare crashes occurred at or in some way involved intersections (see Table 2), the matched no sun glare dataset, which included crashes in the surroundings of the sun glare crashes, also occurred at or in some way involved intersections. Although previous literature stated that the angle crash was the most problematic manner of collision in relation to frequency and severity ( 30 – 32 ), “front to rear” crashes, also known as “read end,” seemed to be the most prevalent manner of collision when drivers were exposed to sun glare (see Figure 2b). As previously mentioned, various driver actions may contribute to the aforementioned possible types of collision. The purpose of this study was specifically to investigate the impact of various crash-/driver-related characteristics on a driver’s decision to select certain possible actions when experiencing sun glare. Accordingly, a multinomial logistic regression model was developed based on the defined possible actions: “careless operation,”“follow too closely,”“violate right-of-way,” and “run red light/stop sign.” All other possible actions were grouped in a single category and considered as the reference group.
To select appropriate independent variables, we examined the variance inflation factor for each independent variable (listed in Table 2) to avoid potential multicollinearity that might have caused inflation in the regression model ( 33 , 34 ). The highly influential leverage points caused by outliers were controlled ( 35 ) to assure that the considered variables did not include any crashes that had a leverage value greater than 2 ( 36 ). Finally, we applied a recursive feature elimination (RFE) method, built a random forest model in the RFE algorithm to select the most important variables, and finalized the sun glare crash dataset for the regression model.
In accordance with the unordered multilevel nature of the outcome variable representing the possible at-fault driver action while experiencing sun glare, a multinomial logistic regression model was developed with nominal outcome variables, in which the log odds of the outcomes were modeled as a linear combination of the predictor variables. Logistic regression models have been widely used to evaluate the association between appropriate variables and a set of possible discrete choices, to assess how different circumstances contribute to the final outcome ( 37 – 39 ). In this research, the predictor variables included continuous variables (i.e., AADT, estimated vehicle speed, and at-fault driver age) and binary variables (i.e., weekend, intersection involvement, and local roadway). The following equation formulates a multinomial logistic regression to represent the choice of possible actions performed by the at-fault drivers who were affected by sun glare ( 40 ).

where
The choices consisted of five actions previously described by Florida Department of Highway Safety and Motor Vehicles : (1) operating the vehicle in a careless or negligent manner (careless operation), (2) following the front car too closely (follow too closely), (3) failing to yield right-of-way (violate right-of-way), (4) running a red light or stop sign at different types of intersections (run red light/stop sign), and (5) other potential actions (Others) that are rarely performed by drivers at the time of sun glare crashes ( 23 , 41 , 42 ). Because of their independence, irrelevant alternatives seemed quite distinct from the alternative actions defined by the aforementioned categories. The chosen action was based on the difference in characteristics between the alternatives. We assumed four possible alternative actions, taking “Others” as base,

where
K is the predictor variables; and
n is the total number of sun glare crashes.
We also examined the logistic distribution of
Results and Discussions
In this section, we explain the contributions of the selected predictors on the choice of possible actions during daytime sun glare crashes when the drivers were responsible for the crashes. Figure 3 illustrates the contribution of the continuous predictors (i.e., AADT, estimated vehicle speed, and driver age) in sun glare crash count bar plots and compares the associated distribution with that of no sun glare crashes. Figure 3a indicates that the crash frequency, as a function of AADT, was right-skewed for both sun glare- (shown in yellow), and no sun glare (shown in gray) crashes. Furthermore, no significant differences were found between the two, although the AADT value for crashes with sun glare (24,200) was slightly lower than those without sun glare (26,500). This indicated that sun glare crashes were less likely to occur along roadway networks with higher AADTs. Further, we calculated the 15th, 50th, and 85th percentiles, representing AADTs of 6,100, 20,000, and 44,000, respectively, and categorized the AADT values accordingly. We found that sun glare crash counts differed the most from no sun glare crash counts in segments with AADTs less than 6,100 (15th percentile). On the other hand, in segments with AADTs ranging between the 50th and 85th percentiles, there was greater representation of no sun glare crashes thansun glare crashes. As shown in Figure 3b, there was a noticeable increase in the number of crashes caused by sun glare if the estimated vehicle speed exceeded 35 mph (75th percentile). A further consideration of the at-fault driver’s age is shown in Figure 3c, which demonstrates that sun glare crashes were more prevalent among aging drivers (i.e., 65 years of age and older).

Crash count distribution for sun glare versus no sun glare crashes according to: (a) annual average daily traffic (AADT), (b) estimated vehicle speed, and (c) at-fault driver age.
Table 4 summarizes the multinomial logistic regression results that model the relationship between the selected predictors with respect to the possible actions. The reference for alternative driver actions was “Others,” therefore, all estimated coefficients were normalized in relation to this. The odds ratios were calculated for each variable to determine the probability that a particular action would be taken by drivers compared with the “Others” action. Although McFadden’s pseudo R-squared value (Table 4) did not appear to be particularly high, it remained within an acceptable range ( 43 , 44 ). Therefore, the developed model was confirmed to be capable of modeling the relationship between the selected predictors and the nominal possible actions. McFadden’s pseudo R-squared value could possibly have been increased if the insignificant variable was removed from the model; however, we preferred to retain all of the selected variables as they all contributed to at least two possible alternative actions.
Multinomial Logistic Regression Results With Coefficients for “Others” Actions Normalized to Zero

Note: AADT = annual average daily traffic.
p < 0.1; **p < 0.05; ***p < 0.01.
A significant decrease in the contribution of AADT, with an estimated coefficient of −0.136, to the likelihood of violating right-of-way confirmed that a 10,000-unit increase in AADT decreased the relative risk of failing to yield right-of-way by a factor of 0.872, while increasing the relative risk of following the car in front too closely by 26%. When compared with “Others” (i.e., possible at-fault driver actions), the coefficients for the estimated vehicle speed variable indicated that a higher estimated speed was associated with a higher likelihood of running red lights/stop signs and careless driving, and a lower possibility of violating right-of-way.
As indicated by the estimated coefficients for driver age (Table 4), older drivers were more likely than younger to run red lights/stop signs as well as fail to yield right-of-way when experiencing sun glare. Furthermore, there was no evidence that this variable contributed significantly to careless operation or following the car in front too closely (p-value > 0.1). In light of the variable representing the probability of crashes involving sun glare during the weekend, the relative odds ratio for driving in a careless or negligent manner would decrease by a factor of 0.737 if the other variables in the model were held constant. Accordingly, sun glare crashes during the weekends were less likely to result in careless operation than those on weekdays. This contradictory conclusion was also valid for running red lights/stop signs for this variable, that is, there was a 1.675 times greater likelihood of running red lights/stop signs on weekends than during weekdays.
The positively significant estimated coefficient associated with the “intersection involvement” variable for running red lights/stop signs confirmed the following: if drivers were faced with sun glare when approaching an intersection, they would probably run a red light/stop sign with a relative risk ratio of 5.021 compared with other possible actions. According to this conclusion, sun glare might contribute to severe injury crashes, particularly at intersections. A similar conclusion could be drawn for failure to yield right-of-way, with a lower relative odds ratio of 2.209. The opposite signs of the estimated coefficients for the “local roadway” variable also indicated that under the condition of sun glare, careless operation was less likely to occur on local roadways by a factor of 0.79, whereas running red lights/stop signs was 1.459 times more probable on such roadways.
Intersection collision avoidance technologies including, but not limited to, automated traffic signal performance measure ( 45 ), cooperative intersection collision avoidance system for violations ( 46 ), and autonomous emergency brake on forward collision warning systems ( 47 ) can be helpful. These infrastructure-to-vehicle- and vehicle-to-vehicle communication systems are able to improve the safety condition of the locations prone to this hazard particularly during apparent sunrise and sunset. For instance, the effectiveness of haptic-based in-vehicle technologies, as well as audio-based technologies, such as hand-transmitted vibrations ( 48 ) and radio frequency transmissions ( 49 ), have been extensively examined in previous studies. The aforementioned commercially available technologies could thus be implemented specifically to prevent crashes that may occur during temporary sun glare-induced blindness by dispatching warning signals when hazardous conditions are present.
Conclusions
Previous research has demonstrated that sun glare contributes significantly to roadway crashes as a circumstantial factor that might be claimed to be an uncontrollable event. The main objective of the current study was to (a) investigate crashes that possibly occurred under the direct influence of daytime sun glare, and (b) quantify the likelihood of potential actions being performed by drivers experiencing temporary vision impairment caused by solar rays while driving in eastbound or westbound directions during apparent sunrise and sunset, respectively. A multinomial logistic regression model formulated the relationship between the set of potential alternative actions and the characteristics of sun glare crashes to assess the associated consequences. The regression analysis indicated that running red lights/stop signs was the most probable action taken by drivers under the influence of sun glare, particularly during weekends at intersections located on local roadways. To prevent crashes that may occur under the direct influence of sun glare, the obtained findings may serve as useful guidelines for crash prevention measures and allow safety officials and automobile manufacturers to support effective practical safety countermeasure projects. To examine the exact adverse influence of sun glare on drivers’ facial expressions, it would be beneficial to employ more detailed eye-tracking information that could be acquired using image processing techniques ( 50 ). These factors could potentially be available in preliminary studies, so we could incorporate them into regression models in future studies to draw more reliable conclusions, while also using them as descriptive variables in the connected vehicles environment ( 51 , 52 ). In addition, the obtained results provide insights into the severity of pedestrian-involved crashes that are caused by drivers experiencing sun glare ( 8 , 53 ).
Footnotes
Acknowledgements
The authors thank the Florida Department of Transportation Safety Office for providing the crash data.
Author Contributions
The authors confirm contribution to the paper as follows: study conception and design: M. Koloushani, M. Kaya, A. Karaer, E. E. Ozguven; data collection: M. Koloushani; analysis and interpretation of results: M. Koloushani, E. E. Ozguven; draft manuscript preparation: M. Koloushani, M. Kaya, A. Karaer, E. E. Ozguven. All authors reviewed the results and approved the final version of the manuscript.
Declaration of Conflicting Interests
The authors declared no potential conflicts of interest with respect to the research, authorship, and/or publication of this article.
Funding
The authors received no financial support for the research, authorship, and/or publication of this article.

The opinions, findings, and conclusions expressed in this paper are those of the authors and not necessarily those of the Florida Department of Transportation.