



Abstract
A permissive left turn is one of the most dangerous movements a driver can make because the driver travels across opposing traffic lanes. In recent years, flashing yellow arrow (FYA) signals have been proven to help drivers make safer left turns. The four-section signal display with FYA permissive left-turn indication creates an opportunity to enhance the left-turn phase with a variable mode that can change on demand. A challenge to using this system is knowing the best times of day to apply the FYA indication. The authors developed an exclusive hardware platform: first, to provide a generic device compatible with the different controller types used by different jurisdictions and, second, to automate selection of the FYA left-turn modes based on available gaps in the opposing traffic at intersections acquired in real time from existing sensors in the field. Phase IV provided conclusive field testing and evaluation of the decision support system (DSS), by switching between red and FYA modes in a rational manner consistent with driver expectations and left-turning gap acceptance thresholds. It was also concluded that coordinated signals with long cycle lengths, 3 min and longer, help provide adequate gaps even in heavy traffic patterns since most of the vehicle arrivals are in platoons and at the beginning of the cycle. The analysis showed that the utilization factor for the DSS recommendations for all the intersections ranged between 65% and 75% during peak conditions on weekdays and between 90% and 95% during off-peak conditions and weekends. The total delay in the before study for all the intersections amounted to 737 vehicle-hours and in the after-study was 440 vehicle-hours of delay. An overall reduction of about 40% in delay which confirms the operational benefit of the dynamic FYA DSS. The developed platform is applicable at any four-section head configuration to maximize safety and efficiency of the intersections.
A road traffic signal display of four-arrow arrangement with flashing yellow arrow (FYA) creates an opportunity to enhance the left-turn signal with a variable mode that can be changed by time of day on demand. Phase I of this research project provided the framework and detailed process of developing a decision support system (DSS) with the use of an interactive model ( 1 ). The DSS facilitates the selection of the FYA left-turn mode and signal changes by time of day at intersections. There was a need to continue to refine the interactive framework to improve its service as a DSS. The framework already allowed for an interactive evaluation of the permissive left-turn phase and was able to recommend phasing mode by time of day. However, the ultimate objective of the continued research of phase II was to demonstrate the ability to execute the automation of the process in a field-testing environment through the use of an active controller.
Phases II and III of the FYA project provided additional video data that were extracted on a second-by-second basis ( 2 – 4 ). The master database was increased to 38 intersections with locations across the State of Florida. The data extraction process in phase II was completed to match the basic prioritized parameters that were used to refine the developed model in phase I. With an expanded database, the model’s coefficient of correlation was improved because of the increased model domain. Finally, the total hours used in the statistical analysis were 1,058 h.
The main objective of the research presented in this paper is to test the final refined DSS and the algorithm criteria based on cycle-by-cycle data in the field where actual intersection field data were obtained through loop detector mapping in real-time mode. Vehicle detection through loops or video detection is sensed in the field by the cabinet and the controller. Then it is mapped in real-time mode from the intersection approach to the digital I/O board to retrieve instantaneous channel input data in each lane. The algorithm analyzes the traffic data and makes a decision accordingly that is communicated back to the controller and generates a real-time log recording the events.
Literature Review
Several references were examined in the process of determining the background information and motivation for this research. Numerous past studies have been conducted to develop guidelines or warrants for determining left-turn signal control at signalized intersections which are often presented in a sequence format such as flowcharts or a step-by-step process using a ranking score. These studies examined various traffic parameters that have an effect on the signal operation such as traffic volume, delay, geometry, crash data, speed and many other related factors. Furthermore, studies related to FYA focused mainly either on driver’s comprehension of the FYA indication or its safety performance. Brehmer et al. ( 5 ) concluded that the FYA permissive indication was equally understood as the circular green indication, but the data demonstrated that drivers’ understanding of the FYA display increased with exposure and the FYA display showed a higher fail-safe response than the circular green indication. The teams of Noyce et al., Knodler et al., and Kacir et al. have published research on the subject of FYA which included the initiation and foundation of the FYA indication ( 6 ), its application in separated left-turn lanes ( 7 ), tracking driver eye movement ( 8 ), driving simulator studies ( 9 ), evaluation of the FYA ( 10 ), and driver and pedestrian comprehension ( 11 – 14 ).
Deskins developed specific methods for operation and detection of the FYA permissive left-turn indication ( 15 ). Agent developed guidelines for the use of protected/permissive left-turn phasing based on crash analysis and concluded that it is the preferred approach of left-turn phasing because of savings in time compared with protected only phasing ( 16 ). However, the guidelines warn that FYA creates an increased crash potential, and it should not be used if certain conditions related to speed limits, number of crossing lanes, and historical crash data exist. In a follow up to Agent’s study by Stamatiadis et al. ( 17 ), a two-step approach is considered in the decision whether to install left-turn phasing. The recommendations made take into account many variables, including left-turn volumes, accident rates, product of opposing and left-turn volumes, and left-turn delays. Al-Kaisy and Stewart ( 18 ) developed a volume-based warrant approach for protected left-turn phase at signalized intersections using simulation. They indicated that the volume of opposing through traffic may have little impact on when a protected left-turn phase is warranted and concluded that the mode was not to be determined by traffic volumes alone and is a combination of multiple traffic variables as alluded to previously in the parameters defined by Agent ( 4 ). Zhang et al. ( 19 ) tried to combine both existing empirical warrants and an optimization-based volume warrant similar to that proposed by Al-Kaisy and Stewart ( 18 ) to develop a comprehensive decision flowchart for the selection of left-turn control modes. Chang et al. ( 20 ) developed a hybrid model for left turns based on saturation flow rates using simulation.
Hu et al. ( 21 ) introduced a new approach based on the analytical hierarchy process to determine left-turn control types using a ranking score considering several traffic factors in a case study of 14 intersections in the Reno-Sparks area of Nevada. Chen et al. ( 22 ) evaluated the safety impacts of changing left-turn signal phasing from permissive to protected/permissive or protected-only at 68 intersections in New York City using a rigorous quasi-experimental design accompanied with regression modeling. The results suggested that left-turn phasing should not be treated as a universal solution, considering the trade-offs between safety and delay, and many other factors such as geometry, traffic flows, and operations. Gal-Tzur et al. ( 23 ) developed a DSS for controlling traffic signals using systematic scanning of a wide range of alternatives and included a special algorithm that recommends the most promising strategies in a statistical decision tree format. Ozmen et al. ( 24 ) introduced a new guideline for determining left-turn control type based on the principles of multi-criterion decision analysis and provided an index-based recommendation using weights and scores; a numerical scale was used to compare each type of left-turn control with the others instead of an absolute type.
Yu et al. ( 25 ) developed guidelines for recommending the most appropriate left-turn phasing treatments at signalized intersections utilizing both operational and safety impacts to construct a flowchart similar to the NCHRP 457 report by Bonneson and Fontaine ( 26 ). However, the chart indicated some additional parameters for consideration.
Gap Acceptance
Over the years, numerous studies have been conducted to model gap acceptance. Miller found that most estimators of gap acceptance suffer from either bias or statistical inefficiency because of the over-representation of cautious drivers who reject many gaps before final acceptance ( 27 ). This indicates that there is no one model that can be applied to all intersections as driver decide for themselves whether the size of the gap from incoming traffic in the opposite direction is adequate for them to make a turn. This is especially relevant for left-turn maneuvers, as intersection delay plays a big role in traffic planning and signal control design.
In a closed-course driving experiment, Cooper and Zheng ( 28 ) concluded that when not distracted, drivers’ gap acceptance was influenced by their age, the gap size, the speed of the trailing vehicle, the level of “indecision,” and the condition of the track surface. Regression analysis found that mean headway was greatly affected by driver distraction and vehicle position in the queue. It was also estimated that a distracted driver’s headway was 0.385 s greater than that of an undistracted driver ( 29 ). Another study deduced that the presence of pedestrians perturbed drivers and made the delay at intersections longer than necessary ( 30 ). On the other hand, a study conducted in Idaho found that driver impairment was not a major contributing factor for left-turn delay at signalized intersections ( 31 ).
Logit modeling of drivers’ gap choices indicated that the main factor affecting the decision of drivers is the distance from the subject vehicle to the opposing vehicle. The study also found that the probability that a driver will accept a gap of a given duration increases as the speed of the oncoming vehicle increases ( 32 ). Another study concluded that the highest maximum rejected gap values were observed when the ending gap vehicles were major street left turns because the deceleration of these vehicles led to a larger rejected gap than what would have been accepted by a minor street driver. It was found that intersection geometry, approach grade, vehicle type, and movement type were the major factors affecting the critical gap. As the number of lanes increased at an intersection, the critical gap increased because of the added maneuvering difficulty drivers experienced ( 33 ). Similarly, another study conducted with a driving simulator concluded that drivers making a left turn into a lower-speed major road tend to select larger gaps and try to keep a larger separation from the following vehicle on the major road thus leading to larger than necessary rejected gaps ( 34 ). Other researchers concluded that the duration of stopped delay experienced by minor road drivers while assessing gaps in the main traffic stream influences their gap acceptance behavior. The shorter the delay, the more relaxed the driver is. The study found that when the average delay exceeded 30 s, drivers make more dangerous decisions and accept shorter than normal gaps ( 35 ).
A study conducted in Berkley, California found that drivers making turns at the end of the green or yellow phase are generally more aggressive than those turning in the earlier portion of the green interval. The research concluded that when the vehicle attempting to make the left turn is 3–5 s away from the intersection and drivers have a 2 s window to check for incoming complications, gap acceptance deviated less than 10% ( 30 ). Another study found that the duration of the yellow change and red clearance intervals greatly affects driver behavior in relation to the decision to turn ( 36 ). Noyce et al. ( 37 ) found that phasing sequence was more responsible for the variability in drivers’ average response time than display type or location. The analysis also showed that there was no difference in saturation flow rate and start-up lost time with regard to the type of signal display (protected or permitted left turn). The shortest follow-up headway was associated with the five-section cluster display using a green ball indication. However, Pulugurtha et al. ( 38 ) used an empirical Bayes technique for evaluation and found that the installation of the FYA signal prevented more crashes than its green ball counterpart. Lin et al. reached a similar conclusion when their study concluded that when the FYA signal was implemented, most drivers accepted longer gaps to make their permissive left turns, thus improving overall safety ( 39 ).
As can be concluded from the literature, the majority of studies have tried to develop warrants and guidelines for the permissive left-turn phase. Although the developed guidelines are applicable, they are not considered practical to be implemented in the field. Additional information is needed for before and after study conditions. For left-turn volume warrants, almost all studies were consistent in applying the cross-product methodology of left-turn and opposing through volumes as the main warrant. A cross product is generally accepted as a signal warrant but lacks the ability to be inclusive of all intersections especially at different time scales. Moreover, other studies tried to understand and identify an appropriate relationship between driver’s gap acceptance in the opposing traffic to make a left turn, but it was inconclusive. Different methods for estimating gap acceptance have been investigated. Most of these methods assume that the gaps follow some kind of distribution (normal, gamma) which can be described by an average value for all the drivers observed. However, gap acceptance is a judgment threshold; that is, different drivers or even the same driver at different times have different critical gaps based on different behavior and driving conditions. As such, it needs to be within a specific range according to field conditions at each intersection and not a single value. Furthermore, gap acceptance calculations using all the methods have a trend of decrease with the increase of flow rate. When the opposing flow rate is low, left-turn drivers are inclined to reject some larger gaps since there are many available large gaps, so the critical gap increases. When the opposing traffic has a high flow rate, drivers are inclined to accept some smaller gaps because of the lack of available large gaps in the major stream, which is an important reason why drivers make poor decisions and will take the risk of entering the intersection with the increase of waiting time, so the critical gap decreases.
Cycle-by-cycle data have been shown to be effective in the analysis of a signalized intersection with measures of effectiveness such as volume-to-capacity ratios, arrival type, headway calculation, and average vehicular delay. In this research, minimum gap acceptance value is based on cycle-by-cycle data collected in the field where actual intersection conditions were obtained through loop detector mapping in real time as a function of the opposing demand combined with the available amount of opposing green time and number of crossing lanes. This research develops an integrated general purpose data collection module that time stamps detector and phase state changes within a National Electrical Manufacturers Association (NEMA) actuated traffic signal controller to provide recommendations for the FYA left-turn phasing mode on a cycle-by-cycle basis based on available gaps in the oncoming traffic.
Hardware/Software Description
The first step was to examine and study the available data logger hardware devices on the market. The goal is to procure a hardware board that has two-way communication and is capable of connecting to the traffic controller on one side and to a computer on the other. An input/output device is needed to complete the process and relay the decision back to the controller. The board is normally driven by a software interface that connects it to, and allows to be controlled by, the computer. This software is typically provided by the manufacturer to help developers interact with the hardware and build useful functionality into the system.
The project requirements for the hardware board are essentially the following:
i. Digital input/output board, that is, capable of handling both digital input and output channels
ii. Has sufficient input and output channels to address multiple lanes and instructions
iii. Simple software interface compatible with Microsoft Visual Studio
iv. Portable.
The board used in this study was a digital input/output board. The software interface is relatively easy to install and use. The board is capable of handling 16 digital input and 16 digital output channels to accommodate any number of lanes. The basic communications software that accompanied the digital board was limited considering what was required in this project. It essentially establishes connection with the board and generates a text file with the data received through the input channels. To access the text file, data logging has to stop. What was needed, however, was real-time access to the channel data as it is received by the board so that the algorithm can analyze traffic information in real time and make accurate decisions. Custom communications software was needed on top of the basic software which has three main functions: control the hardware, display real-time status, and execute the proposed FYA algorithm. The University of Central Florida (UCF) research team developed a specific code to retrieve instantaneous channel input data, synchronize opposing through-green phase, analyze traffic information, provide the algorithm decision, and generate a real-time log recording the events. The software was developed using the C# language under Microsoft’s™ Visual Studio 2013. The components are shown in Figure 1.

University of Central Florida custom data logger software.
Input Data
The custom software monitors up to five channels simultaneously: up to four channels for the traffic lanes and one channel for the through-green phase. The algorithm analyzes the traffic flow data received during the latter phase which is synchronized by the input on the phase channel. There is also a configuration file for specifying different parameters needed for each intersection. The configuration file specifies the opposing number of lanes, the analysis period to determine the number of cycles to be analyzed before providing a decision, the application period which specifies the frequency to provide a decision after the analysis period whether after each cycle or more and lastly, the actuated cycle length in seconds.
FYA Algorithm
Headway Modeling
Modeling the arrival of vehicles was an essential step in the algorithm logic. The vehicle arrival is obviously a random process so it needs to be characterized statistically. Vehicle arrivals can be modeled in two interrelated ways: modeling the time interval between the successive arrivals of vehicles or modeling how many vehicles arrive in a given interval of time. In the former approach, the random variables represent the time denoting the interval between successive arrivals of vehicles and thus some suitable continuous distribution can be used to model the vehicle arrival. In the latter approach, the random variables represent the number of vehicles that arrived in a given interval of time and so it takes some integer values. In this case, a discrete distribution can be used to model the process.
The developed algorithm utilizes the former approach and uses continuous distributions to model the vehicle arrival process. However, the inter-arrival time or the time headway is not constant because of the stochastic nature of vehicle arrival, and also the behavior of vehicle arrival is different at different flow conditions. Therefore, it may be possible that different distributions work better at different flow conditions.
The negative exponential distribution is used when the traffic is low and is the simplest of the distributions in computation effort. The normal distribution on the other hand is used for highly congested traffic and its evaluation requires standard normal distribution tables. The Pearson Type III distribution is the most general case of negative exponential distribution and can be used for intermediate or normal traffic conditions. Unlike many other distributions, one of the key advantages of the negative exponential distribution is the existence of a closed form solution to the probability density function. The negative exponential distribution is closely related to the Poisson distribution which is a discrete distribution. The probability density function of Poisson distribution is given as:

where p(x) is the probability of x events (vehicle arrivals) in some time interval (t), and λ is the expected (mean) arrival rate in that interval. If the mean flow rate is q vehicles per hour, then λ =

Since mean flow rate is the inverse of mean headway, an alternate way of representing the probability density function of negative exponential distribution is given as

where μ =

Distribution of gaps by number of crossed lanes: (a) distributions for crossing lanes = 1; (b) distributions for crossing lanes = 2; (c) distributions for crossing lanes = 3; (d) distributions for crossing lanes = 4.
Algorithm Logic
The idea was to devise a technique that would predict traffic behavior in the short term based on historical data of the past few minutes using a moving average window. The method examines the traffic for a user-defined number of cycles to predict the behavior for the following cycle. A decision is then created, and the analysis window is updated by dropping the older cycle in the window and adding the current one. The process is then repeated continuously.
The algorithm applies a two-cycle window of historical traffic data for analysis at every cycle. During analysis, the algorithm constantly searches for gaps across all lanes of the traffic flow in the previous two cycles. Any gap meeting or exceeding the minimum headway threshold, shown in Table 1, is taken into account as a valid gap and stored in an accumulator. The decision to switch to FYA is made when the cumulative valid gap(s) in the analysis window meet or exceed six times the minimum threshold, which is an average of three times per analysis cycle. As a safety precaution, the default and fallback decision is a red arrow.
Flashing Yellow Arrow Algorithm Minimum Headway Criteria

The decision is made based on several parameters. These parameters include the number of opposing through lanes, the number of crossing lanes, the minimum headway in seconds corresponding to the number of lanes to cross, and the number of cycles in the analysis window. Table 1 shows the minimum headway (gap) in seconds corresponding to the number of lanes to cross. The thresholds used for different number of lanes crossed was obtained from the database of 30,000 cycles collected from the field.
Discrete and Average Logic
Two approaches were tested to calculate the minimum gap: discrete and average approach. The discrete approach determines the time interval between the successive arrivals of vehicles for each lane independently and computes the lowest headway for each lane by cycle on a second-by-second basis. The algorithm then picks the minimum headway and compares it with the minimum acceptable gap shown in Table 1 needed for a vehicle to cross the given number of lanes safely. If the minimum headway for the corresponding number of lanes is achieved and repeated three times per cycle, the decision is made to switch to a flashing yellow mode. Otherwise, a red arrow is decided on. The three-time threshold was determined based on a sensitivity analysis of the cycle-by-cycle data collected from the field.
The average approach determines the heaviest lane of flow during the analysis period which is two cycles. It then determines the minimum gap duration by dividing the headway by the flow in the heaviest lane.

If the minimum headway for the corresponding number of lanes is achieved and repeated six times in the two cycles, the decision is made to switch to a flashing yellow mode. Otherwise, a red arrow is decided on.
Evaluation of Protected Only Left Turn
One of the intersections used in the algorithm evaluation was the intersection of Semoran Blvd and Old Cheney Highway located in Orange County in Orlando, FL. The northbound left (NBL) turning movement is operating with protected-only mode. At the vicinity of the intersection, Semoran Blvd is a four-lane divided arterial running north–south with a posted speed limit of 45 mph, connecting Orange County with Seminole County. The intersecting road is Old Cheney Highway which is a two-lane road running east–west with posted speed limit of 35 mph. Commercial land uses exist on all quadrants of the intersection. The intersection has exclusive eastbound (EB) and westbound (WB) left-turn lanes. The EB and WB left-turn lanes have a four-section head, which operates in a protected permissive mode throughout the day. However, the mainline on the north–south left-turn approaches have four section heads but operate in a protected-only mode. The traffic in the southbound through movement is heavy throughout the day especially during the morning and evening peak hours. As such, Orange County Traffic Engineering decided to operate the north–south left-turn movements in protected-only mode in addition to crossing four lanes of traffic. The study approach was the NBL lane. The southbound (SB) has four through lanes with video detectors. Therefore, the DSS was set up to receive data from the four lanes, and the minimum gap time was set to cross four lanes as well. The intersection was running in a coordinated mode. The cycle length was almost steady during the peak periods and was around 180 s but fluctuates during off-peak periods between 140 and 150 s.
Decision Assessment and Field Data Validation
Table 2 shows the DSS log file on a second-by-second basis for part of a cycle with vehicle arrival in fractions of a second in each lane and the calculation of gaps. Table 3 provides a summary of the log file output and the DSS decisions in each cycle during the testing period for the NBL along Semoran Blvd Road. The study approach has four opposing lanes to be crossed which correspond to a minimum threshold of 27 s before deciding on a FYA mode based on the discrete method. The 12 h testing period resulted in 255 cycles with a majority of FYA decisions (192 cycles) which showed heavy traffic pattern especially during peak periods which encompassed the morning, midday, and evening peak hours. Approaching the evening peak hour, around 5:08 p.m., the algorithm decision was red arrow for eight cycles. The results also showed steady fluctuations between the red arrow and YFA decisions which are considered reasonable and indicate that the threshold is rational and practical. Figure 3 shows a 2 h snapshot (5:00–7:00 p.m.) graphical representation of the gaps and the threshold. As can be seen on Figure 3, the maximum total gaps reached 108 s at 6:44 p.m. and the minimum gap was 0 s at 5:26 p.m. The decisions were also verified from the rest of the data which shows the number of vehicles that arrived during the green phase along with the amount of green time in each cycle and the cycle length. For example, at 5:26 p.m., the decision was to inhibit FYA because of the absence of gaps which can be verified by the 94 vehicles, in the heaviest lane, that arrived during 108 s of green phase. The average method calculates the saturation headway and proves that the approach was operating at capacity.
Short Gap That Did Not Meet the Minimum Threshold

Cells marked with a “dot” means there were no cars detected.NA = not available.
Decision Support System Results by Cycle for Semoran Blvd at Old Cheney Highway Northbound Left Turn

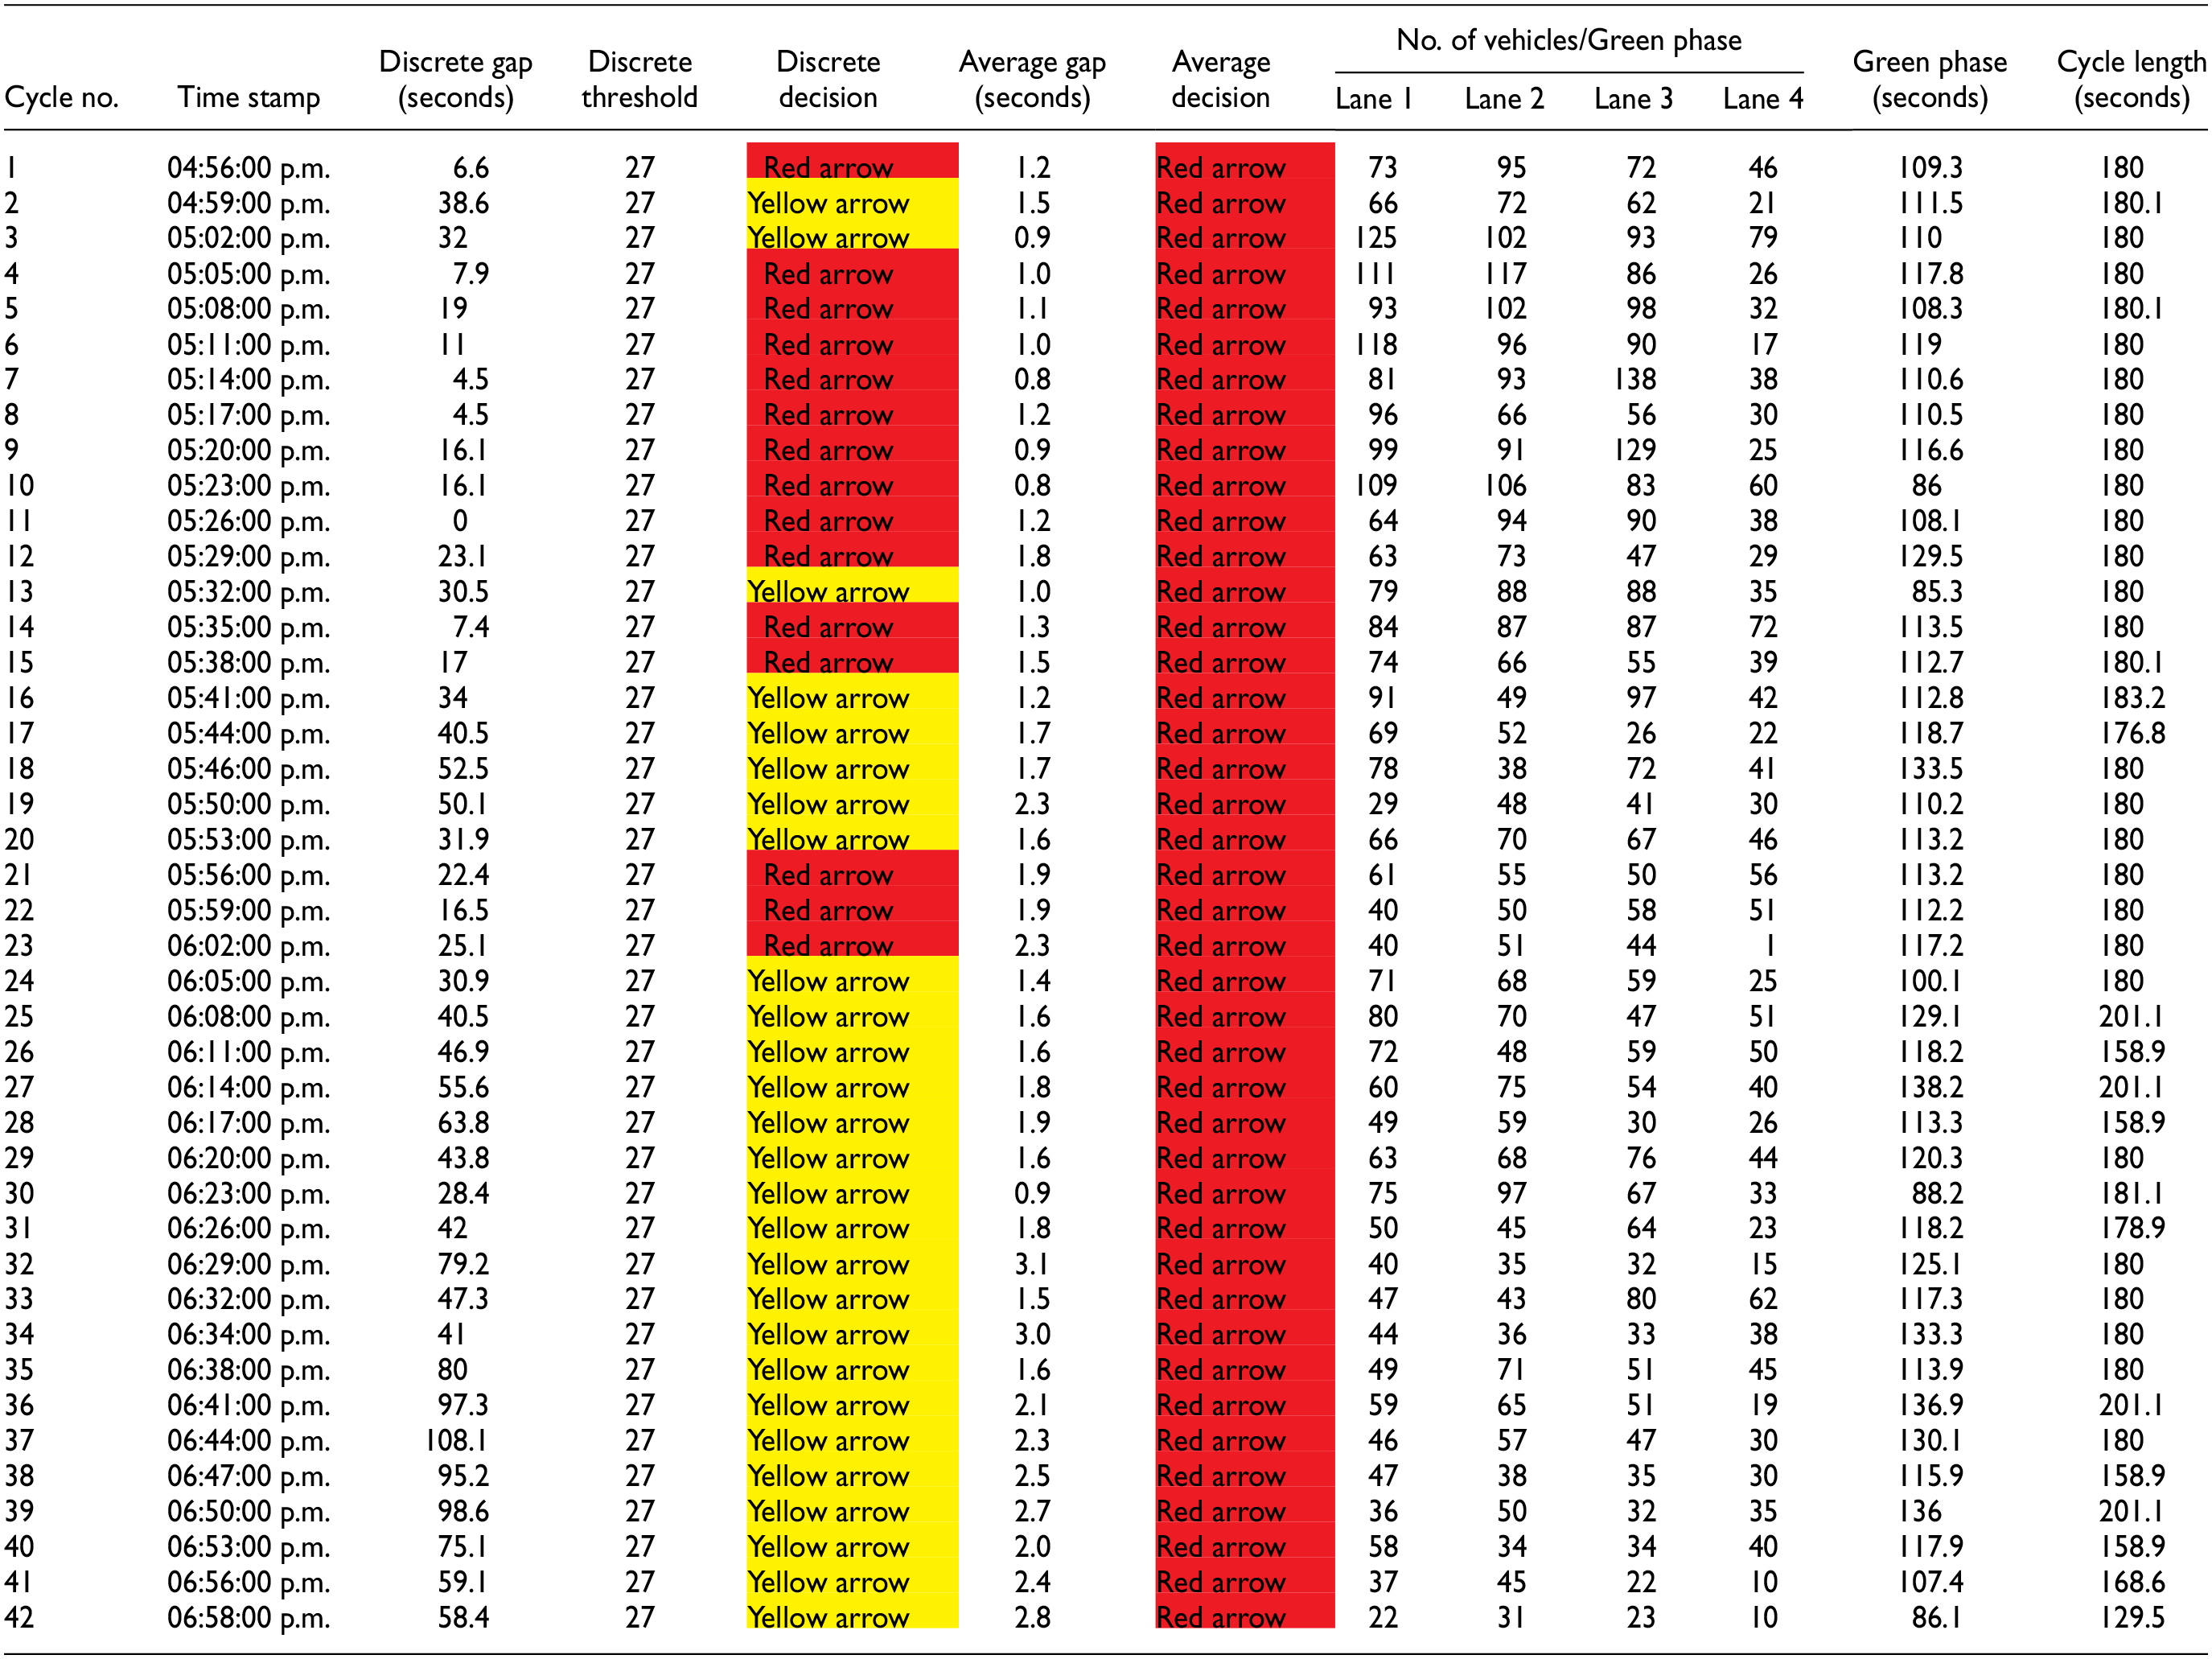

Decision support system results by cycle for Semoran Blvd northbound left turn.
Dynamic FYA Evaluation for Semoran Blvd (Before and After)
Figure 4 shows a dashboard for the evaluation of the dynamic FYA (DFYA) algorithm before and after its implementation in the field. The dashboard shows the total 12 h period from 7:00 a.m. to 7:00 p.m. and the amount of opposing green time, available gaps, and number of vehicles that crossed and failed to cross in different colors. In the before case, the left turn was operating in a protected-only mode, which is why all vehicles failed to cross during the opposing through green phase (shown in red color as failed to cross). The main measures of effectiveness collected were the FYA utilization factor and total vehicle-hours of delay, which was calculated only during the opposing through green phase which reflects whether the left turn is flashing or not. As can be seen in the before case, zero vehicles crossed throughout the day and the total delay amounted to approximately 19,300 vehicle-hours of delay. However, in the after case, with the implementation of the DFYA algorithm, there were available gaps above the threshold which recommended a FYA instead of the red arrow, allowing vehicles to cross. The dashboard results show a utilization factor of 66% and the total delay was reduced to approximately 1,200 vehicle-hours of delay, about 93.7% reduction in delay over the 12 h period.

Decision support system results by cycle for Semoran Blvd northbound left turn (7:00 a.m.–7:00 p.m.), before and after.
Evaluation of a Protected-Permissive Left Turn (FYA)
John Young Parkway (JYP) is a north–south six-lane divided principal arterial in Orange County with a posted speed limit of 45 mph. Within the vicinity of the intersection and between the ramps to SR 408, JYP has eight lanes. The additional lane is used as an auxiliary lane for the westbound on-ramp. SR 408 is an east–west expressway with eight lanes and posted speed limit of 60 mph. JYP intersects with the eastbound off-ramp and on-ramp which is considered as a T intersection. The area is predominantly residential on the west side and commercial land uses are on the east side. The intersection has an exclusive SB left turn lane. The EB approach has dual left-turn lanes and single right-turn lane. The SB left-turn lane has a four-section head which operates in a protected permissive mode throughout the day. This was considered a key location to test the DSS while crossing four lanes of traffic. The study approaches were the SB left turn (SBL) and northbound opposing through (NBT) lanes. The NB has four through lanes with loop detectors. Therefore, the DSS was set up to receive data from four lanes and the minimum gap time was set to cross four lanes as well. The intersection was running in a coordinated mode with cycle length of 130 s.
Decision Results and Assessment
Table 4 provides a summary of the DSS decisions in each cycle during the testing period for the SBL along JYP. The study approach has four opposing lanes to be crossed, which corresponds to a minimum threshold of 27 s before deciding on a FYA mode based on the discrete method. The 12 h testing period resulting in a total of 315 cycles with a majority of YFA decisions (300 cycles) was observed, although there was slightly heavy traffic pattern especially during the peak hours. The traffic pattern stayed moderate to heavy throughout the testing period. A total of 3,730 vehicles arrived in the four lanes. However, as mentioned earlier, coordinated signals with very long cycle lengths such as the 3 min cycle help in providing sufficient gaps, especially when most of the vehicle arrivals are in platoons because of coordination. The average method showed several YFA decisions which showed that the traffic did not reach saturated conditions. On the other hand, the results showed steady YFA decisions which are considered reasonable and indicates that the threshold is rational and practical. Figure 5 shows a snapshot of a 2 h graphical representation of the gaps and the threshold. As can be seen on Figure 5, the maximum total gaps reached 235 s and the minimum gap was 55 s at 3:40 p.m. The decisions were also verified from the rest of the data which shows the number of vehicles that arrived during the green phase along with the amount of green time in each cycle and the cycle length. For example, at 3:40 p.m., the decision was to recommend a FYA because of available gaps which can be verified by the 39 vehicles, in the heaviest lane, that arrived during 88.7 s of green phase.
Decision Support System Results by Cycle for John Young Parkway (JYP) Southbound Left Turn

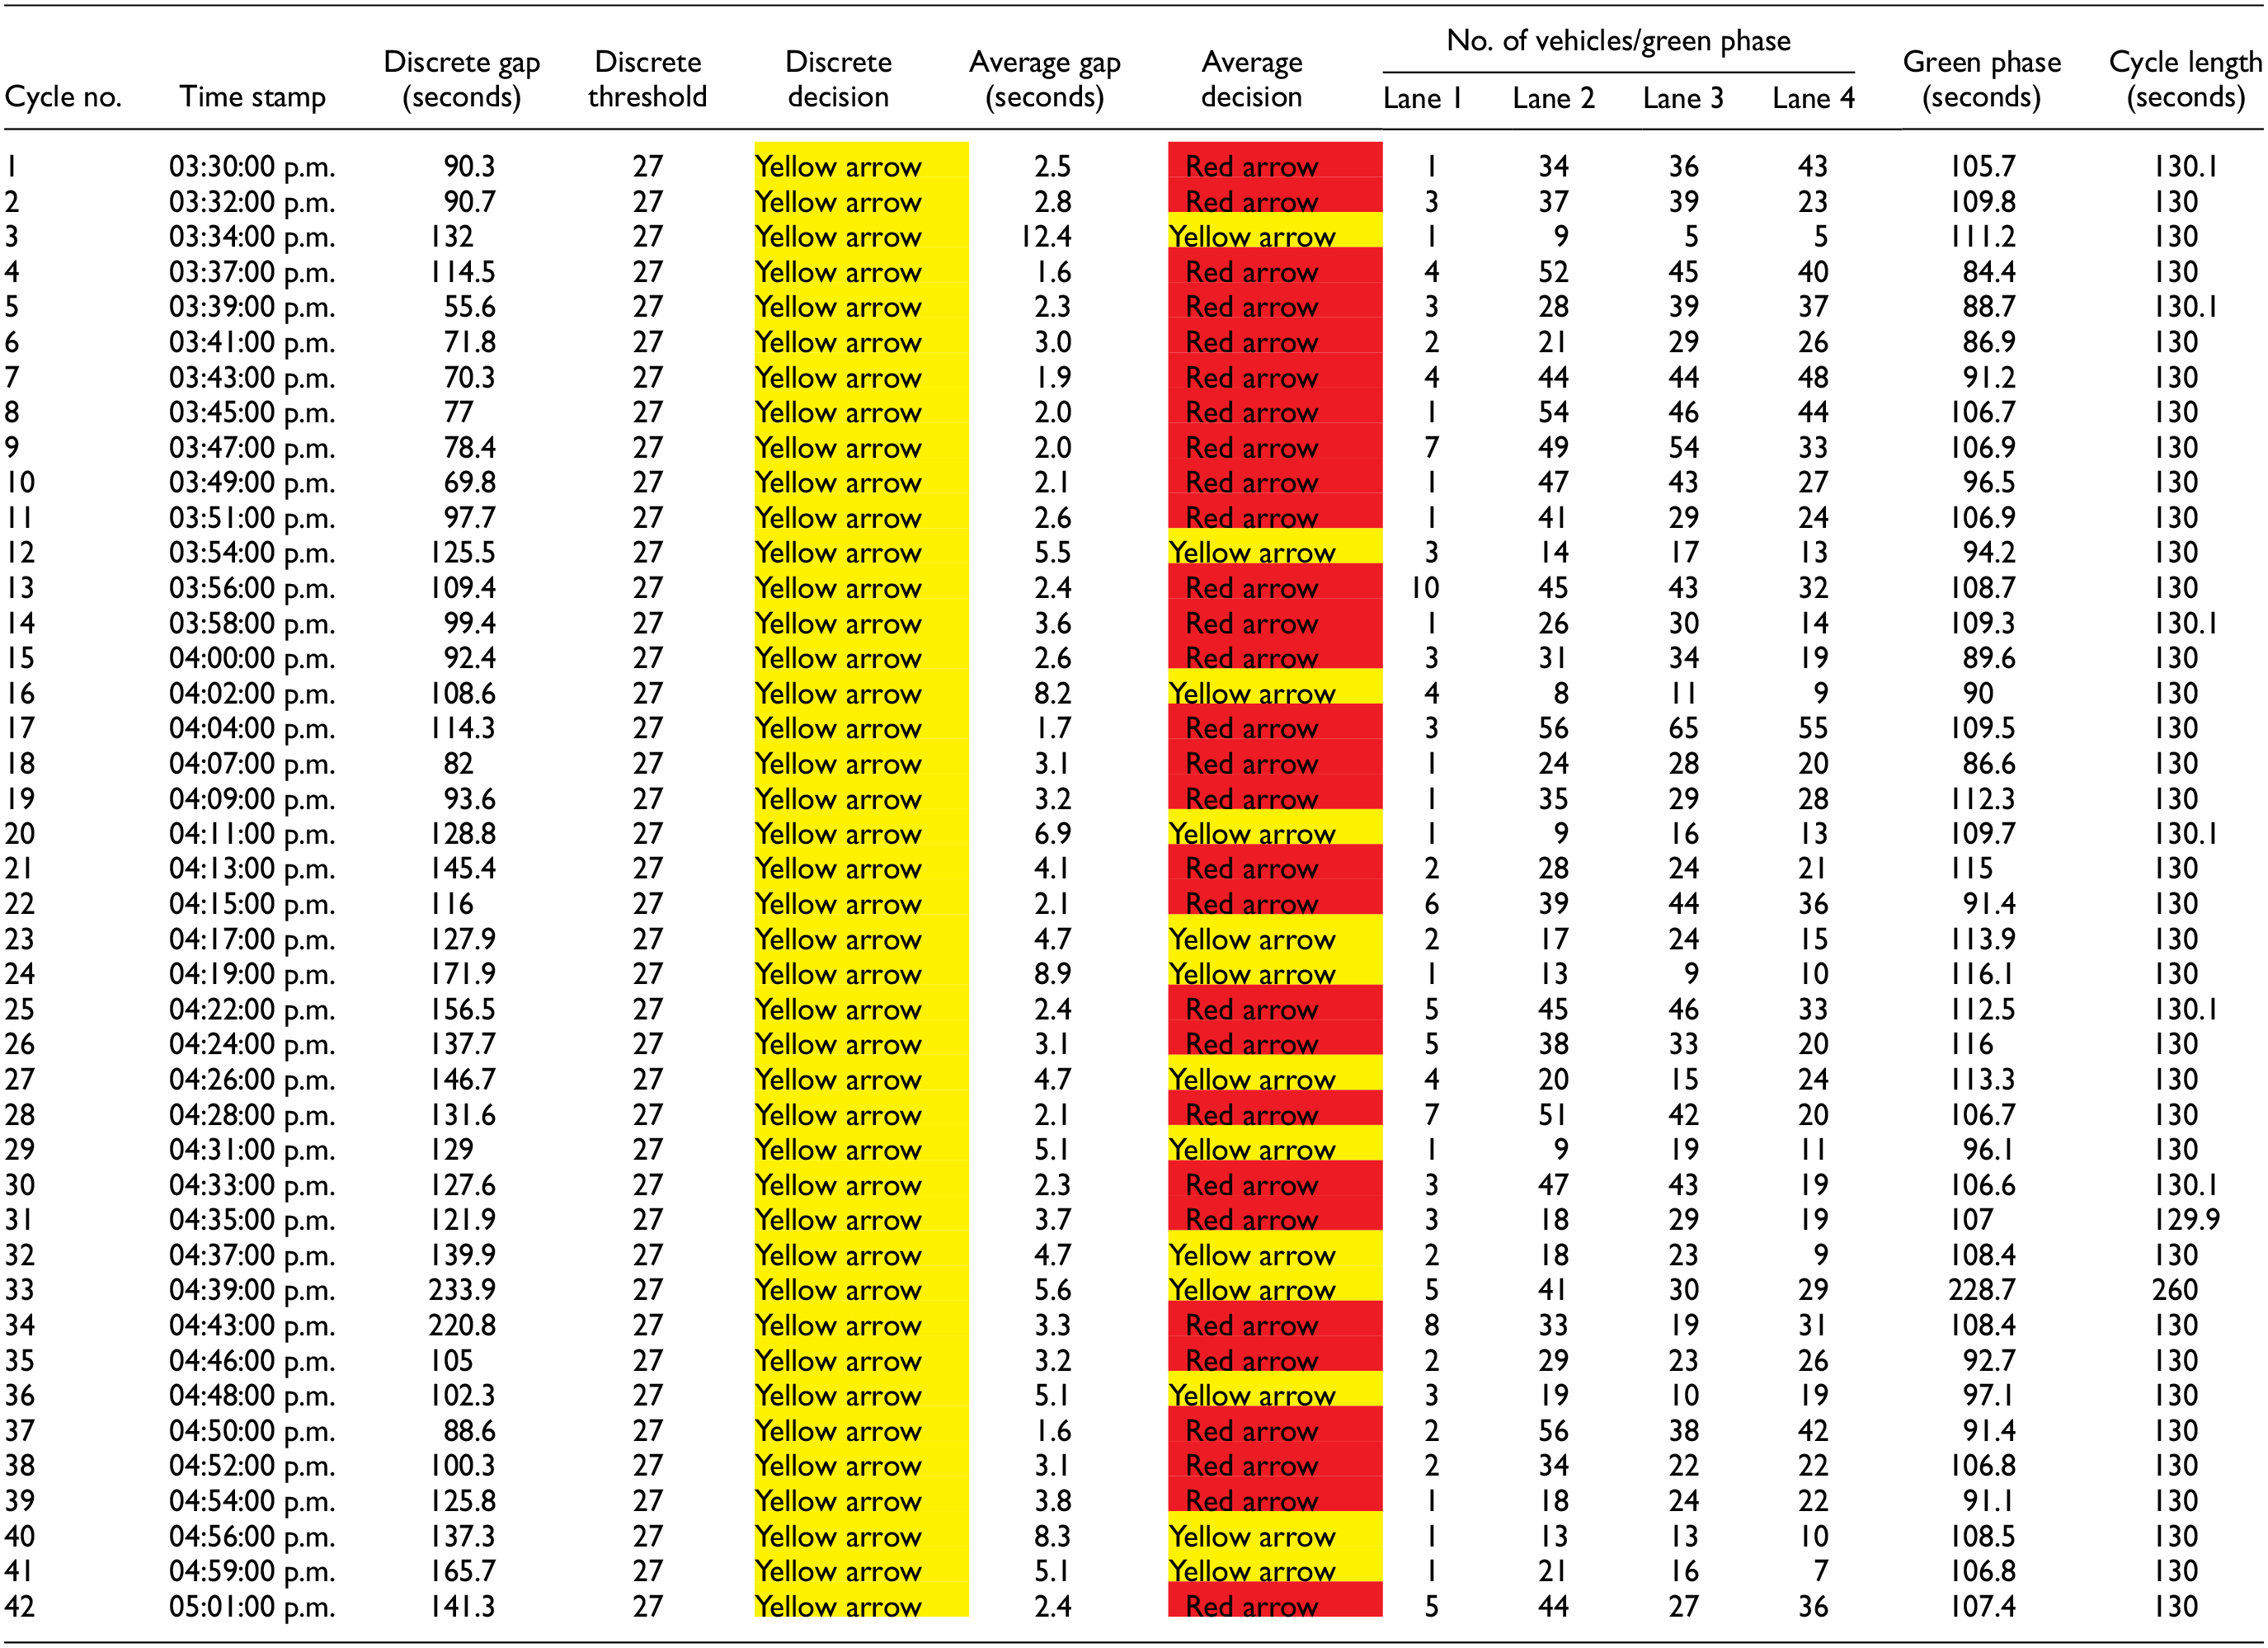

Decision support system results by cycle for John Young Parkway (JYP) southbound left turn (SBL).
Dynamic FYA Evaluation for JYP (Before and After)
Figure 6 shows a dashboard for the evaluation of the DFYA algorithm before and after its implementation in the field. The dashboard shows the total 12 hours from 7:00 a.m. to 7:00 p.m. and the amount of opposing green time, available gaps, and number of vehicles that crossed and failed to cross in different colors. In both cases (before and after), the left turn was operating in a protected-permissive mode, which is why all vehicles were able to utilize the permissive phase and cross during the opposing through green phase (shown in green color as vehicles crossed). The main measures of effectiveness collected were the FYA utilization factor and total vehicle-hours of delay which was calculated only during the opposing through green phase which reflects whether the left turn is flashing or not. As can be seen in the before case, 1,796 vehicles crossed out of 2,281 vehicles (78.7%) throughout the day and the total delay amounted to approximately 138 vehicle-hours of delay. However, in the after case, with the implementation of the DFYA algorithm, there were also available gaps above the threshold which recommended a FYA allowing 1,871 vehicles out of the 1,961 vehicles (95.4%) to cross. The dashboard results show a utilization factor of 97.5% and the total delay was reduced to approximately 31 vehicle-hours of delay, about 77.6% reduction in delay over the 12 h period. Also, the average crossing duration was below the recommended 4.5 s because of the direct on-ramp angle instead of a tight perpendicular angle which required less crossing time. It is concluded that when the percentage of vehicles that crossed increases, the delay decreases dramatically, which can be seen in the increased red color of vehicles that failed to cross in the before case compared with the green color in the after case.

Decision support system results by cycle for John Young Parkway (JYP) southbound left turn (7:00 a.m.–7:00 p.m.), before and after.
Conclusion
The FYA master database was increased to 24 intersections with locations across the State of Florida. The data extraction process was completed to match the basic prioritized parameters such as the left-turn timing, left-turn gap, opposing lane utilization, and left-turn stop delay, broadening the data analysis. The UCF research team developed a hardware platform, based on the DSS, which was connected to the controller in the field and automated the modification/selection process of the FYA mode on a cycle-by-cycle basis. The hardware platform would receive volume data as well as signal phasing and timing (SPaT) inputs for a given cycle and generate recommendations back to the controller.
The proposed algorithm is implemented with the goal of safely optimizing traffic operations. In the case of a red arrow signal for a left turn, the opposing through traffic during the green phase is constantly analyzed in real time to determine whether it would be optimal to switch the red arrow to a FYA. The decision is made based on several parameters which include: the minimum headway of vehicles in the opposing traffic, the number of lanes to cross, and the number of cycles to be analyzed before making the decision. The algorithm determines the time interval between the successive arrivals of vehicles for each lane independently and computes the corresponding headway for each lane by cycle on a second-by-second basis. The thresholds used for different crossing number of lanes were obtained from the database of 30,000 cycles collected from the field. If the minimum headway for the corresponding number of lanes is achieved and repeated a certain number of times—at least six times during the analysis period (whether one or two cycles) which is also an input to the algorithm—the decision is made to switch to a flashing yellow mode. Otherwise, a red arrow is decided on
The DSS was tested at several intersections in FDOT’s District 5. Video data were collected at the same time period as the algorithm was tested to validate the algorithm decisions. The value of the DSS in making real-time traffic decisions is crucial to improving the performance of the left-turning traffic and can be applied at any FYA system. Two approaches were tested to calculate the minimum gap: discrete and average approach. Overall, the DSS results using the discrete method showed steady fluctuations between the red arrow and yellow arrow decisions throughout the testing periods, which is considered reasonable, especially for a driver’s expectations. This also indicated that the thresholds were rational and practical. The decisions were also verified from the log file data, which showed the number of vehicles that arrived during the green phase along with the amount of green time in each cycle and the cycle length. However, the average method showed very conservative decisions. The average method was mainly used to verify saturated conditions and heavy traffic patterns assuming that the minimum gap is achieved between every two arriving vehicles every cycle before switching to a FYA. Although the average method provides a more conservative approach than the discrete one, the discrete approach is more accurate than the average approach.
It was also concluded that coordinated signals with very long cycle lengths, such as 3 min and longer, help in providing sufficient gaps even in heavy traffic patterns and during the peak hours because most of the vehicle arrivals are in platoons, because of coordination and at the beginning of the cycle. Therefore, to test the sensitivity of the algorithm to changes in the cycle length and also the difference between long and short cycles at coordinated signals, the intersection cycle length was reduced for a period of approximately 30 min. Although coordination helps in providing a steadier traffic flow with uniform arrivals of vehicles and eliminating the random arrivals, the DSS results showed that reducing the cycle length affects the traffic flow during the reduced green phase and eliminates sufficient gap times even with coordination.
The analysis also showed that the utilization factor for the DSS recommendations for all the intersections ranged between 65% and 75% during peak conditions on weekdays and between 90% and 95% during off-peak conditions as well as weekends. In general, crossing times were reasonable and matched previous results developed in Phase I. On the other hand, the total delay in the before study for all the intersections was 737 vehicle-hours and in the after study was 440 vehicle-hours of delay. This overall reduction of about 40% in delay confirms the operational benefit of the DFYA DSS.
Footnotes
Acknowledgements
The authors would like to thank Florida Department of Transportation (FDOT) for their support.
Author Contributions
The authors confirm contribution to the paper as follows: study conception and design: H. Abou-Senna, E. Radwan; data collection: H. Abou-Senna, J. Hibbert, H. Eldeeb; analysis and interpretation of results: H. Abou-Senna, H. Eldeeb; draft manuscript preparation: H. Abou-Senna. All authors reviewed the results and approved the final version of the manuscript.
Declaration of Conflicting Interests
The author(s) declared no potential conflicts of interest with respect to the research, authorship, and/or publication of this article.
Funding
The author(s) disclosed receipt of the following financial support for the research, authorship, and/or publication of this article: The work reported in this paper is part of a research project under contract number BDV 24-977-39, which is sponsored by the Florida Department of Transportation (FDOT).

The views expressed in this paper are those of the authors and do not necessarily reflect those of the sponsors of this project.