



Abstract
In recent years, wheel tracking of asphalt mixtures has gained considerable momentum, and the authors are evaluating the potential of standardizing a rubber-tire wheel tracking protocol which can enable direct decoupling of rutting and moisture damage by testing identical specimens in dry and wet conditions. Previous work has established the value of dry and wet comparisons; this paper specifically assesses the dry rutting component by comparing a rubber-tire wheel tracker known as the PURWheel-G2 with the asphalt pavement analyzer (APA), arguably the most well-known dry wheel tracking test. This paper has two main objectives: demonstrate that rubber-tire wheel tracking is capable of characterizing dry rutting in a manner comparable to the APA and recommend initial failure criteria for rubber-tire wheel tracking. The PURWheel-G2 was more variable than the APA with coefficients of variation nearly twice as large. Although there was variability, reasonable rut depth correlations were drawn between the PURWheel-G2 and APA, and an APA pass/fail criteria of 6 mm equated to 10 mm for conventional PURWheel-G2 testing using laboratory-compacted slabs. Using literature and available data, 6 mm was proposed as a rubber-tire pass/fail threshold when standardizing to typical APA compaction methods and boundary conditions (i.e., cylindrical specimens in confined molds). Ultimately, efforts are ongoing to improve limitations of the PURWheel-G2 prototype (e.g., variability) with modernized equipment, and the authors recommend agencies initially consider the same failure criteria already established for APA testing and be willing to adjust over time as data and experience dictate the need to do so.
Keywords
In recent years, asphalt mixture testing, including wheel tracking, has gained considerable momentum that can largely be attributed to (1) increased emphasis on balanced mix design, (2) increasing complexity of mixtures (e.g., recycled materials use) that makes exclusively volumetric assessments more difficult, and (3) the success of some wheel tracking methods at discerning rutting or moisture damage performance of in-service mixtures. In almost any performance-driven scenario involving asphalt paving, rutting resistance is of first-order importance. Over the past few years, rutting has not been as prevalent as cracking (e.g., Howard et al. [ 1 ]), but any attempt to “balance” asphalt mixtures by increasing cracking resistance tends to decrease rutting resistance.
The focus of this paper is dry rutting of asphalt mixtures by way of wheel tracking using rubber hoses (i.e., asphalt pavement analyzer, APA) or rubber tires. As shown in this paper, the APA (i.e., AASHTO T340, 2 ) has a respected history of evaluating dry rutting but lacks corresponding success evaluating moisture damage through water-submerged wheel tracking with rubber hoses. Rubber-tire wheel tracking does not have the legacy of the APA but does have more potential to evaluate dry rutting and moisture damage within the same test protocol by testing specimens dry to assess rutting and then testing replicate specimens submerged in hot water (but under otherwise identical conditions as dry testing) so that the gap in these two rutting curves can be attributed to moisture. Cox et al. ( 3 ) summarize 25 years of rubber-tire wheel tracking and demonstrate the value of rubber-tire wheel tracking to separate dry rutting from moisture damage via direct measurement; the second generation of the Purdue Laboratory Wheel Tracker (i.e., PURWheel-G2 or PW-G2) was the rubber-tire tracker of primary interest. Cox et al. ( 3 ) did not compare rubber-tire dry rutting to a more established standard (e.g., APA), nor was any notable comparison of hot-water-submerged rutting for moisture effects made to a more established standard (e.g., Hamburg Loaded Wheel Tester, HLWT).
This paper builds on the work of Cox et al. ( 3 ) where the ultimate goal of the collective efforts is a standard test protocol for use of rubber-tire wheel tracking to measure dry rutting and moisture resistance of asphalt mixtures. The objective of this paper is to demonstrate that rubber-tire wheel tracking is capable of characterizing dry rutting in a manner comparable to the APA and to recommend initial failure criteria for rubber-tire wheel tracking. As seen here, dry rutting was evaluated in a comparable manner in either rubber-tire wheel tracking or the APA. This finding provides a foundation for the dry portion of a standard rubber-tire wheel tracking protocol that is being referred to as RTrack (RT refers to rubber tire; Track refers to a wheel tracker). It is the perspective of the authors that a wheel tracker capable of performing as well as the existing standard dry rutting method (i.e., AASHTO T340) that also has potential for direct measurement of moisture effects during wheel tracking is a positive step in characterization of asphalt mixtures.
The next section describes motivation for this work. Thereafter, a literature review of wheel tracking is given, mostly in dry conditions, where emphasis is placed on the APA. Next, mixes available to compare rubber-tire and rubber-hose wheel tracking are presented alongside the wheel tracking test parameters utilized. Results are then presented that lead to a discussion of a recommended rubber-tire wheel tracking failure criteria and set of protocols comparable to AASHTO T340 on the group of mixes evaluated.
Motivations
This section presents motivations, not only for this paper, but for the long-term goal of standardizing a rubber-tire wheel tracking protocol to directly decouple rutting and moisture damage by testing identical specimens in dry and wet conditions. The primary motivation for a standardized rubber-tire wheel tracking protocol is to provide the asphalt industry with a direct way to measure the exclusive effects of moisture on asphalt while under repeated loading. None of the existing methods that are standardized have the ability to exclusively capture the effects of moisture without use of theoretical models. This paper does not have any motivation toward improving dry rutting characterization as existing methods seem adequate. Rather, these efforts are motivated to maintain comparable dry rutting assessment capabilities relative to existing standards. The overall motivations into which this paper fit span many years.
The current paper is an intermediate step toward the goal described above. There are four motivations for this paper. The first three are to compare rubber tire wheel tracking to existing standards concerning variability, rut profile trends and correlations across methods. The fourth and primary motivation was to identify rutting failure criteria for initial agency consideration.
These motivations stemmed from a combination of the data available and the longer term efforts of the authors to standardize rubber-tire wheel tracking. In some senses, this was a post hoc effort to use existing data as effectively as possible toward a longer goal. For example, wheel tracking data acquisition as a whole has room for improvement, particularly concerning managing variability. A wealth of data was available that allowed this paper to examine variability of multiple wheel trackers in a post hoc manner. This data set, while large and diverse, was collected for other purposes which limited the ability for systematic evaluation. As such, analysis was directed as best as possible toward the overall motivations of standardizing rubber-tire wheel tracking.
Literature Review
Dry rutting with a rubber tire was comprehensively reviewed in Cox et al. ( 3 ), and that information is not repeated here; as such, this literature review focuses on the APA. The first iteration of the APA was the Georgia loaded wheel tester (GLWT) which was developed through a partnership between the Georgia Department of Transportation and the Georgia Institute of Technology where the main objective was to develop a simple test to predict rutting characteristics to supplement the Marshall method ( 4 ). The machine was capable of testing 7.5 by 7.5 by 38.1 cm beams, and rut depths were manually measured at 0, 40, 100, 400, 1,000, and 4,000 cycles. Initial test variables included hose pressure (517 and 689 kPa), testing temperature (35°C), and applied loads (222, 334, and 445 N) ( 5 ). Parameters were refined to where test temperature was 40.5°C, rubber-hose pressure was 689 kPa, and test duration was 8,000 cycles ( 6 ). The GLWT underwent a round robin where several state Departments of Transportation (DOTs) participated. Within-laboratory variability was good (0.4 mm standard deviation); however, between-laboratory variability was high (1.3 mm standard deviation) likely due to variations in beam densities between participating laboratories. Efforts were made to adapt the GLWT for cores and gyratory compacted (SGC) specimens in addition to beam specimens ( 7 , 8 ). Eventually, the GLWT evolved into the APA (i.e., AASHTO T340) ( 2 ). Many research efforts have shown good correlation between field-measured rutting and the GLWT ( 9 ) or APA ( 10 , 11 ).
Since the APA has been designated a full AASHTO standard, state DOTs have developed maximum allowable rut depths for their state ( 12 – 20 ; Table 1). Kandhal and Cooley ( 21 ) developed recommended acceptance criteria based on a relationship between APA rut depths (RDs) and field rutting where the recommended criteria decreased as traffic increased. An additional study in Zhang et al. ( 22 ) recommended APA failure criteria of 8.2 mm, which was validated by using the temperature-effect model proposed in Shami et al. ( 23 ) to scale the traditional GLWT maximum rut depth of 5 mm at 50°C to a rut depth of 9.6 mm at 64°C (i.e., the high temperature of the binder grade being used in this study).
Pass/Fail Criteria for the Asphalt Pavement Analyzer Developed by Individual Departments of Transportation (DOTs) and Agencies
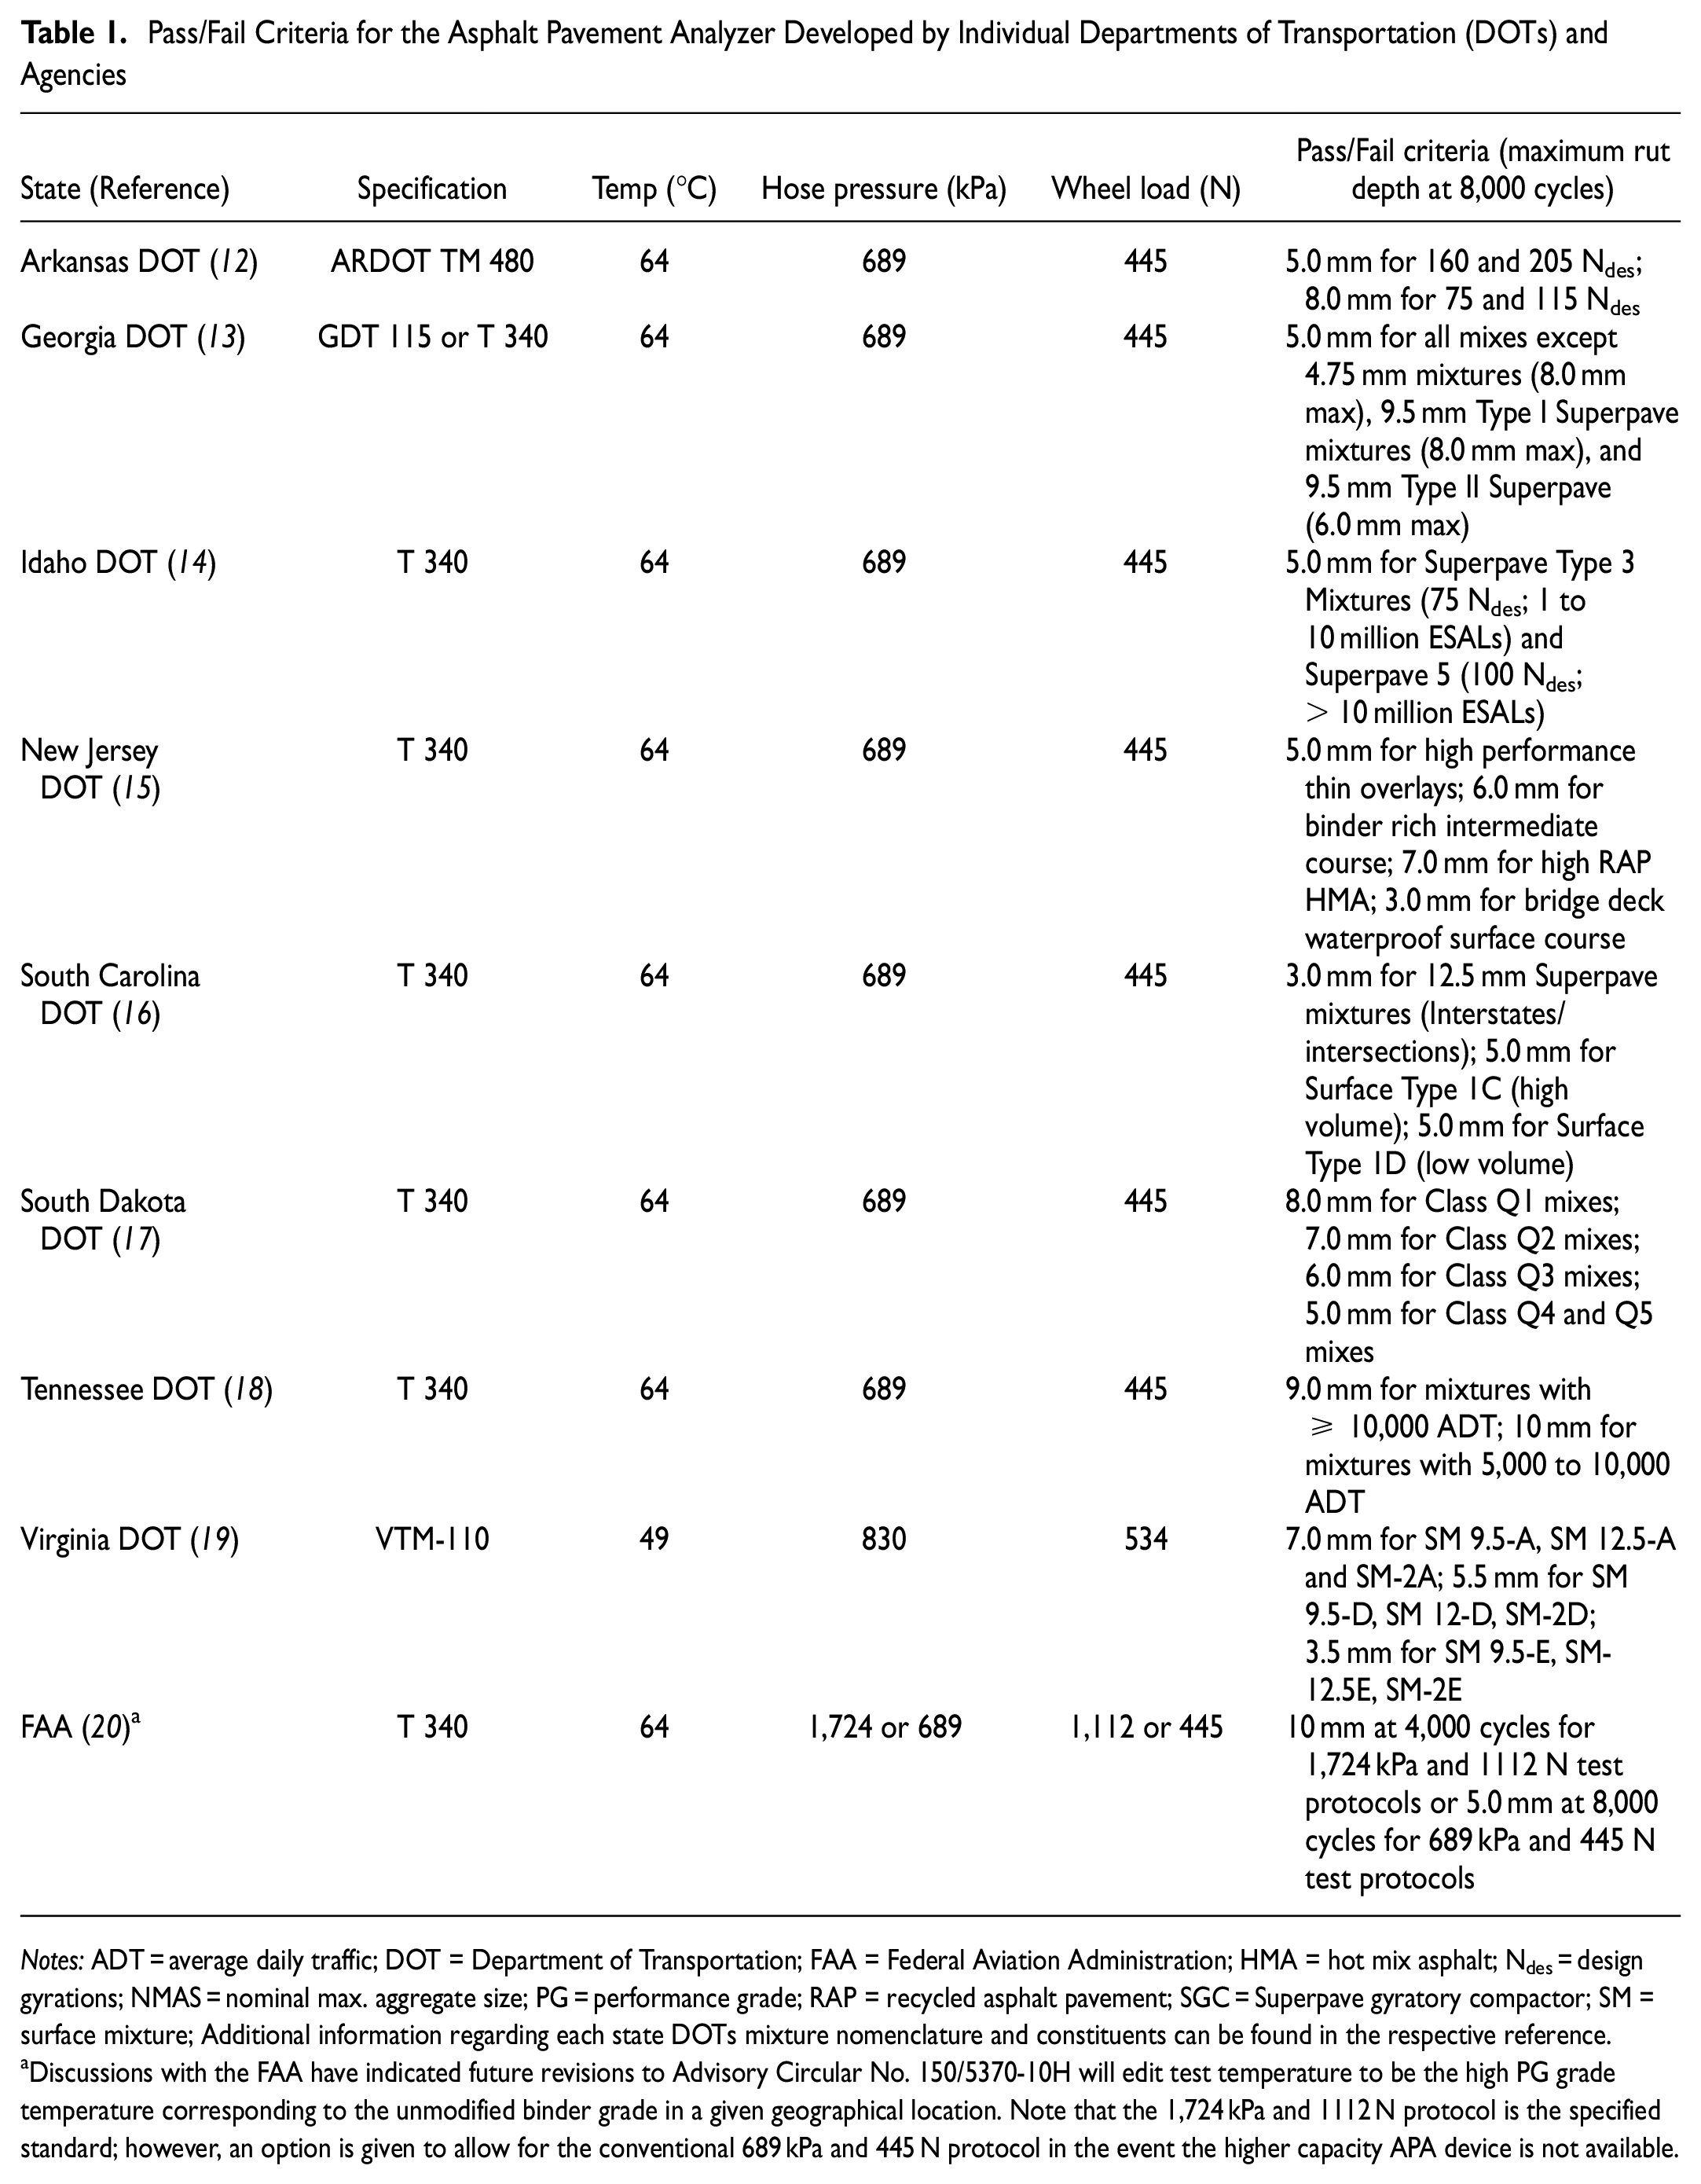
Notes: ADT = average daily traffic; DOT = Department of Transportation; FAA = Federal Aviation Administration; HMA = hot mix asphalt; Ndes = design gyrations; NMAS = nominal max. aggregate size; PG = performance grade; RAP = recycled asphalt pavement; SGC = Superpave gyratory compactor; SM = surface mixture; Additional information regarding each state DOTs mixture nomenclature and constituents can be found in the respective reference.
Discussions with the FAA have indicated future revisions to Advisory Circular No. 150/5370-10H will edit test temperature to be the high PG grade temperature corresponding to the unmodified binder grade in a given geographical location. Note that the 1,724 kPa and 1112 N protocol is the specified standard; however, an option is given to allow for the conventional 689 kPa and 445 N protocol in the event the higher capacity APA device is not available.
Research studies have evaluated the APA’s sensitivity to changing mixture constituents (e.g., binder content, dust content) and testing variables (e.g., hose size, specimen type). Table 2 summarizes findings of multiple studies to provide general APA rutting trends for various mixture constituents ( 21 , 24 – 33 ). Based on literature, binder grade and nominal maximum aggregate size were the material constituents that influenced RDs the most while RD measurement method, specimen type, and temperature were testing variables that most affected final RDs.
Effects of Material Constituents and Testing Variables on Asphalt Pavement Analyzer (APA) Rutting Trends
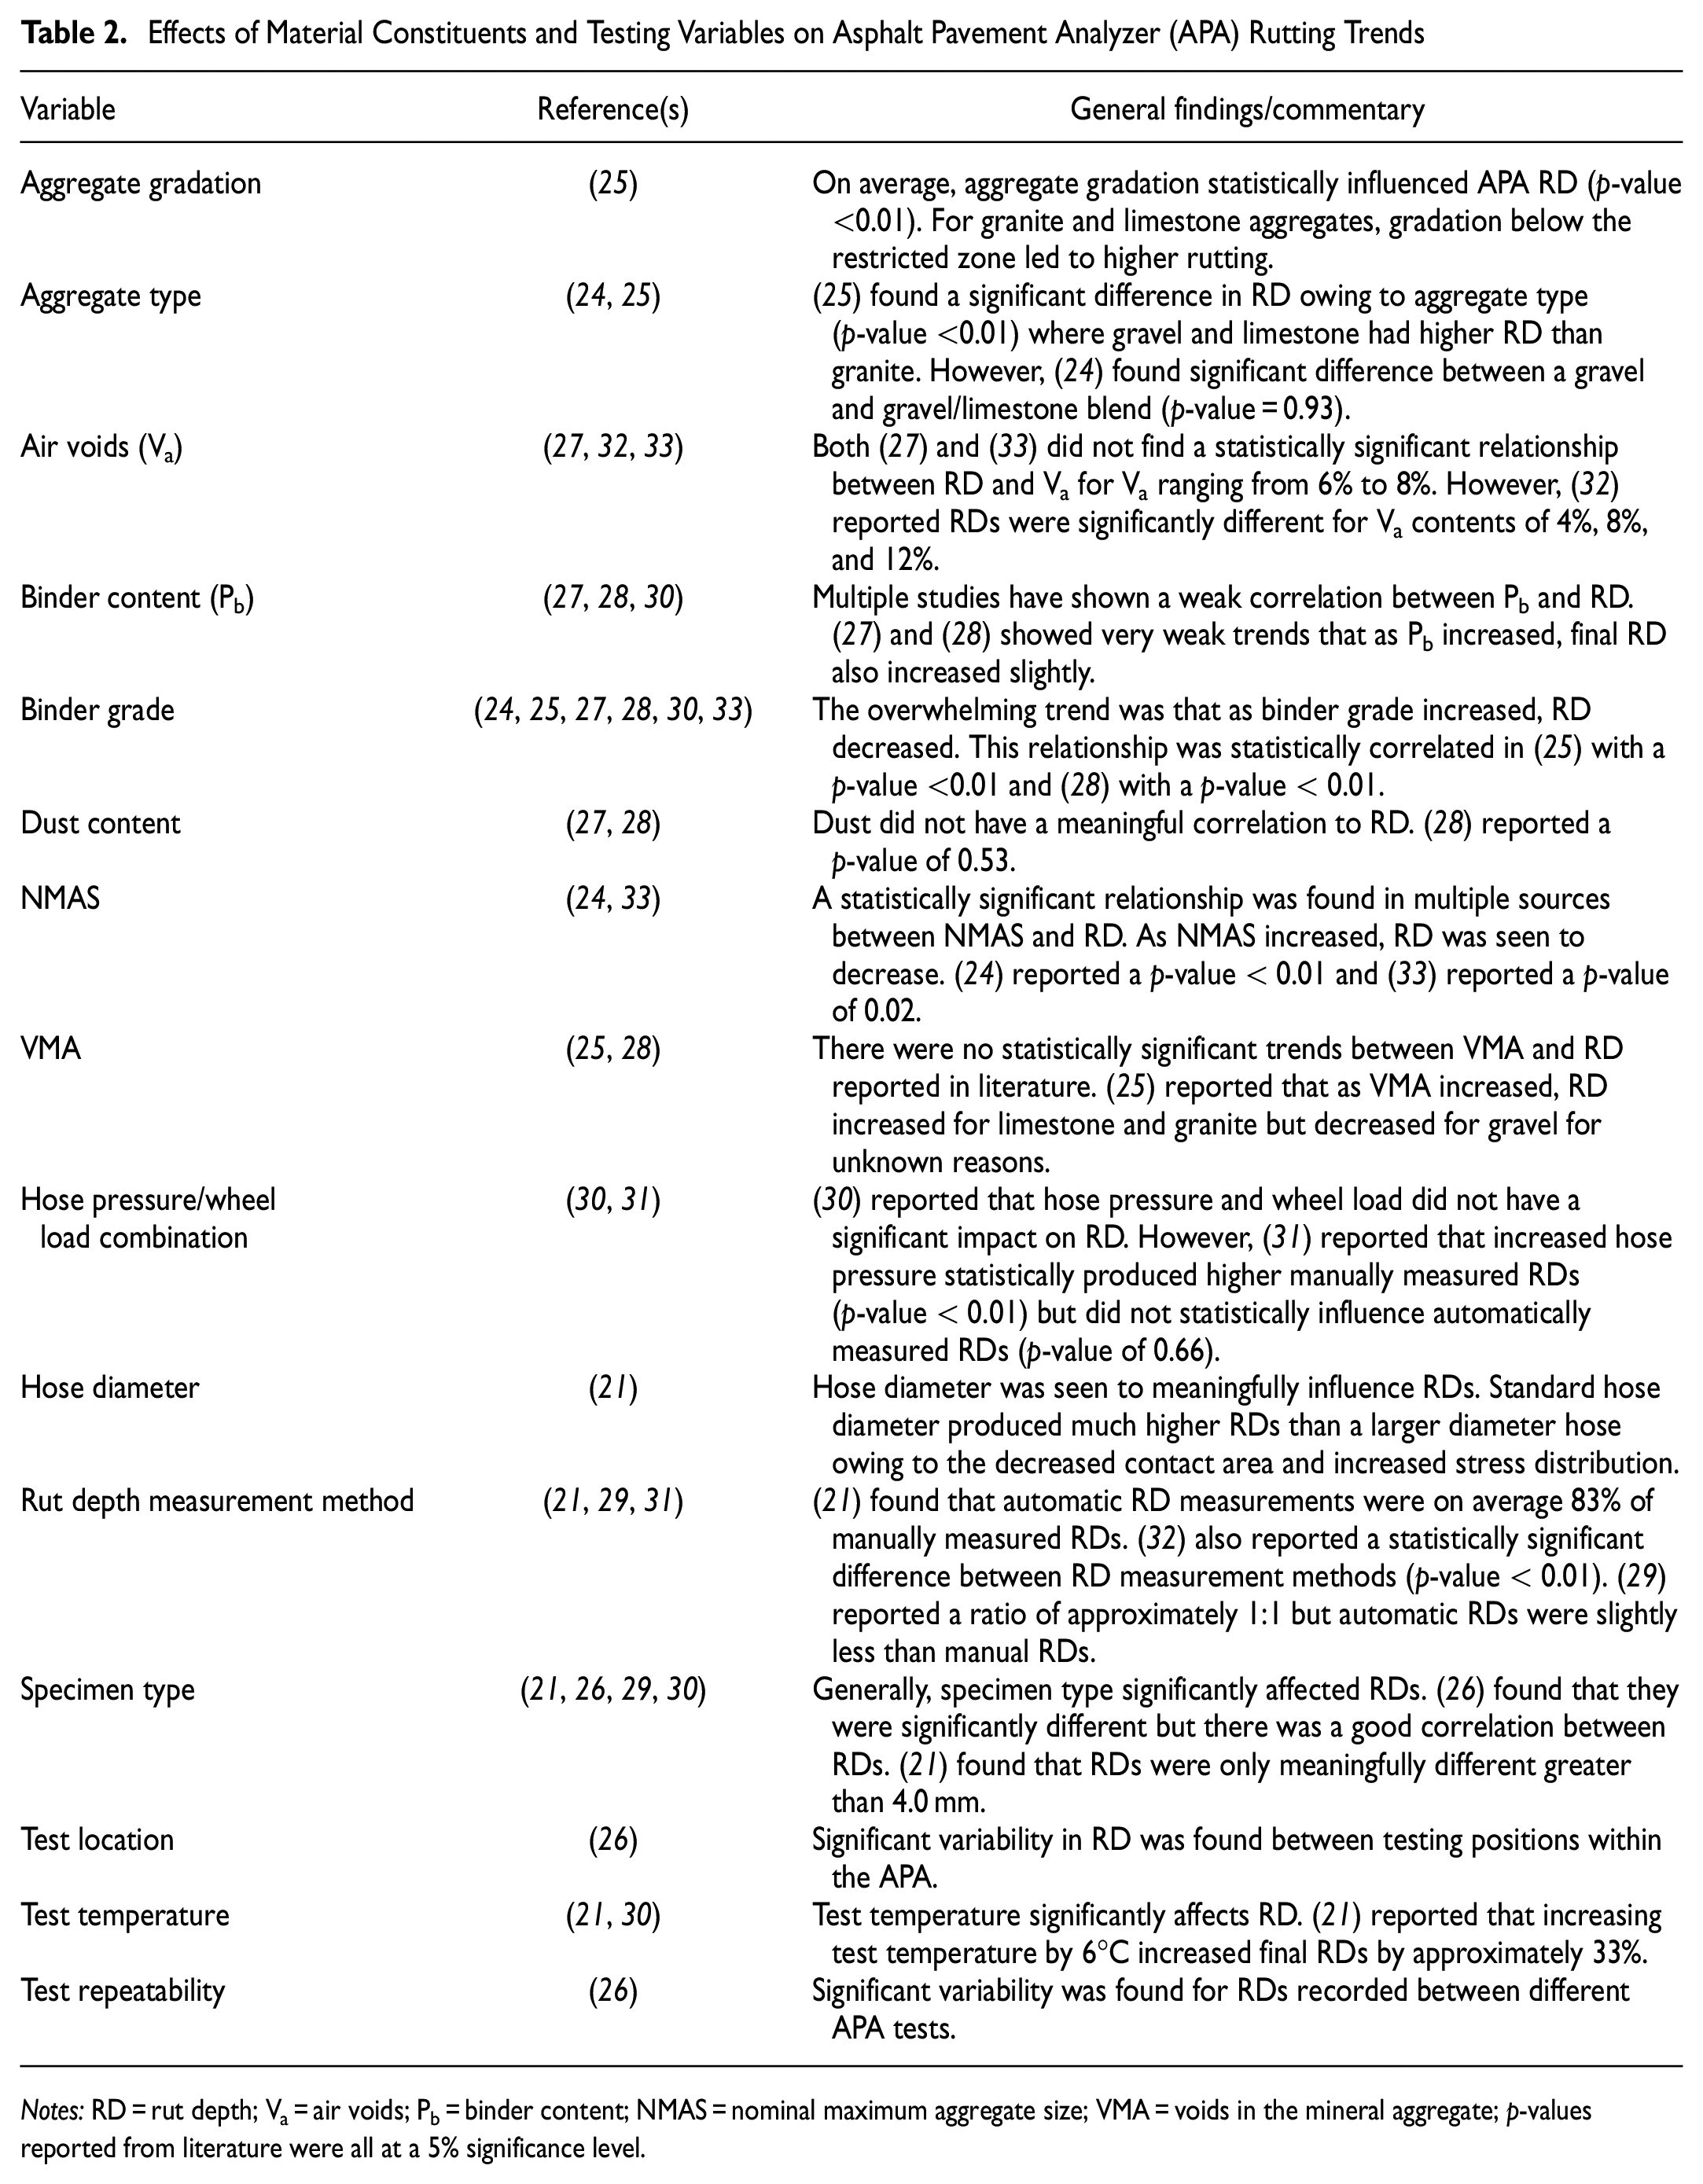
Notes: RD = rut depth; Va = air voids; Pb = binder content; NMAS = nominal maximum aggregate size; VMA = voids in the mineral aggregate; p-values reported from literature were all at a 5% significance level.
Although the APA is not typically used to evaluate moisture susceptibility, several studies have evaluated preconditioning effects and submerged testing conditions. Several studies have preconditioned specimens following AASHTO T283 vacuum-saturation protocols before testing ( 34 – 37 ). Malladi et al. ( 34 ) found that preconditioned specimens had more variability and generally higher RDs than non-conditioned specimens. However, ( 35 – 37 ) did not find any significant influence of preconditioning on final RDs with ( 36 ) reporting a p-value of 0.12. In addition to preconditioning, the influence of submerged APA testing in hot water has been evaluated ( 35 – 39 ). The reported effects of these submerged tests on rutting behavior were, at best, mixed with ( 35 ) and ( 37 ) reporting submerged tests having a significantly higher RD ( 38 ), reporting that dry rutting led to significantly greater RDs than submerged testing, and ( 36 ) reporting no significant difference between submerged and dry RDs. West et al. ( 36 ) suggested using the ratio of wet to dry rut depths as an indicator of stripping potential; however, Han and Shiwakoti ( 39 ) reported that submerged APA tests could not induce stripping in the majority of specimens tested.
The Federal Aviation Administration (FAA) criterion for airfield pavement mixtures is less than 10 mm of rutting after 4,000 cycles in a modified APA protocol with a 1,112 N wheel load and a 1,724 kPa hose pressure to simulate high-tire-pressure aircraft ( 20 ). This high-pressure APA protocol and criteria were developed through multiple studies ( 40 , 41 ) and can differentiate between rank mixture performance similar to the standard hose pressure ( 42 ). Currently, the Department of Defense (DoD) does not require APA testing ( 43 ), but internal discussions indicate a desire to implement APA requirements in a similar manner to current FAA specifications.
Materials and Methods
Two test methods and five specimen preparation methods were used in this paper. Test methods were: (1) PURWheel-G2; and (2) APA (Figure 1). Specimens were produced via: (1) linear asphalt compactor (LAC) slabs; (2) cores taken from LAC slabs; (3) Superpave gyratory compactor (SGC) specimens; (4) slabs taken from field-compacted asphalt; and (5) cores taken from field-compacted asphalt. Table 3 describes the mixes evaluated in this paper using mixture IDs that correspond to companion works ( 3 ) and provides key mixture properties and the amount of wheel tracking data available for each mixture. Mixtures reported in Table 3 are not part of a designed experiment; therefore, analysis in this paper relies on available data from previous studies. Previous assessments of APA data have primarily focused on understanding the influence of air voids and mixture constituents on rut depths, but there are two previous works where PURWheel-G2-to-APA comparisons were published ( 44 , 45 ). PURWheel-G2-to-APA comparisons were not the first-order objective of these papers as they primarily evaluated rutting and moisture damage potential of high RAP mixtures ( 44 ) or effects of additives on asphalt haul time ( 45 ). Those references documented modest correlations between PURWheel-G2 and APA, but they did not represent a holistic assessment as this paper seeks to do. Overall, no more than 40% of APA data evaluated herein was analyzed in any one reference.
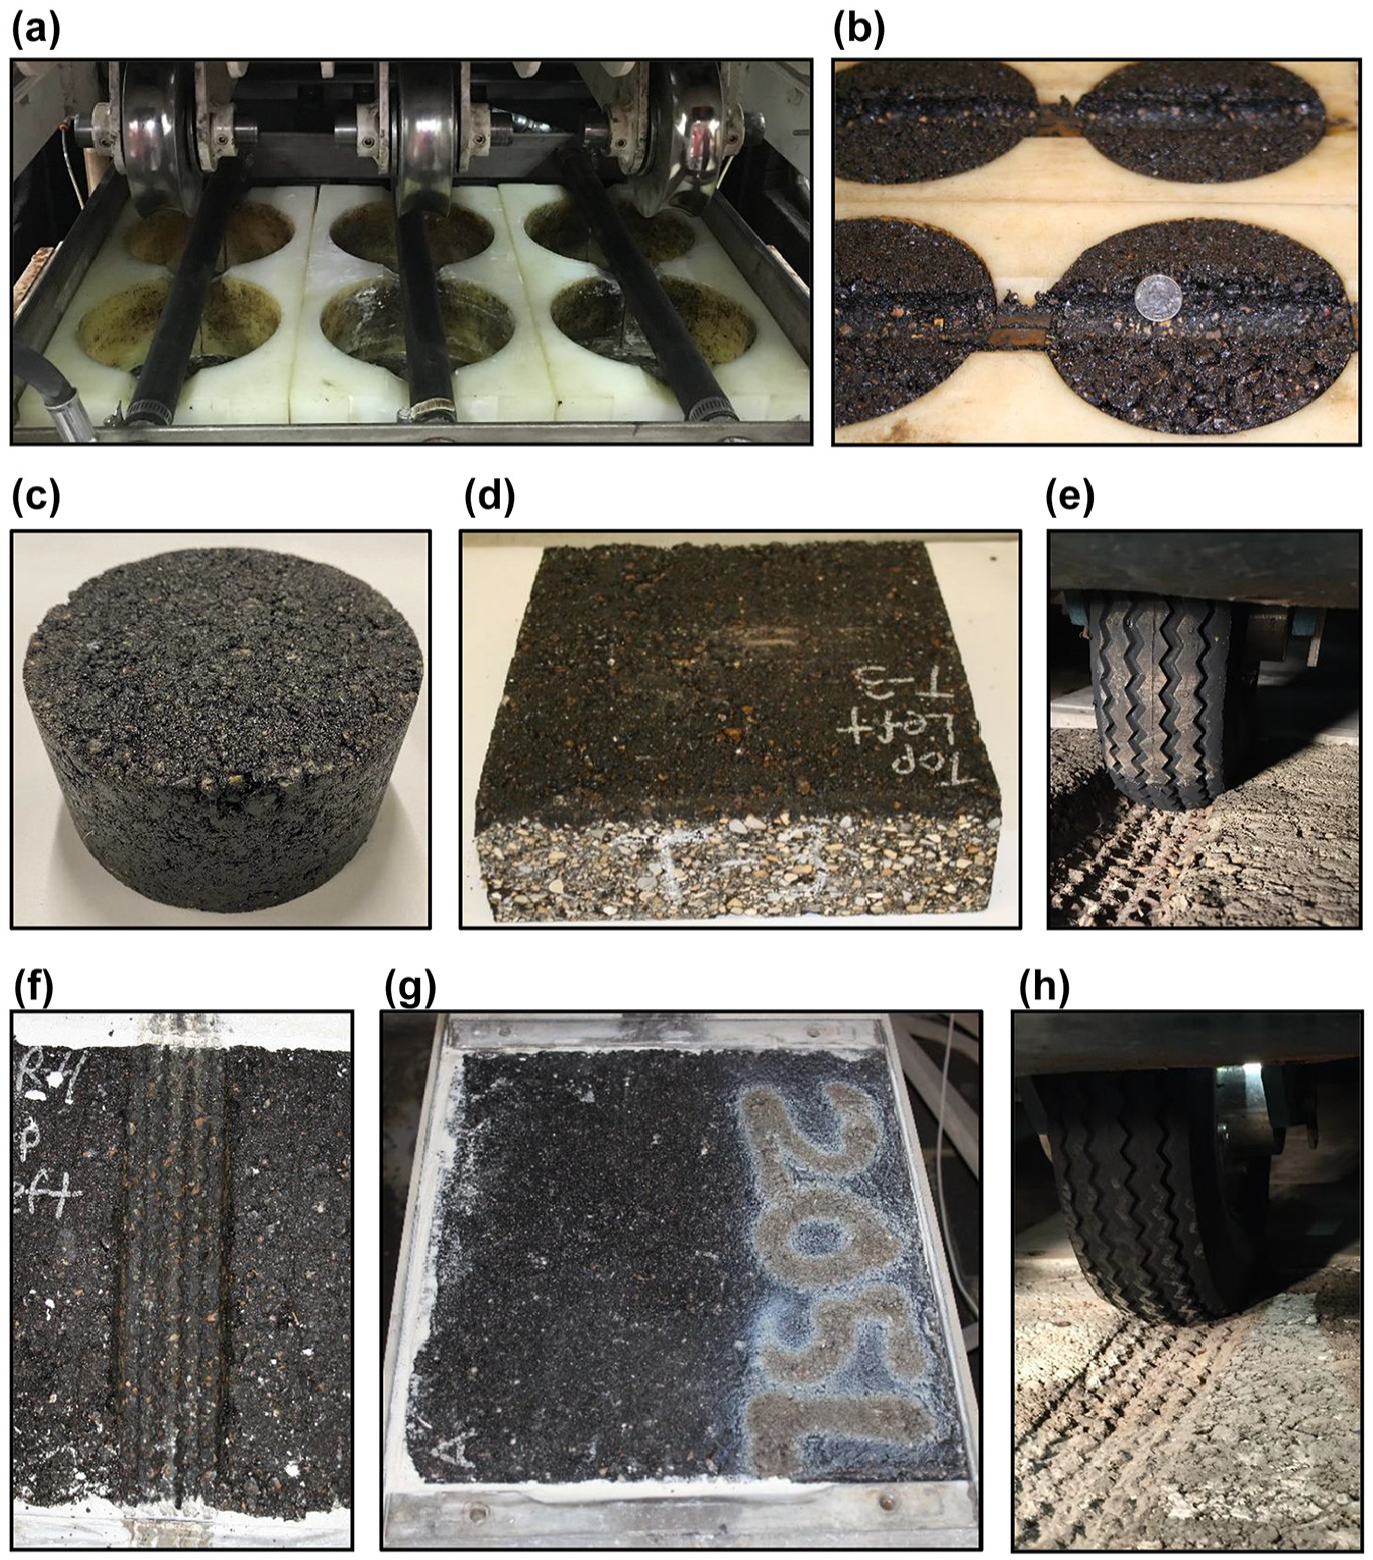
Asphalt pavement analyzer (APA) and PURWheel-G2 specimens and loading conditions: (a) APA loading mechanism and boundary conditions, (b) tested APA specimen, (c) 15.0 cm diameter by 7.6 cm tall APA specimen, (d) 31.0 cm by 29.3 cm by 7.0 to 8.2 cm tall PURWheel-G2 specimen, (e) PURWheel-G2 loading mechanism 1 of 2, (f) tested PURWheel-G2 specimen, (g) PURWheel-G2 specimen and boundary conditions, and (h) PURWheel-G2 loading mechanism 2 of 2.
Test Plan
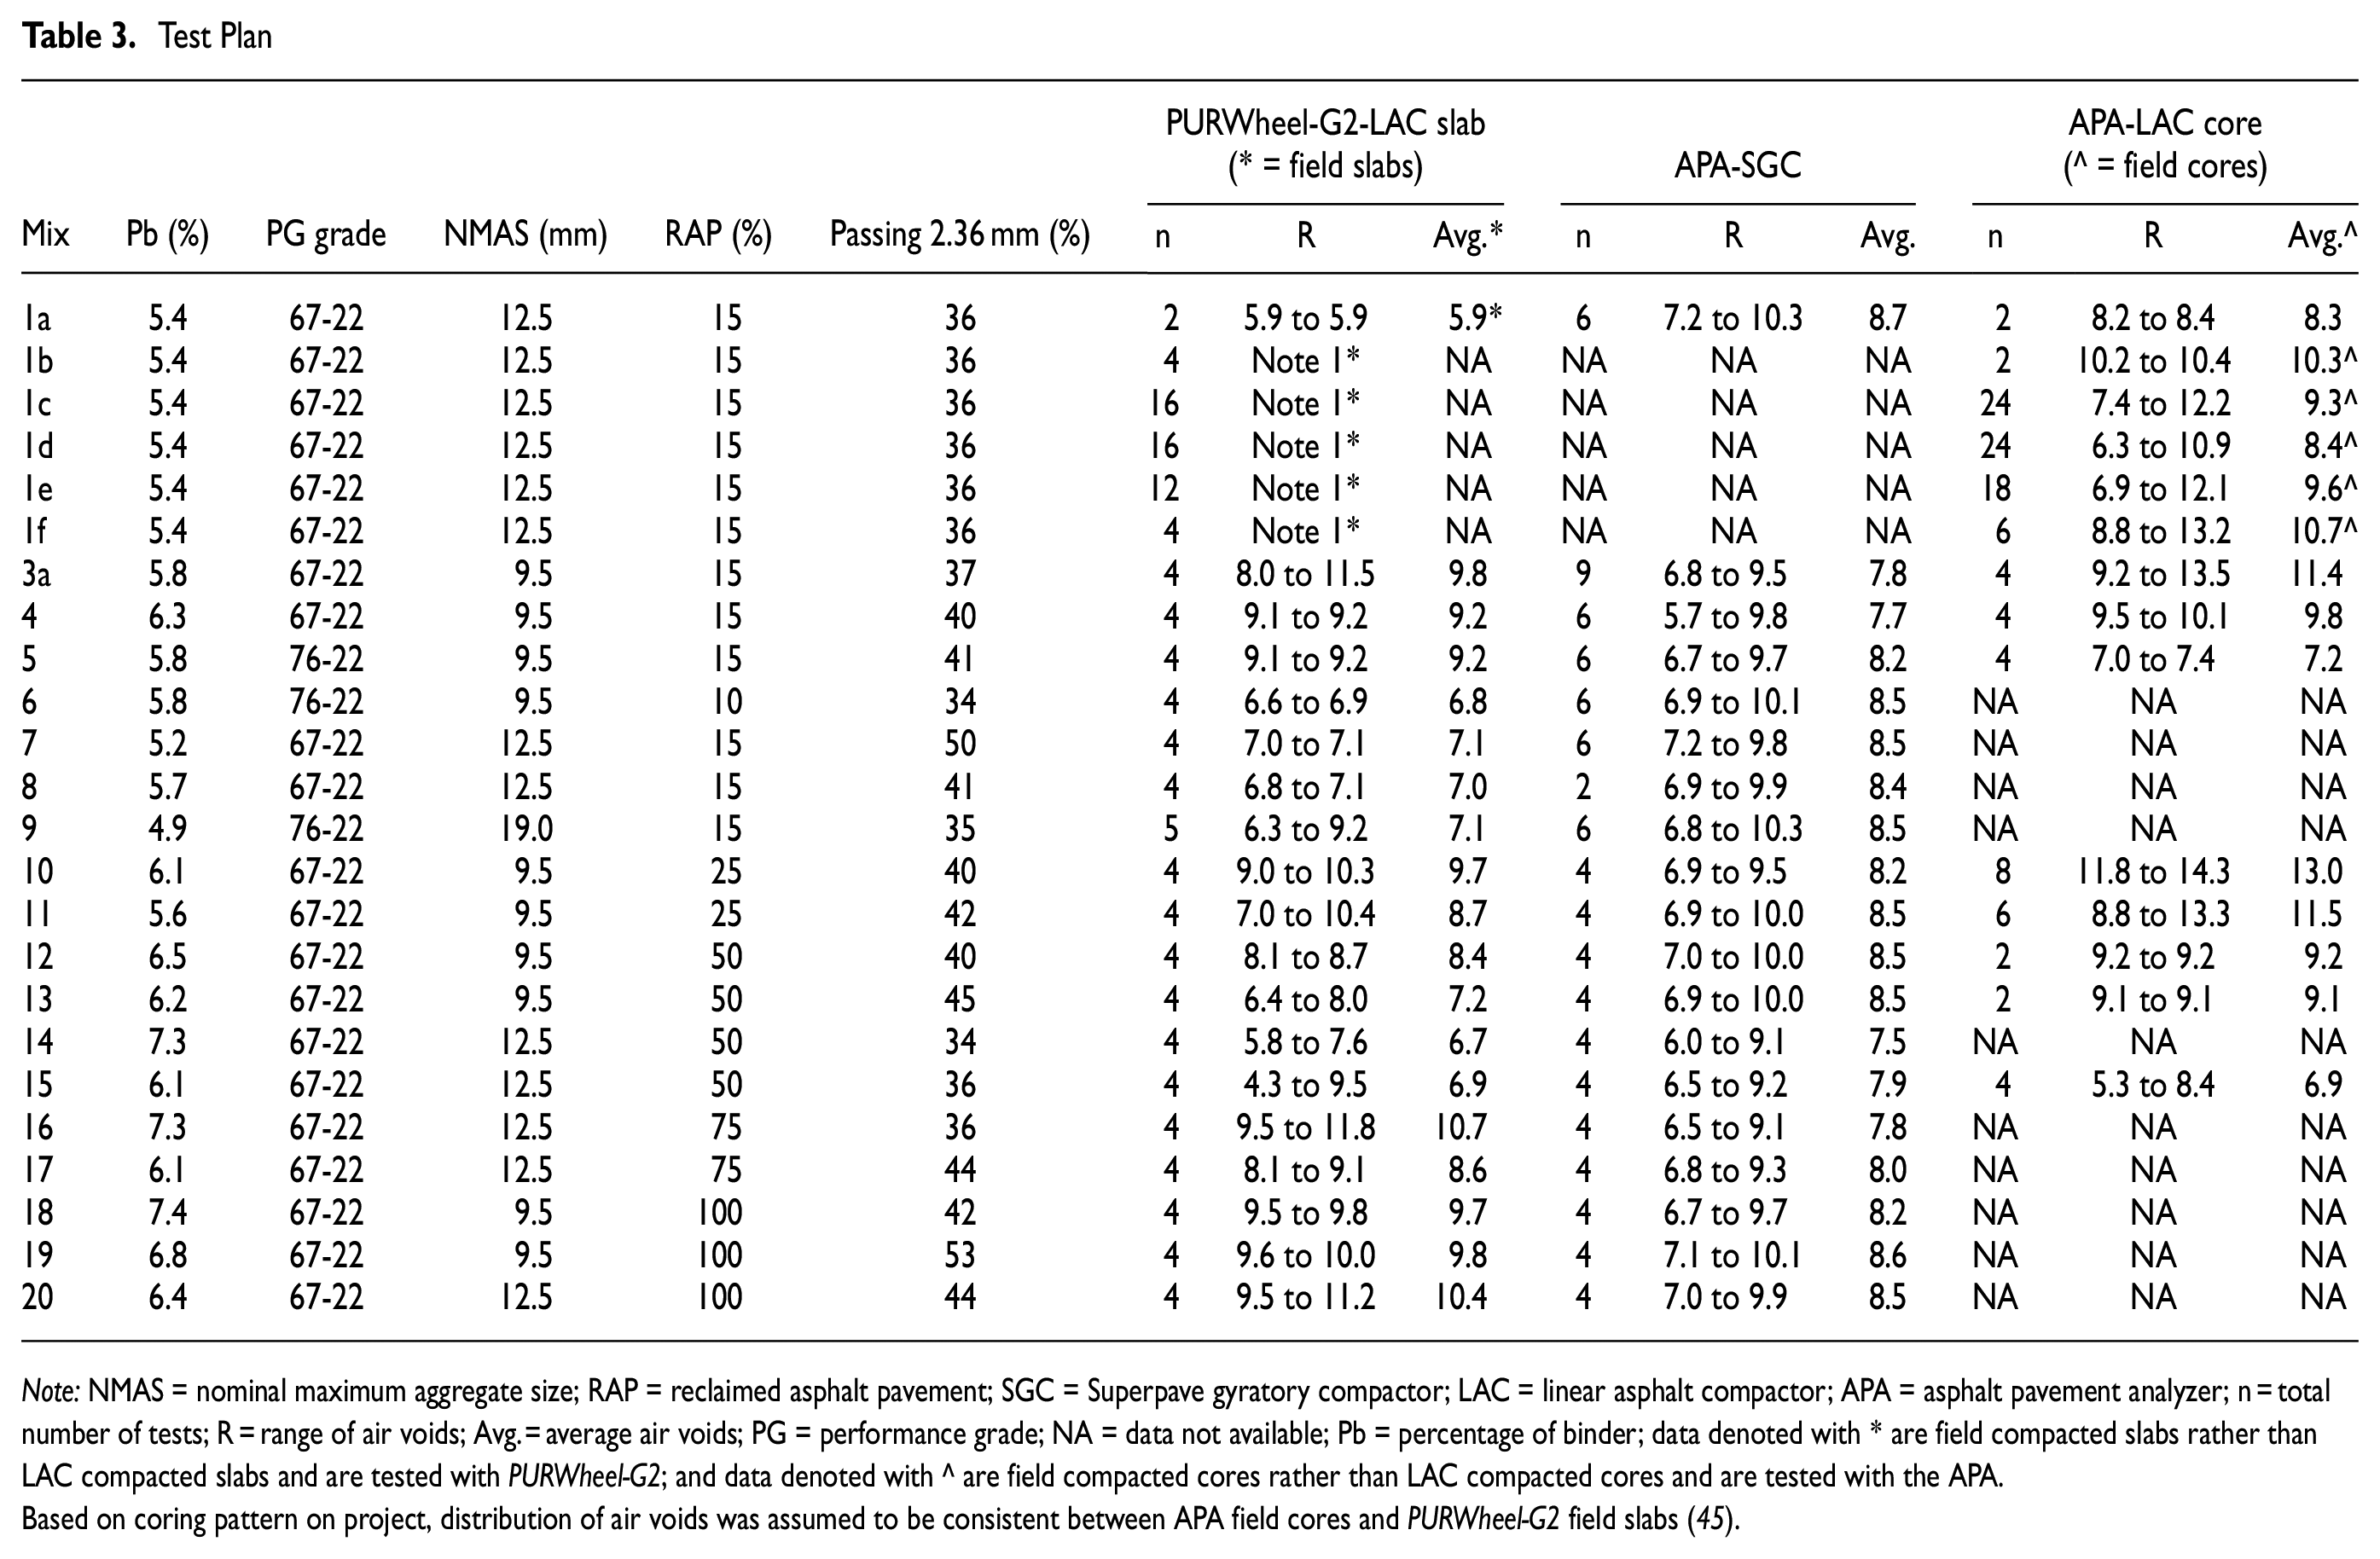
Note: NMAS = nominal maximum aggregate size; RAP = reclaimed asphalt pavement; SGC = Superpave gyratory compactor; LAC = linear asphalt compactor; APA = asphalt pavement analyzer; n = total number of tests; R = range of air voids; Avg. = average air voids; PG = performance grade; NA = data not available; Pb = percentage of binder; data denoted with * are field compacted slabs rather than LAC compacted slabs and are tested with PURWheel-G2; and data denoted with ^ are field compacted cores rather than LAC compacted cores and are tested with the APA.
Based on coring pattern on project, distribution of air voids was assumed to be consistent between APA field cores and PURWheel-G2 field slabs ( 45 ).
The PURWheel-G2 wheel tracker tested slabs for a duration of 20,000 passes or until specimens reached a rut depth of 23 mm. The pneumatic rubber tire had a width of 54 mm and was inflated to 862 kPa. The rubber tire applied a load of 1,750 N over a gross contact area of 2,800 mm2 (contact pressure of 630 kPa) while moving at 33 cm/s. Additional details about the PURWheel-G2 are in Cox et al. ( 3 ). The APA wheel tracker tested cylindrical specimens (either SGC or cores) over a duration of 8,000 cycles (i.e., 16,000 passes). The rubber-hose pressure was 689 kPa and a wheel load of 445 N was applied over a contact area of 645 mm2 (contact pressure of 689 kPa) while traveling at a speed of 59 cm/s. All PURWheel-G2 and APA tests were conducted at 64°C. For each Table 3 mixture, a rut depth versus pass curve was produced, and rut depths at 4,000, 16,000, and 20,000 passes (RD4k, RD16k, and RD20k, respectively) were used for analysis in this paper. For APA tests, there was no available data at 20,000 passes as the test ends after 16,000 passes (8,000 cycles). When discussing rut depths at the end of tests, the term RDFinal is used (i.e., RD16k for APA tests, RD20k for PURWheel-G2 tests).
Results
Rut Profiles
Typical cases of rutting profiles were identified using mixtures in Table 3 for both the PURWheel-G2 and APA where the percentage of mixtures that fell within each case are shown in parentheses (Figure 2). All cases observed in the APA and the majority of PURWheel-G2 tests were considered Cases 1 and 2, while Case 3 was only observed in a small group of PURWheel-G2 tests. Select PURWheel-G2 slabs had cross sections cut from tested slabs to visually evaluate rutting tendencies (Figure 3). Case 1 mixtures showed little deformation outside of the wheel path, while Case 2 and 3 mixtures showed noticeable deformation near the edges of slabs owing to material flow during testing in addition to some aggregate alignment in Case 3 slabs. For Case 3 slabs, as rut depths increased over 12.5 mm, rutting mechanisms were hard to quantify but mixtures were clearly designated as failures. Case 3 rutting profiles could conceivably occur in any wheel tracker, but all factors being equal, larger specimens can flow easier owing to shear forces that lead to a progressively increasing rut depth. This idea is supported by noting that no Case 3 profiles were observed for the APA, likely due to some extent to the smaller SGC specimens in confined molds. Another factor at play concerning the absence of Case 3 rutting profiles with the APA may be related to the manner in which contact pressure changes throughout an APA test. Wu ( 46 ) reported contact areas and pressures for various wheel load and hose pressure combinations; for the standard 689 kPa and 445 N protocol, contact pressure was 689 kPa. Saleeb et al. ( 47 ) noted that contact pressures decrease throughout a test as the hose embeds in a rut (approximately 25% decrease at a 6 mm rut and 45% decrease at a 12 mm rut). Additional commentary on the influence of specimen geometry and boundary conditions on rut depth is provided later.
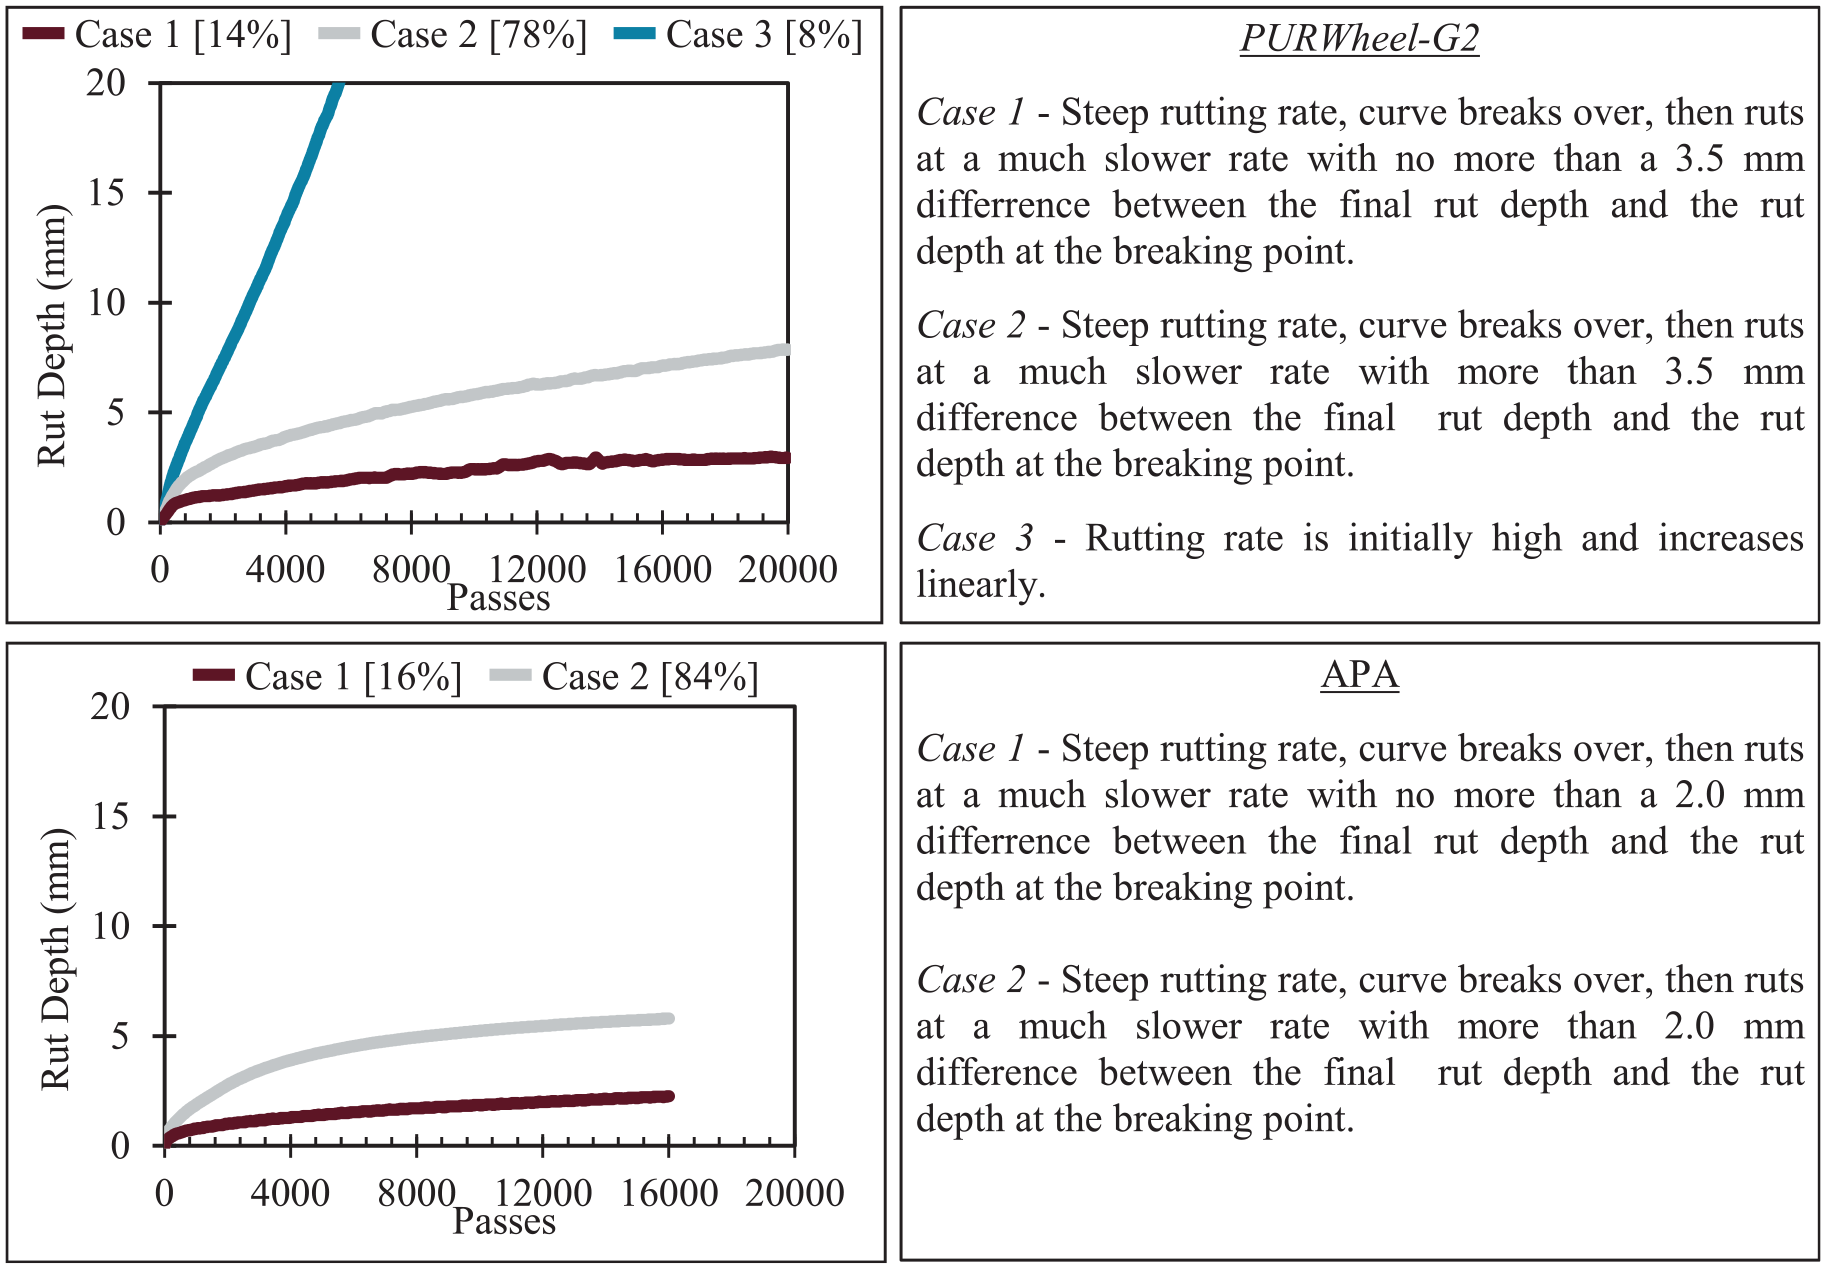
Cases of dry rutting curves observed for PURWheel-G2 and asphalt pavement analyzer (APA).

Visual evaluation of PURWheel-G2 slab cross sections. (a) Example of cutting tested slabs for cross section evaluation and (b) representative cross sections from each designated PURWheel-G2 case.
Variability
A small assessment of PURWheel-G2 variability occurred in Cox et al. ( 3 ) where the main focuses were quantifying test temperature variability, data acquisition variability, and differences in wet and dry test outputs. Assessment in this paper focuses on understanding PURWheel-G2 and APA variability relative to one another. Because data in this paper were not collected as part of a single designed experiment but are drawn from several previous studies, variability was assessed from several different perspectives in the following three subsections to collectively provide as much clarity as possible on PURWheel-G2 variability.
Assessment 1: Multiple Statistical Measures at Varying Pass/Cycle Levels for All Data
First, all APA and PURWheel-G2 data from Table 3 was utilized in relative frequency histograms (Figure 4) to evaluate variability using several statistical parameters and at several pass levels throughout the duration of testing. Rut depth at a given pass/cycle level was evaluated using: 1) coefficient of variation (COV); 2) 95% confidence interval (CI95); 3) rut depth range as a percent of the mean for replicate tests (RPOM); and 4) rut depth range for replicate tests (R). Note that a single data point in Figure 4 would consist of a single mix and compaction type with similar air voids (Va) within 2% of one another (e.g., all LAC-compacted PW-G2 data for Mix 10 from 9.0% to 10.3% Va would be used to calculate a COV). In all, Figure 4 represents 736 data points (240 PURWheel-G2 and 496 APA). Figure 5 plots several representative rutting profiles where PURWheel-G2 COVs were high as well as corresponding APA profiles (i.e., same mix, compaction, and 2% Va group). Figure 5 serves to graphically illustrate data used in Figure 4.

Relative frequency histograms of PURWheel-G2 and asphalt pavement analyzer (APA) variability terms.

Examples of rut depth versus passes for PURWheel-G2 and asphalt pavement analyzer (APA).
For each statistic reported, the APA was advantageous (i.e., histogram distributions were more consistent and more left-skewed). PURWheel-G2 and APA COV values generally fell between 5% and 35% although a considerable amount of PURWheel-G2 data exceeded 35%, especially at 20,000 passes. On average, at the end of a test, PURWheel-G2 COV was 26% compared with 15% for the APA (i.e., roughly 1.75 times more variable). Other statistical parameters yielded the same conclusion (e.g., RPOM at the end of testing is 1.9 times higher for PURWheel-G2 than APA). Figure 4 shows that PURWheel-G2 variability increased slightly from 4,000 to 16,000 to 20,000 passes whereas APA variability was less subject to the pass level considered. For example, COV increased from 21.6% to 25.6% for PURWheel-G2 but remained relatively steady around 14.6% to 16.0% for APA.
Assessment 2: Influence of Va on COV at Varying Pass/Cycle Levels for All Data
Second, COVs of all data considered in Assessment 1 were evaluated with respect to Va level in Figure 6 where data were subdivided into 2% Va bins starting at 4% to 6% and increasing to >12%. To illustrate the Va binning process, SGC-compacted APA data for Mix 9 consisted of six tests at 6.8% to 10.3% Va, creating two groups of data based on Va bins (i.e., 6.8%, 7.0%, and 7.2% in the 6% to 8% Va bin and 9.9%, 10.3%, and 10.3% in the 10%–12% bin). Note that these Mix 9 data are also an example of a small number of cases where Vas were within 2% of each other but were on either side of a Va bin; in these cases, data was binned based on the average Va of that set (i.e., average of 9.9%, 10.3%, and 10.3% is 10.2%, so data were placed in the 10%–12% Va bin). Also, data were analyzed for outliers in each Va bin, and none were detected.

Coefficient of variation (COV) distribution by Va at: (a) 4,000 passes/2,000 cycles, (b) 16,000 passes/8,000 cycles, and (c) 20,000 passes/8,000 cycles (average COV shown at top of plots).
Figure 6 shows that PURWheel-G2 was generally more variable at all Va levels regardless of pass level. Analysis of variance (ANOVA) tests at a significance level of 0.05 showed that PURWheel-G2 exhibited significantly higher COVs for RD4k, RD16k, and RDFinal (p-values of 0.03, <0.01, and <0.01, respectively). ANOVAs showed no significant relationships between Va and COV for PURWheel-G2 RD4k (p-value of 0.24), APA RD4k (p-value of 0.88), and APA RD16k (p-value of 0.96). However, the Va and COV relationship was significant for PURWheel-G2 at 16,000 and 20,000 passes (p-values of 0.04 for both). In other words, Va had little effect on COV early in each wheel tracking test; however, at the end of each test, PURWheel-G2 COVs were significantly influenced by Va while APA COVs were not.
Assessment 3: COV Comparisons for Matched Pair Cases
Third, a smaller analysis was conducted on four matched pairs of PURWheel-G2 and APA data where all factors were matched (i.e., mix, compaction type, and Va bin) and at least three replicates were available. Because these data were not a part of a designed experiment, there were only four cases where matched pairs existed. This assessment, while small, is a direct comparison of the two wheel trackers and was believed to complement the overall variability assessment.
PURWheel-G2 COVs ranged from 12% to 48% and, in three of the four cases, were at least 10% higher than corresponding APA data sets (COVs ranged from 2% to 32%). Overall, PURWheel-G2 COVs averaged 28% and were twice as high as APA values (average of 14%).
Summary of Variability Assessments
Overall, the APA was noticeably less variable than the PURWheel-G2—a consistent trend across all assessments. If not addressed in future equipment and methods, this variability would be problematic and is a significant concern during this process. There are several potential causes of PURWheel-G2’s high variability; two that are believed to be relevant are the equipment itself, which is antiquated relative to today’s commercial systems (e.g., frame, components, and data acquisition), and the less confined boundary conditions associated with testing slabs. Though PURWheel-G2s higher variability is concerning, understanding this variability helps benchmark the prototype PURWheel-G2 equipment, and this assessment has highlighted an area that should be a major focus for future standardization efforts of the RTrack protocol.
Comparison of PURWheel-G2 and APA Final Rut Depths
Direct comparisons of PURWheel-G2 and APA were available for three data set groups organized according to specimen preparation type:
1) PURWheel-G2 LAC slabs compared with APA SGC specimens,
2) PURWheel-G2 LAC slabs compared with APA LAC cores,
3) PURWheel-G2 field-compacted slabs compared with APA field-compacted cores.
Group 1 could be considered the status quo for typical PURWheel-G2 and APA test protocols; accordingly, Group 1 contained the most available data. There were 19 mixes where Group 1 data was available, six for Group 2, and five for Group 3.
To directly compare PURWheel-G2 and APA data despite the ranges of observed Va values, final rut depths were interpolated to adjust RDFinal to a single Va level. For this assessment, adjusted RDFinal values were determined at the average Va value for available PURWheel-G2 slabs of a given mix. Figure 7 illustrates this technique using Mixes 5 and 10 from Group 1 as examples.

Interpolating RDFinal at equivalent Va for PURWheel-G2 and asphalt pavement analyzer (APA) Data. (a) Mix 5 and (b) Mix 10.
Once adjusted RDFinal values were determined for each mix, outliers were assessed using the interquartile range technique (multiplier of 3) by evaluating the ratio of PURWheel-G2 to APA RDFinal (Figure 8). A single outlier, Mix 16 in Group 1, was identified and removed; its RDFinal ratio was 5.5, whereas the average for all remaining Group 1 mixes was 2.0 (with a max of 3.2).
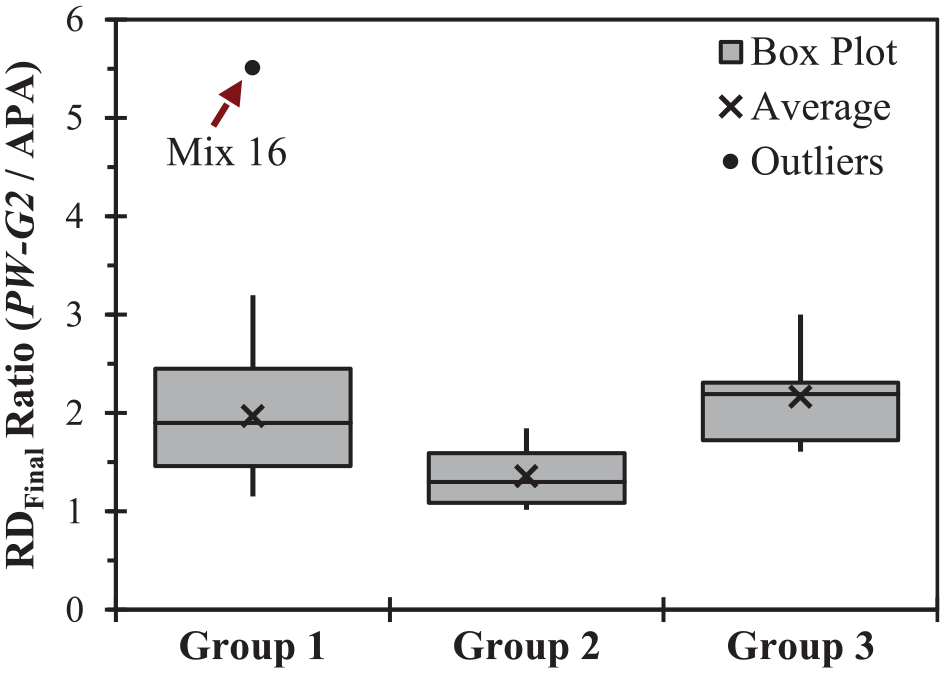
Distributions of adjusted PW-G2 to asphalt pavement analyzer (APA) RDFinal ratios.
Figure 9 plots PURWheel-G2 versus APA results for all three data groups; the orange dashed line in each plot is located at 6 mm, which is the average of all Table 1 pass/fail thresholds (color online only). Figure 9a compares PURWheel-G2 to the APA in what would be considered the most conventional comparison (i.e., LAC slabs in the PURWheel-G2 and SGC specimens in the APA). Despite moderate scatter, an overall relationship clearly exists where the PURWheel-G2 results in greater rut depths than the APA. At roughly 6 mm of APA rutting or less, the relationship is somewhat linear; for higher-rut mixes, the relationship skews more heavily toward the PURWheel-G2. This relationship has considerable dependence on mixes 4 and 7, which is discussed in more detail later in this paper.
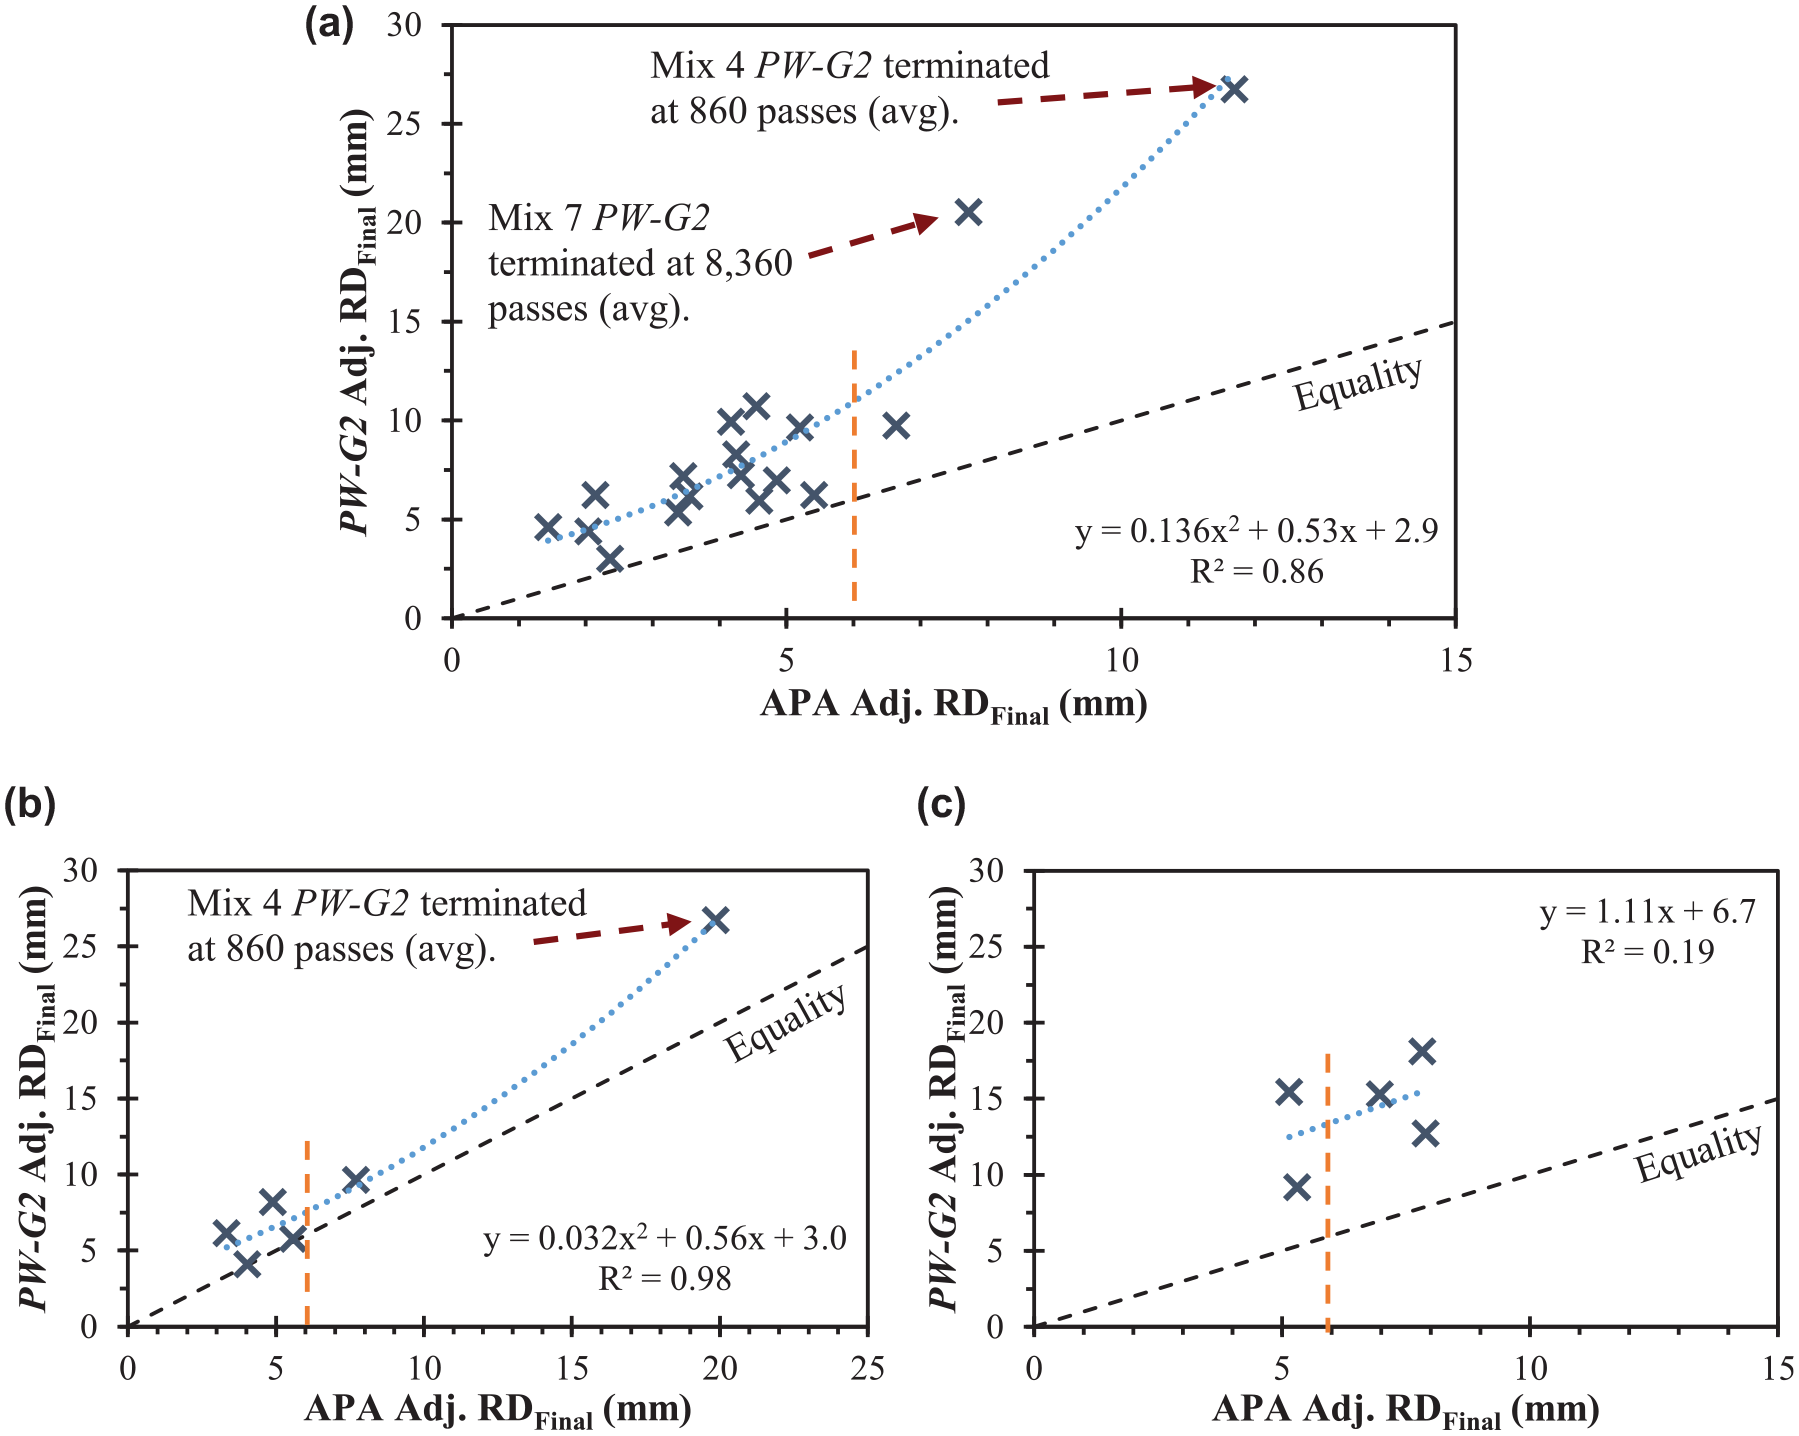
PURWheel-G2 and asphalt pavement analyzer (APA) rut depth equality plots. (a) Data Group 1—PW-G2 LAC versus APA SGC (Status Quo)—Note: R2 reduces to below 0.5 if Mixes 4 and 7 are not considered, (b) Data Group 2—PW-G2 versus APA (LAC), and (c) Data Group 3—PW-G2 versus APA (Field).
Less information is available for Figure 9, b and c , but several trends are apparent. Overall, LAC-compacted data in Figure 9b show that, when compaction method was standardized, data converge toward the equality line relative to Figure 9a. Similar to Figure 9a, the relationship skews toward PURWheel-G2 at high rut depths (i.e., Mix 4) but is fairly linear at lower rut depths (i.e., around the 6 mm threshold or less).
Conversely, when PURWheel-G2 and APA tests were both performed on field-compacted slabs and cores, respectively, PURWheel-G2 produced around 2.2 times higher rut depths than the APA, a noticeably greater difference relative to Figure 9a. This field-compacted comparison is provided for relative context because the data were available and also because it was reported in one of only two other publications where PURWheel-G2 and APA results were compared (i.e., Howard et al. [ 45 ]); however, the large offset between PURWheel-G2 and APA is not fully understood. It is worth noting that Howard et al. ( 45 ) focused on using additives to increase haul time, and the five mixes are Mixes 1b through 1f (Table 3), so Figure 9c effectively represents one mix with relatively minor variations in binder source or warm mix additive. Since test method standardization techniques are typically based on lab-prepared specimens, subsequent discussion focuses on data in Figure 9, a and b , and Figure 9c data are not explored further in this effort.
With respect to lab-compacted data, Figure 9, a and b , collectively illustrate effects of compaction method on test outcomes. Although Figure 9a seems to indicate PURWheel-G2 is more severe than the APA, this behavior is attributed, at least to some extent, to compaction method differences. When the same LAC compaction method is used (Figure 9b), the two methods are more similar. This trend aligns with prior investigations that showed the LAC generally produces specimens with a higher propensity for rutting relative to the SGC ( 48 ).
Rubber Tire Wheel Tracker Failure Criteria
Figure 10 replots Group 1 data from Figure 9a but with the addition of a tentative PURWheel-G2 pass/fail threshold at 10 mm. Figure 10a shows all available data, and Figure 10, b and c , shows only the subset of data that would be considered passing or nearly passing based on average Table 1 pass/fail thresholds. In this region, the PW-G2-to-APA relationship can reasonably be considered linear. Regardless of whether all data is considered (Figure 10a) or only the linear subset with the trendline intercept set to zero or not (Figure 10, b and c ), Figure 10 shows that a 6 mm APA pass/fail threshold corresponds to approximately 10 mm for the PURWheel-G2 when testing LAC slabs. An argument could be made for a range of numbers between 9 and 11 mm; however, all would be in the neighborhood of 10 mm, so 10 mm was chosen.
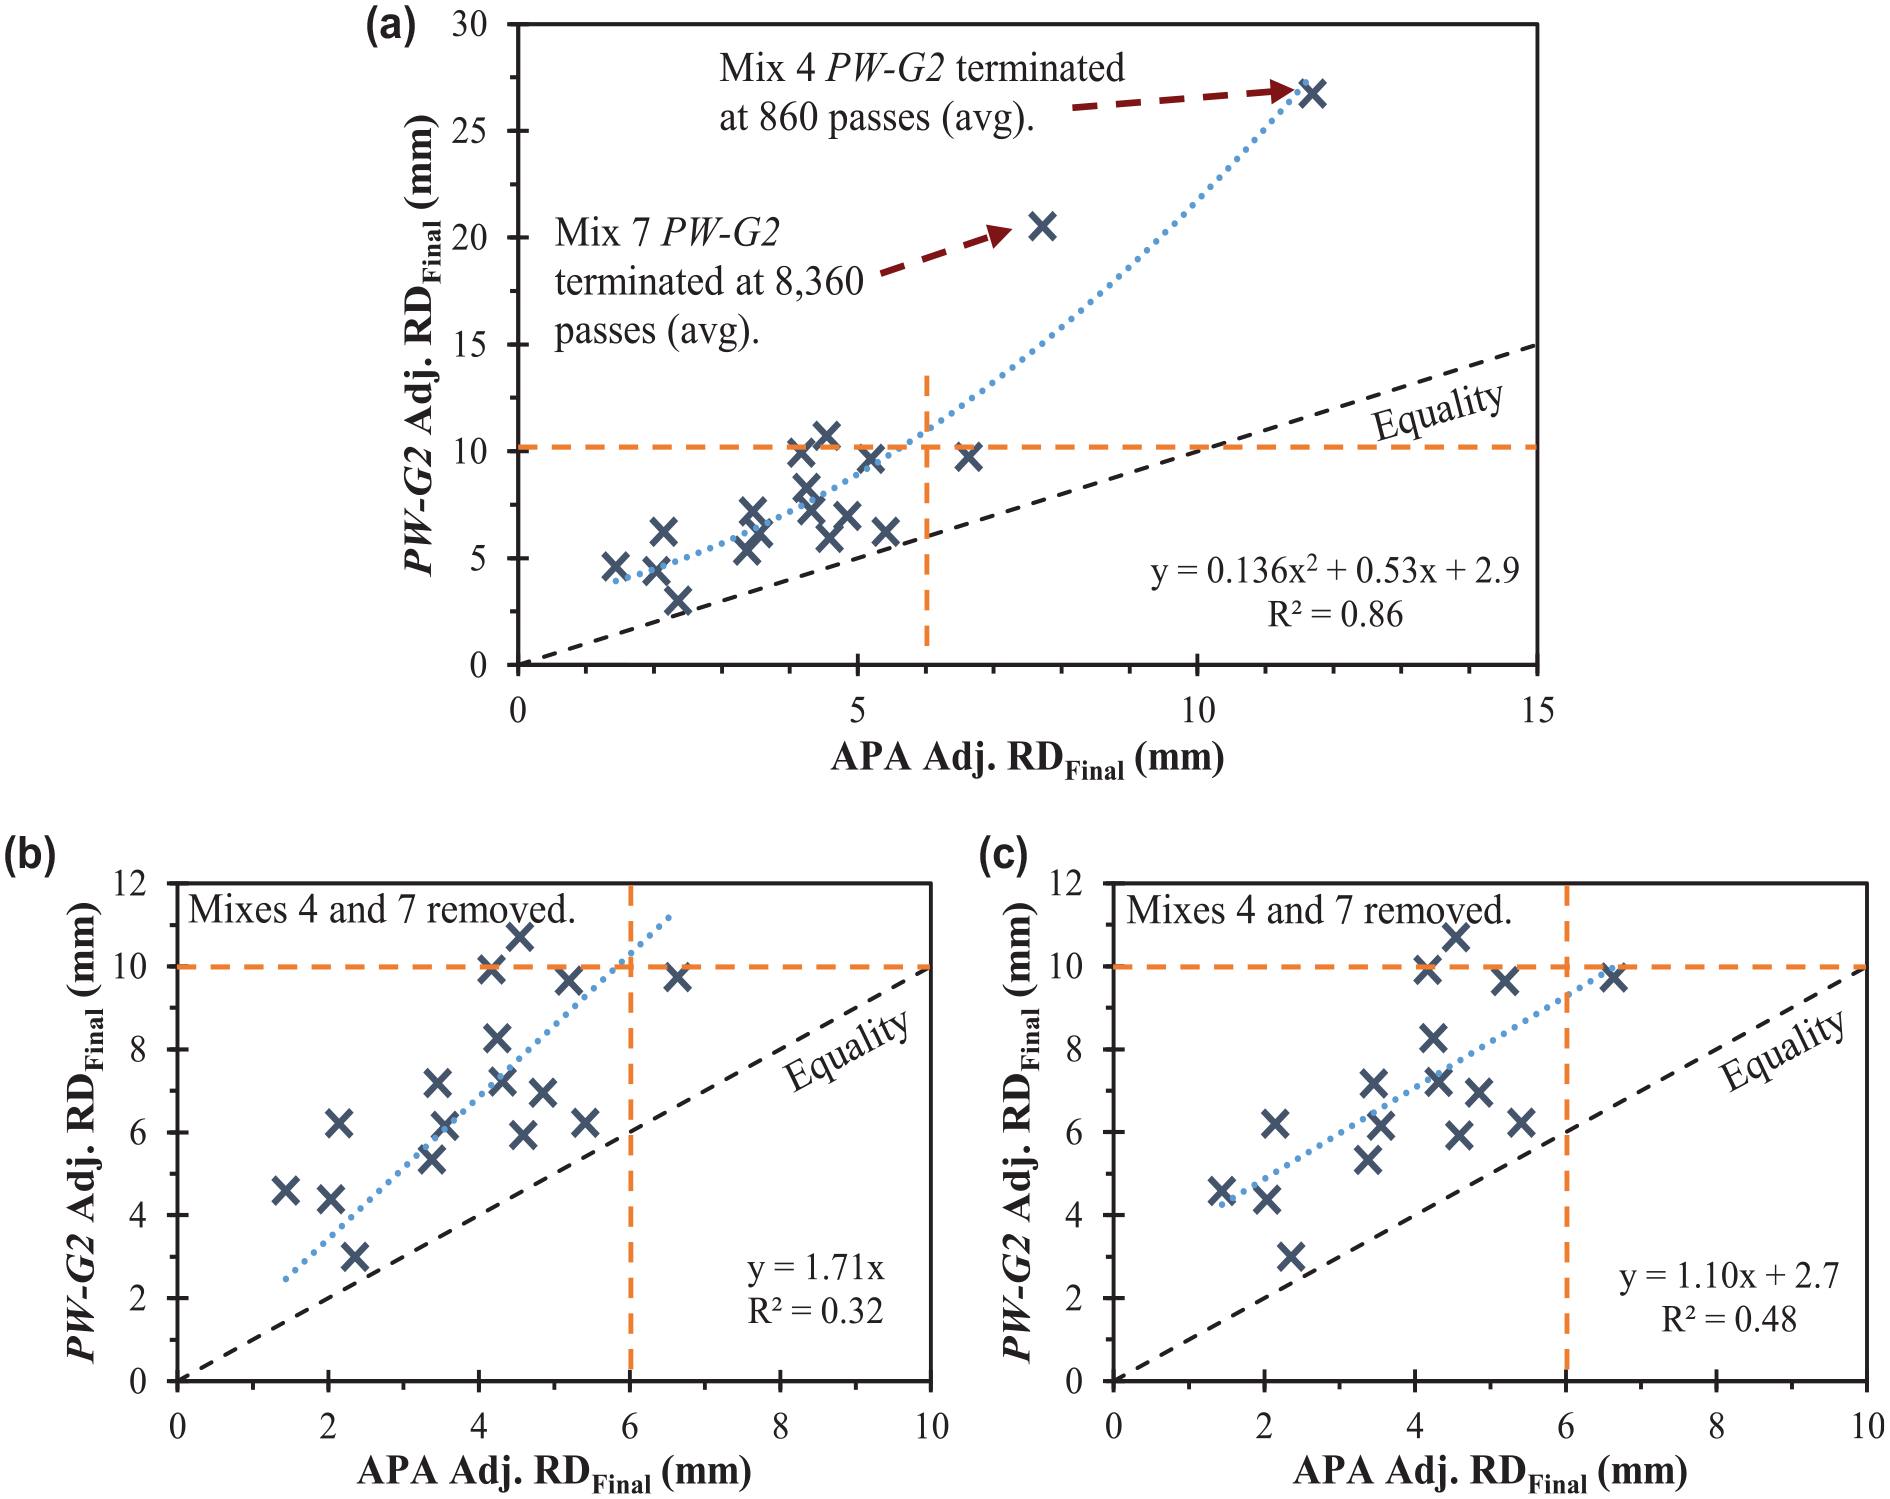
Tentative failure threshold for Group 1 data (PW-G2 LAC versus APA SGC). (a) All data available, (b) linear subset of all data—intercept set to zero, and (c) linear subset of all data—intercept not set to zero.
Figure 11 plots the linear subset of Group 2 data similar to Figure 10, b and c . As discussed in the previous section, Figure 11 shows that PURWheel-G2 and APA results are less different when compaction method is standardized (i.e., LAC compaction for both tests). As in Figure 10, whether the data are evaluated by setting the intercept to zero or not, the outcome is similar—a 6 mm APA pass/fail threshold corresponds to approximately 8 mm for the PURWheel-G2, which is a 2 mm downward shift from 10 mm in Figure 10.
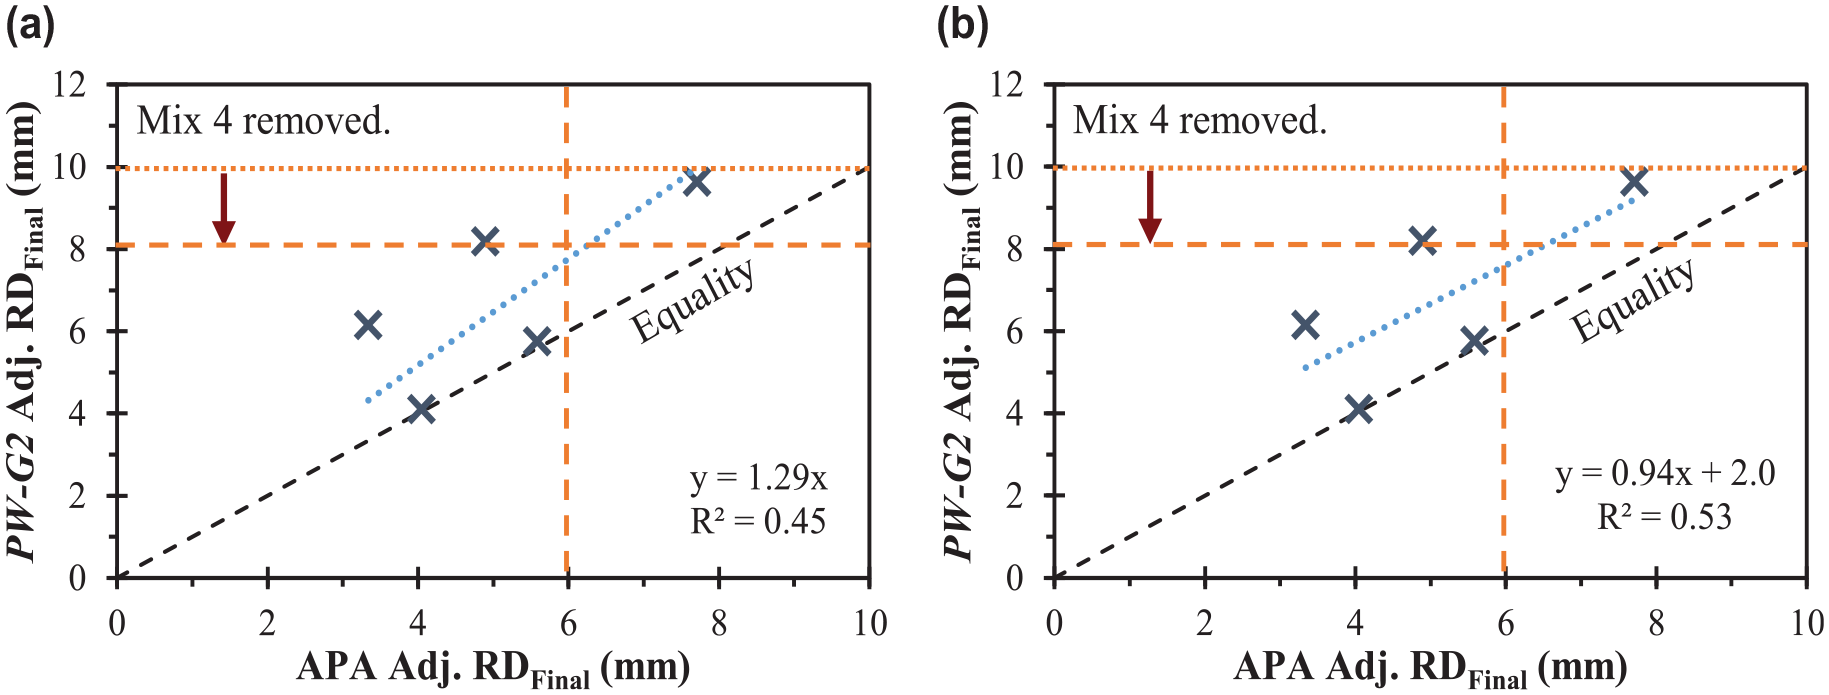
Tentative failure threshold for Group 2 data (all linear asphalt compactor (LAC)-compacted). (a) Linear subset of all data—intercept set to zero and (b) linear subset of all data—intercept not set to zero.
The goal of this work with the PURWheel-G2 is to rationalize the merits of rubber-tire wheel tracking moving forward. However, efforts moving forward are interested in pursuing a more established testing equipment platform relative to PURWheel-G2 for several reasons. First, the PURWheel-G2 equipment no longer exists, but second, the PURWheel-G2 concept stands to benefit greatly from use of a more commercial test frame and components as well as modern data acquisition. For example, the high variability observed in Figures 4 to 6 is believed to be partially attributable to the equipment setup and dated technology of PURWheel-G2. Further, practical aspects of routine testing make testing SGC specimens more desirable than testing slabs of any type.
Holistically, the analysis presented in Figures 9 to 11 shows some general relationships between rubber-tire and rubber-hose testing as presented in paper. This same analysis also shows that there was not a direct offset between PURWheel-G2 and the APA. Multiplying PURWheel-G2 test outputs by 0.6 does not assure equivalency to APA test outputs. Multiplying PURWheel-G2 test outputs by 0.6 does, however, align the two groups of data in a useable way. For example, a failure criteria of 10 mm for PURWheel-G2 would have the same practical outcome for an agency as a failure criteria of 6 mm with the APA. This point can be visually seen in Figure 9a if it is divided into four quadrants (i.e., both pass, one passes, or both fail). In almost all cases, either both pass or both fail when 6 and 10 mm are used as quadrant boundaries.
Ultimately, the work here seeks to establish the RTrack testing protocol which, simply put, is a modernized version of the PURWheel-G2 concept. In making the transition from PURWheel-G2 to RTrack, the intent is to largely abandon slab testing and adopt SGC specimen (or field core) testing similar to other established wheel tracking methods (e.g., APA and HLWT). During this transition, changing boundary conditions from a large slab to 150 mm diameter specimens butted together will undoubtedly affect shear flow behaviors during testing and final rut depth. The expectation is that, all other factors being equal, shifting rubber-tire wheel tracking from slabs in the PURWheel-G2 to SGC specimens in the RTrack would result in reduced rut depths.
Some literature has provided guidance on quantifying the effects of specimen geometry and boundary condition on final rut depth. Tsai et al. ( 49 ) performed an HLWT experiment where SGC specimens and slabs were tested simultaneously, and slabs rutted approximately 2 mm more than SGC specimens owing to the lack of shear flow constraint. Additionally, using APA data reported in ( 21 ) showed that for a range of test temperatures, hose sizes, air voids, and mixtures, beams on average rutted 1.9 mm more than SGC specimens. Based on these published relationships, the authors feel comfortable that by altering the specimen geometry and boundary conditions from slabs to SGC specimens, final rut depths should decrease by approximately 2 mm in the range being considered for pass/fail thresholds (e.g., 6–8 mm).
Applying observations in literature to Figure 11 data, it appears reasonable to suggest 6 mm as a starting point for an RTrack pass/fail threshold similar to the current average 6 mm APA threshold. In a broader sense, an agency choosing to use their existing APA pass/fail threshold as the pass/fail threshold for RTrack testing appears to be a reasonable starting point. For example, Virginia uses a 7.0 mm APA pass/fail threshold for SM 12.5A mixtures (Table 1); if they were to explore RTrack testing, starting with 7.0 mm for the RTrack pass/fail threshold appears reasonable.
Discussion
The overarching goal of the collective research on rubber-tire wheel tracking is to demonstrate the value of and then establish a standardized test protocol for rubber-tire wheel tracking to measure dry rutting and moisture damage aspects of asphalt mixtures. Cox et al. ( 3 ) demonstrated the overall value of rubber-tire wheel tracking’s ability to separate dry rutting from moisture damage, and this paper elaborates on the dry rutting component. The authors believed that, to fully demonstrate the value of both dry and wet rubber-tire wheel tracking, a logical first step was to compare dry rubber-tire wheel tracking against AASHTO T340 (i.e., the most common established dry rutting test).
Data here have shown that relating the original PURWheel-G2 prototype to the APA in a useable way is possible. The APA has a long history of successful use for dry rutting characterization, and it should be made clear that this effort is not seeking to improve dry rutting characterization as the APA is already sufficiently capable. This effort is primarily seeking to demonstrate that dry rutting with rubber-tire wheel tracking is as respectable as the APA (i.e., not necessarily better than, but as useable as). Data in this paper support this position.
A combination of data presented herein and literature collectively supports the initial recommendation that established APA pass/fail thresholds, the average being approximately 6 mm, be carried over to rubber-tire wheel tracking. Data showed 10 mm for LAC-compacted PURWheel-G2 reasonably equated to the 6 mm SGC-compacted APA criteria, and this relationship became 6 to 8 mm when LAC compaction was used for both PURWheel-G2 and APA. This general trend aligned with previous relationships reported for rutting differences between LAC- and SGC-compacted specimens. As rubber-tire wheel tracking standardization moves further toward testing of SGC-compacted specimens, literature supports the thought that rubber-tire wheel tracking and APA results would further converge another approximately 2 mm, leading to the recommendation that a 6 mm pass/fail threshold for rubber-tire wheel tracking of SGC specimens would provide comparable discernment of mixtures as a 6 mm APA failure criteria.
Findings discussed in the preceding two paragraphs are not necessarily valuable on their own since the goal is not to create a better dry rutting test; they are valuable when coupled with the potential for wet testing. The value of establishing rubber-tire wheel tracking as a reasonable dry rutting test is that it lays a foundation for wet testing’s value to be further explored. As discussed in Cox et al. ( 3 ) and the literature review in this paper, wet rubber-tire wheel tracking has potential for greater mixture assessment value than wet APA testing has demonstrated.
Moving forward, standardizing a wet and dry rubber-tire wheel tracking test protocol is the ultimate goal. Toward this goal, interactions have occurred over the past few years with AASHTO’s Committee on Materials and Pavements (COMP) that recently led to commencing the process of drafting a standard test method for their review and consideration. The works of Cox et al. ( 3 ) and this paper are the primary considerations being given to this evolving draft method generally referred to as RTrack. The major factors identified for consideration and improvement are listed below; this list should not be viewed as all factors that could be identified during the process.
Standardizing the rubber wheel—consider alternatives to air filled
Reduce variability relative to PURWheel-G2 as this is a valid and significant concern
Improve data acquisition protocols—primary supporting data is found in Cox et al. ( 3 )
Improved procedures to interpret wet testing—future papers envision to work in this arena
Implementation is usually a long term and formidable challenge, especially when alternatives exist (e.g., Hamburg and APA in this case). A standard test method generally helps with implementation, as does commercialization of needed equipment. As of the writing of this paper, RTrack is commercialized, and efforts are continuing toward a standard method. The currently commercialized unit employs modern data acquisition and tests gyratory compacted specimens.
Conclusions
Rubber-tire wheel tracking has shown promise for dry rutting characterization as well as wet rutting characterization, which enables direct decoupling of rutting and moisture damage mechanisms. This paper focused on dry rutting aspects with two main objectives: demonstrate rubber-tire wheel tracking is capable of characterizing dry rutting in a manner comparable to the APA and recommend initial failure criteria for rubber-tire wheel tracking.
Data in this paper support the idea that a rubber-tire wheel tracker that applies a 1,750 N wheel load and induces a gross contact pressure of 630 kPa is usably comparable to the standard AASHTO T340 protocol (i.e., 445 N load, 690 kPa hose pressure) when tested at the same high-temperature conditions. Ultimately, the authors recommend agencies consider adopting the same failure criteria already established for APA testing (e.g., 6 mm) and be willing to adjust over time as data and experience dictate the need to do so. Moving forward, efforts are ongoing to standardize rubber-tire wheel tracking within the RTrack test protocol and address limitations of the original PURWheel-G2 equipment (e.g., variability).
Footnotes
Acknowledgements
W. Griffin Sullivan (Mississippi DOT) has supported these wheel tracking improvement efforts over the past several years. Jessica V. Lewis is the holder of the Ergon Asphalt & Emulsions Distinguished Doctoral Fellowship in Construction Materials that supports her efforts in a variety of manners. Permission to publish was granted by the Director, Geotechnical and Structures Laboratory, Engineer Research and Development Center (ERDC).
Author Contributions
The authors confirm contribution to the paper as follows: study conception and design: JVL, ASC, BCC, ILH; data collection: BCC, ILH; analysis and interpretation of results: JVL, ASC, BCC, ILH; draft manuscript preparation: JVL, ASC, BCC, ILH. All authors reviewed the results and approved the final version of the manuscript.
Declaration of Conflicting Interests
The authors declared no potential conflicts of interest with respect to the research, authorship, and/or publication of this article.
Funding
The authors received no financial support for the research, authorship, and/or publication of this article.
