
Abstract
Advanced driving assistance systems (ADAS) are designed to reduce potential crash risks and enhance driving safety. However, drivers’ interactions with ADAS may vary depending on their individual driving styles and characteristics. This study proposes a novel approach to classifying driving styles and explores how age and gender affect interactions with ADAS. The study utilized two naturalistic driving data sets comprising 148 drivers from four age groups: teens; younger adults; middle-aged adults; and older adults. Data were collected during two periods: baseline (without ADAS); and treatment (with ADAS). First, the K-means clustering algorithm was employed to divide trips into one conservative and two aggressive groups based on three driving behavior metrics: tailgating; speeding; and lane-changing. The aggressive-trip ratios were then calculated for each driver during each of the two periods. The Bayesian Gaussian mixture model was applied to determine the threshold values of the aggressive-trip ratios to classify drivers as conservative, moderate, or aggressive during each period. This allowed for identifying changes in driving style upon the activation of ADAS. The subsequent multinomial logistic regression model results showed that driving styles vary across age groups, with teens being the most aggressive drivers. Certain changes in driving style were observed, with some conservative drivers becoming aggressive or moderate and some aggressive drivers becoming conservative or moderate, but these differences were statistically non-significant. The findings of this study indicate that warning-based ADAS may not elicit significant changes in driving style, particularly among teenage drivers who are consistently the most aggressive drivers.
Keywords
The development of advanced driver assistance systems (ADAS) holds significant potential for preventing traffic accidents by detecting traffic conflicts and providing warnings or control assistance to mitigate potentially hazardous driving situations ( 1 ). The impact of these systems, however, is expected to be more advantageous for teenage drivers than adult drivers because of the greater crash risk reported among teenage drivers compared with adults ( 2 ), their tendency to engage in risky driving behaviors such as speeding and close following (3, 4), and their propensity for delayed or erroneous detection and response to ambiguous driving hazards ( 5 ).
Studies investigating the impact of ADAS on driver behavior have yielded a range of findings. For instance, a study observed significant increases in braking time and time headway as well as decreases in speeding on exposure to ADAS ( 6 ). Another study found positive effects of ADAS in the vehicle-following scenario for both skilled and unskilled drivers, manifesting as an increase in time headway and a reduction in positive longitudinal acceleration ( 7 ). However, the study also found negative effects of ADAS on the driving performance of skilled drivers in the braking scenario, indicated by a reduction in time headway ( 7 ). Additionally, Jermakian et al. ( 8 ) reported that teenage drivers who received ADAS warnings engaged in risky driving behaviors, such as tailgating, more frequently than those who did not receive warnings, whereas Kidd et al. ( 9 ) found that the presence of collision warning systems did not significantly affect the likelihood of secondary task engagement for either teenage or adult drivers.
The discrepancy in findings with regard to the impact of ADAS on driver behavior may be partially attributable to individual driving styles. Driving style pertains to a driver’s unique driving tendencies and personal attributes that govern response selection, whereby certain drivers tend to exhibit more aggressive driving behaviors, such as speeding and tailgating, whereas others tend to drive more cautiously ( 10 ). The same ADAS warnings and control functions can have different effects on individuals with varying driving styles. Therefore, it is essential to account for driving style when evaluating the capabilities and effectiveness of ADAS.
Previous research proposed various techniques for classifying driving styles. These include fuzzy control theory, and statistical and machine learning models such as K-means clustering, Bayesian classification, neural networks, hidden Markov, and Gaussian mixture (11–13). These methods use single and multivariate indicators, which are collected either through subjective measures, such as questionnaires (14–16), or objective measures, such as driving behavior and performance variables and psychophysiological data (11, 12, 17, 18). For instance, Doshi et al. ( 17 ) used a single driving performance variable, namely, lateral jerk, to classify drivers as aggressive or non-aggressive by defining a critical clustering threshold of the standard deviation of lateral jerk values among drivers in a driving simulator study. In contrast, Yan et al. ( 11 ) used seven measures, that is, the steering wheel’s rotation angle, angular velocity, angular acceleration, total driving time, vehicle velocity, and the number of collisions and lane excursions, to classify driving tasks into three driving style groups using K-means clustering and then used the resulting labels to train a support vector machine model using electroencephalography feature vectors. Sun et al. ( 18 ) employed a multidimensional Gaussian hidden Markov process to classify drivers into three groups based on behavioral data (root mean square of acceleration, starting time, and following time) collected using a real-time simulation platform. Deng et al. ( 12 ) conducted a field test to classify driving styles into three groups, aggressive, moderate, and mild, using a hidden Markov model that utilized braking data such as brake pedal force, brake deceleration, and braking time. Some studies utilized crash frequencies as an alternative behavior indicator for classifying driving styles. For instance, Georgi et al. ( 19 ) employed information from the German In-Depth Accident Study database to cluster drivers’ reactions to actual crash incidents into three types: (a) no braking reaction; (b) delayed or insufficient braking; and (c) delayed but maximum deceleration.
Researchers have recently acknowledged the importance of individual differences in driving styles and have explored ways to incorporate them into ADAS designs. This involves customizing ADAS feature settings based on driving style, with the aim of enhancing user acceptance and trust and optimizing system benefits. For example, Jamson et al. ( 20 ) tested an adaptive forward crash warning (FCW) system that provided relatively early warnings to aggressive drivers and relatively late warnings to non-aggressive drivers. The system significantly reduced aggressive drivers’ reaction time compared with the non-adaptive one. In another study, Lee et al. ( 21 ) investigated the effectiveness of a rear-end collision avoidance system for distracted drivers as a function of warning onset. They found that early warnings were more beneficial for distracted drivers than late or no warnings. Additionally, in the development of Bosch’s advanced emergency braking system, the system employed several levels of warning strategies that varied according to drivers’ behavior, which was classified into three groups: lethargic; realistic; and best-case ( 19 ).
The preceding evidence underscores the need for additional research comparing the impact of ADAS on drivers of varying ages, as this may reveal unexpected safety issues, especially for teenage drivers. To fully understand the impact of ADAS on driving behavior and their interaction with individual driver attributes, such research must not only consider the impact on a trip-by-trip basis, but also examine their effect on an individual’s overall driving style. Existing literature on this topic focuses primarily on the impact of ADAS on individual driving behavior metrics in isolation. However, examining the impact of ADAS on multiple metrics concurrently is critical, as breaching the threshold of one metric during a trip does not necessarily signify risky or aggressive driving. For instance, speeding may be a natural occurrence when turning left at an intersection, and in this context it does not represent aggressive driving. Consequently, it is essential to use multiple metrics in tandem when studying the impact of ADAS to allow for a thorough and nuanced understanding of driving behavior.
Therefore, this study aims to address the research gap by (a) identifying pertinent driving behavior metrics and algorithms for classifying driving styles and trips, and (b) examining the effects of ADAS and driver attributes, such as age and gender, on aggregate driving behavior as measured by driving style classification. The research analyzes the use of ADAS in four age groups, that is, teens, younger adults, middle-aged adults, and older adults, to gain a better understanding of the safety consequences of ADAS use. Our study reports the results of naturalistic highway driving data collected from two programs: the Integrated Vehicle-Based Safety Systems (IVBSS) program; and the Teen-IVBSS program. Section 2 outlines the data and methods used to achieve our objectives. In Section 3, we present the results of our quantitative analysis of how ADAS improve driving behavior under certain conditions and cause it to deteriorate under others. Finally, in Section 4, we conclude our study by discussing the findings and their implications, comparing these findings with previous studies, and outlining the study’s limitations.
Methods
Data Source
The naturalistic driving data used in this study were obtained from two previous field operation test projects, namely, the IVBSS program ( 22 ) and the Teen-IVBSS program ( 23 ), both conducted by the University of Michigan Transportation Research Institute. Both programs utilized the same integrated warning systems, of which there were four types: (a) FCW; (b) lateral drift warning (LDW); (c) lane change/merge warning (LCM); and (4) curve speed warning (CSW). The FCW system is designed to alert the driver when the host vehicle is at risk of colliding with the rear end of the vehicle in front, whether the vehicle is moving or stationary. The LDW system is activated when the driver accidentally departs from the roadway or changes lanes without signaling. The LCM warning is triggered when the host vehicle is moving laterally and is at risk of colliding with an object in the adjacent lane. Finally, the CSW system alerts the driver when the host vehicle is approaching a curve at a high speed. Further details on these systems can be found in previous studies (22, 23).
The IVBSS study involved 108 adult drivers from three age groups: 36 younger drivers aged between 20 and 30; 36 middle-aged drivers aged between 40 and 50; and 36 older drivers aged between 60 and 70. The study design involved two baseline weeks during which warning systems were muted to record the original driving behavior of each participant, and four treatment weeks during which the warning systems were activated as intended. The adult drivers completed a total of 22,657 trips, covering 213,309 miles (mi) and spanning over 6,164 hours (h). On average, the FCW, LDW, LCM, and CSW were triggered every 250 mi, 14.3 mi, 158.7 mi, and 238.1 mi, respectively ( 24 ). The Teen-IVBSS study comprised 40 teen drivers aged 16 to 17 with a Michigan Level 2 license. Twenty teens were assigned to the experimental group and 20 to the control group. The experimental group drove the IVBSS vehicles for 14 weeks, with three baseline weeks, eight treatment weeks, and three post-treatment weeks, whereas the control group drove the vehicles with muted warning systems for the entire 14 weeks. The teen drivers completed a total of 15,039 valid trips, covering 93,976 mi and spanning over 3,259 h ( 23 ). To ensure comparability between adult and teen drivers, data for the latter were selected from weeks 1 to 2 and 4 to 7. Additionally, to maintain consistency, baseline weeks corresponded to weeks 1 and 2 for both groups, whereas treatment weeks corresponded to weeks 2 to 6 for adults and weeks 4 to 7 for teens. Furthermore, to align with the study’s focus on highways, only trips on highways were included.
Data Reduction
In this analysis, the driving behaviors of adult and teen drivers were examined using three types of highway driving measures: tailgating ratio; speeding ratio; and lane-changing frequency. To define a tailgating event, a minimum time headway of one second or less between two vehicles was measured, and this duration must last for at least one second ( 25 ) as shown in Figure 1a. Speeding was determined if the vehicle speed was greater than 75 miles per hour (mph), or 33.53 meters per second (m/s), which corresponds to five mph above the maximum post-highway speed limit in Michigan. Two separate speeding periods within the same trip were combined into one event if the time gap between them was less than 10 seconds (s). A highway lane-changing event was identified when a vehicle had been on the highway for 15 s before changing lanes and stayed on the highway for 50 s after changing lanes, as shown in Figure 1b. Lane changes that occurred during entering and exiting the highway were excluded from the analysis. These driving behavior measures were calculated for each individual trip as follows:
Tailgating ratio = Highway tailgating time/Total highway driving time
Speeding ratio = Highway speeding time/Total highway driving time
Lane-changing frequency = Highway lane-changing counts/Total highway driving distance
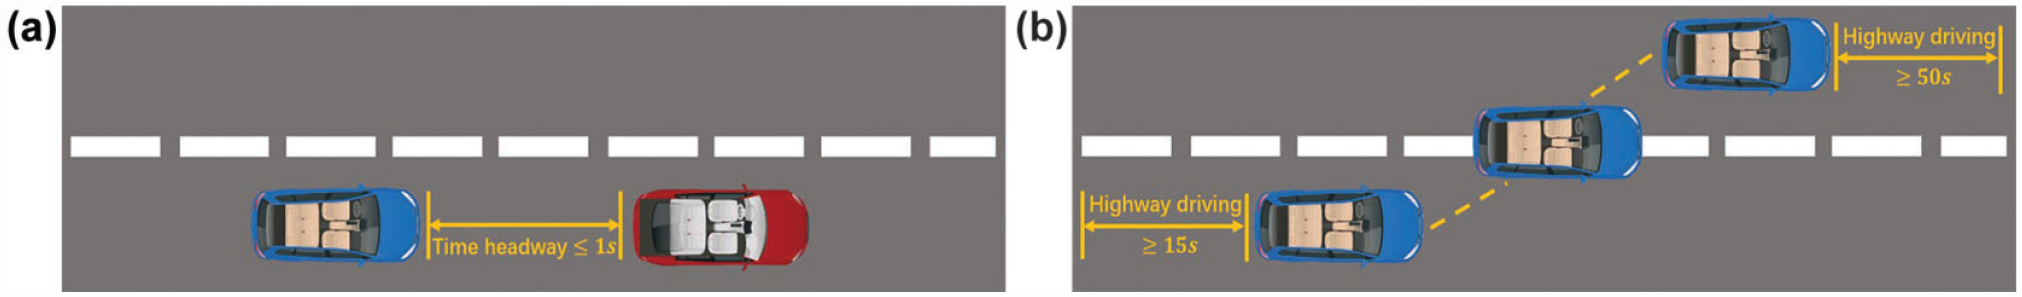
Illustrations for tailgating and lane-changing events: (a) tailgating events, (b) lane-changing events.
After data extraction and pre-processing, a total of 5,372 highway trips with a minimum distance of 3 mi each were collected. Of these, 1,801 highway trips were from baseline weeks and 3,571 were from treatment weeks. The participants consisted of 145 drivers (37 teen drivers and 108 adult drivers). The adult drivers were divided into three age groups: 36 younger drivers; 36 middle-aged drivers; and 36 older drivers. The teen control group comprised 20 drivers, and the remaining 17 teen drivers made up the experimental group. Each trip was represented by a three-dimensional vector, that is, trip = (tailgating ratio, speeding ratio, lane-changing frequency).
The analysis involved several steps, which are illustrated in Figure 2. Initially, a K-means clustering algorithm was applied to three input variables—speeding ratio, tailgating ratio, and lane-changing frequency—to determine each trip’s classification. The drivers were then classified based on their driving styles using a Gaussian mixture model, which was informed by the trip classifications. The driving style of a given driver was compared with two conditions: baseline (without ADAS warnings); and treatment (with ADAS warnings). Finally, a multinomial logistic regression model was employed to determine the impact of ADAS and driver's age and gender on driving style classification.
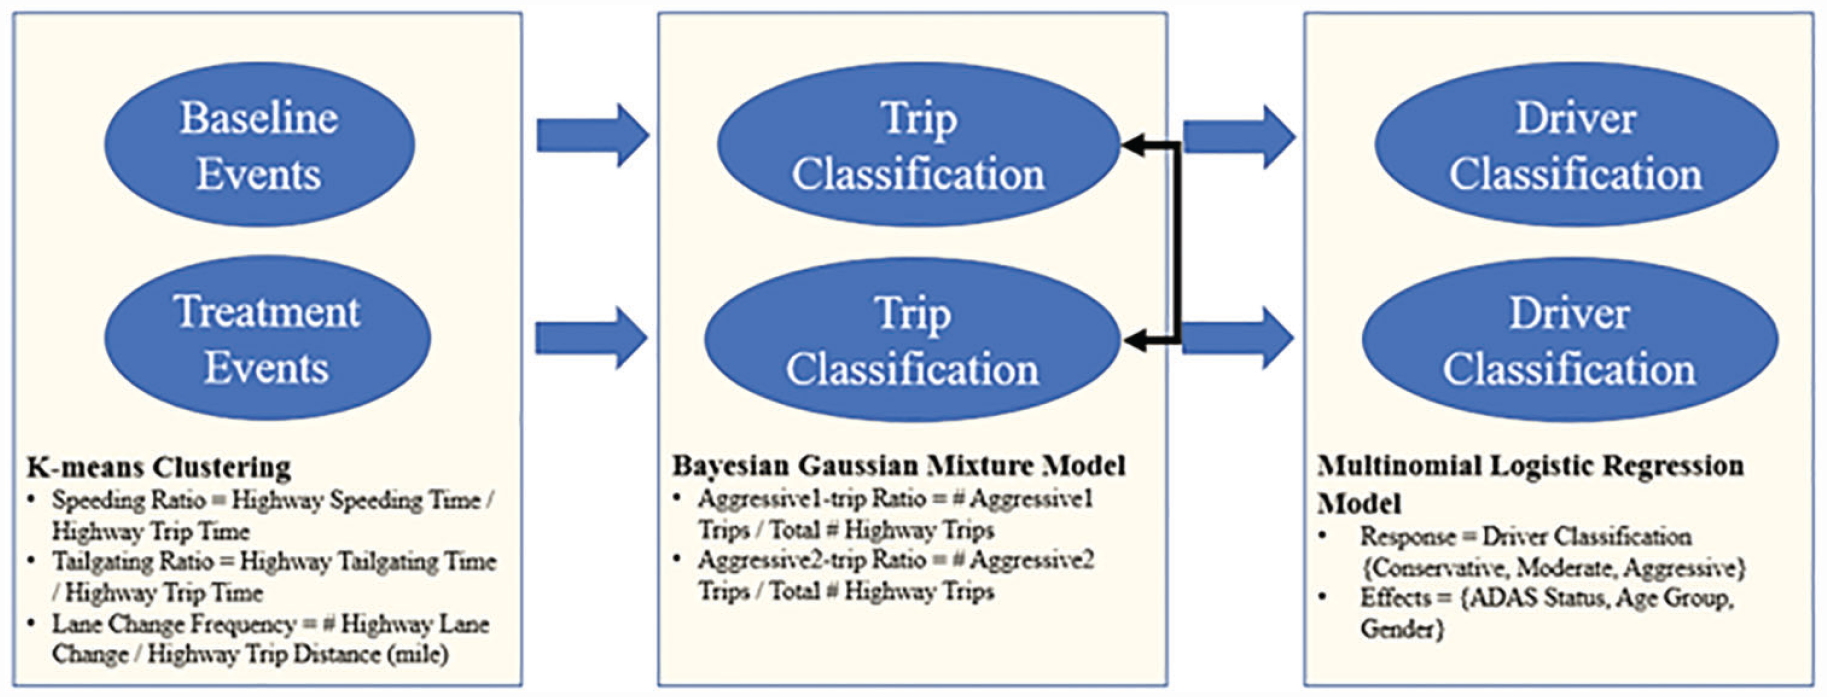
Analysis flowchart.
K-means Clustering
K-means clustering is a commonly used unsupervised machine learning algorithm to cluster an observation

where
To determine the optimal number of clusters for highway trips, we utilized an unsupervised K-means algorithm with the majority rule approach. The algorithm evaluated 30 different performance metrics, including Silhouette score and Davies–Bouldin index, to suggest the optimal number of clusters that was most frequently identified by the 30 indices ( 26 ). Subsequently, we applied the K-means algorithm to cluster all the highway trips based on the pre-determined optimal number of clusters. The K-means model was trained using the tailgating ratio, speeding ratio, and lane-changing frequency as input variables, which then predicted the labels for all the considered highway trips. The NbClust and stats libraries in R were employed to perform the 30 indices rule and K-means clustering algorithm, respectively.
Bayesian Gaussian Mixture Model
The Gaussian mixture model (GMM) computes a set of different Gaussian distributions and assigns a weight parameter (Equation 2).

where
The conventional GMM often suffers from the singularity problem (
27
) and requires manual specification of the number of clusters in advance. To overcome these issues, we utilized the Bayesian Gaussian mixture model (BGM), which not only avoids singularity problems but also automatically selects the optimal number of clusters (
28
). In an ordinary GMM, one latent variable
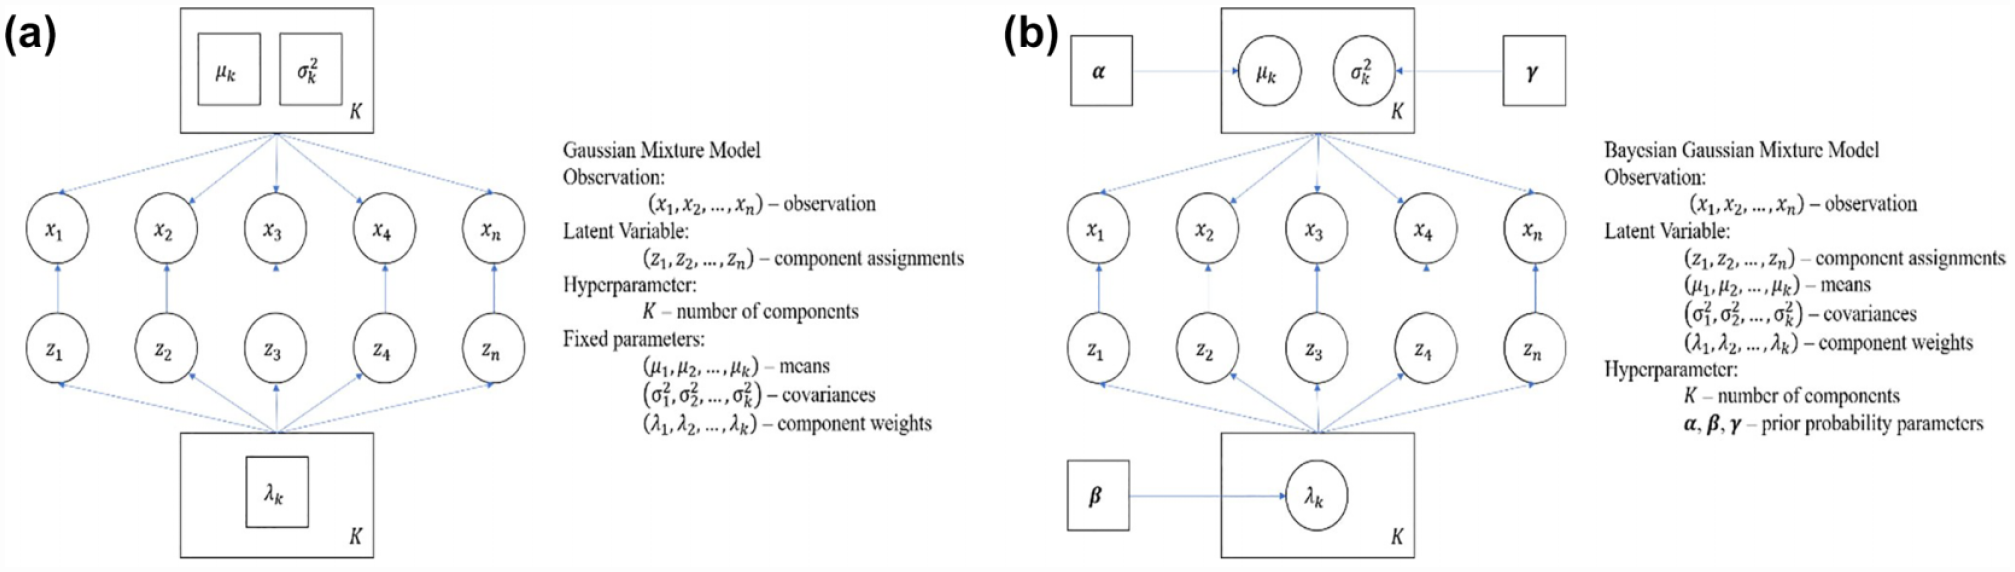
GMM and BGM model comparison: (a) Gaussian mixture model structure, (b) Bayesian Gaussian mixture model structure.
We derived six new variables after the completion of the K-means clustering algorithm, specifically: driver’s baseline Aggressive1-trip ratio; driver’s baseline Aggressive2-trip ratio; driver’s baseline Conservative-trip ratio; driver’s treatment Aggressive1-trip ratio; driver’s treatment Aggressive2-trip ratio; and driver’s treatment Conservative-trip ratio. These ratios were used to quantify the overall driving behavior of each driver in the baseline and treatment conditions. The Aggressive1-trip ratio and Aggressive2-trip ratio were calculated by dividing the number of trips identified as Aggressive1 and Aggressive2, respectively, by the total number of trips completed by the driver for each of the baseline and treatment weeks. A similar calculation was performed for the Conservative-trip ratio in the baseline and treatment weeks. To ensure the informative nature of the trip ratios, the study considered only those drivers who had completed at least six trips during each of the baseline and treatment weeks. Therefore, 21 out of 37 teen drivers and 82 out of 108 adult drivers were included in this aspect of the study.
The present study utilized a BGM model to estimate the risk level of individual driving styles based on the Aggressive1-trip and Aggressive2-trip ratios derived from the K-means clustering. Conservative-trip ratio was not considered as an input to the BGM model because the sum of the three ratios for each duration is unity. The BGM was trained using only the baseline data to avoid the impact of ADAS. After applying BGM to the Aggressive1-trip and Aggressive2-trip ratios of each driver during baseline weeks, threshold values for these ratios were obtained to categorize drivers into three driving styles. These threshold values were then used to re-cluster the same drivers into the three styles based on their Aggressive1-trip and Aggressive2-trip ratios during their treatment weeks. The treatment data from teens' control group were included in the training data set because they did not receive any warnings during treatment weeks. The 2D BGM was executed via the Scikit-learn package in Python.
Multinomial Logistic Regression Model
The multinomial logistic regression model is a statistical technique designed for modeling categorical outcomes with three or more levels. This approach is used to examine the influence of independent variables on the probability of the categorical response. The model’s estimation is based on a specific equation (Equation 3).

where
We conducted a multinomial logistic regression analysis to examine the impact of a driver’s age and gender and the status of ADAS on their likelihood of being classified as aggressive or moderate drivers rather than conservative drivers. Notably, data from teen drivers in the control group, who did not receive any treatment warnings during the study, were excluded from this analysis. In total, we analyzed 91 drivers. The multinomial logistic regression model was implemented using the nnet package in R.
Results
Trip Classification
The optimal number of clusters for classifying highway trips was determined based on the majority rule, which was applied to 30 indices as shown in Figure 4. The majority of these indices suggested that the optimal number of clusters is three. Therefore, a K-means model was applied with the input number of clusters set to three. The resulting clusters were defined based on the values of driving behavior metrics. The three clusters were identified as follows: (a) the Conservative trips’ cluster; (b) the Aggressive1 trips’ cluster; and (3) the Aggressive2 trips’ cluster. The clustering of the 1,801 highway trips that occurred during the baseline weeks is shown in Figure 5a, with 995 Conservative trips (represented by blue dots), 320 Aggressive1 trips (represented by gray dots), and 486 Aggressive2 trips (represented by orange dots). The model also clustered the 3,571 trips from the treatment weeks, resulting in 1,983 Conservative trips (represented by blue dots), 561 Aggressive1 trips (represented by gray dots), and 1,027 Aggressive2 trips (represented by orange dots), as shown in Figure 5b.

Majority rule for K-means clustering.

K-means clustering results for highway driving trips: (a) baseline weeks, (b) treatment weeks.
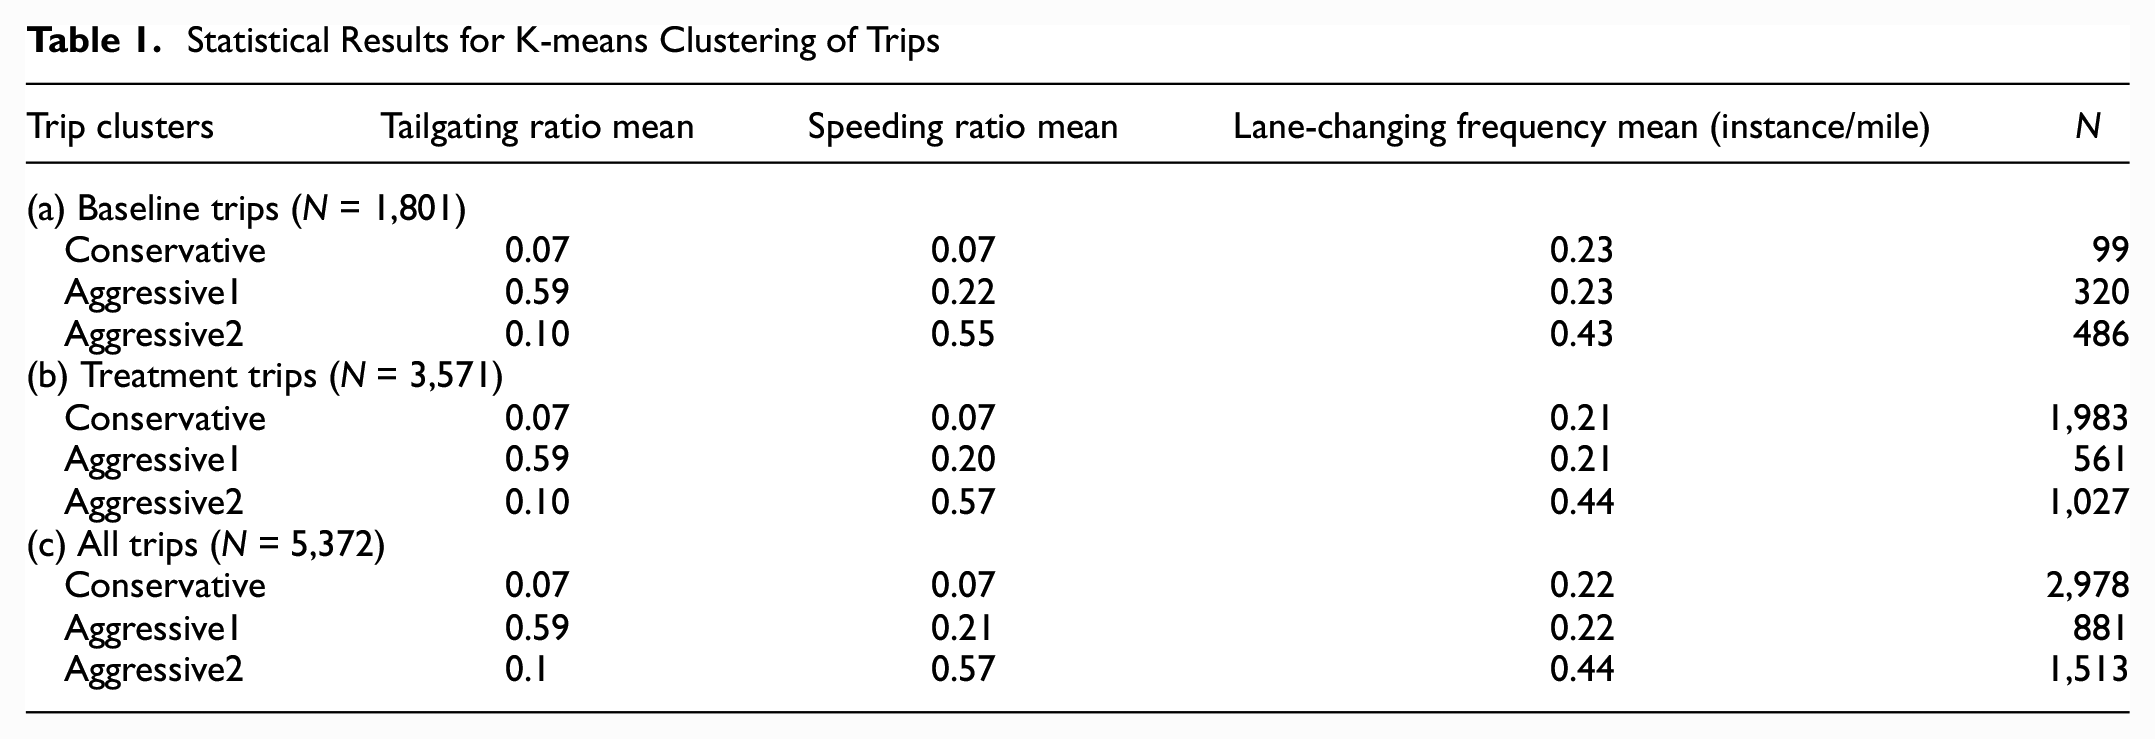
The distribution of the different trip types was examined and summarized in Table 1. Conservative trips accounted for approximately 55.4% of all trips, whereas Aggressive1 and Aggressive2 trips accounted for the remaining 16.4% and 28.2%, respectively. The comparison of the within-cluster mean values for Conservative, Aggressive1, and Aggressive2 trips showed that Aggressive1 trips had a higher tailgating ratio, whereas Aggressive2 trips exhibited a higher speeding ratio and lane-changing frequency. In contrast, Conservative trips had very low speeding and tailgating ratios and did not lead in any driving behavior metric. This trend persisted for both baseline and treatment weeks, as shown in Table 1.
Statistical Results for K-means Clustering of Trips
Driver Classification
The input variables used in the analysis were computed on an individual driver basis. Specifically, the two Aggressive-trip ratios were calculated for each driver, yielding four ratios in total: the baseline weeks’ Aggressive1-trip ratio; the baseline weeks’ Aggressive2-trip ratio; the treatment weeks’ Aggressive1-trip ratio; and the treatment weeks’ Aggressive2-trip ratio.
The BGM model was trained using the Aggressive1-trip and Aggressive2-trip ratios of drivers during their baseline weeks. However, because the teens in the control group did not receive any warnings during the treatment weeks, their ratios in the treatment weeks were also included in the training data set. Consequently, the BGM model automatically identified three clusters, represented by three components. As a result, the driving styles in the absence of ADAS were classified into three categories as shown in Table 2: (a) a conservative driving style, characterized by a high proportion of Conservative trips (mean value of 0.82), with mean Aggressive1-trip and Aggressive2-trip ratios of 0.08 and 0.1, respectively; (b) a moderate driving style, characterized by a high proportion of Aggressive2 trips (mean value of 0.67), with a mean Aggressive1-trip ratio of 0.03 and a mean Conservative-trip ratio of 0.28; and (c) an aggressive driving style, characterized by a high proportion of Aggressive1 trips (mean value of 0.46), with a mean Aggressive2-trip ratio of 0.3 and a mean Conservative-trip ratio of 0.23.
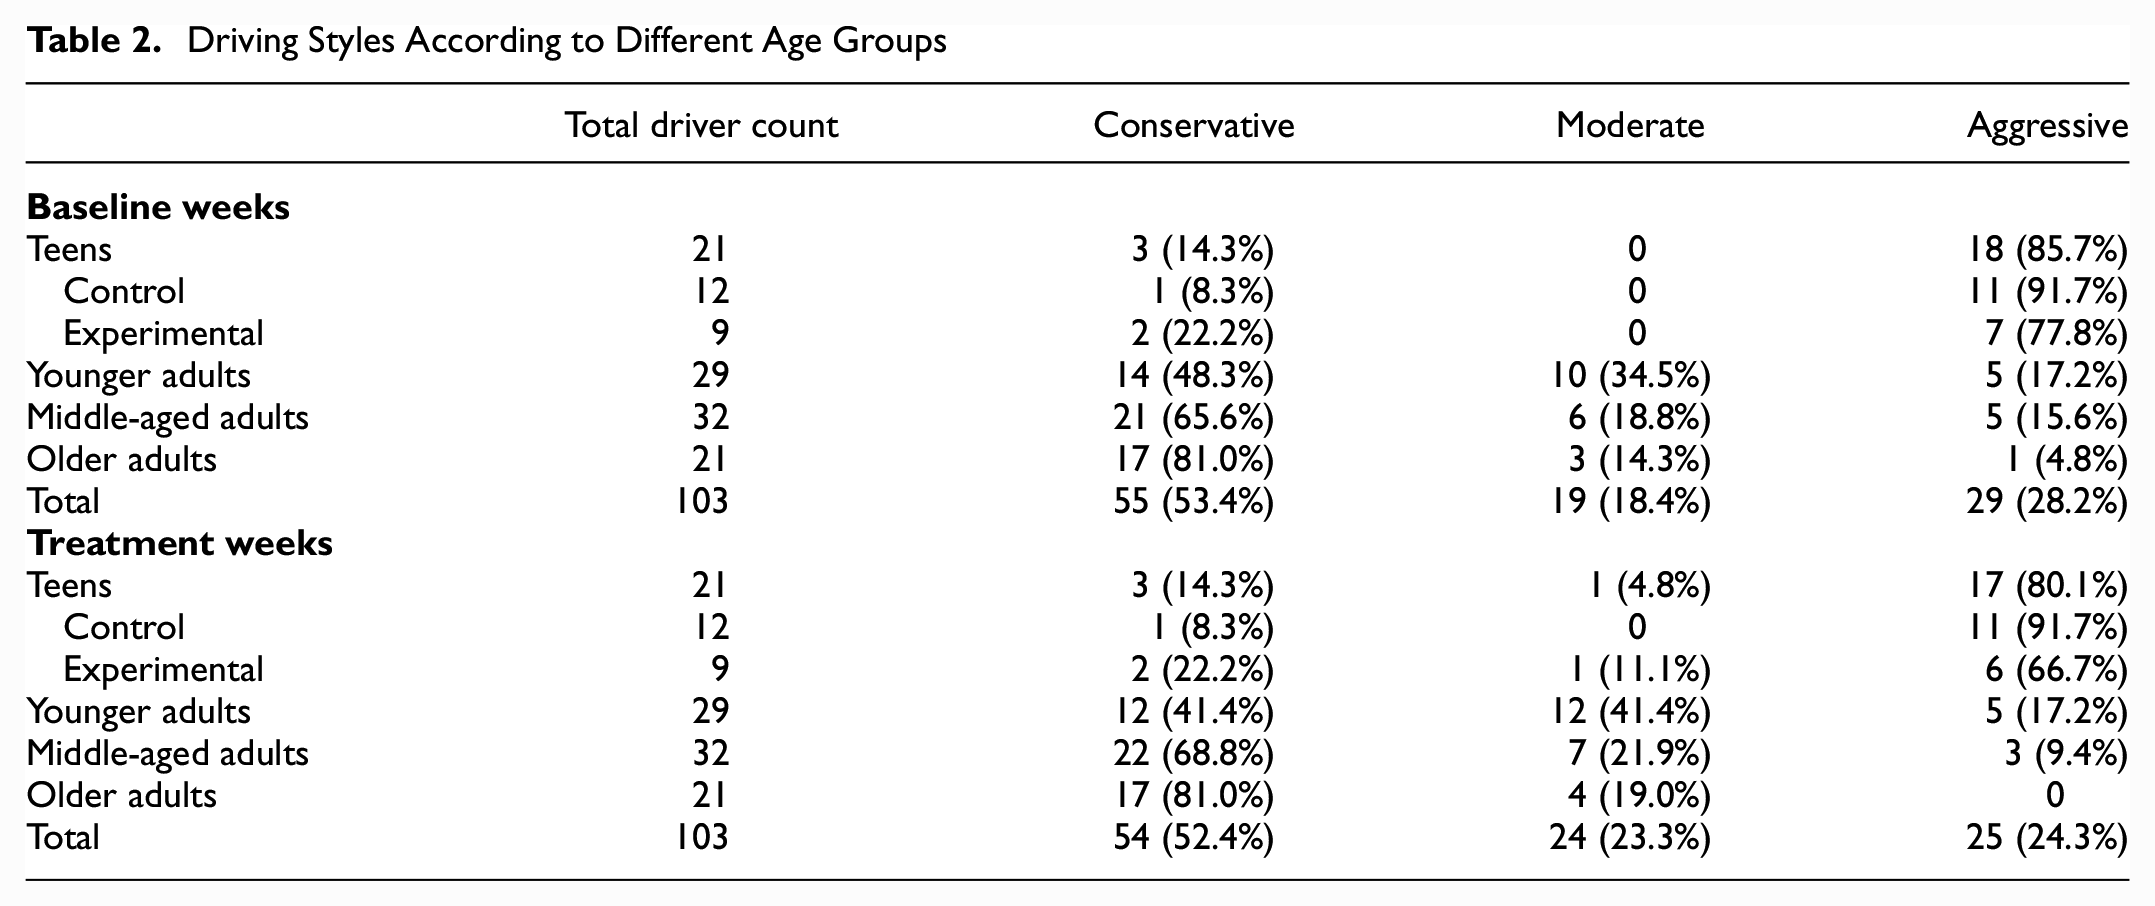
Driving Styles According to Different Age Groups
Age- and ADAS-related Differences in Driver Classification
Table 2 summarizes the classification of drivers into conservative, moderate, and aggressive driving styles during baseline and treatment weeks, stratified by age group. Middle-aged and older adult drivers were mostly classified as conservative during both periods, whereas teens were mostly classified as aggressive. Younger adult drivers were mostly conservative and moderate during both periods. For teens in the experimental group and middle-aged and older adults, the percentage of aggressive drivers decreased slightly after ADAS intervention. In addition, there was a small increase in both conservative and moderate drivers for middle-aged adults, and an increase in moderate drivers for teens and older adults.
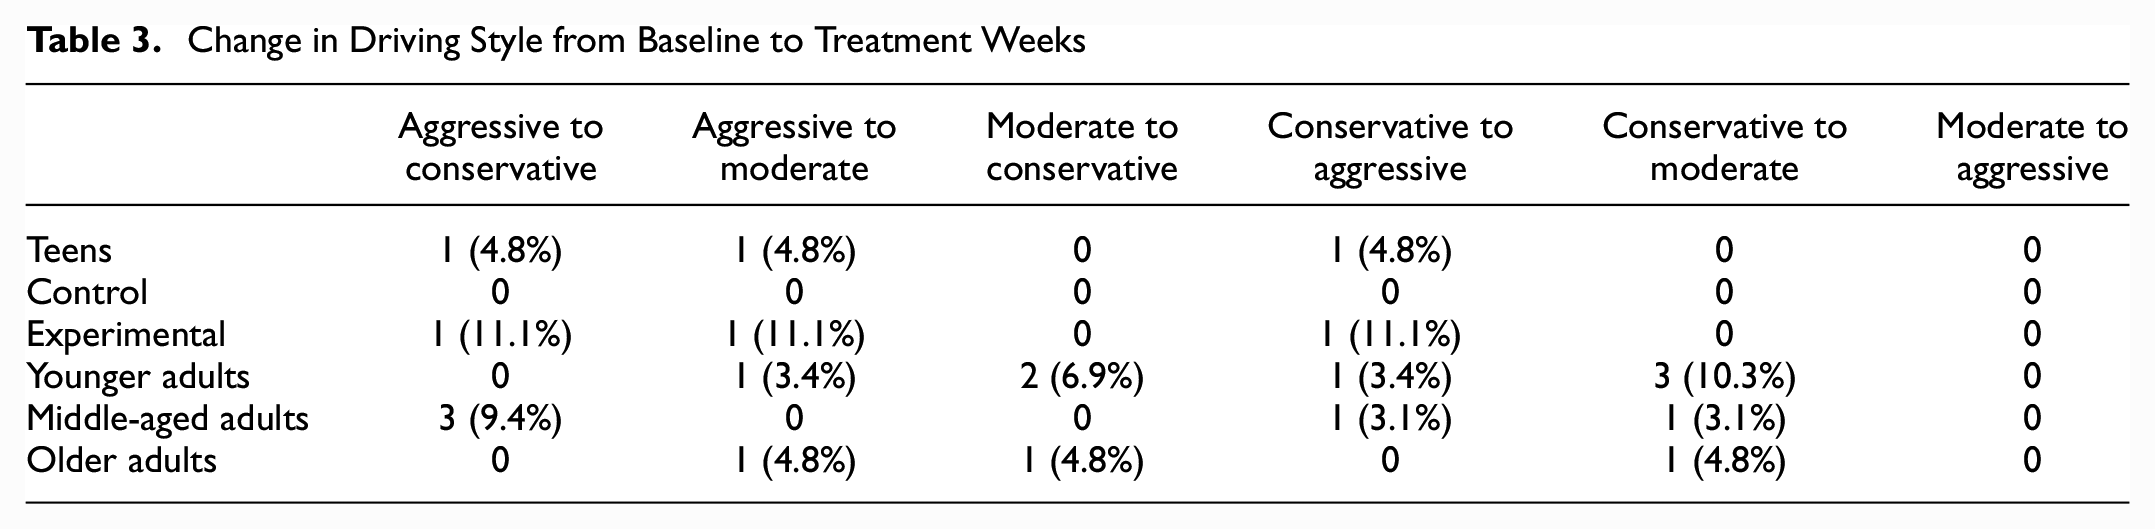
A total of 18 drivers changed their driving styles from baseline to treatment weeks (Table 3). Three and five drivers became aggressive and moderate, respectively, after being conservative, whereas four and three drivers became conservative and moderate, respectively, after being aggressive. The remaining three drivers became conservative after being moderate. In considering the detailed distribution, some important findings emerged. Results showed that 16.7% of the 18 drivers were from the teens in the experimental group, 38.9% were from the younger adult group, 27.8% were from the middle-aged adult group, and 16.7% were from the older adult group. Specifically, two teens, three younger adults, three middle-aged adults, and two older adults showed an improvement in their driving style after activation of ADAS, whereas one teen, four younger adults, two middle-aged adults, and one older adult showed a deterioration. With the exception of the majority of drivers who did not modify their driving behavior during the treatment weeks, no other discernible systematic changes in driving styles were observed.
Change in Driving Style from Baseline to Treatment Weeks
Treatment, Age Group, and Gender Effects on Driving Style
In conducting multinomial logistic regression analysis, the outcomes indicated that the effect of both age and gender achieved statistical significance at a 5% significance level, whereas the effect of ADAS was not statistically significant. Table 4 summarizes the results with teens in the experimental group as the reference category for age, males as the reference category for gender, and baseline weeks as the reference category for ADAS status. The significant main effect of age indicates that all adults showed markedly lower odds of being aggressive compared with teens. Specifically, younger, middle-aged, and older adults exhibited 88%, 94%, and 99% lower odds than teens of being aggressive, respectively. The significant effect of gender implies that compared with male drivers, females had 67% lower odds of being moderate rather than conservative.
Results of Multinomial Logistic Regression Model

Note: SE = standard error; ADAS = advanced driving assistance systems. *Significant results at 5% significance level.
Several other statistically significant findings emerged from pairwise comparisons among drivers with different age groups (at a 5% significance level). Younger adults displayed significantly higher odds of being aggressive rather than conservative compared with older adults. Additionally, the odds of being moderate, as opposed to conservative, were higher for younger adults, compared with both middle-aged and older adults.
Discussion and Conclusions
The objective of this study is to examine two key areas: (a) the variance in driving styles between drivers belonging to different age groups; and (b) the changes in driving styles between drivers of different ages and gender after the introduction of ADAS warnings. The K-means clustering algorithm was utilized to generate three distinct types of highway trips, which were then labeled based on specific metrics such as tailgating ratio, speeding ratio, and lane-changing frequency. Furthermore, the K-means outcomes were utilized to compute the aggressive-trip ratios (Aggressive1-trip ratio and Aggressive2-trip ratio) for each driver during the two driving periods: baseline; and treatment. The BGM was employed to determine threshold values for the aggressive-trip ratios and to classify drivers into three distinct groups: conservative; moderate; and aggressive. The difference in a driver’s aggressive-trip ratios between the baseline and treatment periods indicated changes in driving styles. However, based on the multinomial logistic regression model results, no significant impact of ADAS on driving style was observed.
Aggressive1 trips were characterized by higher tailgating ratios, whereas Aggressive2 trips were characterized by higher speeding and lane-changing frequency. During both baseline and treatment periods, more than half of the drivers were categorized as conservative, with the teens' group having the majority of its drivers classified as aggressive (85.7% during baseline weeks and 80.1% during treatment weeks). Similarly, the multinomial logistic regression model revealed that teens had a higher likelihood of being aggressive drivers compared with all adults' groups. This finding aligns with a conclusion drawn by the Centers for Disease Control and Prevention, which has classified teen drivers as among the most dangerous because of risky behavior such as speeding ( 29 ). The findings of the study further revealed that the control group of teens, who did not receive any ADAS warnings, demonstrated consistent driving styles between baseline and treatment weeks. This higher risk among teen drivers can be attributed to several factors, including speeding, distracted driving, inexperience, and intoxication (29–31). Furthermore, the results of the multinomial logistic regression model indicated that younger adult drivers were less likely to be classified as conservative and more as moderate when compared with middle-aged and older adult drivers. These findings align with a previous study conducted by the AAA Foundation for Traffic Safety ( 32 ), which ranked young adult drivers aged 19 to 24 as more aggressive than either drivers aged 25 to 39 or those aged 40 to 59 when engaging in risky driving behaviors such as speeding, tailgating, or running a red light.
In a survey study carried out by the AAA Foundation for Traffic Safety ( 33 ), male drivers demonstrated a greater tendency to engage in risky driving behaviors, such as tailgating, speeding, and merging dangerously, compared with their female counterparts. Another survey study ( 34 ) corroborated these findings, reporting that men had a higher propensity to respond aggressively to an aggressive driver, whereas women were more inclined to avoid such drivers. The results of our study also revealed gender differences in driving behavior, indicating that males were three times more likely to drive moderately rather than conservatively when compared with females. However, it is important to note that the observed gender differences in aggressive driving were not statistically significant in the comparison between aggressive and conservative driving, emphasizing the importance of interpreting gender differences in relation to aggressive driving behavior in context.
Our study findings revealed that most middle-aged and older adult drivers maintained a conservative driving style, regardless of the presence of warnings. These results are in accordance with previous research, which describes older drivers as more cautious and self-regulated, typically driving at relatively lower speeds ( 35 ) and changing lanes less frequently ( 35 , 36 ), compared with other age groups. Additionally, LeBlanc et al. ( 37 ) provided evidence supporting the notion that older drivers maintain a relatively safer distance when tailgating other vehicles compared with other age groups. Unlike concerns raised by Dotzauer et al. ( 38 ), our findings suggest that older drivers were not adversely affected by ADAS. It is worthy of note that the proportion of older adults who changed their driving behavior (14.3%) was the lowest among the different age groups, and their resistance to change may be analogous to the low susceptibility of adults to social influence compared with adolescents ( 39 , 40 ).
Unlike middle-aged and older adult drivers, teen drivers were found to maintain an aggressive driving style both in the presence and absence of ADAS. In this regard, it is possible that teens, who remained aggressive, experienced a change in the determinants of their driving style (Aggressive-trip ratios and Conservative-trip ratios), resulting in their re-classification as aggressive. This change, however, could reveal an increase in aggressive behavior. To this end, a study investigating teenagers’ perception of and receptiveness to ADAS ( 41 ) suggested that an increase in teens’ aggressive driving behavior might possibly be the result of overreliance on ADAS. This might be the reason we did not witness a significant improvement in teens’ aggressive driving style when ADAS was introduced.
A total of 18 drivers who received the ADAS treatment (19.8%) showed changes in their driving behavior after the system was activated. However, the impact of ADAS on driving style was not statistically significant based on the multinomial logistic regression model. The reason for this lack of significance is that warning-based ADAS are not designed to change driving behavior or style but rather to warn drivers of potential or imminent crash risks and enable them to avoid crashes. Similarly, the study by Akin and Noyan ( 42 ) analyzed real-world driving data to investigate the effect of ADAS on drivers' behavior. The study used data from 177 drivers with a total of 9,500 trips, of which 4,650 involved ADAS use. The ADAS analyzed in the study were two warning-based systems (i.e., FCW and LDW) and one control-based system, that is, adaptive cruise control (ACC). The study found that the use of FCW and LDW did not have a significant effect on drivers' behavior, whereas the use of ACC resulted in a significant increase in the following distance and a decrease in the variation of speed. Their study further concluded that the effect of ADAS on drivers' behavior varied depending on drivers' characteristics such as age and gender. Rauh and Ortner ( 43 ) also conducted a field study to investigate the impact of ADAS on experienced drivers’ behavior, and found they did not have a significant impact on this in relation to speed, headway distance, and lateral position.
In summary, this study employed a unique multi-step analysis and developed an algorithm to classify driving behaviors and styles across four different age groups, investigating the impact of ADAS use. The findings suggest the importance of improving ADAS designs by considering individual driving styles. Despite the significant contributions, this study has some areas for improvement. First, the analysis relied on numerical cutoffs without sufficient contextual information. Second, although demographic factors, such as age and gender, were considered, additional factors, such as personality traits and environmental conditions, can contribute to the impact of ADAS on driving style classification and, therefore, should be addressed in future studies.
Footnotes
Acknowledgements
The authors would like to acknowledge Mcity from the University of Michigan and State Farm® for sponsoring and supporting this project.
Author Contributions
The authors confirm the contribution to the paper as follows: study conception and design: D. Ammar, M. Li, B. Yu, E. Pulver, S. Bao; data collection: D. Ammar, M. Li; analysis and interpretation of results: D. Ammar, M. Li, H. Guo, E. Pulver, S. Bao; draft manuscript preparation: D. Ammar, M. Li, H. Guo, B. Lin, A. Kusari, E. Pulver, S. Bao. All authors reviewed the results and approved the final version of the manuscript.
Declaration of Conflicting Interests
The author(s) declared the following potential conflicts of interest with respect to the research, authorship, and/or publication of this article: Elizabeth Pulver is an employee of the State Farm Technology Research and Innovation Laboratory. State Farm is a sponsor of Mcity and this research.
Funding
The author(s) disclosed receipt of the following financial support for the research, authorship, and/or publication of this article: This project was sponsored by Mcity from the University of Michigan and State Farm®.