
Abstract
Crowd analysis and management is a key area of study for transit agencies seeking to optimize their operations and to facilitate safety risk management activities. Key features of crowd analytics include passenger flow volume, crowd density, and walking speed. This study proposes a generalized artificial intelligence (AI)-based crowd analytics model framework for rail transit stations, by analyzing and visualizing crowd analysis data from video records of high-density crowds. Specifically, we propose a generalized AI-aided methodological framework (AI-Crowd) for calculating flow volume, crowd density, and walking speed. You Only Look Once (YOLO) and Deep SORT are integrated into the model framework to detect and track each individual’s dynamic position. Camera calibration is utilized to transform detected trajectories into a real-world coordinate system. Methods for calculating crowd dynamic metrics are formulated based on the data. To validate the model framework, several video records from a platform scenario at a major rail transit station are used. The model’s pedestrian counting accuracy can reach 95% and the fundamental diagrams of density–speed are shown to be consistent with empirical studies. Further crowd analysis of a stair scenario and a transferring passage scenario using the proposed model framework shows some differentiations in walking behavior. The methodology has further practical applications, such as monitoring social distancing.
Understanding crowd dynamics is important for transit providers ( 1 ). Flow volume in stations can be correlated to system capacity, which is an essential metric for helping transit agencies evaluate the quality of service and make critical scheduling decisions ( 2 ). Crowd density is another essential metric for evaluating transit service and safety ( 3 ), and allows transit agencies to monitor the safety of their passengers ( 4 ). Individual movement trajectories are important for analyzing passenger behaviors, and provide insights into facility design and layout, which might help to improve customer experience ( 5 ).
Various approaches and solutions have been used to acquire critical crowd data. Many passenger counting technologies have been developed to obtain flow volume. According to a survey of over 50 city metro authorities, commuter railroads, and surface transport providers around the world ( 1 ), manual methods (e.g., staff counting, manual estimation based on train arrivals/departures) still dominate the practice of passenger counting. This traditional method is rated most useful for disaggregating data on an individual level ( 6 ). However, the tasks of acquiring and analyzing this data are labor intensive and time consuming. Automatic fare collection devices (AFCs) ( 7 ) have been widely used in some countries (e.g., China). Nevertheless, card penetration is crucial to obtain accurate ridership. Automatic passenger counting is another popular system for passenger counting, which includes infrared sensors, treadle mats, and so forth ( 7 ). However, most of these methods are only suitable for slow passenger flows or low-density crowds. To determine crowd density, commonly used manual methods include field surveys which entail counting the number of people in a specific area ( 4 ), and manually counting people in the area under observation based on closed-circuit television (CCTV) records ( 8 ). To analyze elements of passenger movement, such as walking speed, the most commonly used manual methods include field surveys with stopwatches and manually reviewing walking length and duration from video records ( 5 ). These methods are also labor intensive and time consuming.
Computer vision-based techniques are the most promising methods to overcome such drawbacks with low cost and high efficiency. These methods are receiving increased attention from academia and industry for their crowd analytics, which can automatically detect and track people from video records ( 8 – 10 ). However, existing studies have mainly focused on counting passengers from a static image to estimate crowd density ( 11 , 12 ), which cannot determine dynamic information on walking passengers. Especially for high crowd density scenarios with occlusion, which is the typical scenario in rail transit stations, regression-based methods with image features are used to estimate crowd volume, although these methods cannot process each individual.
In this study, a head detection and tracking model framework is used to obtain individual trajectories from high-density crowds, and a camera calibration method is integrated to obtain real trajectory data for analyzing crowd dynamics. The remainder of this paper is organized as follows. The literature review offers a comprehensive summary of existing research focused on pedestrian counting and crowd density calculation using computer vision techniques. The methodology section specifies the method framework proposed in this study. The model implementation section implements the model and validates it using video data from a major rail transit station. The applications and discussion section discusses applications of the proposed model framework for crowd analysis and social distancing monitoring. Finally, the conclusion summarizes the paper’s findings and proposes future improvements.
Literature Review
Flow volume, crowd density, and walking speed are the basic metrics for crowd analysis, and their relationships are defined as fundamental diagrams. These are used to estimate the capacity and level of service of various facilities in transit stations. With improved artificial intelligence techniques, these metrics can be acquired using various methods, including computer vision.
Computer vision-based methods are categorized into regression-based methods and detection-based methods ( 8 – 10 ). Regression-based methods are proposed to estimate the number of people in extremely dense crowds in static images ( 10 ), which formulate the relationship between the image features (e.g., blob area) of people and crowd density using regression models. Therefore, this method is mainly used to estimate global crowd density in an image, but because this method cannot be used to segment each individual, it cannot calculate dynamic passenger flow and walking speed. These methods identify low-level features (e.g., blob area, perimeter–area ratio) ( 13 ) and texture features (e.g., contrast, homogeneity, entropy) ( 14 ), which are also commonly used in detection-based methods.
Detection-based methods count the number of people by detecting each person in an image and calculate crowd density using the number of people counted within the region ( 11 ). Monolithic detection is another commonly used technique, which identifies the crowd based on features extracted from a whole body ( 8 , 10 ). For example, binary classifier feature extraction methods for scanning a window detector show a detection rate of about 93% in typical surveillance scenarios ( 15 ). However, occlusion in high-density crowds adversely affects the performance of whole-body detection models. Head-like detection methods were proposed to tackle this challenge. Haar wavelet transform for feature extraction of the head-like contour ( 16 ), omega shape (Ω) feature for the head-shoulder part ( 17 ), and three-dimensional shape model using three ellipsoids ( 18 ) are robust to partial occlusions and atypical part appearances.
Convolutional neural network (CNN) is a state-of-the-art computer vision method that has superior capabilities for learning non-linear functions from input data ( 19 ). Therefore, CNN has been used to formulate many CNN regression-based models for estimating numbers of people from images by determining the relationship between image features and the number of people in the image ( 20 ). To determine the crowd number in a high crowd density image with varied head sizes, CNN-based models with multi-column architecture have been proposed to extract multi-scale features ( 21 ), which improves the robustness of scale awareness ( 22 ). However, multi-column architecture is bloated, and single-column architecture was proposed to make models simpler and more efficient ( 23 , 24 ). Furthermore, auxiliary-task models have been proposed, which can conduct one or more tasks related to crowd counting ( 22 , 24 , 25 ). Therefore, special event detection, crowd density classification, crowd speed map prediction, and so forth, can be performed alongside crowd counting ( 22 ). These studies provide some inspiration for the present study.
Additionally, studies have used CNNs for feature extraction ( 26 ) and demonstrated CNNs’ suitability for pedestrian detection, and have thus provided a powerful method for detection-based counting models. R-CNN, which stands for region-based CNN, is one of these feature-based CNNs with superior performance ( 27 ) that extracts many region proposals from an input image and computes features for each proposal using CNN. Objects are detected by classifying each region by features. Following R-CNN, Fast-RCNN ( 28 ) and Faster-RCNN ( 29 ) were developed to improve the computational efficiency and model performance. You Only Look Once (YOLO) is a recent development in CNN detectors that isolates objects using CNN in a single analysis of an image. This methodology has greatly improved computational efficiency and achieved high detection accuracy ( 30 , 31 ). Although the detection accuracy of YOLO is lower than that of Faster-RCNN, its superior computational efficiency makes YOLO a promising solution for practical applications.
Most previous studies, as stated above, have focused on pedestrian detection in an image, static counting, and density estimation, but have not implemented dynamic analysis which requires individual trajectories. Some studies have aimed to tackle this challenge by tracking individual trajectory, such as the Kanade-Lucas-Tomasi (KLT) tracker, which is a commonly used tracking methodology ( 32 , 33 ). As an optical flow-based method, KLT tracks people using displacements of the dominant points and acquires people’s walking trajectories. A “virtual gate” is defined to count people with trajectories ( 32 ), and the trajectories can also be employed to calculate walking speed ( 34 , 35 ). However, these methods are susceptible to occlusion or illumination changes. Recently, a simple online real-time tracking method with a deep association metric (or Deep SORT) ( 36 ) was developed. In Deep SORT, persons are detected in each frame, and the detections are matched based on feature similarity to acquire their tracks. Deep SORT solves occlusion tracking problems effectively and is more suitable for high-density tracking, such as in the context of a rail transit station.
Altogether, there are two gaps in existing studies on computer vision-based crowd analytics, which limit academic research and practical applications of computer vision techniques: (i) few studies focus on individual dynamic trajectory extraction from high-density crowd videos, and (ii) existing studies ignore the calculation of basic metrics for crowd analysis from on-site detection data.
Methodology
We develop a comprehensive model framework with the following three layers to implement crowd dynamic analysis with computer vision techniques, as shown in Figure 1: (i) head tracking for individual trajectory extraction, (ii) camera calibration for undistorting and scale converting, and (iii) crowd analysis with proposed calculation methods.
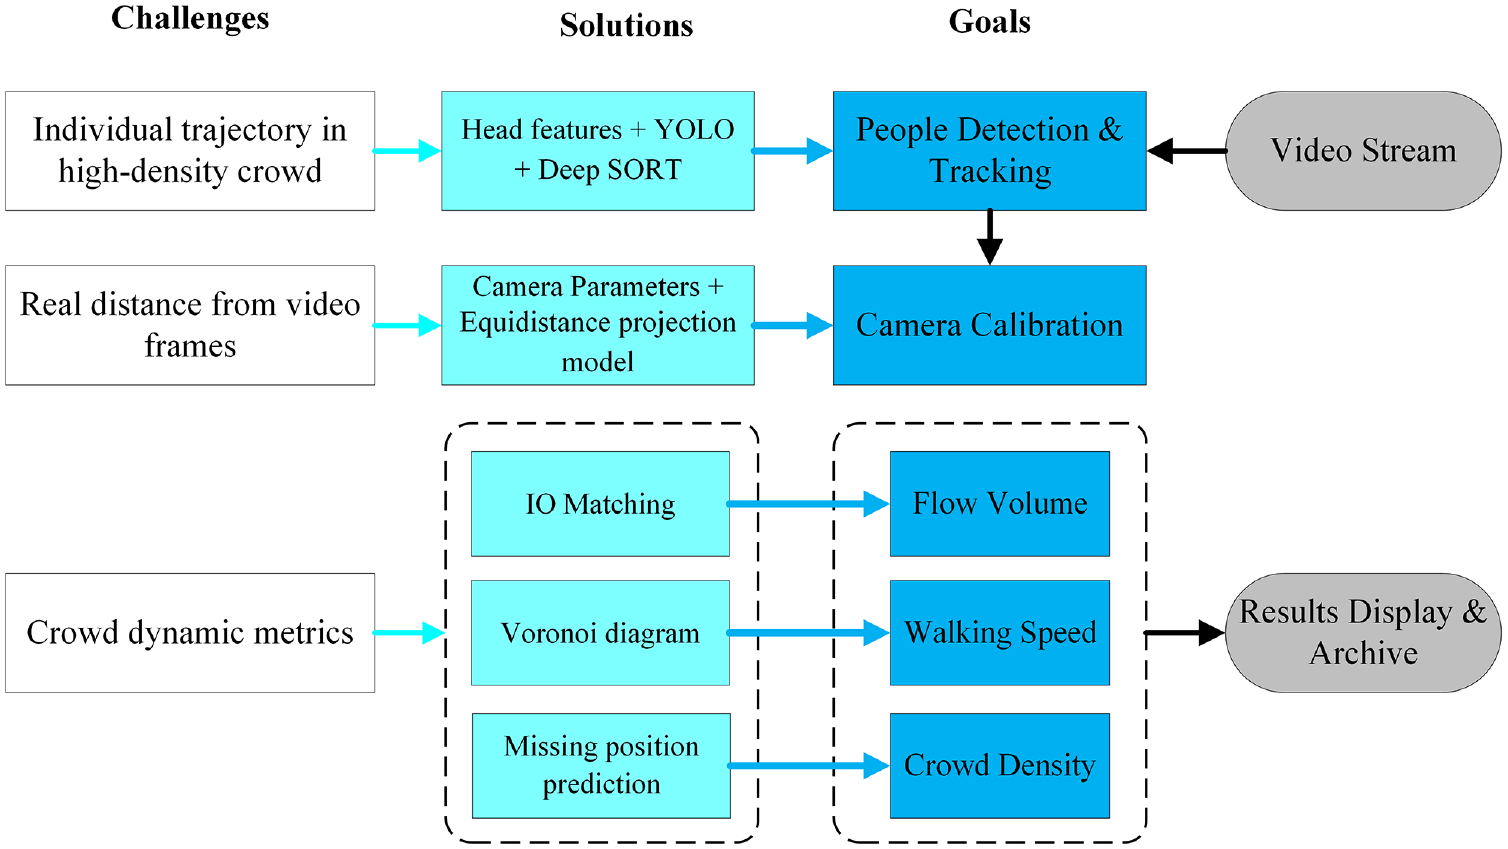
Research architecture.
We propose a detection and tracking model framework to acquire individual trajectories. Head features are employed to adapt to high-density crowd scenarios. Camera calibration rectifies barrel distortion of video frames caused by fisheye lenses and converts the image scale to real-world scale. We propose a trajectory-based people counting method, an individual-based crowd density calculation method, and a walking speed calculation method to obtain basic crowd metrics. These results can be displayed or archived for specific application or further analysis.
People Detection and Tracking
A generalized head detection and tracking framework that integrates techniques of YOLO and Deep SORT (Simple Online and Realtime Tracking with a Deep Association Metric) is proposed to obtain individual trajectories from a high-density crowd, as shown in Figure 2.
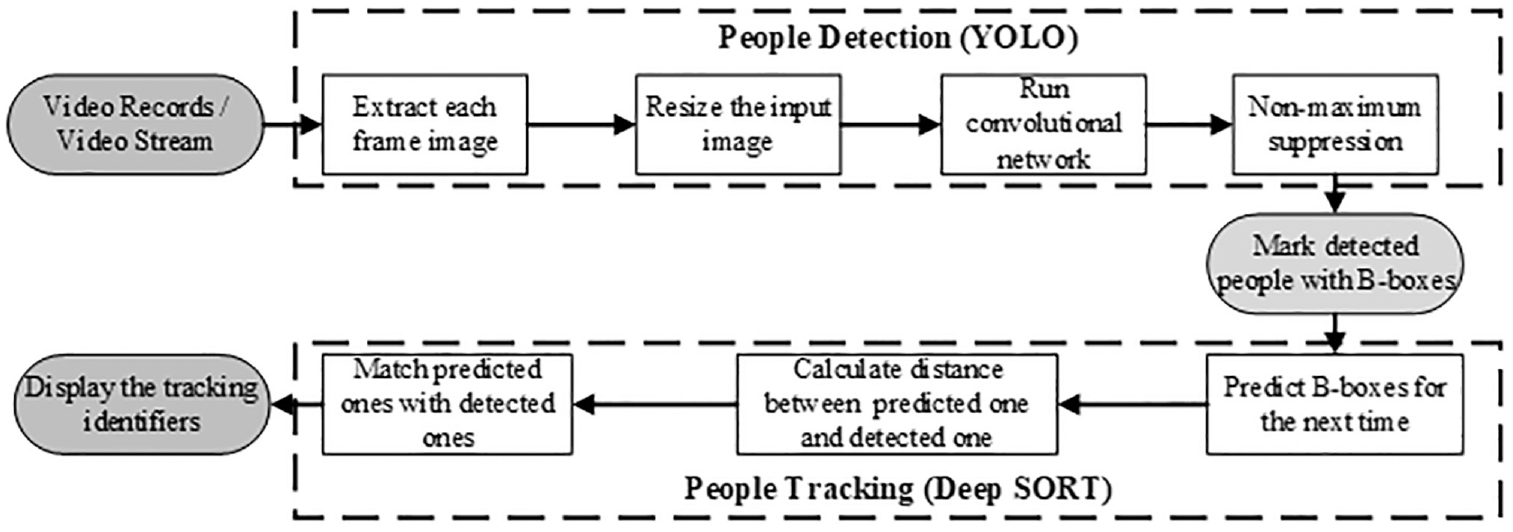
People detection and tracking framework.
Video feeds are input into YOLO and each image frame is extracted to detect all the identifiable people within it. YOLO resizes the image into a square (e.g., 448 × 448) and divides the resized image into multiple grid cells (e.g., 7 × 7). Bounding boxes are predicted for each cell based on a CNN, and a non-maximum suppression algorithm is used to select the best bounding boxes for detecting results, as shown in Figure 3. To detect each individual in a crowd, the head is used as an identifying feature. More details can be found in the work of Redmon et al. ( 31 ).
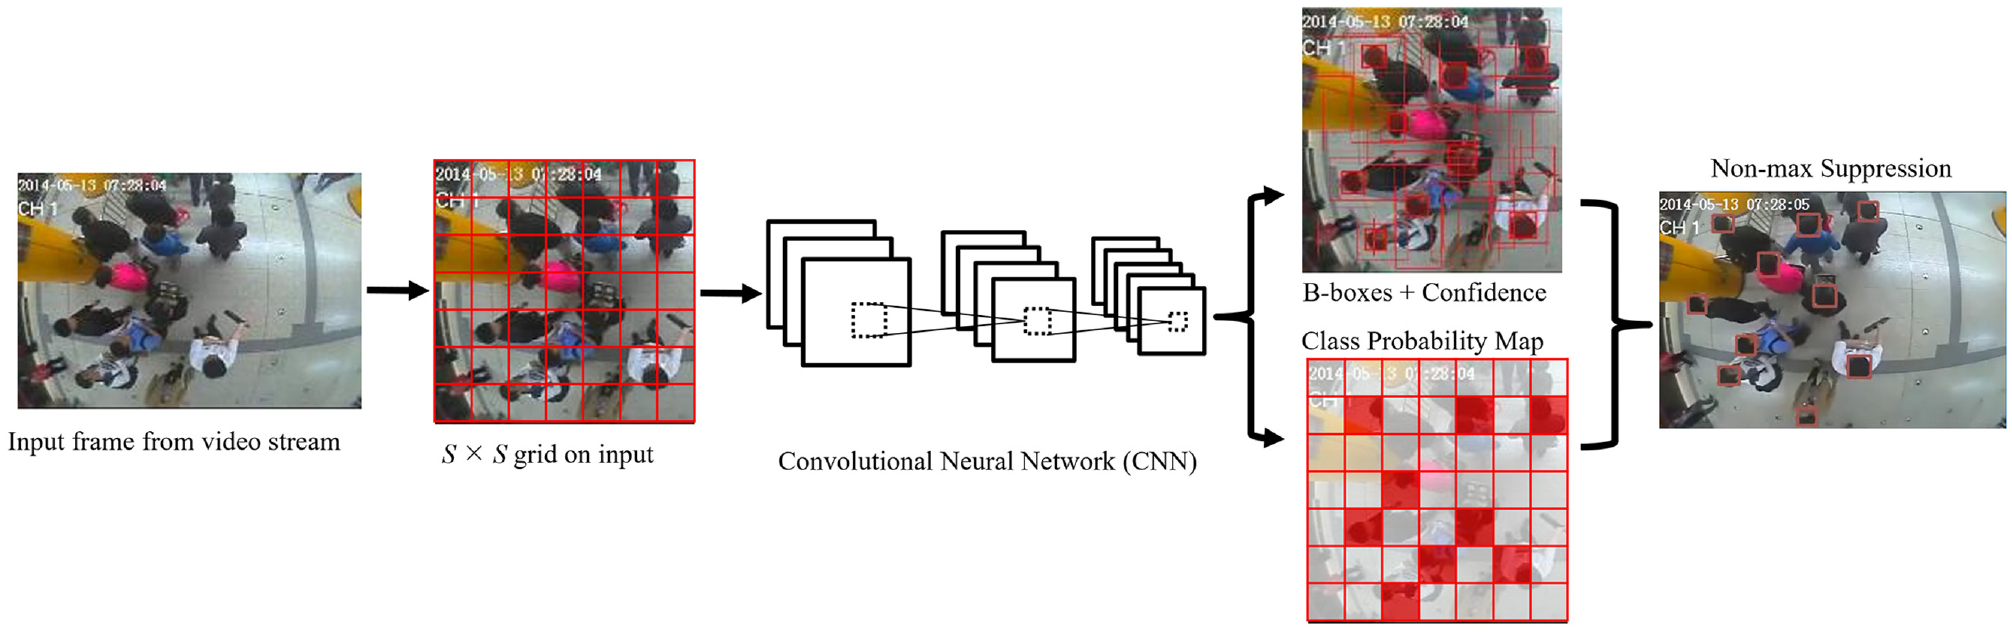
People detection architecture.
The detected bounding boxes, corresponding confidence scores, and features are input into the Deep SORT module. A Kalman filter, which is an excellent estimator of unknown variables based on observations over time, is employed to predict positions of the detected bounding boxes for the next time step, when new detections are input. A predicted position and a new detection are matched by using the matching cascade algorithm with similarity of motion information (e.g., the position of bounding boxes) and similarity of appearance features. This method integrates multiple similarities and helps improve robustness against missed tracking caused by partial occlusion. More details can be found in the work of Wojke et al. ( 36 ).
Camera Calibration
Crowd metrics calculation requires accurate trajectories in a real-world coordinate system. We locate each point in a camera image by pixel, which is the basic unit of image coordinate systems. Moreover, wide-angle cameras (e.g., fisheye lens cameras), which are widely used in urban rail transit stations, distort image lines to capture more space. Therefore, we need to remap the points from the image coordinate system into the real-world coordinate system to rectify the distorted images and obtain accurate trajectories via camera calibration.
Extrinsic parameters of a camera are used to transform a point in the real-world coordinate system into the camera coordinate system. Meanwhile, intrinsic parameters of a camera were used to transform a point in the camera coordinate system into the pixel coordinate system. For a wide-angle camera, the position of a point will be distorted when it is projected onto the image plane, and this distortion can be modeled using distortion parameters ( 37 ).
With the intrinsic parameters and distortion parameters, we can undistort video image frames and project points from image coordinates to camera coordinates. When an individual moves a distance of dc, as shown in Figure 4, the displacement on the undistorted video image frames will be d. With the focal length from intrinsic parameter f, we can determine the angle α using the first formula in Equation 1. From the extrinsic parameter, we obtain the camera installation height H; with the body height h of a human being and the angle θ of the camera’s visual axis, we can deduce the moving distance dc with the Law of Sines, as shown in Equation 1. We use this distance to position the real-world coordinates of each person. Using these equations, moving distance can be calculated with camera parameters.
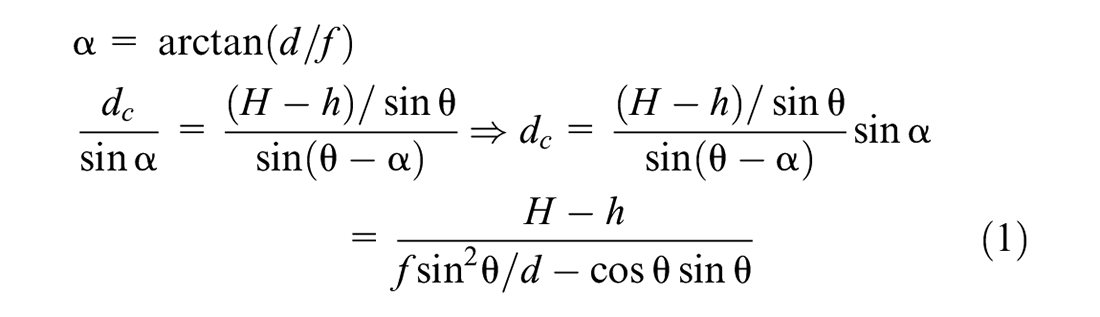
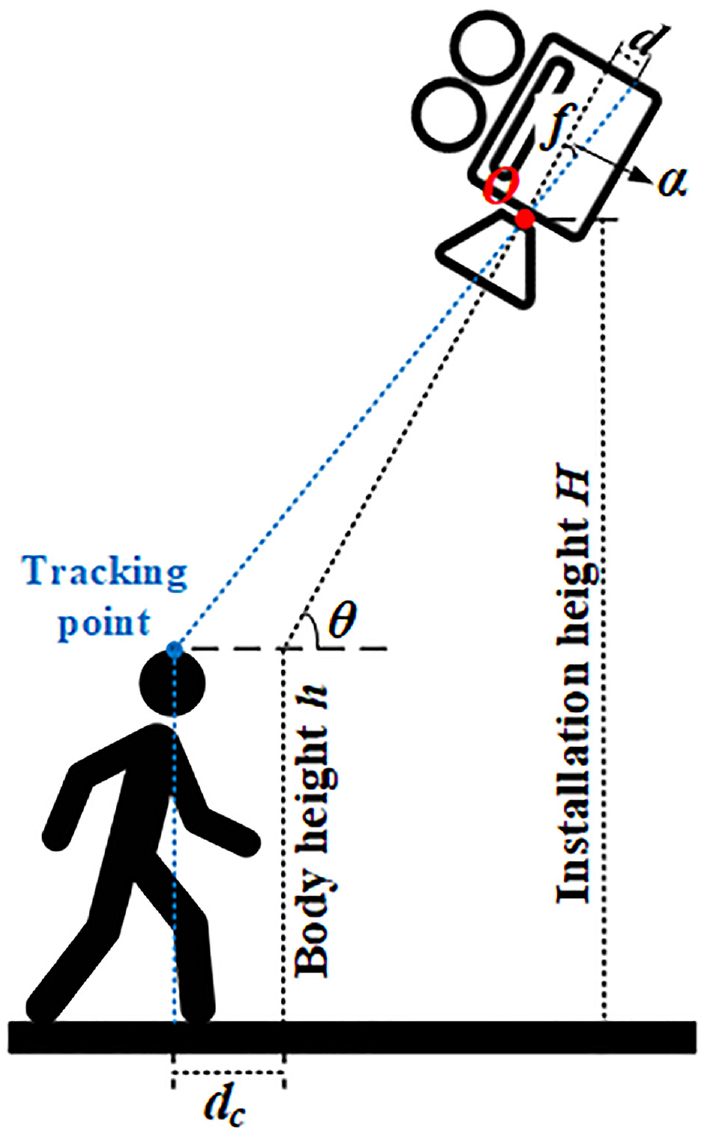
Illustration of video calibration.
Crowd Dynamic Metrics Calculation
Flow Volume
We designated a rectangular “virtual door” (VD) as a region of interest for counting flow volume. We also defined two walking directions for flow counting (i.e., enter in and step out), and an “In/Out” (IO) matching method to count people walking through the VD.
We established two real-time attributes for each tracked pedestrian: walking direction and IO status. Individual walking direction D is updated over time based on the average direction, which is itself based on the lastest n trajectory points when the trajectory point amount is larger than the threshold min_last. This study sets the threshold at five, but it can be set to any suitable value based on test results. The benefits of this process are twofold: first, it mitigates the counting disturbance of some misidentified individuals; second, it avoids misjudging walking direction by using limited trajectory points.
IO status is updated based on the IO matching method, as shown in Figure 5. At time t, the position of people i (xit, yit) can be obtained via the tracking algorithm, and the trajectory vector Trjit (Δxit, Δyit) can be calculated using the position of people i at time t-1. When the trajectory point amount is larger than the threshold min_last, the walking direction Dit will be calculated. If the trajectory vector does not intersect with any edges of the VD, the IO status of people i will be set as “tentative” for further analysis. If the trajectory intersects with one edge of VD, then we can identify whether people i are walking in or walking out of the VD region using their walking direction, and the IO status of people i will be set as In (I) / Out (O) status. For the people i whose IO status is O, if their previous status was I, we will set the IO status of people i as “matched”; if there is no previous status for people i, we will calculate the similarity of walking speed between people i and the people with tentative status as the matching index Sw, and the people whose matching index is larger than a predefined threshold SThres is set as the matched one of people i, and their IO statuses are all set as matched. If the trajectory of people i intersects two edges of the VD at time t, the IO status of people i will be set as matched directly. The people with matched IO status will be counted in the flow volume of the corresponding walking direction.
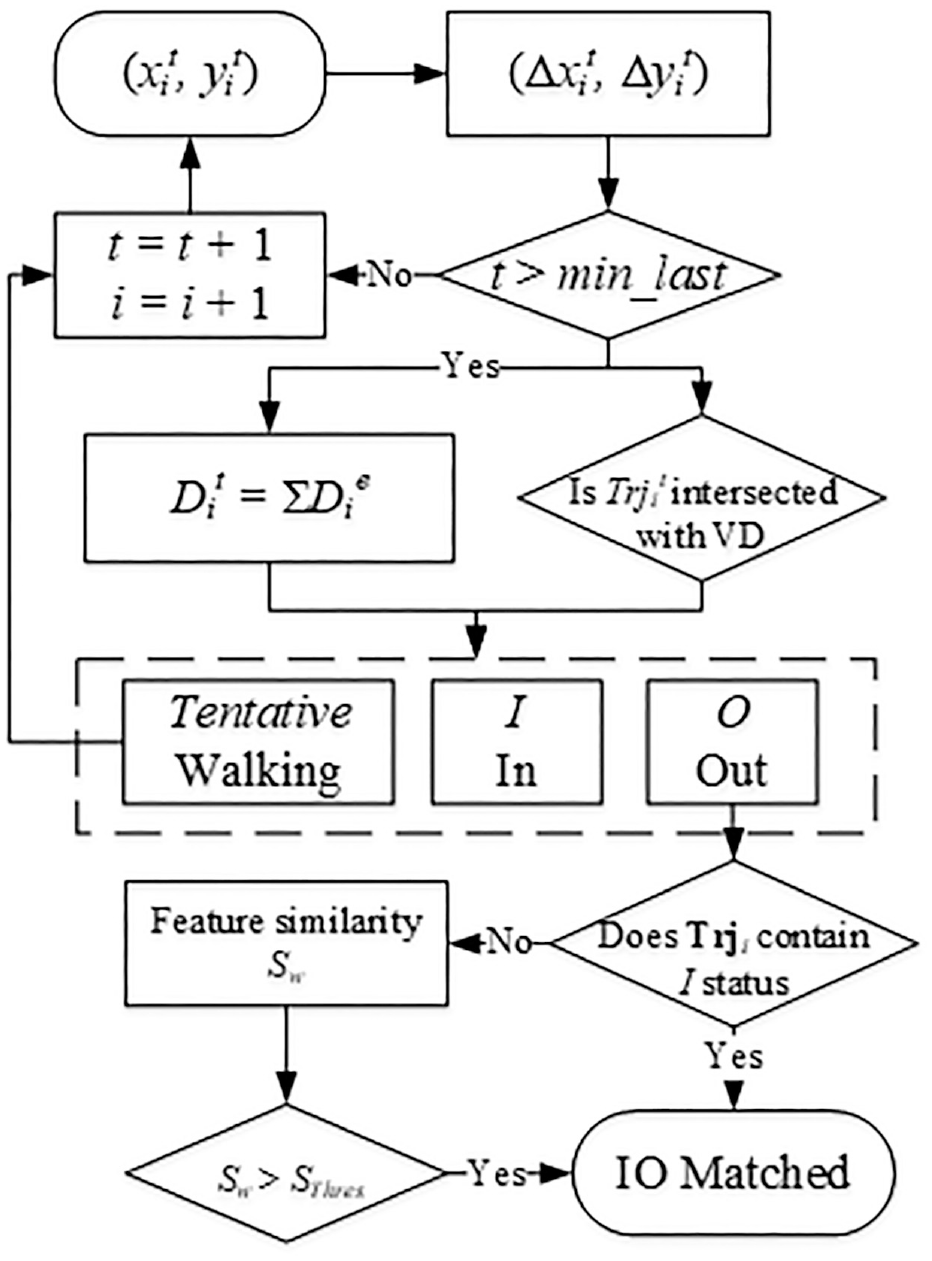
Architecture of “In/Out” (IO) matching method.
The IO matching method can efficiently tackle tracking identification changing problems and significantly improve counting accuracy.
Crowd Density
In a high-density crowd, people can only perceive the crowd density around themselves. To reflect this heterogeneity, we use the Voronoi diagram to formulate an individual-based crowd density calculation method.
The Voronoi diagram ( 38 ) is a plane partition method that divides a plane into regions based on a given set of points in the plane. First, we formulate a triangulated irregular network that meets the Delaunay criterion using points in the plane ( 38 ), so that no vertex lies within the interior of any of the circumcircles of the triangles. Then, the perpendicular bisectors for each triangle edge are generated to form the edges of the Voronoi cells. The occupancy area Ai for a point i is the region containing the point. Consequently, we calculate the individual-based crowd density Di using Equation 2.

However, some people in the image frames may not be detected because of occlusion or view angle, and we cannot determine their positions in some frames. Failing to detect these occluded individuals will negatively affect the accuracy of the calculated crowd density. To overcome this challenge, we propose a position prediction method to obtain coordinates for “missing” people.
We regard the unmatched tracking identifiers at frame t as the “missing” identifiers. We assume that they will maintain their walking speed vt (vxt, vyt) at frame t. Their position (x, y) at frame t+n is predicted by Equation 3.

where (xt, yt) is the position of the “missing” people at frame t and Δt is the time interval of one frame, while other variables remain the same as described above.
Considering that the prediction error increases over time, a maximum effective time threshold is predefined. If the update time of an unmatched tracking identifier is larger than the threshold, the identifier will be removed from the prediction process and will be considered as lost. In this study, we set the value of the threshold max_age in the tracking model as the maximum effective time threshold.
Walking Speed
Walking speed is an essential indicator for flow volume counting and crowd density calculation, as well as a crucial metric for crowd analytics. For each tracked person, we record their coordinates in real time. Therefore, we can calculate their instantaneous walking speed vt (vxt, vyt) at frame t by Equation 4.

where (xt−1, yt−1) and (xt, yt) are the positions of the tracked people at frames t−1 and t, respectively, and Δt is the time interval of one frame.
As stated in the crowd density calculation section, we will maintain walking speed vt (vxt, vyt) for “missing” people. Walking speed will be recorded until the “missing” time reaches a maximum effective time threshold max_age.
Model Implementation
Data Description
To validate the model framework proposed in this study, we analyzed video data from a major rail transit station. The validation video is captured from a top-view fisheye lens camera, and it records passengers walking on a platform heading toward a staircase, as shown in Figure 6. It shows the walking behavior of passengers in front of the entrance to the staircase. The video frame width and height was 352 × 240 pixels, and their frame rate is 30 frames per second. In this study, we selected two clips (each is about 30 min long) from this video record: one clip is used to train the model, and the other is used to test the model.
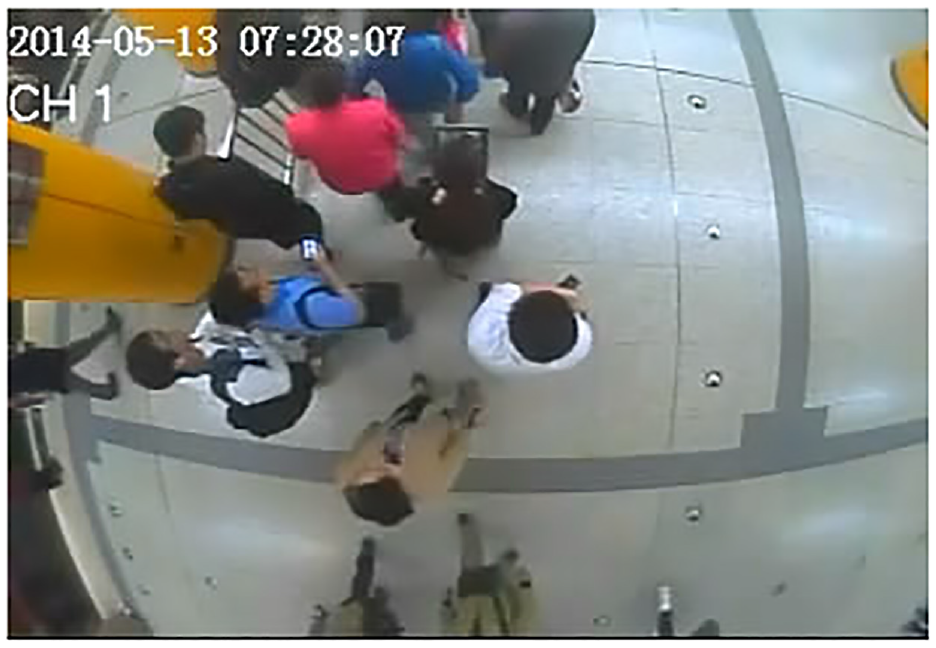
Surveillance video record of passengers walking on platform in a subway station.
Model Training
To develop a high-performance model for detection and tracking, we need to train the detection and tracking model to obtain weights files and optimized parameters. We extracted 500 frame images from each training video and labeled the heads of all identifiable people in the images with rectangular boxes, as shown in Figure 7. The coordinates and classification (i.e., head class) of label boxes in an image are recorded in an annotation file.
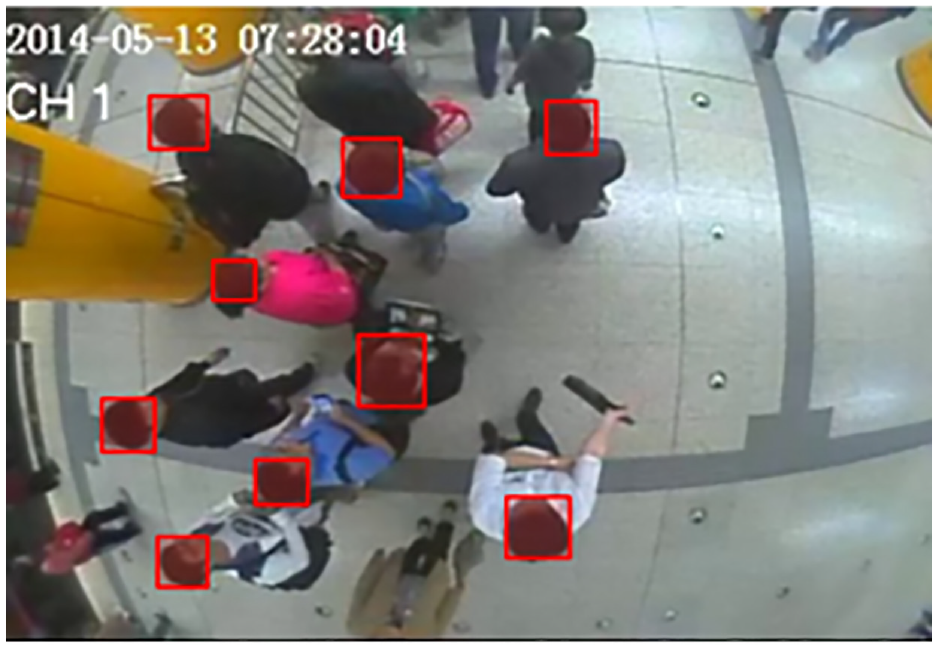
Extracted images from top-view videos.
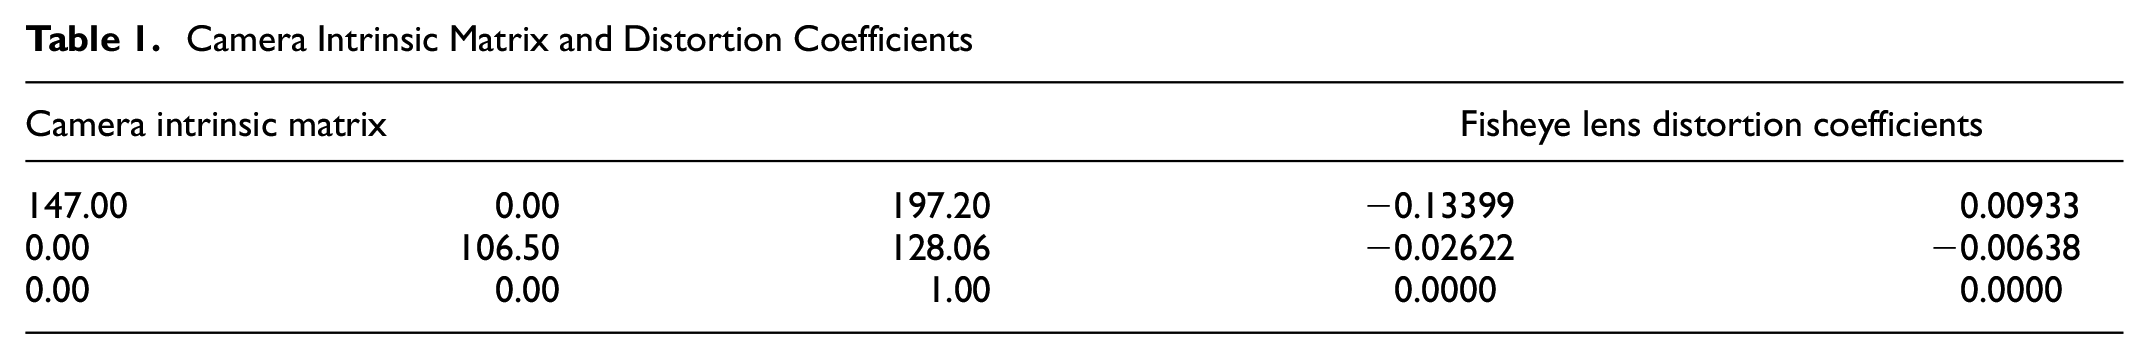
These data are split into a training set, validation set, and test set. First, we use these datasets to fine-tune the hyper-parameters of the optimizer. Then, we train the model with those hyper-parameters to acquire the best model weights file. Meanwhile, we extract camera parameters from video records. We use the ground floor with its checkerboard plane to calibrate camera parameters. To further reduce the labor required, we employ the checkerboard floor tiles shown in the videos for camera calibration. We extract several images with floor tiles and draw grid cells covering the floor tiles exactly, as shown in Figure 8a; the floor tiles are squares with 0.65 m edges. The checkerboard images and the edge length are input into the camera calibration tool; camera parameters and the undistorted images are output as shown in Table 1 and Figure 8b.
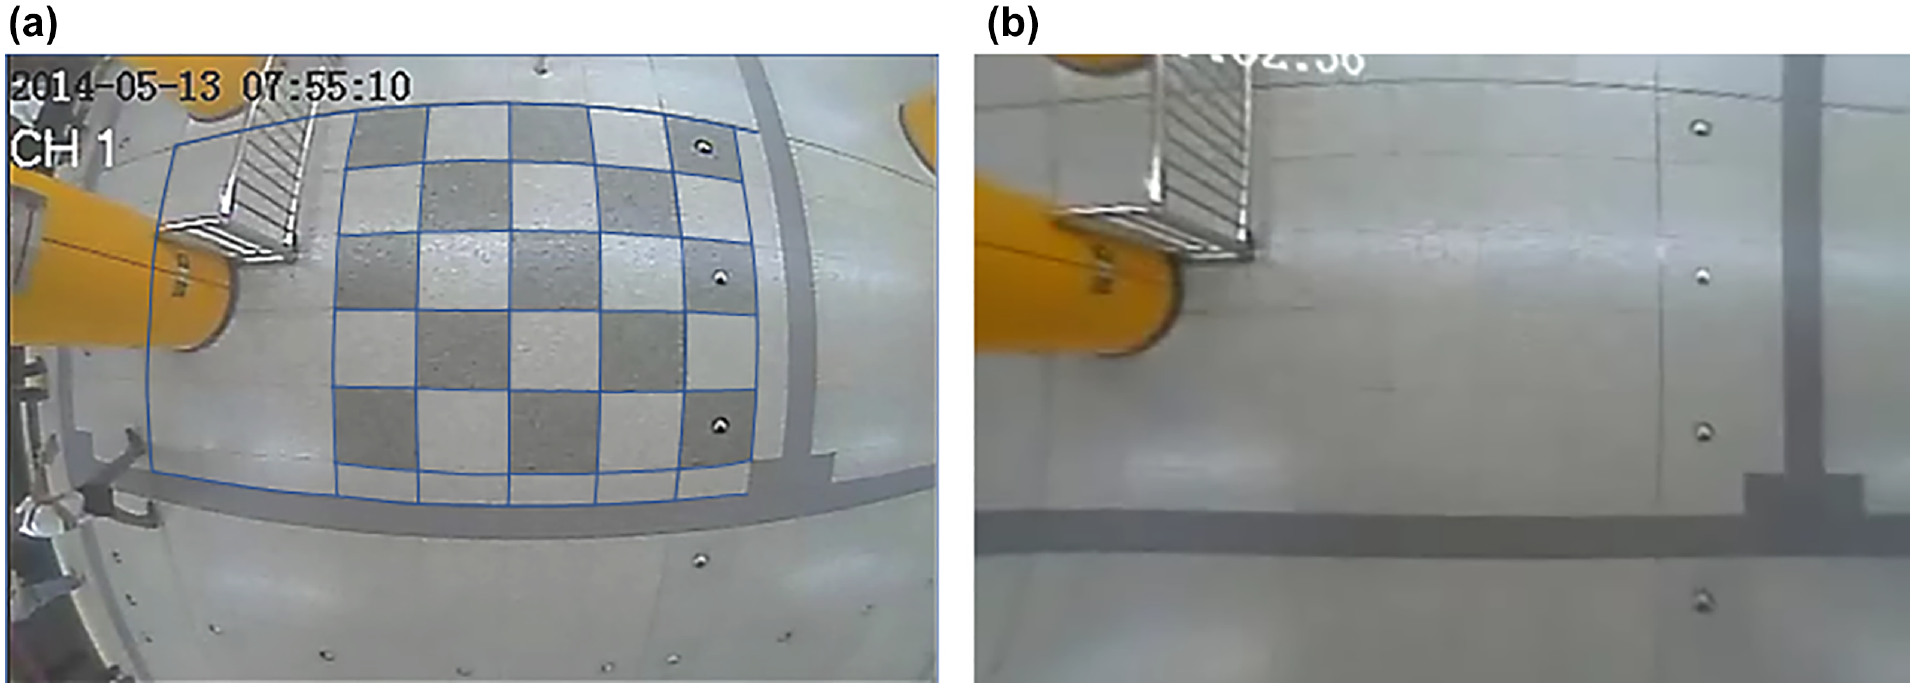
Camera calibration: (a) checkerboard with floor tiles, (b) undistorted image frame.
Camera Intrinsic Matrix and Distortion Coefficients
Model Validation
We configured the model framework with a trained model weight file and optimized parameters. A VD was set up in the middle of the frames with a width of 20 pixels. The test video record was input into the model framework. We selected a clip recording passengers’ walking behaviors over a timespan of 250 s to validate the model results, which covers the headway of a train. Utilizing the CV-based flow volume counting method, we obtained the flow volume for every 5 s interval, as shown in Figure 9. The ground truth of the flow volume for every 5 s interval was counted manually and the error between ground truth and model results was calculated, as shown in Figure 9. The total number of passengers from ground truth was 200, while the total number counted by the proposed method was 190. Therefore, the counting accuracy of the proposed CV-based people counting method is 95%. We analyzed the negative error and found that errors were mainly caused by long time occlusion in high-density crowds.
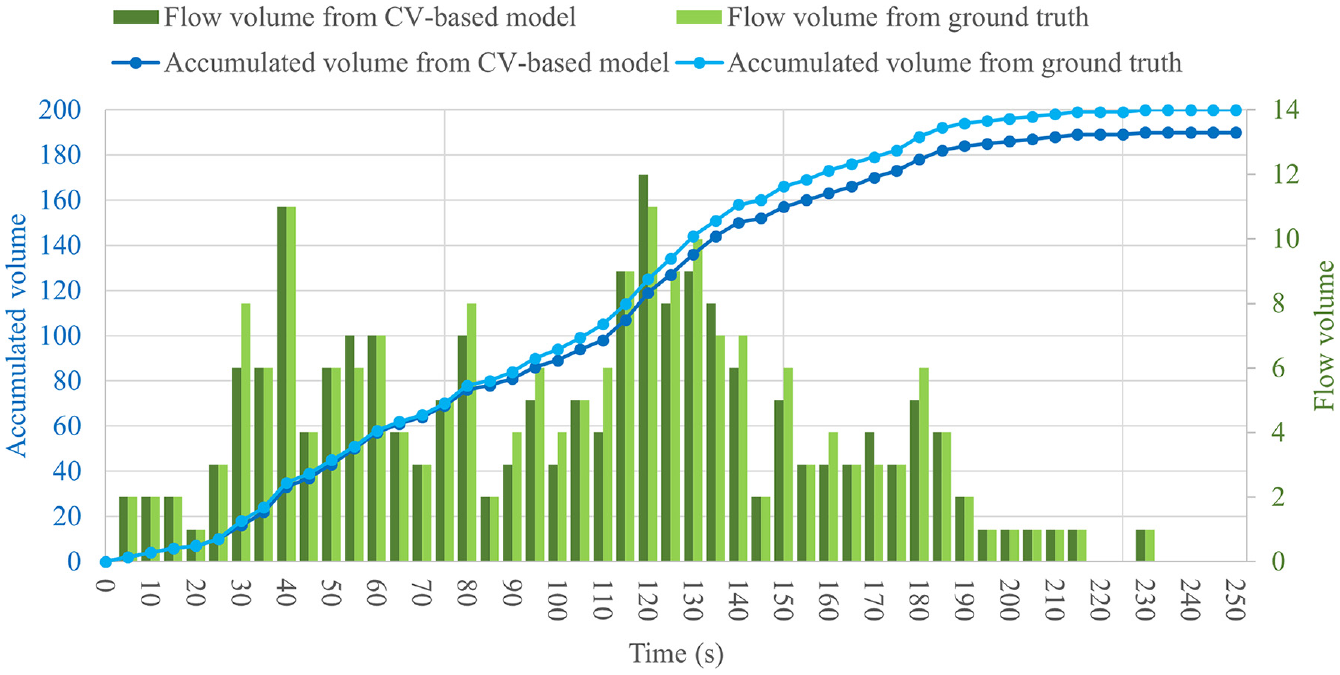
Validation results for people counting by the proposed model framework.
We recorded individual-based crowd density and walking speed for each frame and validated the results using the fundamental diagram of density–speed. We reorganized the data by averaging walking speed with a crowd density interval of 0.01 people/m2 to reduce the data amount and noise data. The CV-based model results are shown in Figure 10 along with the benchmark survey results of Older ( 39 ) and Mōri and Tsukaguchi ( 40 ). The figure shows that the relationship between crowd density and walking speed from the CV-based model results is consistent with benchmark datasets. When crowd density is less than three people/m2, the model result is consistent with Older’s survey result, and when crowd density is larger than three people/m2, the model result is consistent with Mōri and Tsukaguchi’s survey result. As benchmark datasets, those scenarios are different from the studied scenario, so they only share the same values for some sections. In any case, this result validates that our model performs well at calculating crowd density and walking speed.
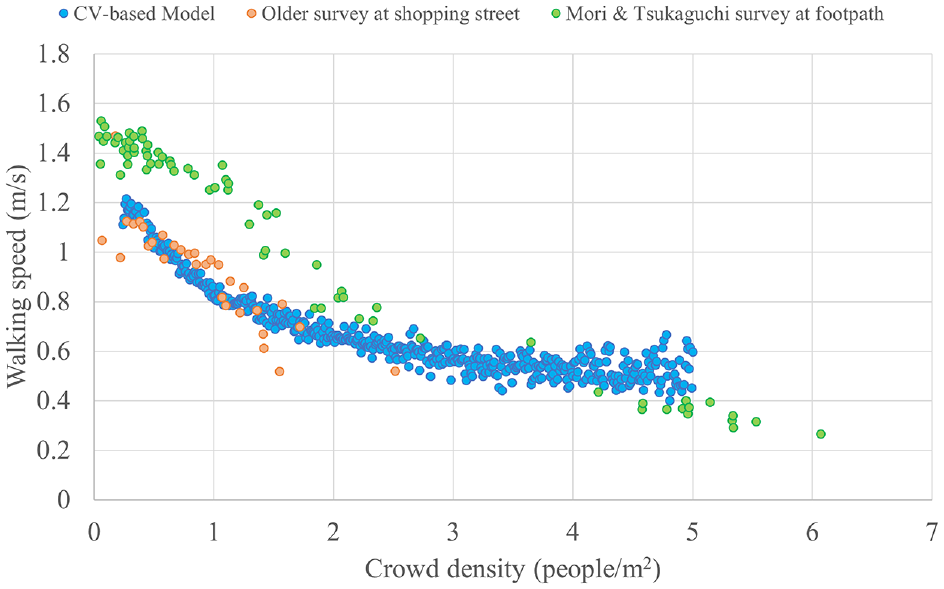
Fundamental diagram of platform walking scenario.
Applications and Discussion
Crowd Analysis
Videos from other scenarios in rail transit stations are analyzed with the proposed model framework. From those videos, we obtain the fundamental diagrams for a crowd walking on stairs and a crowd transferring through a passage, as shown in Figure 11. For the stair scenario, we only analyze the people walking on the stairs, and most of them are walking upstairs. For the transferring passage scenario, people walk through a passage without a slope and in a free-flow status.
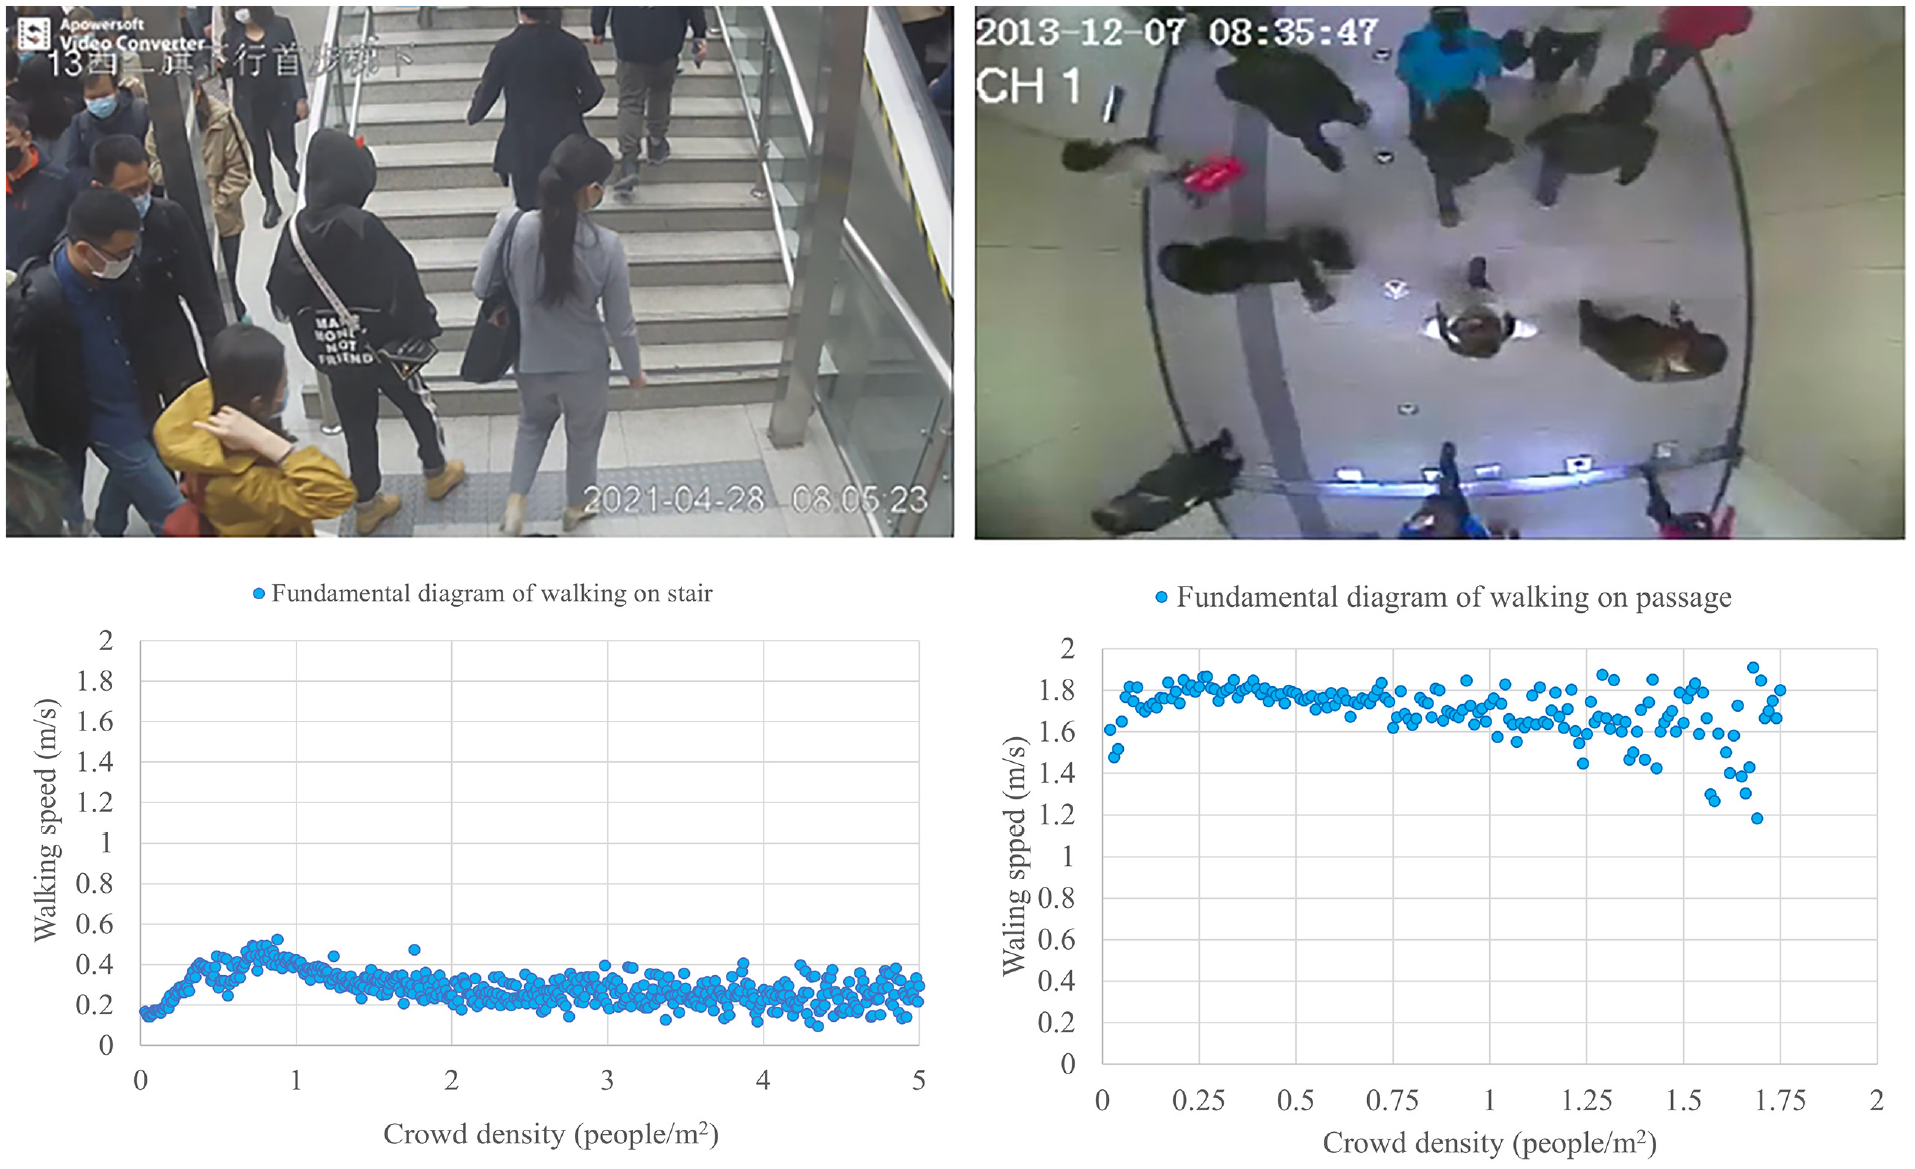
Screenshot and fundamental diagrams of crowd walking on stair and transferring passage.
From the fundamental diagrams, we can identify several differences between the scenarios. For the crowd walking on stairs, walking speed is significantly lower than in the platform scenario and the passage scenario. When the crowd density is up to 0.8 people/m2, walking speed significantly increases with crowd density, which is different from other scenarios. This is because walking up stairs takes more energy than walking on flat ground or downstairs, and people will move more slowly when there is nobody following them, whereas they will speed up when others do follow them. When the crowd density is larger than 0.8 people/m2, the relationship between walking speed and crowd density is similar to that from the platform scenario. For the passage scenario, because of the free-flow status, walking speed remains steady with only slight drops. Since the transferring population is small and they are moving to catch the next train, their walking speed is the fastest of these three scenarios.
Social Distancing Monitoring
In addition to its academic applications, the proposed model framework can also be used for practical implementation. The COVID-19 pandemic affected people’s travel behaviors and public transit operations, leading many cities to develop solutions for maintaining social distancing in public spaces for a phased reopening, especially for passengers in transit stations. Considering the dynamic position tracking technique in this study, the proposed model framework can be utilized to monitor social distancing in public spaces (e.g., transit stations).
We set an individual safety area for each tracked person based on their tracked positions and set the half-length of social distance (for example, 6 ft in the USA) as the radius of the safety area. The safety area is displayed using different colors along with the distance to the tracking position to communicate emergency levels, as shown in Figure 12.
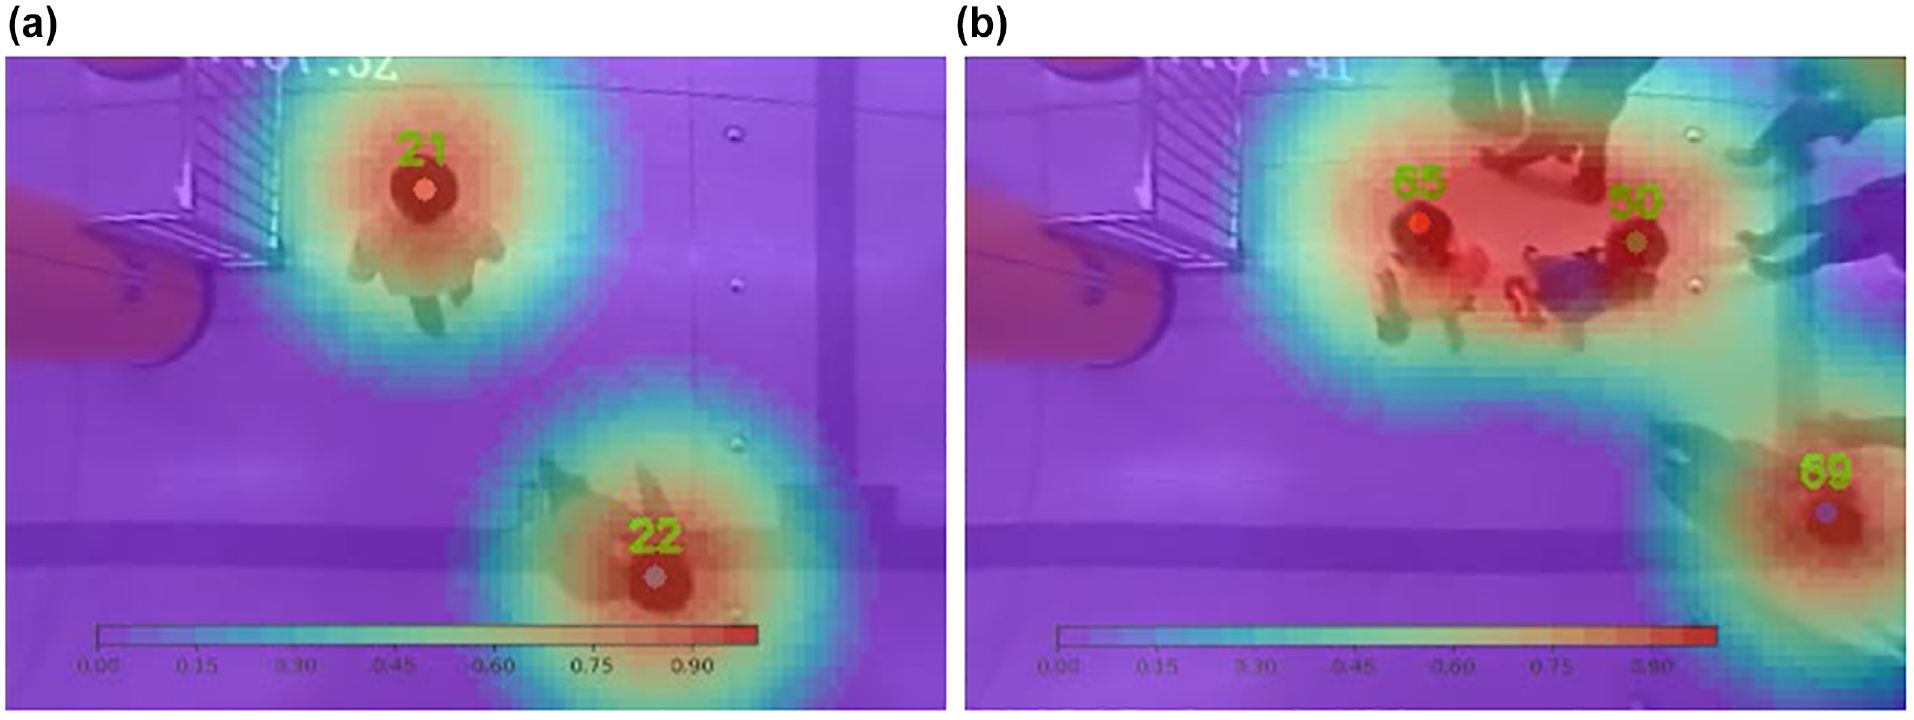
Social distancing monitoring: (a) keeping social distancing, (b) violating social distancing.
Conclusion
This study formulates a generalized CV-based crowd analytics model framework. In the framework, an IO matching counting method, an individual-based crowd density calculation method based on a Voronoi diagram, and a trajectory-based walking speed calculation method are deployed to calculate crowd dynamic metrics. Video data from a major rail transit station are used to verify the models, and the validation results show a flow volume counting accuracy as high as 95% and reasonable density–speed fundamental diagrams which are consistent with empirical studies. Furthermore, the proposed framework is used in multiple kinds of scenarios for further analysis, and the results show that there are some significant differences in crowd walking behavior between those scenarios. We also propose some practical functions for the model, such as social distancing monitoring.
This study mainly focuses on model formulation, without considering computational efficiency. Improving efficiency will be important for further development of a practical crowd analysis tool in the future. Additionally, future studies might feasibly improve the model’s counting accuracy by introducing modifications to the people tracking model to solve the challenge of “lost” people. Finally, more functions, such as trajectory analysis, will also be developed in the future.
Footnotes
Author Contributions
The authors confirm contribution to the paper as follows: study conception and design: Y. Zhu, X. Liu, Y. Bai; data collection: K. Ni, X. Li; analysis and interpretation of results: Y. Zhu, K. Ni, X. Li; draft manuscript preparation: Y. Zhu, A. Zaman, X. Li, X. Liu, Y. Bai. All authors reviewed the results and approved the final version of the manuscript.
Declaration of Conflicting Interests
The author(s) declared no potential conflicts of interest with respect to the research, authorship, and/or publication of this article.
Funding
The author(s) disclosed receipt of the following financial support for the research, authorship, and/or publication of this article: This research was in part supported by a grant from the Center for Advanced Infrastructure and Transportation (CAIT), a University Transportation Center (UTC) at Rutgers University. The work was done when Yadi Zhu was a Postdoctoral Research Associate and Xiaohong Li was a visiting scholar, both at Rutgers University.
Data Accessibility Statement
The data that support the findings of this study are available from a transit agency, but restrictions apply to the availability of these data, which were used under license for the current study, and so are not publicly available.
The authors are solely responsible for all views, analyses, results, and errors presented in this paper.