
Abstract
As societal attitudes toward fossil fuels shifts, commuter railroads may be coming under increased scrutiny for their contribution to greenhouse gas (GHG) emissions. This analysis explores new possibilities created by battery-electric locomotives (BELs) in conjunction with partial electrification for en-route recharging in electrified territory. We propose a systemwide network approach that starts with one or more substations in geographically strategic locations, then electrifying just enough for sufficient electrical charge, with BELs running off the wire in non-electrified areas. As 25,000-V alternating-current substations generally have an 18–26-mi reach, considerable possibilities exist for new-start electrifications. This is significantly more cost effective than a traditional approach that electrifies one corridor at a time. Although BELs are in technical development, and certain implementation challenges remains on commuter railroads, we believe BELs required to enable this type of electrification are within reach of current battery technology. Drawing on examples in Boston, Philadelphia, Chicago, and Minneapolis, six strategies are outlined: (1) minimizing electrification costs by electrifying radial commuter networks from a centrally located substation, (2) for systems with longer routes, using BELs to extend the central substation’s reach, (3) extending new electric service beyond existing electrifications with BELs, (4) using BELs to create new trans-regional services, (5) co-locating railroad-owned feeder lines with utility infrastructure such as electric transmission rights-of-way to maximize the geographic reach of supply substations, and (6) providing charging pads in certain limited situations. Preliminary ridership, energy sufficiency, and lifecycle cost analyses were performed to show the feasibility of BEL technology in conjunction with a substation-based, supply-side approach to designing electrification projects.
As societal attitudes move away from fossil fuels in favor of carbon-neutral renewable energy, commuter rail operators are responding to these concerns. In 2021, Metra, northeastern Illinois’ commuter railroad, issued a request for proposals for battery-powered locomotives ( 1 ). The California Department of Transportation has ordered four Stadler hydrogen-powered multiple-units for use on the San Joaquin route ( 2 ). Although halted in 2022, New York’s Long Island Rail Road and Alstom were actively developing a retrofit battery package for existing electric multiple-unit (EMU) cars ( 3 ).
Electrification, already undergoing a mild renaissance in the early 21st century, merits a closer look, and not just for environmental reasons. Advances in battery technology are leading to a paradigm shift without precedent in the history of railroad electrification that should greatly reduce the capital cost of new installations.
Modern battery-electric locomotives (BELs) with an energy capacity of 7.2 megawatt-hours (MWh) were announced in 2021 ( 4 ). The authors have previously demonstrated ( 5 ) that a four-unit consist of these BELs are capable of hauling freight trains of up to 8,000 tons for 230 mainline miles unassisted, potentially enabling discontinuous electrification of major freight lines. When combined with en-route charging on high-voltage alternating-current (AC) catenary, BELs potentially offer a revolutionary technology for commuter railroads looking to reduce diesel train-miles for greenhouse-gas (GHG) emission and climate-related reasons.
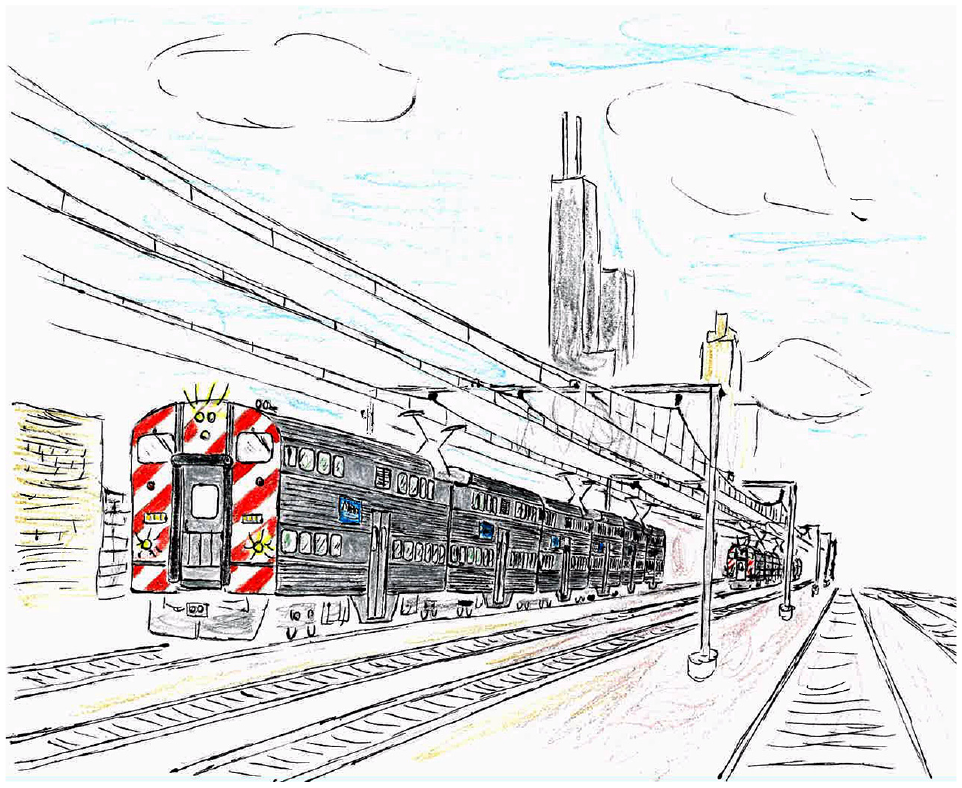
Conceptually, BELs resemble existing dual-mode AC electric/diesel locomotives, already operating on one major commuter railroad (Figure 1), except that their off-wire power comes from batteries, which are charged up while under the wire.
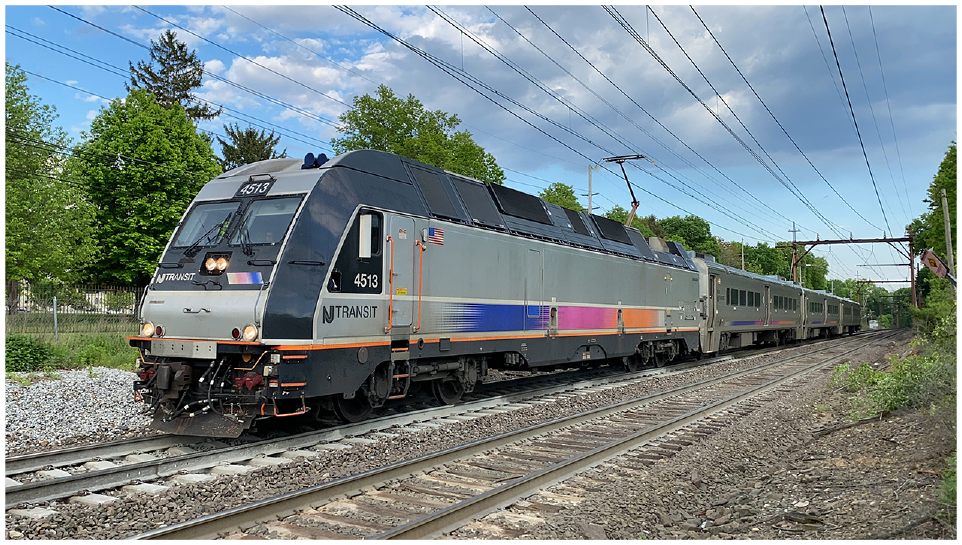
New Jersey Transit dual-mode locomotive entering Convent Station, 2021. Fan Railer photo (CC BY-SA 4.0).
Although early 20th-century electrifications used lower voltages, the geographic reach of 25,000-V (25 kV) AC electrification at 60-Hertz (Hz) commercial frequency creates new possibilities in combination with rapidly-developing BEL technology. Although BELs can work with already-existing electrifications involving lower voltages, the greater reach of 25 kV enables longer electrifications to be powered from one single substation, which in turn can reduce infrastructure costs or extend the reach of electric service. BELs themselves further extend the range of electric service by running off-wire beyond electrified trackage.
No BELs have been specifically built for commuter service as of this writing. But given the state-of-art in battery technology—driven by the automotive field ( 6 )—and successes of current freight-oriented prototype BELs, vendors should be able to develop BELs suitable for commuter service should an appropriate specification be issued. Several conceptual designs already exist (e.g., [ 7 ]). This paper describes how this technology, when fully proven, could be used.
Our approach to electrification planning is to electrify busier inner-suburban segments, supplemented with BELs or battery EMUs for outer, quieter segments, offering a cost-effective path forward. Preliminary analyses conducted for this effort show that once produced, BELs should have the range needed to extend electric service to exurban areas and beyond.
This concept combines traditional electric operations with BELs, and has been previously discussed at a conceptual level ( 8 , 9 pp. 168). It had been previously explored with a hydrogen fuel-cell stack in conjunction with a hybrid powertrain ( 10 ), before high-capacity batteries became available. Previous work on a concept termed “intermittent electrification” with very short live-wire segments and gaps ( 11 ) applied to reducing GHG emissions from passenger rail with dual-mode diesel locomotives ( 12 ) was found to be unworkable because feeder wire and substation-related issues were overlooked ( 13 ). A recent optimization study examined the location of electrified track necessary to advance such a concept ( 14 ). Indeed, Deutsche Bahn may be close to implementing such a concept in Schleswig-Holstein ( 15 ) with minimum electrified segments of several hundred meters at 15 kV AC, 16.7 Hz.
This study is distinct from previous work in several significant ways. Our approach keeps the electrified segments contiguous to the maximum extent possible, based on the maximum reach of 25 kV supply substations, recognizing that substations are a major part of electrification expense. We utilize BELs in place of diesel dual-mode units to operate through unelectrified territory, thereby achieving 100% GHG elimination at the point of use, rather than a partial solution. Finally, and perhaps most importantly, we sketch out what practical designs on U.S. systems might look like, using case studies on existing and proposed U.S. commuter and regional rail systems, thereby advancing this idea beyond the conceptual stage.
Context of Climate Change
Human activities are estimated to have caused between 0.8°C and 1.2°C (1.4°F–2.2°F) of global warming above pre-industrial levels, which is likely to reach 1.5°C before 2052 ( 16 ). Thus, the United Nations Intergovernmental Panel on Climate Change (IPCC) has called for a 40% reduction of GHG emissions by 2030 to avoid climate consequences associated with average warming of greater than 1.5°C. Some industry groups describe zero-carbon rail as a “necessity” by 2050 ( 17 ).
Diesel locomotives emit GHGs and contribute to climate change. As automobile and bus fleets are hybridized or electrified, today’s environmental arguments in favor of diesel-powered commuter rail will become harder to sustain. To reduce diesel train-miles, operators must either cut service or replace diesels with non-GHG-emitting propulsion technologies.
Research Objectives
This paper offers a high-level, first-cut feasibility analysis for BEL-enabled commuter rail electrification. It aims to: (a) identify existing commuter rail services that could be electrified for climate change action; (b) show how single-substation configurations in combination with BELs could make electrification less costly than conventional designs; and (c) show that two 4.8-MWh BELs have the range to perform all but the most demanding duties in typical commuter and inter-regional services, if enough of the core network is electrified.
Limitations of This Research
Our research does not address such implementation issues as upgrading electrical grids for climate-neutral power generation, or infrastructure-based site-specific restrictions (equipment weight, length, special requirements, etc.). Nor does it evaluate mode shift alternatives (e.g., from diesel trains to electric buses), offer ridership forecasts, or address the longstanding debate between locomotives and EMUs ( 18 ). It also does not determine whether railroads are more GHG-efficient with electrification than with alternate fuels such as hydrogen, nor does it investigate environmental concerns about the fabrication and disposal of batteries or the consequences of mining the necessary semi-precious metals. However, it is worth noting that liquefied natural gas (LNG), “genset” locomotives, and operating diesel locomotives in “hybrid” configurations are not carbon-neutral options ( 5 ).
Nor is this paper a “business case” for commuter rail electrification. North American commuter and intercity passenger rail services require operating support, and such support is not generally driven by energy costs. From a return-on-investment perspective, the balance of electric power versus diesel largely depends on assumptions about relative energy costs.
Perhaps most importantly, this research does not consider track ownership, jurisdictional issues, or other institutional matters. It is assumed that solutions can be found, as in Massachusetts ( 19 ), New York, Virginia, Florida, California, and Ontario.
For general background on railroad electrification, readers are referred to the extant literature ( 20 – 25 ), including research on design alternatives ( 26 ), electric traction power supply ( 27 , 28 ), and alternatives to diesel traction ( 9 pp. 135–177).
Historical Review of North American Electrifications
In the early 20th century, railroads that could afford the substantial expense electrified some or, occasionally, all of their suburban services to solve specific operating issues where steam was unworkable or inadequate ( 29 , 30 ). The reasons why they electrified included long tunnels, underground stations, sustained grades, increasing train throughput through faster handling, general economy of operation (particularly in conjunction with intercity passenger and freight trains), and elimination of fossil-fuel locomotive smoke for civic improvement purposes ( 31 ). Interestingly, these reasons for electrifying remain valid.
The post-World War II emergence of diesel–electric locomotives ( 9 , 32 ) transformed North American railroads and reduced the operating advantages of electric traction. Mechanical engineers and manufacturers quickly settled on diesel–electrics as the motive power of choice. Diesel–electrics, being essentially electric locomotives with self-contained diesel generators, combined the geographic flexibility of steam with the high torque of electric locomotives ( 33 ). Push–pull operation with diesel locomotives and cab cars started on the Chicago & North Western in 1960 ( 34 ) and quickly spread to other commuter railroads. This made diesel locomotives as easy to use in commuter service as EMUs.
Re-electrifications and other renewals of already-electrified commuter rail lines offered the first tentative signs of reinvestment in electric traction infrastructure. Several re-electrifications switched over from direct current (DC) or low-frequency AC to commercial-frequency, 60-Hz AC ( 35 ):
New Jersey Transit, Morris & Essex Lines, from 3,000 V DC to 25 kV AC, 60 Hz, 1984
Metro-North Railroad, New Haven Line, from 11 kV AC, 25 Hz to 12.5 kV AC, 60 Hz, 1986
Agence Métropolitaine de Transport (Montréal, Québec), Deux-Montagnes Line, from 2,400 V DC to 25 kV AC, 60 Hz, 1995
First-Wave Electrification Renaissance
Adding to the extent of existing electrifications was a logical follow-on to renewals of older installations. Three New York area commuter railroads added significant extensions to existing electrifications (1982–2002). Several new-start installations, all at 25 kV AC, followed:
Amtrak Shore Line Route, Boston, Massachusetts to New Haven, Connecticut, 2000
Ferrocarril Suburbano de la Zona Metropolitana del Valle de México, Mexico City, 2008
Regional Transportation District, Denver, Colorado, 2016
Two other properties are in the process of electrifying at this writing:
Caltrain, San Francisco to San Jose, California
GO Transit, multiple lines, Toronto, Ontario, Canada
Figure 2 shows the Caltrain electrification, which uses hardware typical of modern electrifications.
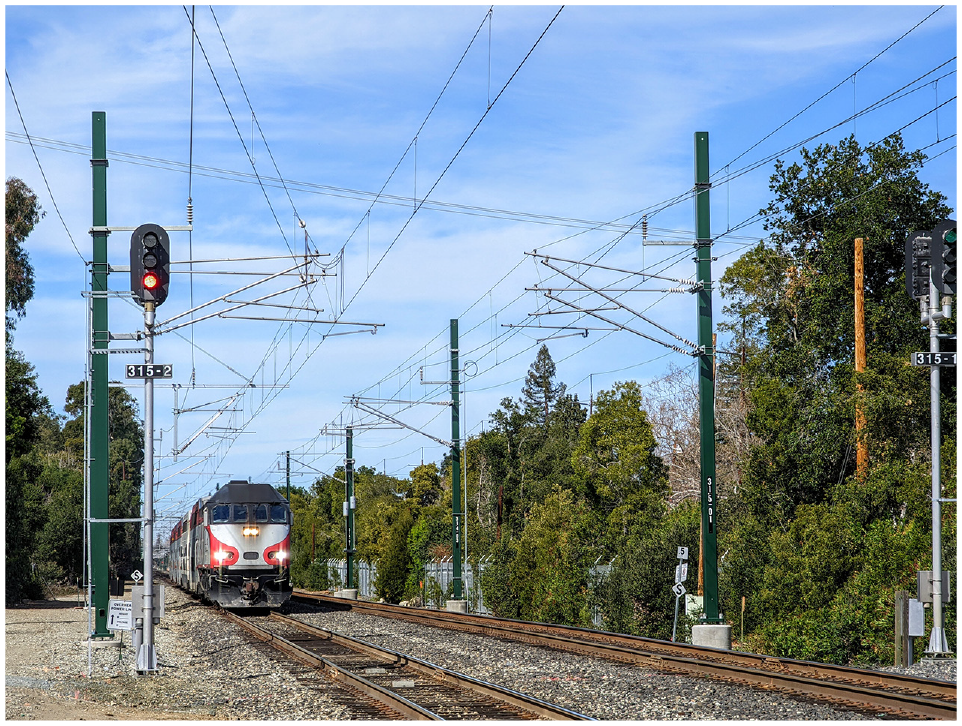
Section of completed Caltrain electrification work at California Avenue, Palo Alto, California, 2022. Dick Lyon photo (CC BY-SA 4.0).
Two unsuccessful proposals and a third yet in play were also part of this first wave:
In 2012, an otherwise-promising plan to electrify three commuter rail lines in Montréal, Québec, Canada failed when the freight railways, which own the tracks, announced their opposition to electrification.
In Chicago, Metra, northeastern Illinois’ commuter railroad, considered electrifying some or all of the Rock Island District (which Metra owns and operates) in 2018. The interesting aspect was not that Metra found the costs exceeding the benefits, but that this proposal failed to advance by only a small margin.
Finally, in Boston, as of late 2022 the Massachusetts Bay Transportation Authority (MBTA) appeared to be ready to proceed with electrifying the Fairmount Line, which serves an urban corridor and provides an alternative to the Northeast Corridor mainline between Boston and Readville, Massachusetts ( 36 ).
This early 21st-century renaissance occurred against a backdrop of rising commuter rail ridership between 1983 and the start of the COVID-19 pandemic in 2020 ( 37 ). At first glance, the pandemic’s effects on ridership might imply an end or at least a pause to the present wave of electrification. Recent controversies about electrification costs ( 38 ) and the applicability of battery-electric traction to rail passenger service ( 39 ) based on questionable assumptions have further confused matters. But a second wave of interest in electrification may be imminent as ridership recovers, led by increasing unease about GHG emissions and their impact on climate change.
Current Approaches to Dual-Mode Motive Power
Amtrak is currently procuring Siemens Charger locomotives mated to auxiliary power vehicles (APVs), which draw power from overhead catenary and could optionally be fitted with batteries ( 40 ). Metro-North’s dual-mode procurement ( 41 ) may include an option for battery tenders that would supply power to adjacent locomotives.
Responding to these market demands, Siemens is reportedly designing a version of the Charger locomotive (designated M42-DMC) with lithium-ion batteries that could operate in battery and diesel modes, recharging from railroad power sources where available. When this locomotive is built, it could provide the capability for a demonstration passenger service that would span existing electrified and non-electrified territories. Although these approaches involve diesel locomotives which might, as an option, be provided with energy storage capacity rather than BELs, this represents a significant first step toward reducing the proportion of diesel train-miles relative to total service.
Further Electrification Renaissance?
Until recently, new standards (Tiers 2, 3, and 4) restricting particulate and noxious emissions from new and rebuilt diesel locomotives ( 42 , 9 pp. 123–133) had seemingly raised the threshold for justifying electrification. Now, though, concern about GHG emissions may have the opposite effect of making electrification more desirable.
Current alternative fuels and propulsion technologies have their limitations. Hydrogen lacks the concentrated energy density of fossil fuel, and even under the best of circumstances is likely to underperform relative to diesel or biodiesel ( 20 pp. 10–11). Thus, GO Transit considered but rejected hydrogen power as being inadequate for its busy and growing system ( 43 , 44 ). In 2022, Metrolink converted from fossil-fuel diesel to a renewable diesel fuel (RD99) refined entirely from modern carbon (i.e., carbon other than that contained in fossil fuels). To the extent that RD99 production removes CO2 from the atmosphere, overall net reductions of 65%–90% of carbon emissions might be possible ( 45 ), but it does not entirely eliminate GHG emissions. Today’s concern with reducing the carbon footprint of transportation increases the likelihood that the environmental benefits of commuter rail electrification (powered from carbon-neutral sources) will be fully appreciated.
The second-wave electrification renaissance is likely to take two forms. One is conventional electrification using overhead catenary systems (OCS), as in Denver, San Francisco, and Toronto. The second involves the emerging technology of BELs.
Strategies for Commuter Rail Electrification
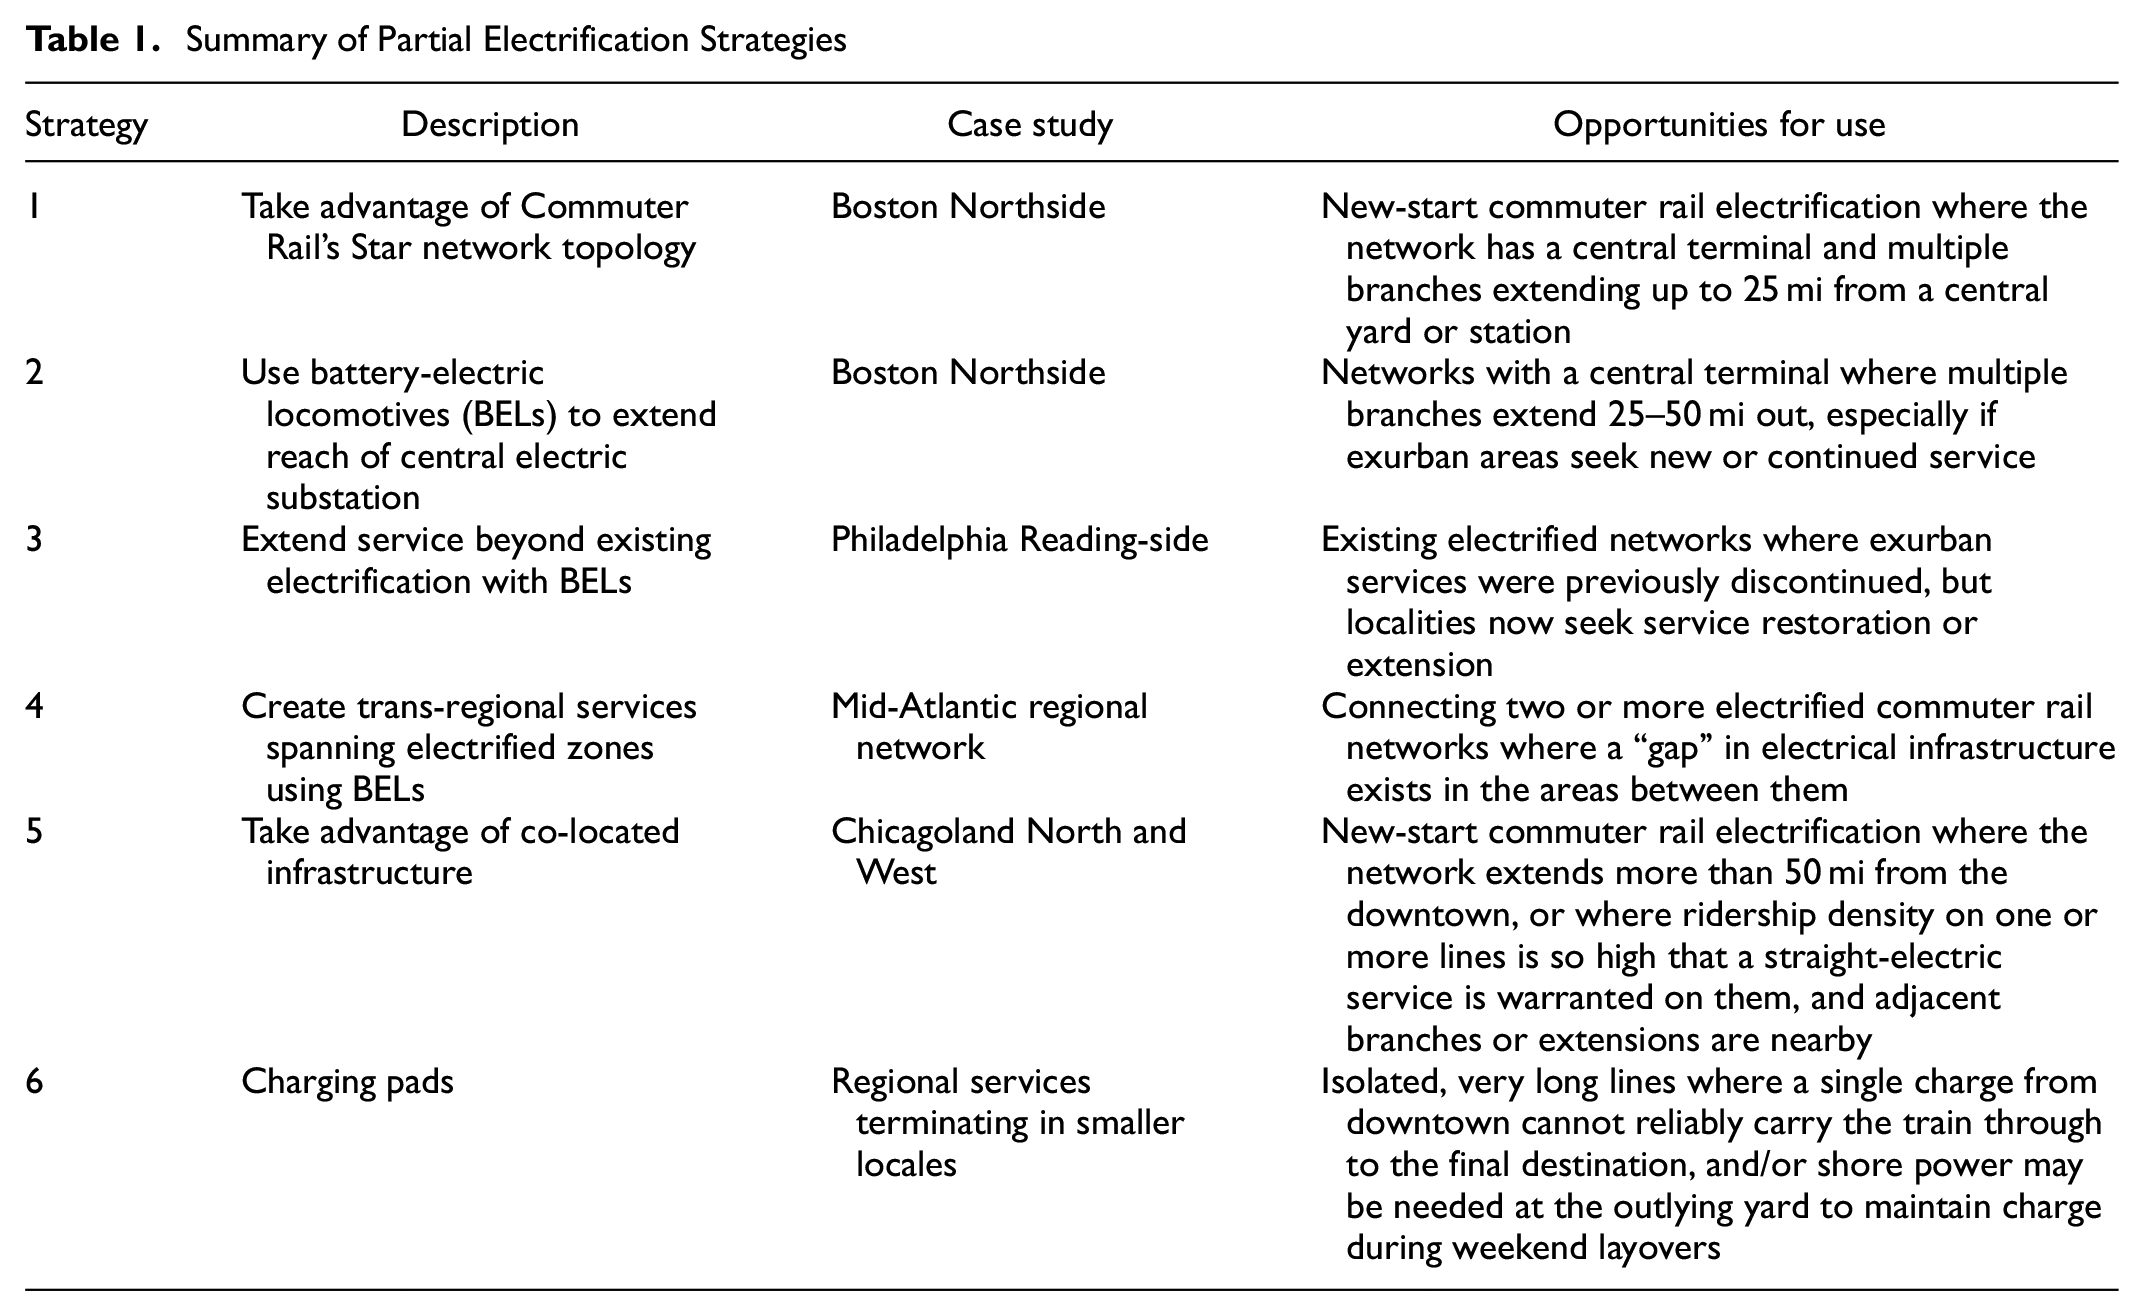
We propose some strategies and ideas to minimize both capital and operating costs of electrified commuter rail service in the context of reducing GHG emissions, using examples from Boston, Philadelphia, and Chicago. Table 1 summarizes the strategies discussed here. Because partial electrification requires approaches that differ greatly from those hitherto used for conventional, continuous electrification, these paradigm-shifting strategies are examined first.
Summary of Partial Electrification Strategies
Following descriptions of these strategies is a more technical discussion of the methods used. Evaluating these different strategies and determining the feasible operating ranges of BELs requires data analysis and technical computations using standard industry formulas. Table 2 summarizes the methodologies used and major findings.
Summary of Methodologies Used for Evaluating Case Studies
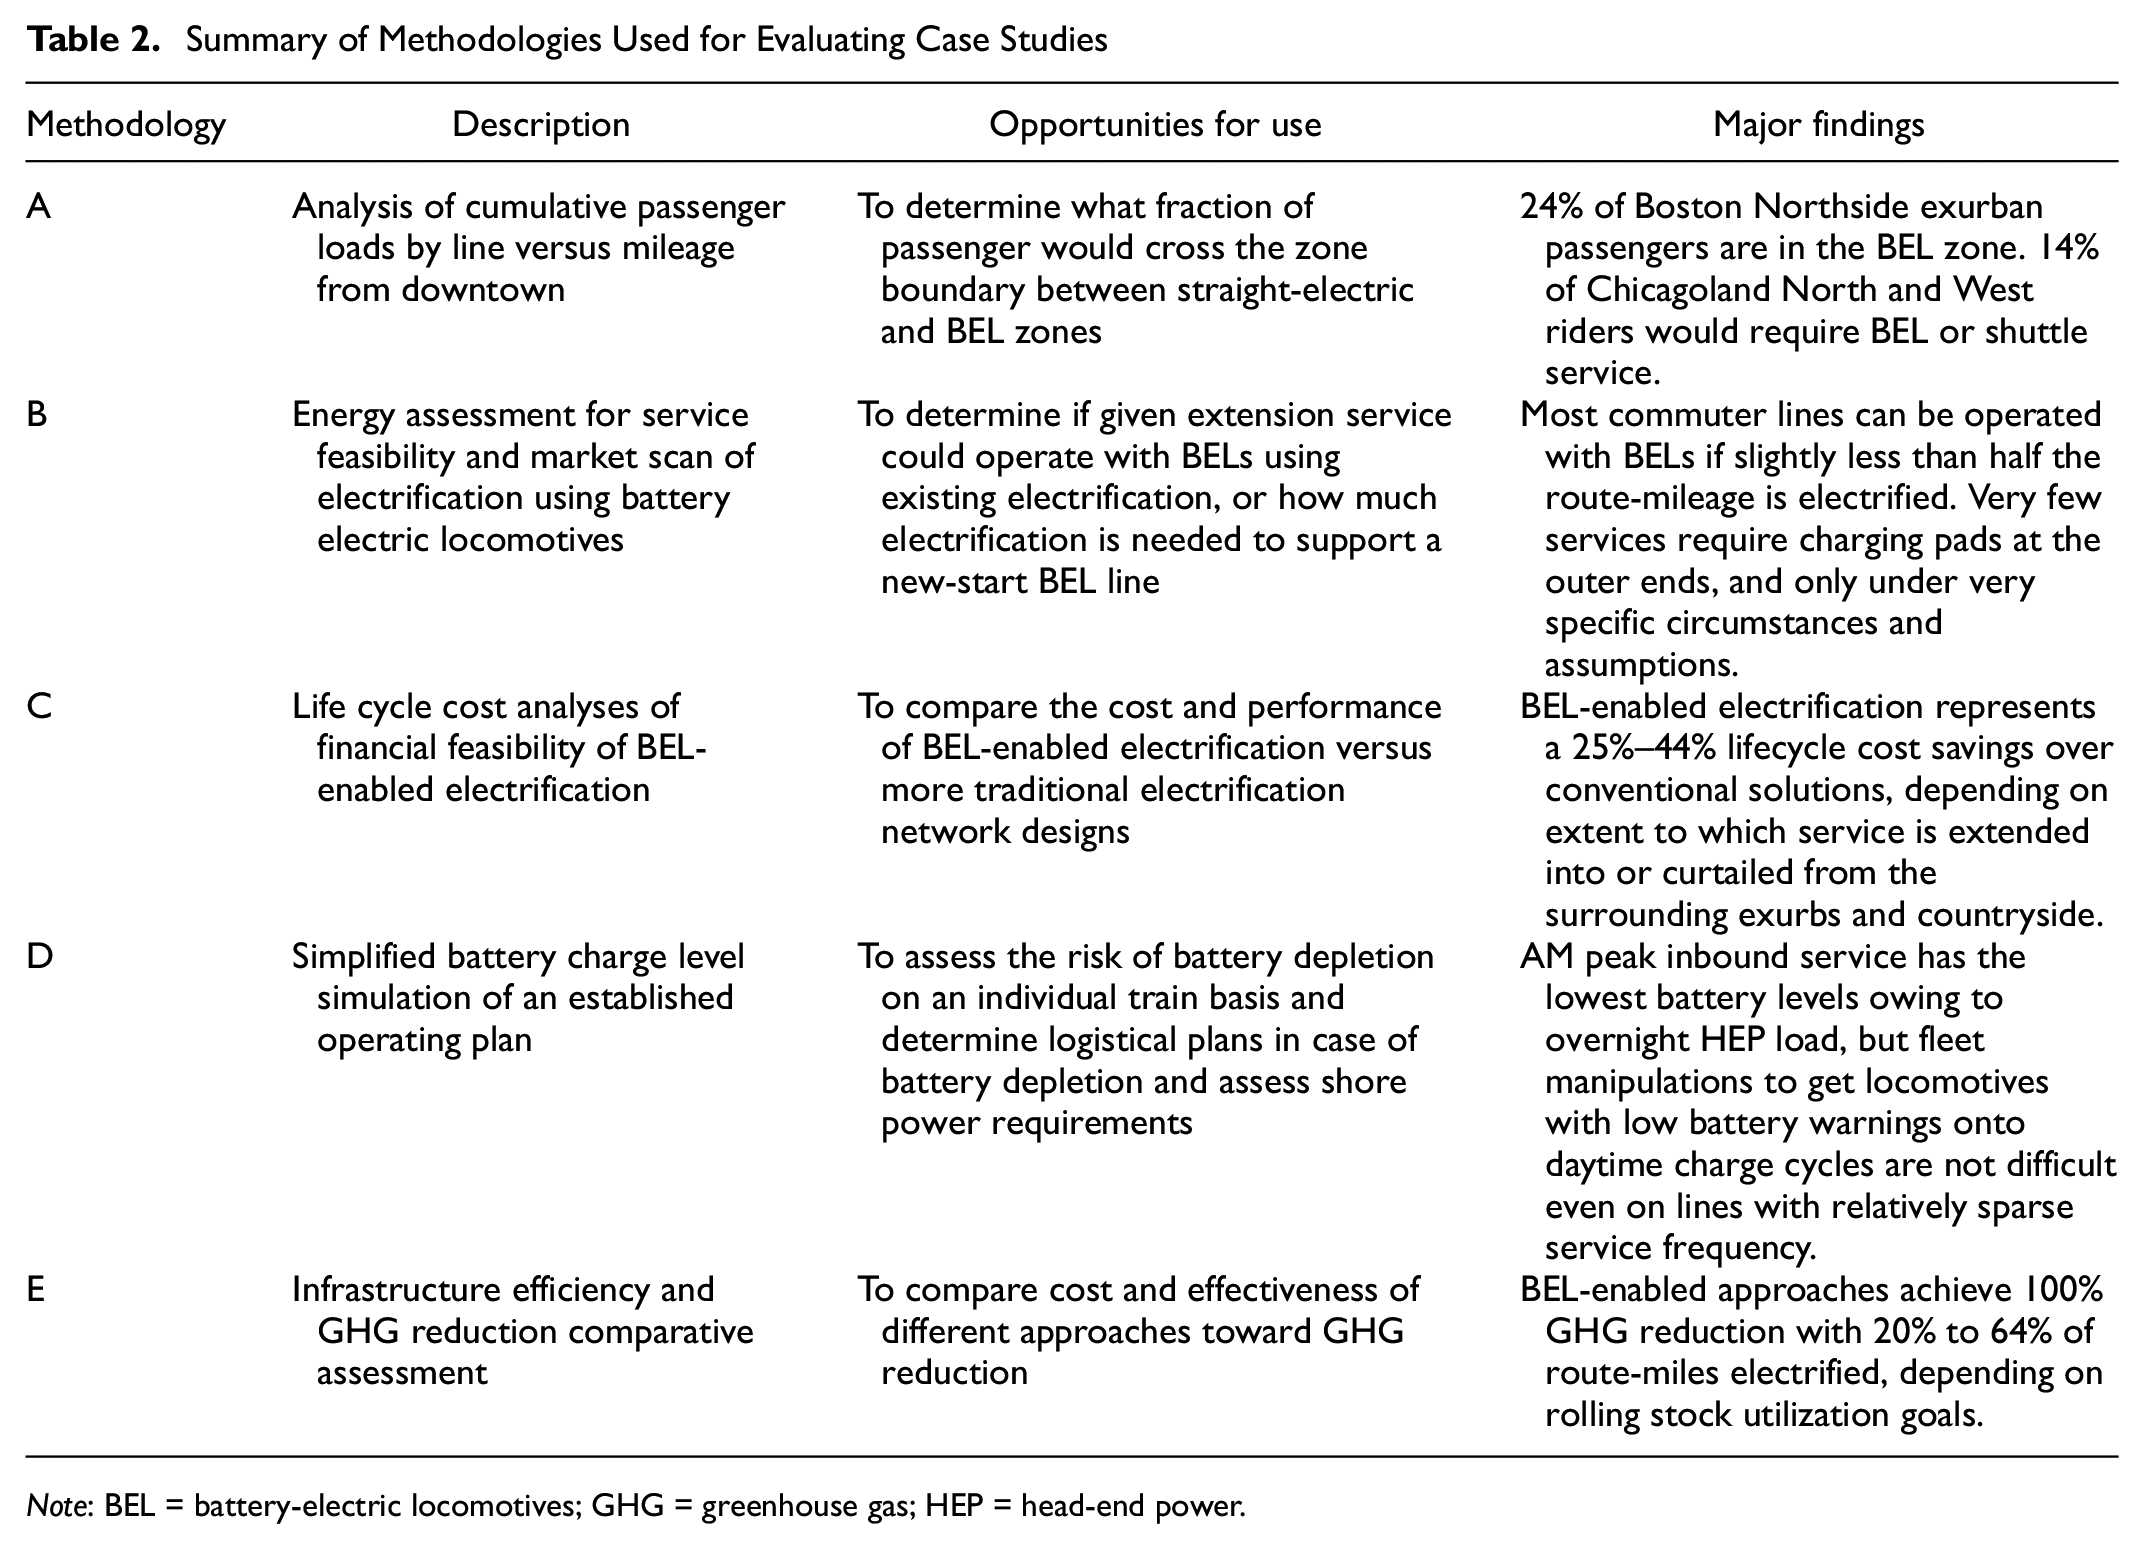
Note: BEL = battery-electric locomotives; GHG = greenhouse gas; HEP = head-end power.
Key to these strategies is a supply-oriented approach to electrification. In a classical service-centric approach, sponsors decided what services should be electrified, and given that scope, railroad engineering departments determined what infrastructure was needed to implement the project. Instead, we stand this logic on its head. Starting with a strategically located substation, we ask how much of the network can be electrified? This might affect such operating matters as storage yards, crew bases, and so on, but given the significant range of 25 kV electrification from supply substations, designers should have considerable flexibility to identify solutions.
For this analysis, we assumed that on shared freight/passenger corridors, catenary electrification can co-exist with double-stack container trains, or freight trains can be re-routed if necessary. As it should be possible to operate electric locomotives at speeds up to 100 mph with overhead wires dimensioned for double-stack container trains ( 46 pp. 2–3), such clearances would not be problematic for commuter rail operations.
Where electrified lines with lower wires have flat junctions with other railroads, short gaps may be needed in the catenary wires to accommodate freight trains, particularly if double-stack container trains use the intersecting line. (This situation already exists on the Northeast Corridor in southwestern Connecticut, where there is a short gap in the wires when crossing the Cob movable bridge over the Mianus River.) We have previously provided ( 5 ) a list of next steps necessary to demonstrate that catenary electrification can co-exist with double-stack freight trains in North America.
We now turn to the strategies themselves.
Strategy 1: Take Advantage of Commuter Rail’s Star Network Topology
Classic commuter rail networks radiate from a downtown location in all directions, typically with a shared train servicing facility nearby. Modern 25 kV AC, utility-frequency, autotransformer-fed systems have a maximum range of 18–26 mi from supply substations (up to 52 mi between substations), depending on such factors as design and power draw. Commuter rail power requirements are on the lower end of theoretical catenary capacity, thereby maximizing substation range. This range allows the network’s highest-density segments to be covered from one single, centrally located supply station. This is especially true if a trunk line runs several miles from downtown before splitting into branches, or if the servicing facility is located a few miles out.
Figure 3 shows the hypothetical extent of electrification from one supply substation (with three to five autotransformer paralleling substations on each branch) for Boston’s Northside commuter rail system. All core suburban markets, which encompass line segments serving 83.6% of total ridership—see Figure 4, and Methodology A, below—can be covered from a single substation at the Boston Engine Terminal (B.E.T.), shown in Figure 5. Any operations beyond the electrified zone would require connecting services. Some parts are at the far end of the 25 kV transmission range and may experience low-voltage conditions under certain circumstances.
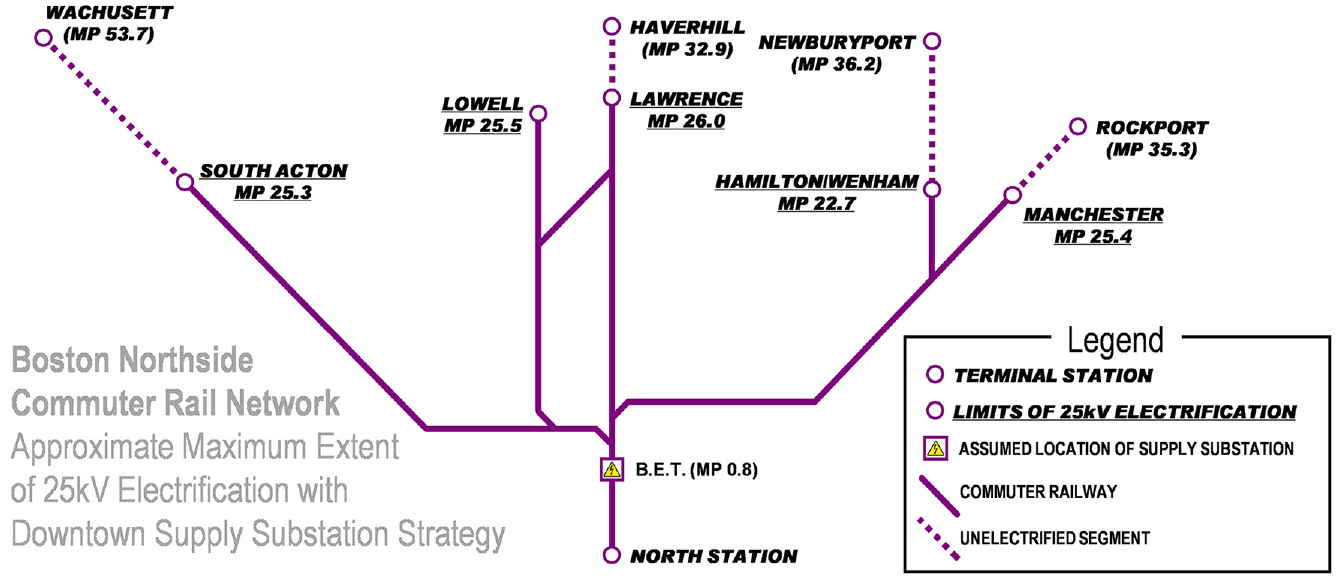
Boston Northside commuter rail network case study: central supply substation strategy (Strategy 1), showing maximum feasible electrification at 25 kV with one single supply substation at the Boston Engine Terminal.
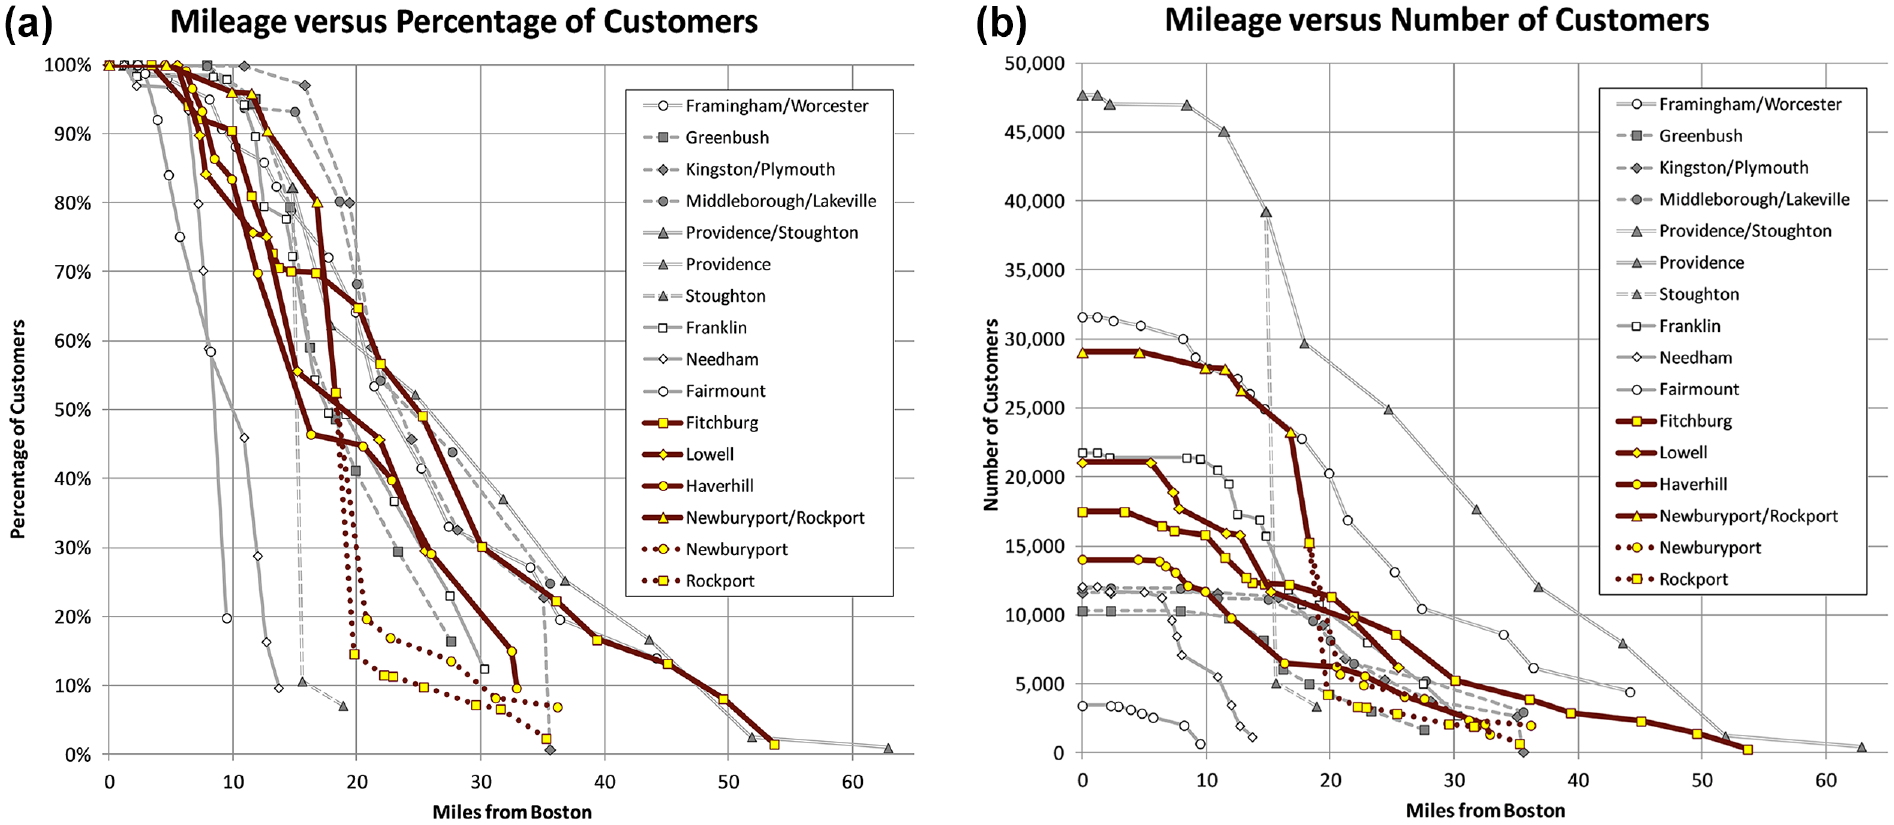
Commuter Rail ridership statistics for Boston showing visualization by line, station, and mileage, emphasizing lines selected for partial electrification case study: (a) Boston % of ridership by line and by mile, and (b) Boston ridership count by line and by mile.
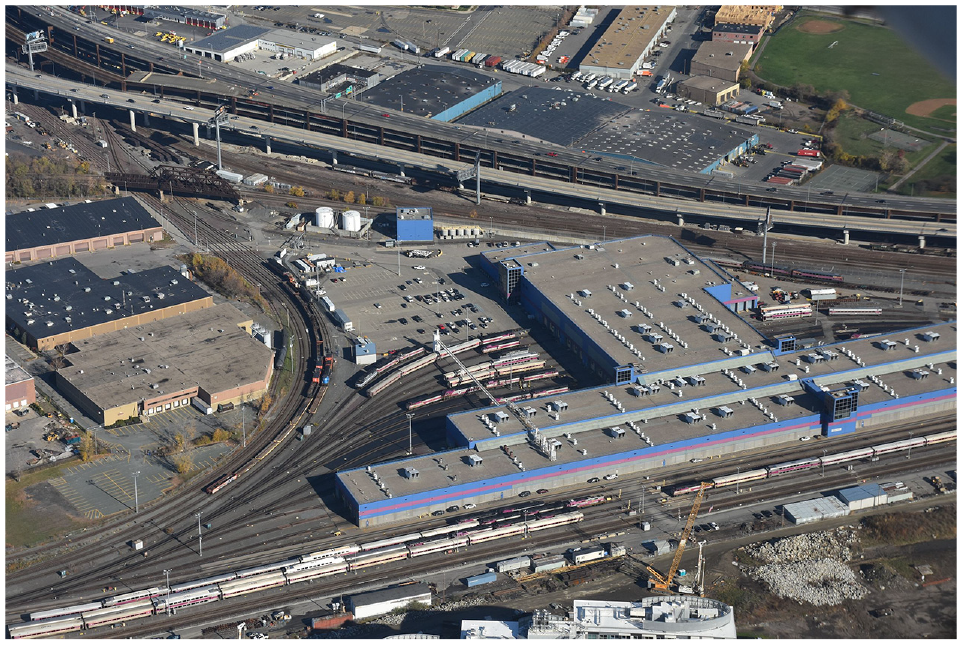
Boston Engine Terminal, also known as the commuter rail maintenance facility, a possible site for a 160 MW supply substation. Nick Allen photo (CC BY-SA 4.0).
Admittedly, a single-supply configuration has reliability consequences. However, those effects can be mitigated by multiple utility feeds at the central location, and BELs or, as an interim step, electro-diesel dual-mode locomotives for some services. Additional feeder locations might eventually come online for reliability enhancement and as electrified services expand beyond the suburban core. But as a starter electrification system, this is a highly cost-effective configuration.
Strategy 2: Use BELs to Extend the Reach of Basic Electrification
There might be markets beyond the 18–26-mi radius that are important for ridership, operational, or jurisdictional reasons. High-capacity BELs can serve these markets seamlessly, even without 25 kV wires reaching important suburban terminals like Haverhill and Fitchburg.
Figure 6 shows the approximate maximum BEL ranges beyond the hypothetical core 25 kV network, based on the charging time available between entering the electrified zone inbound and leaving it on the next outbound run—see Methodology B, below. We only need to build the minimum electrification necessary to keep BELs sufficiently charged to reach outlying terminals and return to the electrified zone. Therefore, less electrification is needed than in Figure 3, particularly where we know service on a specific branch is unlikely to extend beyond the current terminal (as with Rockport, at the end of a peninsula).
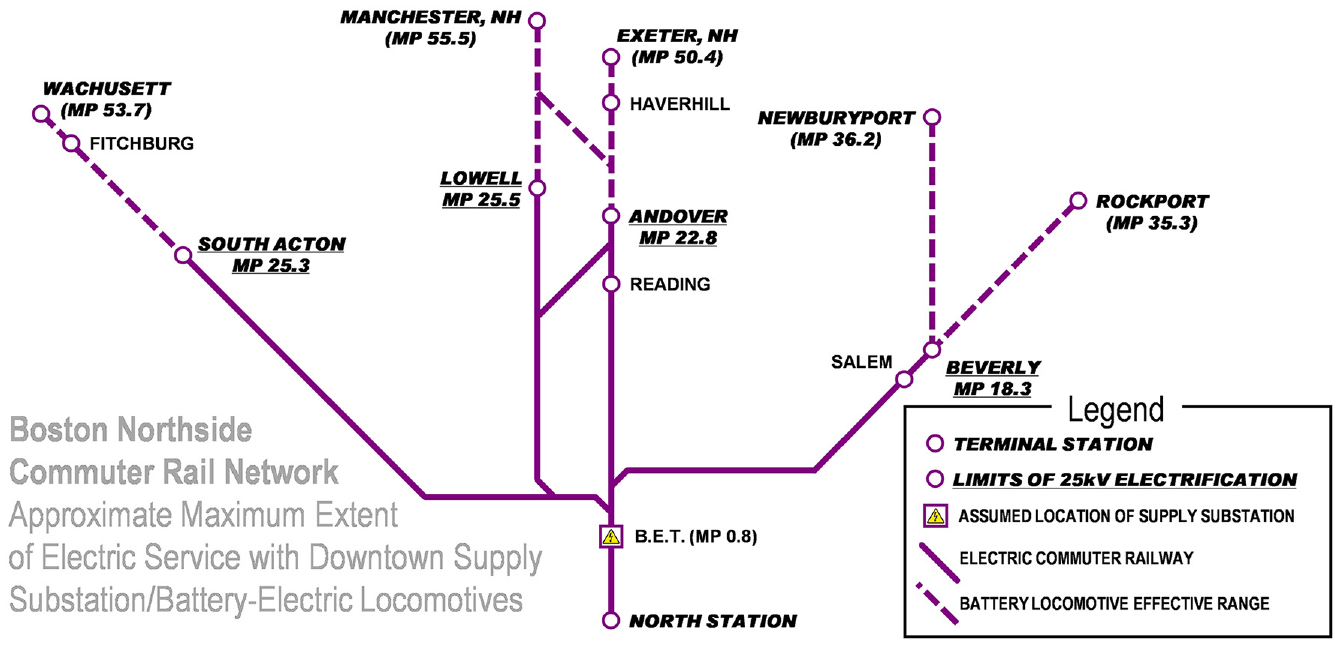
Boston Northside commuter rail network case study: central supply substation strategy with battery-electric locomotives (Strategy 2), showing minimum necessary electrification at 25 kV with one single supply substation at the Boston Engine Terminal.
Another advantage of this setup is that branching may occur near the maximum range of a single 25 kV substation (e.g., Newburyport and Rockport). These branches necessarily increase electrification costs because infrastructure is less cost-effective on lower-density segments. BELs respond to this challenge by serving lower-density areas without having to install and maintain expensive catenary infrastructure.
Some outer terminals, where many communities have sought commuter rail since 1981, extend well beyond the extent of current diesel service. Although funding and governance matters remain yet to be solved, BELs combined with a central supply substation could extend service well beyond boundaries formerly thought possible or desirable. (Since outlying jurisdictions benefit from BEL service extensions, commuter rail agencies may well expect these outer areas to help pay for the core electrification.)
This approach also allows more frequent EMU or electric locomotive service on the highest-density segments, assuming sufficient track and yard capacities. Our operating plan assumptions (Table 3) include 100% electric services to Reading, Lowell, South Acton, and Beverly Depot, supported by new yard tracks at Lowell and near Salem. However, the 9.6 MWh sets of two BELs are effectively drop-in replacements for the current F-40 or GP-40MC locomotives. The existing coach fleet can be used until it reaches retirement, and need not be added to unless additional service is sought. Further study will be needed to definitively establish operating plan alternatives that feasible infrastructure expansion can accommodate.
Operating and Service Plan Details for Boston Northside Case Study (Strategy 2)
Note: BEL = battery-electric locomotive; B.E.T. = Boston Engine Terminal; EMU = electric multiple-units.
With Strategy 2, most core suburban markets (line segments serving 76% of total ridership—see Table 4, and Methodology A, below)—can be covered from a single substation at the B.E.T.. Figure 7 is a zero-origin cumulative ridership chart, visually confirming based on its ballistic-projectile parabolic shape that most ridership density lies within the inner suburban zone which can receive straight-electric service.
Electrification Performance Metrics for Boston Northside Case Study (Strategy 2)
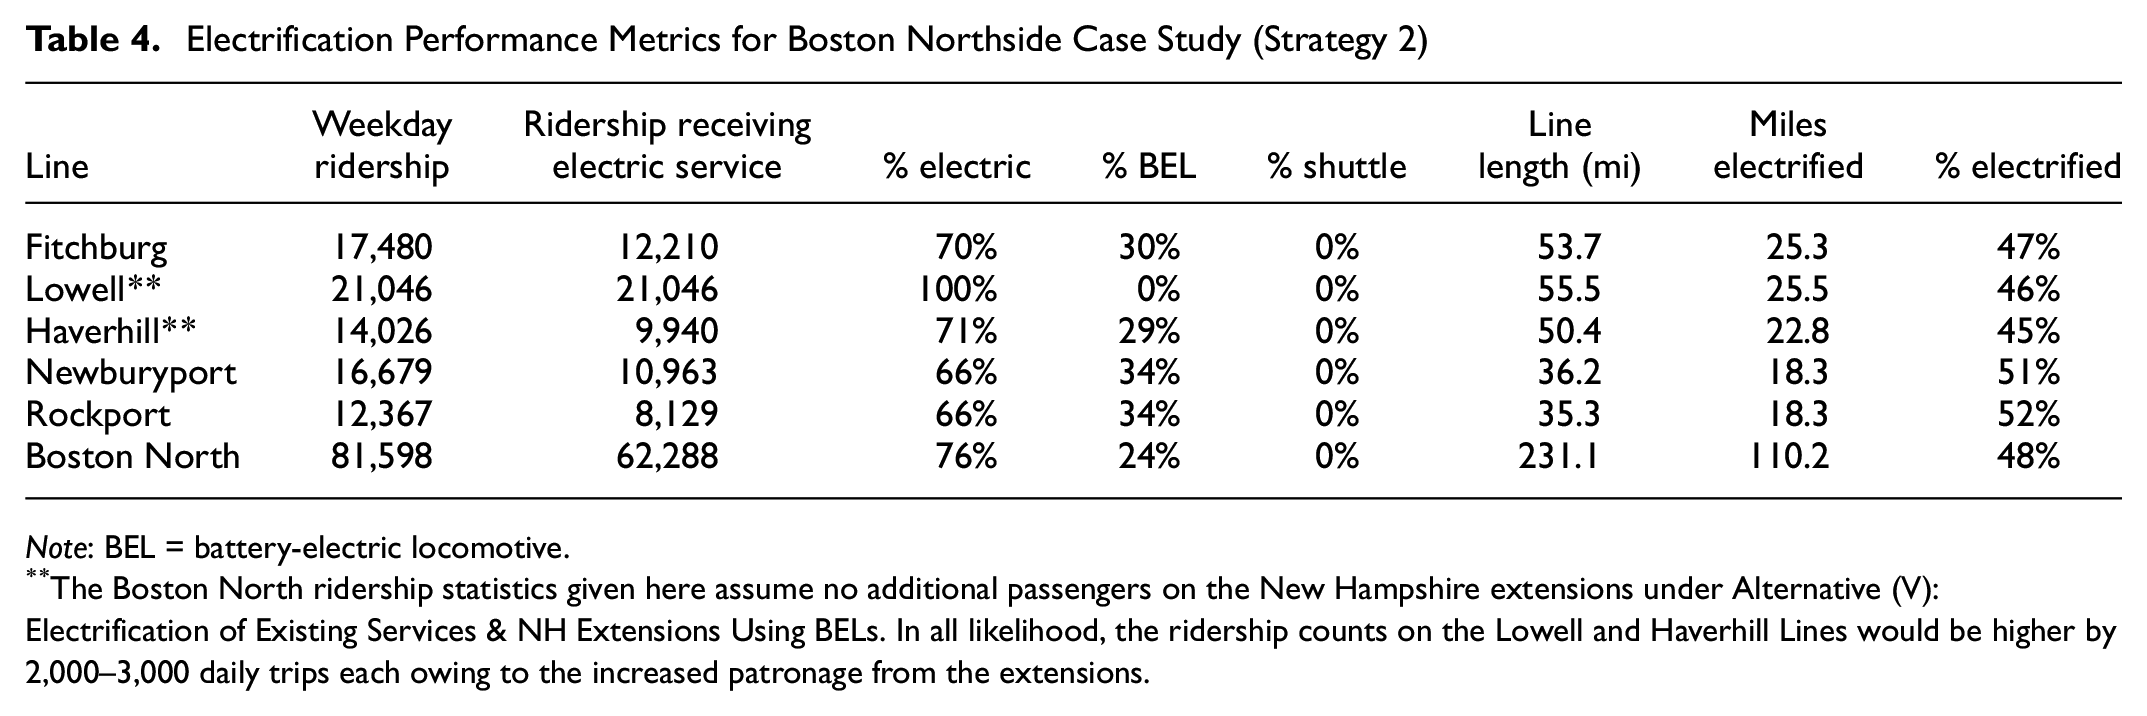
Note: BEL = battery-electric locomotive.
The Boston North ridership statistics given here assume no additional passengers on the New Hampshire extensions under Alternative (V): Electrification of Existing Services & NH Extensions Using BELs. In all likelihood, the ridership counts on the Lowell and Haverhill Lines would be higher by 2,000–3,000 daily trips each owing to the increased patronage from the extensions.
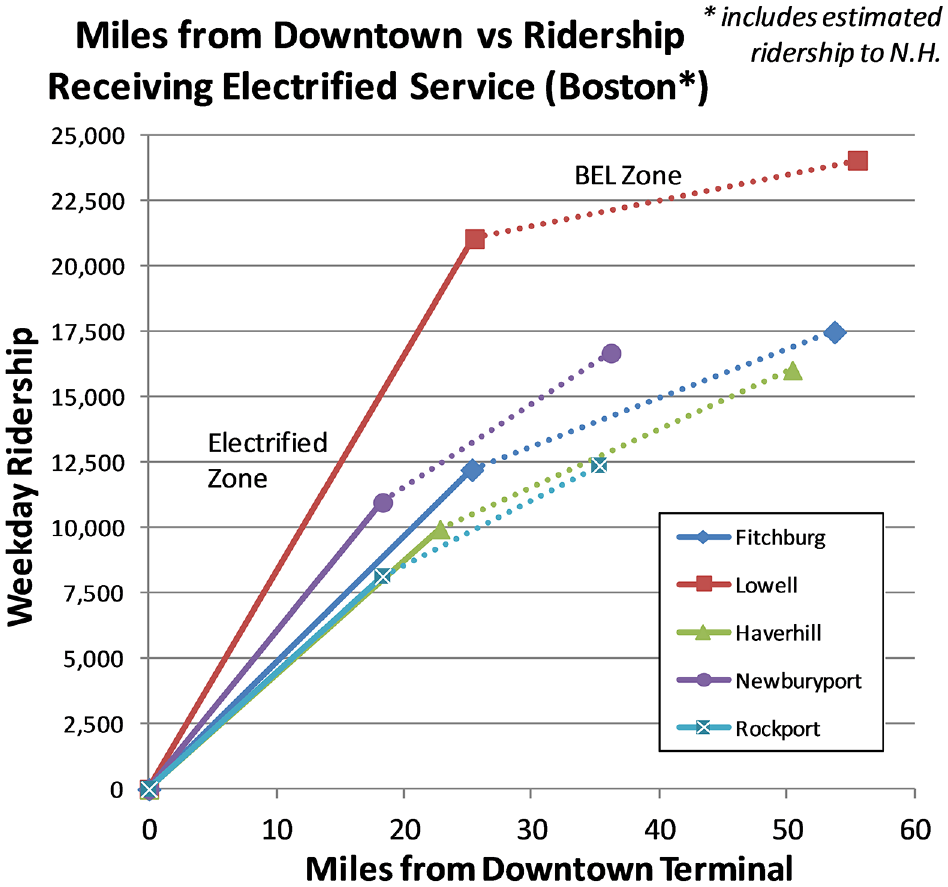
Distance–ridership relationship for Boston Northside case study (Strategy 2).
Figure 8 shows an artist’s concept of what commuter BELs operating in electric, that is, charging mode might look like; a BEL-hauled train is passing an electric multiple-unit train. The cabless booster behind the locomotive provides additional energy storage needed for operations.
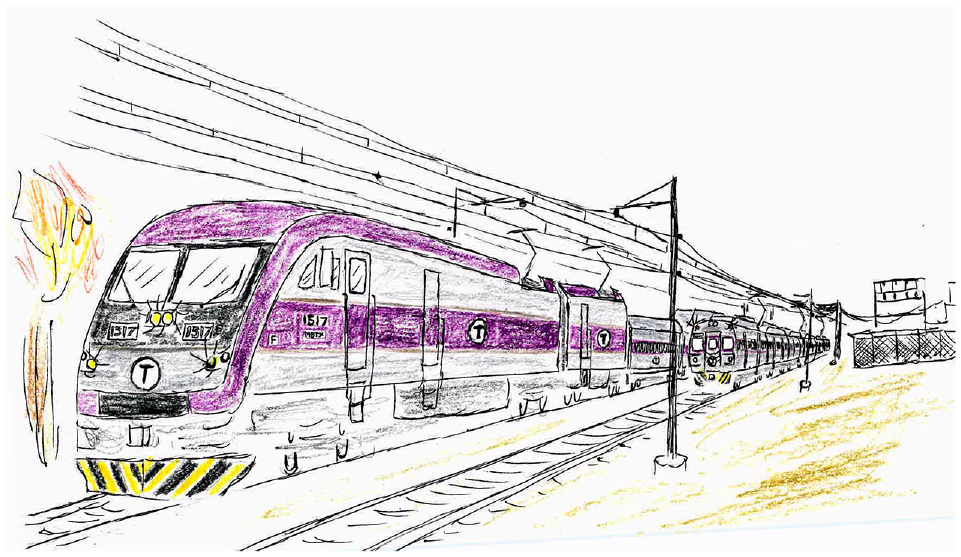
Battery-electrics on the Boston Northside lines; artist’s concept by John G. Allen.
Life Cycle Cost Analyses
We performed a hypothetical lifecycle cost analysis of Strategies 1 and 2 (Methodology C, below), compared with a more conventional strategy of electrifying the entire network with straight electric locomotives, to different extents. Based on our assumptions, the results show that the BEL-enabled single-substation design (Strategy 2) saves 25%–44% in total ownership costs, with the range dependent on how far commuter services extend beyond the electrified zone. BELs can extend the range of a single central-city substation from 18–26 mi to about 50 mi from downtown, sufficient for all but the most dispersed regions. Figure 9 summarizes our findings.
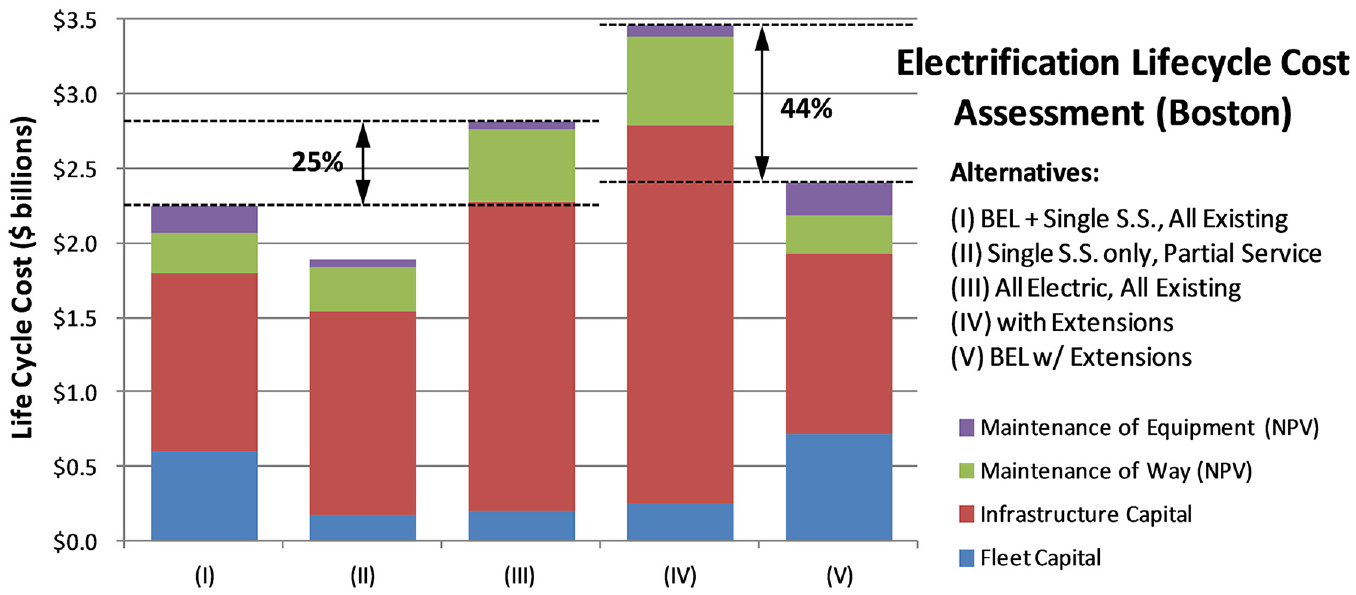
Summary of lifecycle cost analysis findings for Boston Northside case study.
Adapting Battery-Electric Locomotives
Battery prototypes existing in 2022 ( 4 ) ride on two three-axle radial trucks, weigh 215 tons (36 tons per axle), and store 2.4 MWh of energy. Specification details for next-generation 7.2 MWh BELs are unclear at this writing ( 48 ), although being designed primarily for freight service, they might be quite heavy. This configuration is not optimal for commuter service, owing to weight limitations on some commuter trackage, and because three-axle trucks may not ride well at commuter train speeds.
Commuter operations with BELs normally require locomotives to be charged while operating under catenary. Although most commuter runs do not require 7.2 MWh of energy, it is typically necessary to charge at rates of around 2.4 MW to pick up sufficient charge while power is available. As grid-scale batteries typically have a C/4 charging rate ( 49 ), enough cells need to be carried to provide charging bandwidth. Future battery technologies might improve on these capabilities ( 50 ).
With current technology, we expect a 4.8 MWh BEL could be carried on two two-axle trucks using an F-40-type chassis. For our simulations, we have assumed this configuration, with the necessary charging bandwidth being provided by two 4.8 MWh BELs with 1.2 MW of charging capacity each. Where they are situated in the consist does not affect the calculations.
We assumed this hypothetical 4.8-MWh BEL weighs 148 tons, the maximum weight generally allowable on two two-axle trucks, although further design work may result in higher energy capacities or lighter axle loads. These assumptions are intended to show what should be possible assuming current or near-future technology.
Various ideas have been proposed for realizing such a hypothetical 4.8 MWh BEL. One idea that went to the conceptual design stage ( 51 ) involves reclaiming retired F-40 locomotives and retrofitting batteries within the space formerly occupied by the prime mover. In fact, this appears to be the approach taken by the current Metra procurement ( 1 ). Another idea involved reclaiming retired AEM-7 locomotives and attaching an adjacent tender for batteries. Validating these proposals, which will require prototyping, lies outside of the scope of this research.
Strategy 3: Extend Service Beyond Existing Electrifications with BELs
The benefits of BELs are not limited to new-start electrifications. They can also serve areas heretofore without commuter rail service owing to low ridership density, and expand into new territory without extending electrification.
Diesel service on Philadelphia’s commuter rail system ended in 1981 for several reasons, including lack of funding, the need for electric propulsion through the Center City tunnel (which opened in 1984, replacing the above-ground Reading Terminal), and a lack of diesel maintenance facilities owing to the institutional disaggregation of commuter and freight services (52–54 p. 63). However, communities formerly served have long expressed a desire for a return of rail service.
Markets Reached
We performed conceptual calculations (described in Methodology B, below) to determine the maximum range for BELs beyond existing electrifications, based on reasonable assumptions about consist size. The key markets of Pottstown and Quakertown, Pennsylvania, and Bound Brook, N.J., for connections to New York, could be served by BELs running round-trip services between these key destinations and Philadelphia 30th Street (Figure 10). However, the extended markets of Reading, Allentown, and Newark (N.J.) could not be reached—not because of insufficient battery capacity, but because trains would not spend enough time under the wire to recharge.
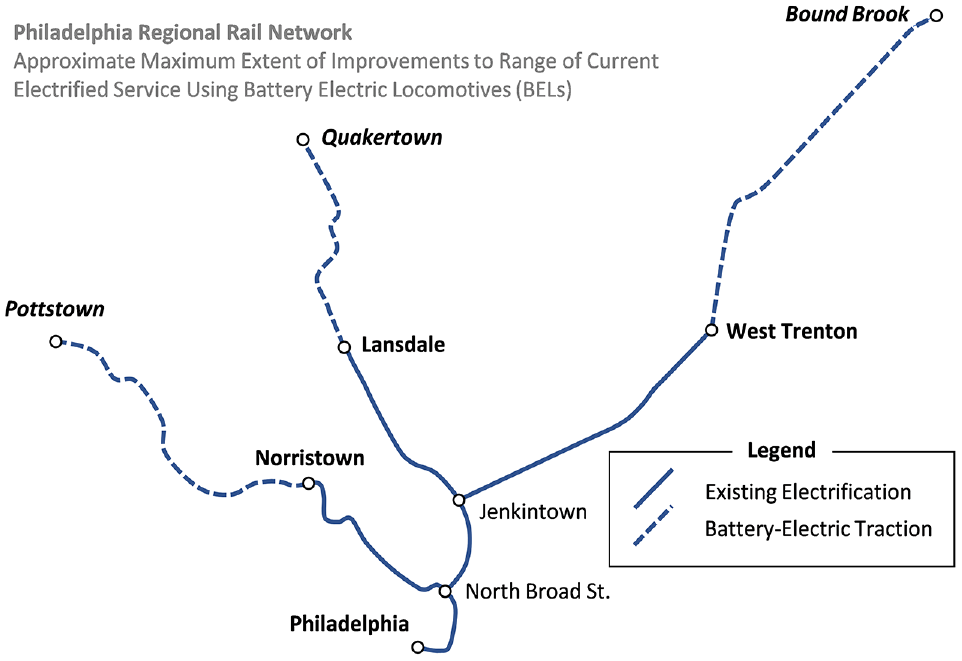
Philadelphia Reading-side case study: extension of existing electrification using battery-electric locomotives (BELs) (Strategy 3).
Strategy 4: Use BELs to Create Trans-Regional Services Spanning Electrified Zones
Services in Philadelphia have been through-routed between end points on the former Reading and Pennsylvania Railroad (PRR) sides since 1984. PRR’s extensive electrification offers BELs additional charging time. We performed further computations (Methodology B) and found that longer charging times would enable BELs to reach other key inter-regional markets beyond the normal commutershed. Regional services such as Harrisburg–West Trenton–Newark (N.J.) (H-W-N), Newark (Del.) to Allentown via Lansdale, and New York to Reading via Norristown are technically feasible (Figure 11).
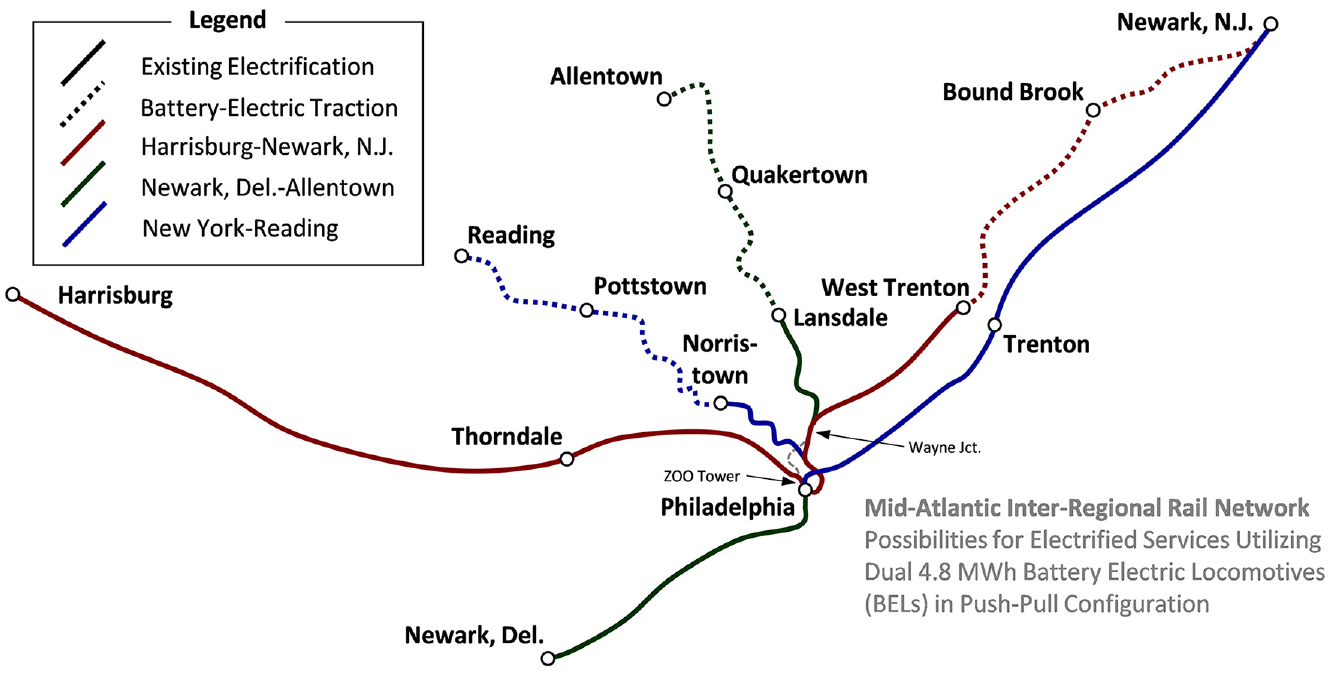
Mid-Atlantic inter-regional rail network showing battery-electric locomotive (BEL) services (Strategy 4).
Admittedly, these services are very speculative. The right-of-way north of Quakertown is today the Bucks County Rail Trail. However, as society works toward reducing GHG emissions, lines now seen as insufficiently promising may come into focus as we look for further ways to divert trips from private automobiles. Recent diesel rail planning studies have been conducted for all these corridors ( 55 – 57 ).
Implementation Issues
It might be necessary to reinforce electrical supplies, particularly on the ex-Reading Company (RDG) lines ( 28 ), to meet the power draw needs of BELs (which could peak at 5.0 MW per pair).
Structural engineering studies would determine if all infrastructure elements, particularly the 1992–1993 replacement for RDG’s 9th Street Viaduct in North Philadelphia, can accommodate the weight of BELs as presently envisioned. Similar questions were previously raised concerning dual-mode equipment ( 55 , p. 4). The weight issue might also involve the elevated structure in Manayunk, between Philadelphia and Norristown. If so, this segment could be bypassed by diverting trains onto a freight line and an industrial track paralleling the elevated structure. Again, further study would establish what might be needed.
While RDG’s 9th Street Viaduct was being rebuilt, diesel trains were operated via freight lines from Wayne Junction to the lower (Amtrak) level of 30th Street Station, Philadelphia via Zoo interlocking ( 54 pp. 76–79). This would not work for commuter service (Strategy 3) because there would not be enough charging time under the wires (although electrifying one of the tracks between Wayne Junction and Belmont for the use of BELs might make this workable). For inter-regional services (Strategy 4), this route could be revived by reinstating a track connection at Zoo ( 58 ).
Lithium-ion batteries can catch fire owing to mechanical abuse like impact and puncture, or electrical abuse such as overcharging ( 59 ). They can release toxic gases when burned, with the specific compounds released depending on battery chemistry ( 60 ). Certain chemical reactions in battery fires are not yet fully understood. Batteries are normally designed with redundant cooling systems to prevent chain reactions called “thermal runaways” that can cause fires to burn out of control, and charge management systems to prevent over-voltage conditions ( 61 ).
Special techniques in firefighting are required to control battery fires, which generally requires a large volume of water to be sprayed over a long period. The New York City Fire Department, through the U.S. Fire Administration, has promulgated guidance on these techniques ( 62 ). Although this is a relatively new field, experience from the automotive sector suggests that the overall risk of gasoline fires is nearly two orders of magnitude higher than battery fires ( 63 , 64 ). Real-world BEL operating experience is necessary to understand the risks and develop best practices.
The Center City Commuter Connection (like other urban tunnels) has special fire protection requirements. The low ventilation of the original design (based on the assumption that the tunnel would serve electrics only) currently restricts diesel operations. What restrictions might apply to BELs would have yet to be determined, although we assume for this strategy that BELs could be operated through the tunnel.
Matters of this nature are commonly associated with adopting new technologies. With the right incentives, sponsors, operators, and vendors will work together to solve them.
Operational Logistics
In addition to jurisdictional and institutional issues, logistical complications also come into play with trans-regional services. H-W-N service will likely be New York-oriented in market terms, but operationally it must be Philadelphia-based unless the Central of New Jersey is electrified between Bound Brook and Newark, N.J. Early morning trips to Newark will originate from Philadelphia rather than Harrisburg, which will require a 9.6 MWh BEL set to be fully charged overnight for each train. Advanced operational skills and perhaps computerized dispatching tools are needed for the movement bureau, to keep track of each BEL and its charge levels, ensuring that batteries are not depleted in service (see also Methodology D, below).
Figure 12 shows an artist’s concept of inter-regional BELs operating over existing electrified infrastructure. Looking northeast along the West Trenton Line at Woodbourne, a southbound inter-regional train overtakes a freight train operating in battery mode on a previously de-electrified freight track. Although new passenger equipment is shown for this new service, a new pair of BELs could also be coupled to existing Amfleet cars and Metroliner cab cars to create a low-cost starter trainset, much as Genesis P42 diesel locomotives do today in the Connecticut Valley. We envision that existing electric multiple units will continue to provide most commuter services.
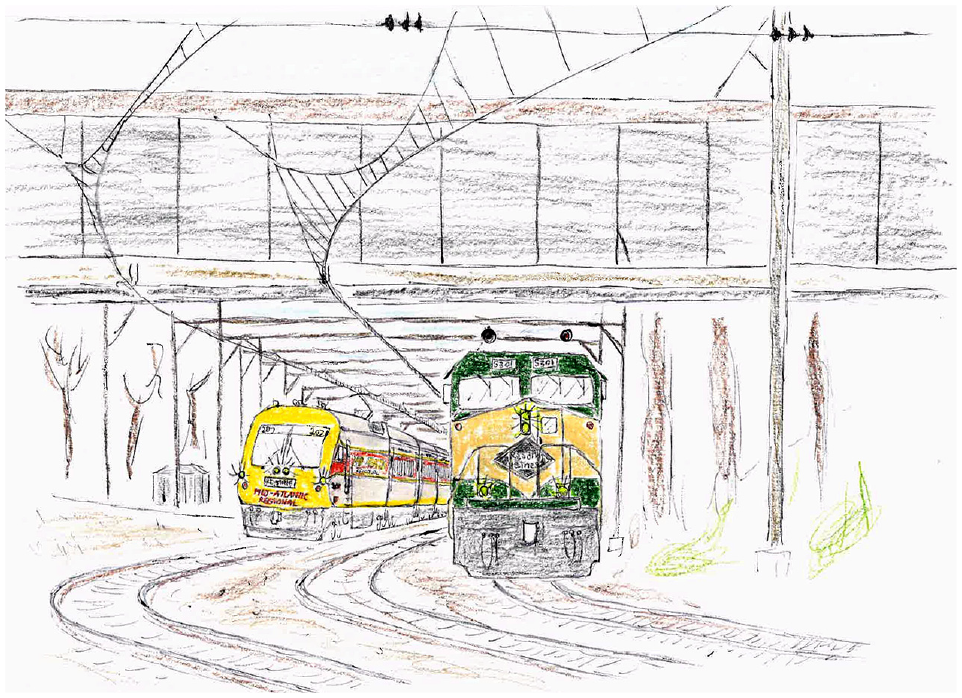
Medium-distance battery-electric trainset operating over existing electrification infrastructure in the Philadelphia area alongside a freight on a non-electrified track; artist’s concept by John G. Allen.
BELs need not charge up only on catenary segments owned by their service sponsors. Trans-regional services transcend jurisdictional boundaries and are conceptually designed for BELs to have enough range to make services feasible. Agreements will be needed for electric power charges, perhaps with auditable net-use meters on BELs that show whose units are consuming how much power on which railroad, where, when, and for what purpose (e.g., propulsion, battery charging, or regenerating power to the wires). Back offices would then settle the charges via billing mechanisms like those for trackage rights, mechanical assistance, and equipment leases.
Strategy 5: Take Advantage of Co-Located Infrastructure
Strategy 2 works well for Boston Northside. But what about larger systems like Chicago’s, where the distances between downtown terminals and most outer yards exceed the reach of a downtown substation?
To explore this issue, we first sought to prioritize lines as regards their 2018 ridership, and then followed the supply-based strategy to situate substations for maximum coverage. Line-level data on ridership and passenger-miles are shown in Figure 13, a and b . Table 5 ranks Chicago’s commuter lines by ridership intensity (millions of passenger-miles per route-mile) to identify promising opportunities. For comparison, Table 5 also includes the Electric District (electrified by the Illinois Central).
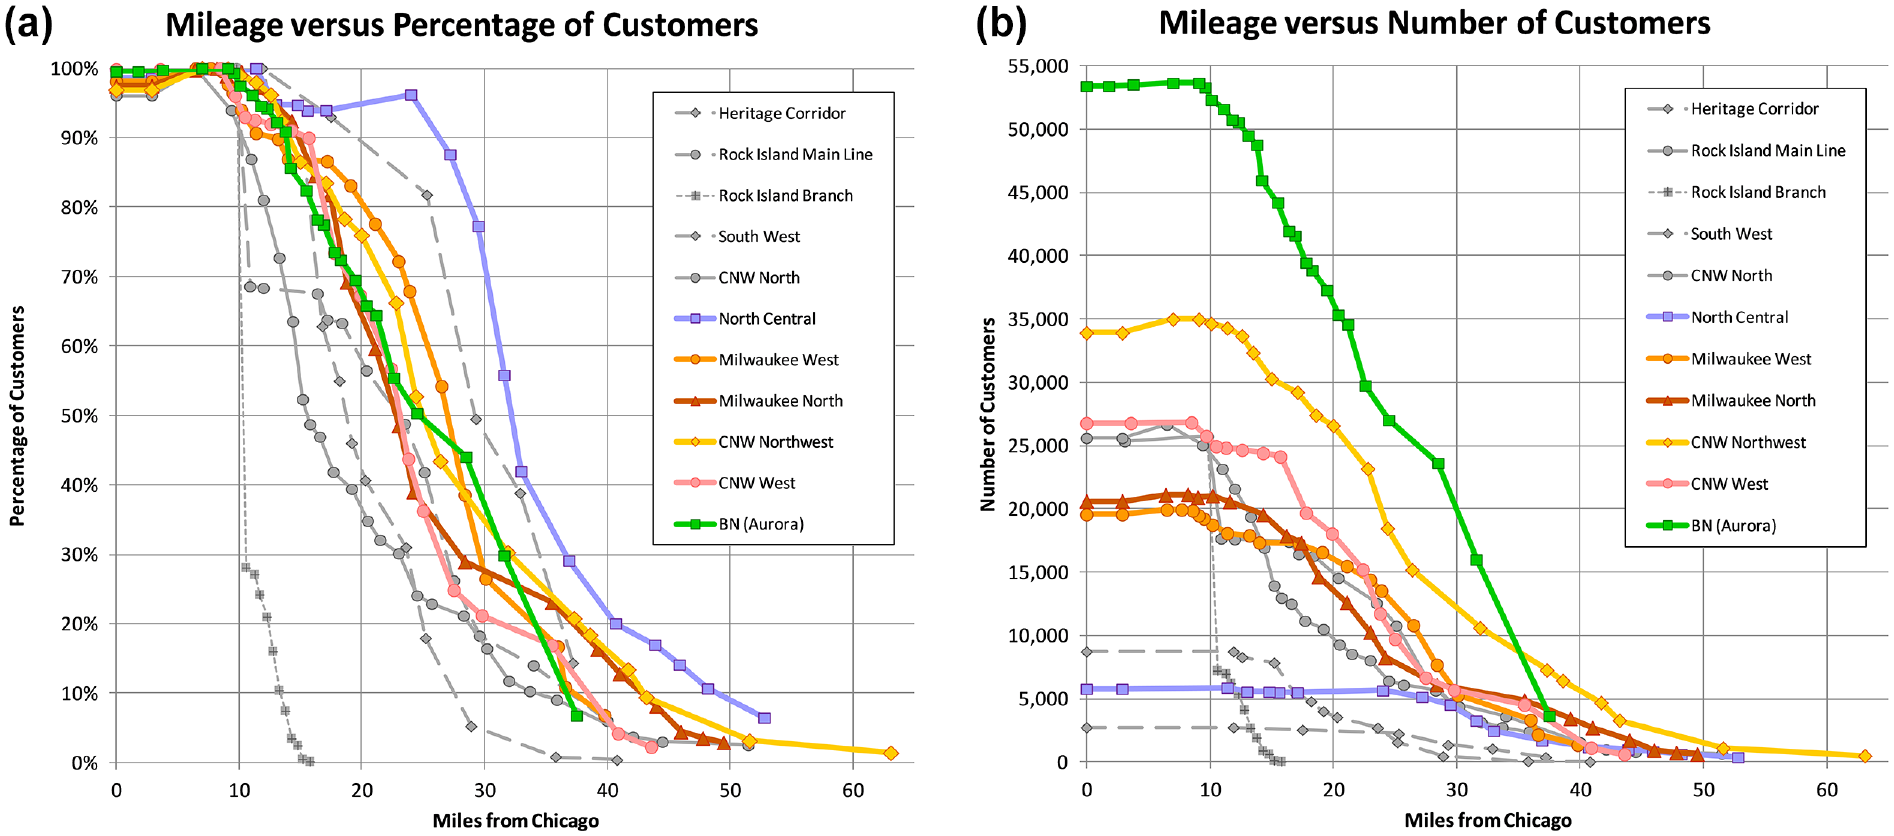
Commuter rail ridership statistics for Chicago showing visualization by line, station, and mileage, emphasizing lines selected for partial electrification case study: (a) Chicago % of ridership by line and by mile, (b) Chicago ridership count by line and by mile.
Basic 2018–2019 Data for Evaluating Chicago Electrification Possibilities
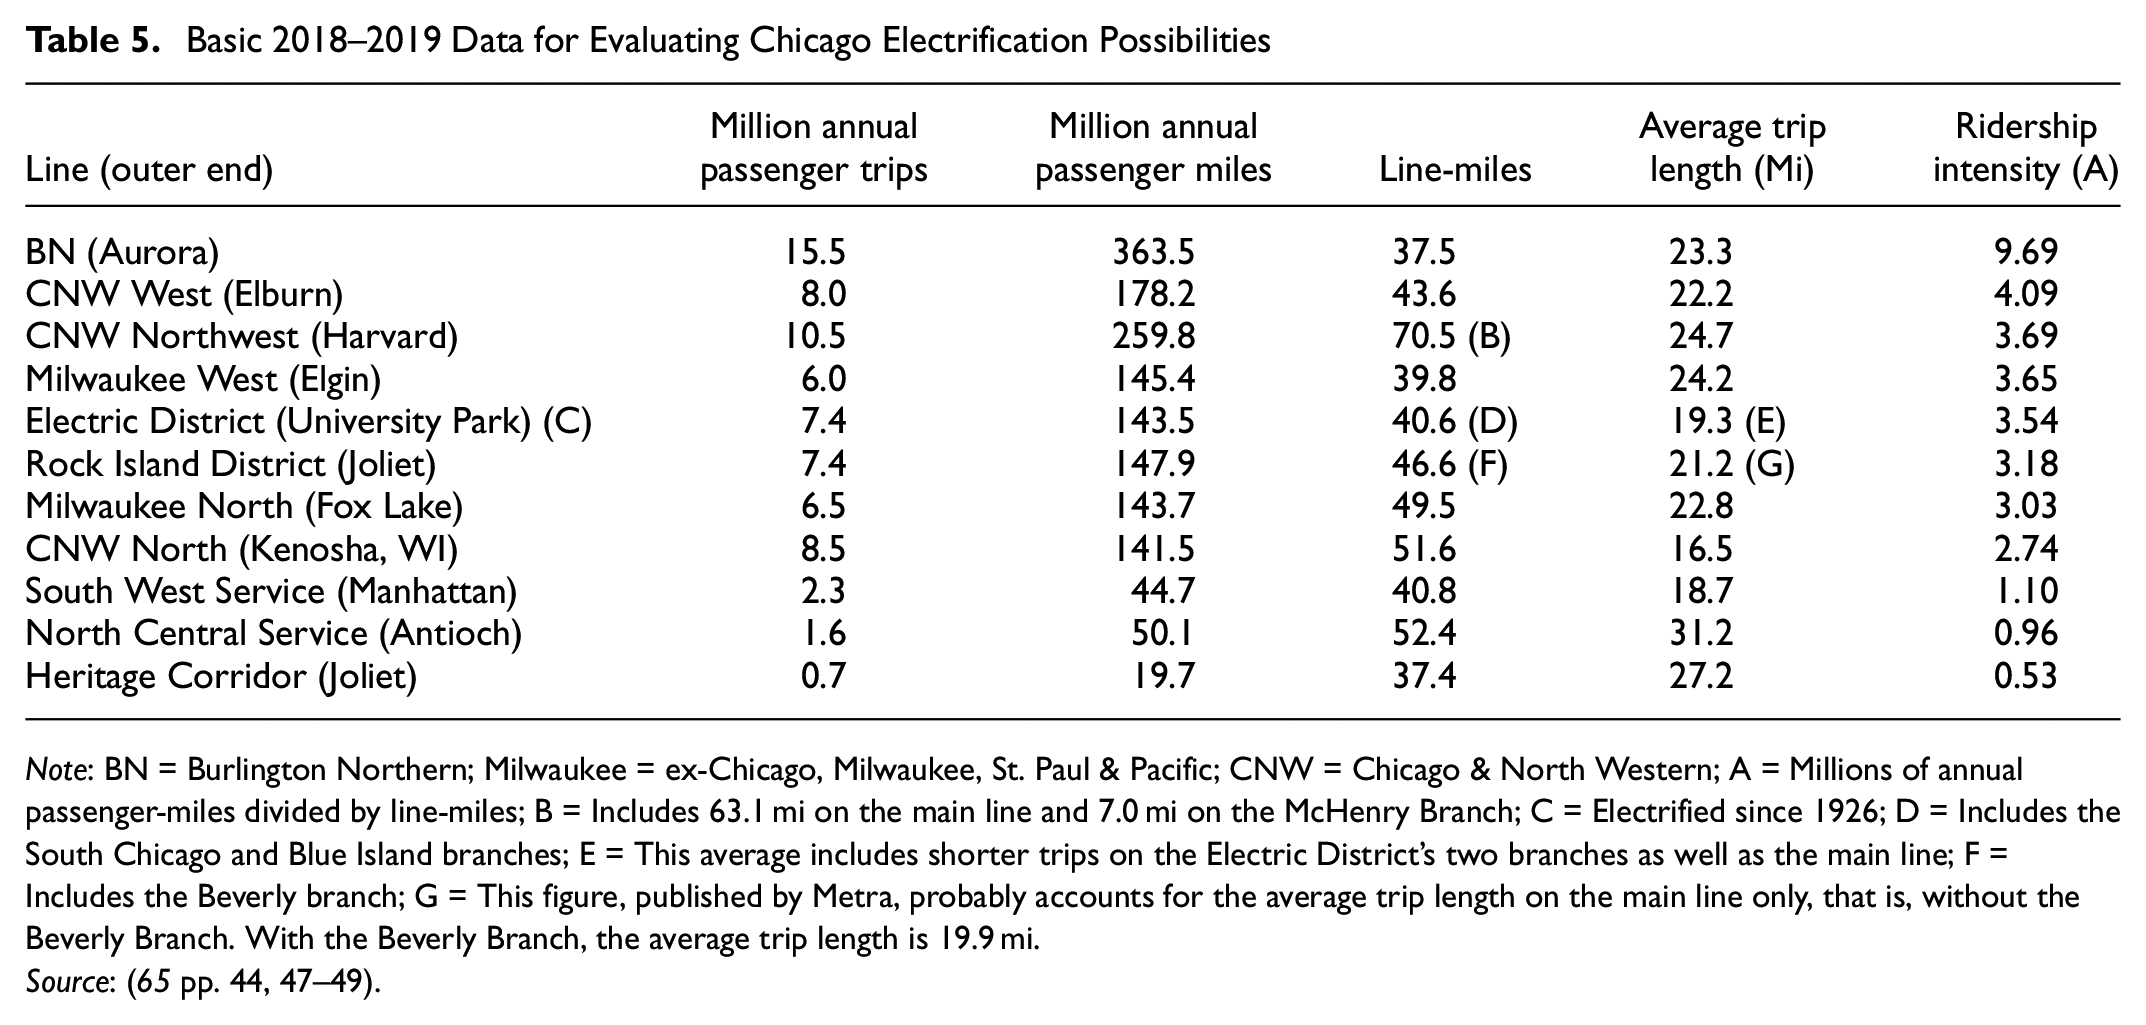
Note: BN = Burlington Northern; Milwaukee = ex-Chicago, Milwaukee, St. Paul & Pacific; CNW = Chicago & North Western; A = Millions of annual passenger-miles divided by line-miles; B = Includes 63.1 mi on the main line and 7.0 mi on the McHenry Branch; C = Electrified since 1926; D = Includes the South Chicago and Blue Island branches; E = This average includes shorter trips on the Electric District’s two branches as well as the main line; F = Includes the Beverly branch; G = This figure, published by Metra, probably accounts for the average trip length on the main line only, that is, without the Beverly Branch. With the Beverly Branch, the average trip length is 19.9 mi.
Source: ( 65 pp. 44, 47–49).
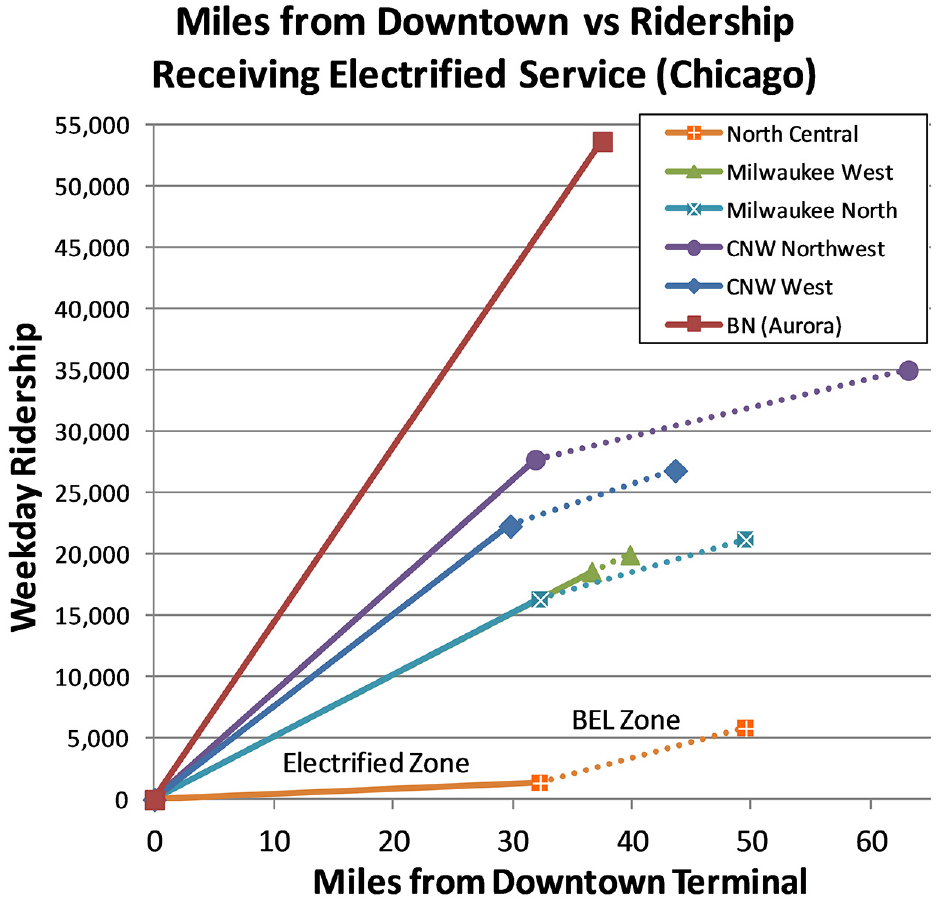
Burlington Northern (BN)’s Chicago–Aurora line (the first in Table 5) jumps to the fore, not simply because it is Chicago’s busiest line, but also because it has the most passenger-miles and stands far above all others in ridership intensity. This 37.5-mi line carries about as many riders as Caltrain does between San Francisco and Tamien, just beyond San Jose, California—a 52-mi line being electrified at this writing with two supply substations. A suburb southwest of Aurora has long sought an extension of service, despite being outside the commuter rail agency’s service area.
Given the intensive Chicago–Aurora ridership, we sought to electrify the entire line with a single substation, enabling service with EMUs. Figure 14 shows an artist’s concept of bi-level alternating-current EMUs operating on the Burlington Northern, with long pantographs to support shared-track operations with double-stack container trains.
Bilevel gallery electric multiple-unit (EMU) cars operating on electrified infrastructure with clearances for double-stack container trains in Chicago; artist’s concept by John G. Allen.
From there, we looked for other opportunities. Not far away lies the Chicago & North Western (CNW) West Line. Could we power both from the same substation?
As it turns out, the maximum range of 25 kV catenary allows one substation to serve both lines. A 138 kV transmission line runs parallel to the Tri-State Tollway (Interstate 294) in Elmhurst, Illinois ( 67 ). Putting a substation on a water-authority property (East Harrison St., Elmhurst) along the transmission line could provide 25 kV power to both the Chicago and Aurora ends of the line (Figure 15), for 53,655 weekday trips (Table 6 and Figure 16). Of course, such a strategy would require negotiating an access agreement and lease with the utility company (comparable to a trackage rights agreement between railroads) and an intergovernmental agreement with the water authority. It is a fortuitous coincidence that the CNW West is the second most intensively traveled line in the system, but it was chosen not for its ridership but for its geographic ease of electrification.

Chicagoland North and West case study, first phase: Elmhurst substation and suburban utility corridors.
Electrification performance metrics for Chicagoland North and West Case Study
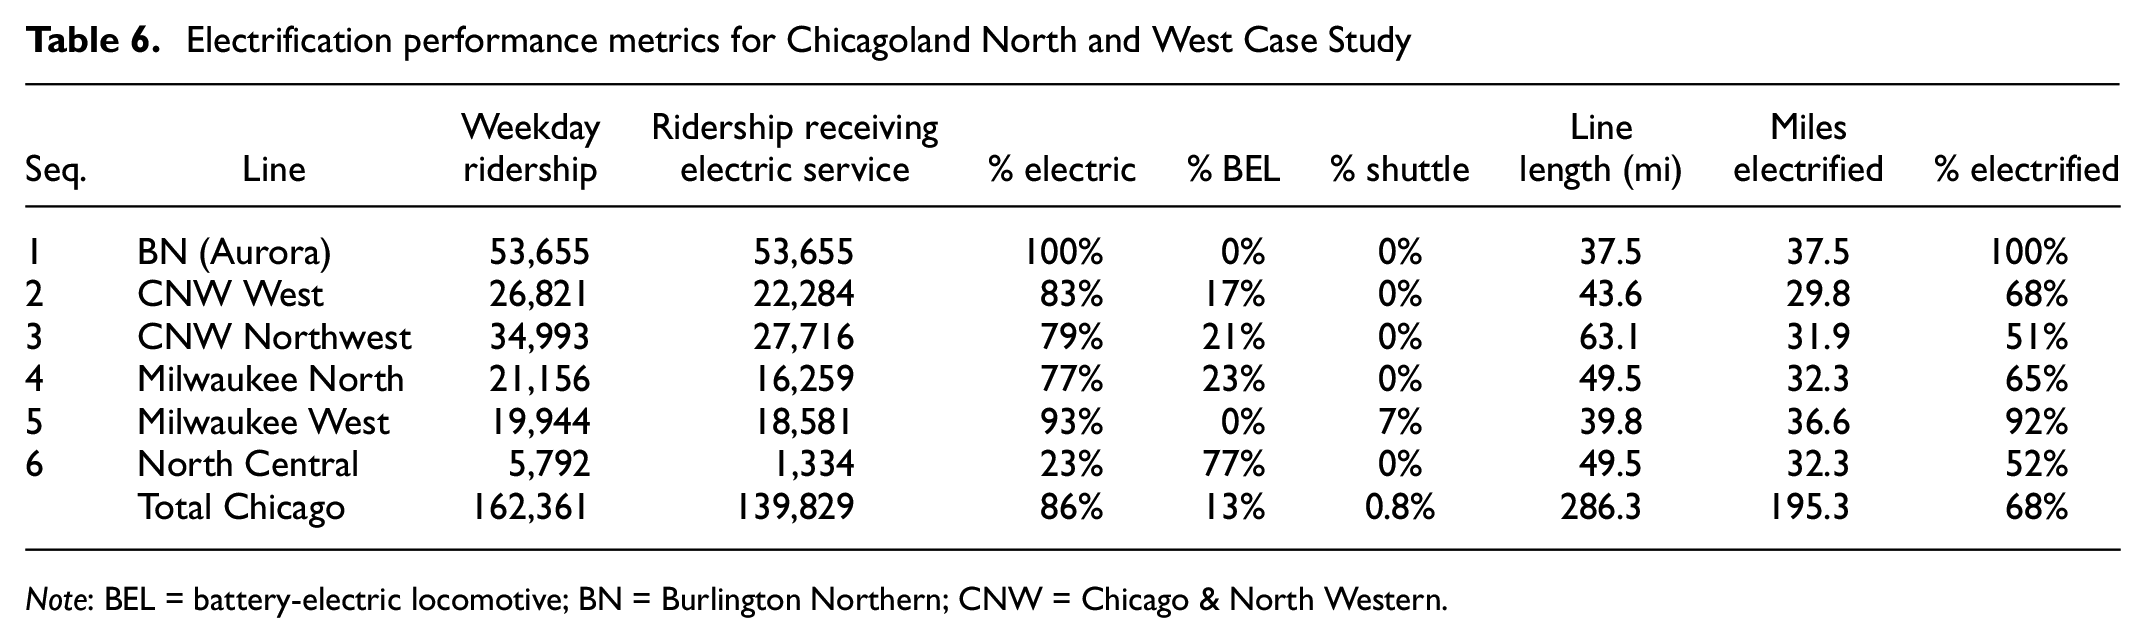
Note: BEL = battery-electric locomotive; BN = Burlington Northern; CNW = Chicago & North Western.
Distance–ridership relationship for Chicago North and West case study.
For the CNW West, electrification could reach beyond West Chicago, but not as far as the next equipment yard at Elburn. Thus, straight electrics would operate as far as West Chicago (22,284 weekday trips, 83% of total ridership) and BELs to Elburn (4,537 trips, 17%). Thanks to existing utility corridors along the highway, it would be relatively straightforward to add an electrical feeder to reach both rail lines. We verified that BELs would have sufficient range to reach Elburn Yard using the energy assessment model noted previously (Methodology B).
Based on this electrification plan, it might be desirable to operate more frequent local service in the electrified zone, with BEL express trains that skip some stops traveling beyond. This is a normal part of schedule re-casting in response to capital investment. BEL trains may carry passengers locally within the electric zone based on ridership needs, much as New York’s Wassaic or New Jersey’s Bay Head trains do.
Suburban Utility Corridors
Utility corridors are reasonably common throughout North American metropolitan areas, but because they are not rail facilities, they are not always obvious solutions for commuter rail electrification. However, by routing railroad-owned power lines within existing utility corridors, rail networks may be electrified at lower cost than by constructing substations for each line separately. The Department of Homeland Security has a geographic dataset showing most high voltage transmission lines and corridors in the United States ( 67 ).
Using this approach, it may be possible to co-locate a supply substation near Deval, a crossing between CNW’s Techny Cutoff freight line, CNW Northwest, and the North Central Service (NCS). The CNW Northwest is the third most intensively used line in the system and lies directly on the proposed Deval substation, making it an obvious candidate for electrification. We propose electrifying the CNW Northwest as far as Barrington, a major equipment storage point. BELs can operate beyond there in battery mode.
Deval is also served by existing 138 kV transmission lines and utility corridors (Figure 17). What else can be electrified from Deval? The nearest major line is the Milwaukee North, which can be readily electrified to Rondout, north of Lake Forest, where space is available to site a yard (there is only one existing yard at Fox Lake, the outer end of the line). These core suburban markets on the CNW Northwest and the Milwaukee North would receive straight-electric service (77% and 79% of line ridership respectively), with one-seat rides to the outer suburban areas using BELs. The link between Deval and the Milwaukee-North uses an existing utility corridor that intersects the line in Morton Grove.
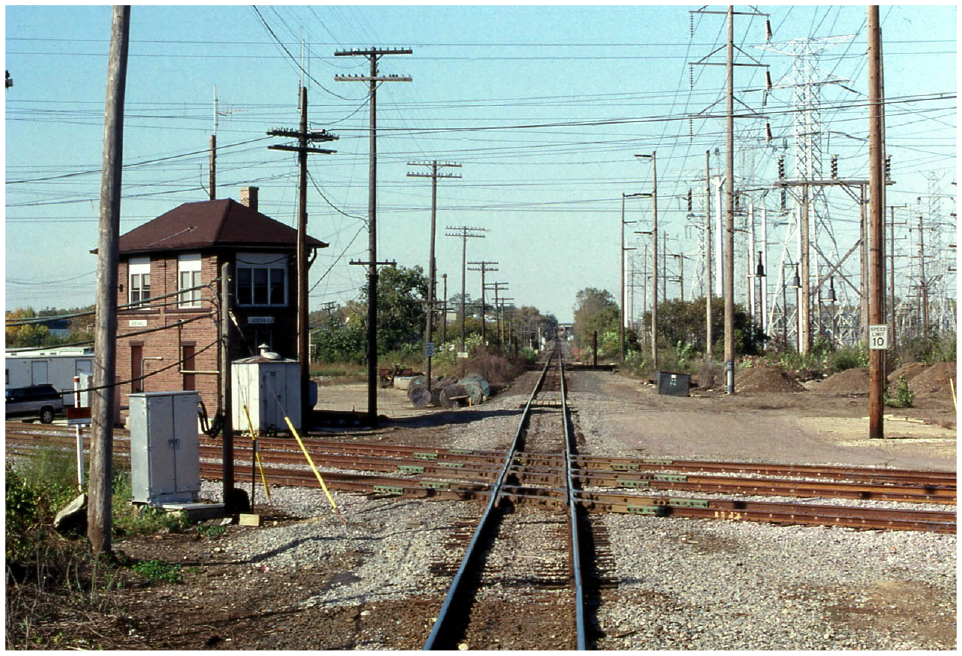
Deval Crossing, seen from a North Central Service train just north of the CNW Northwest Line, 1990, David Wilson photo (CC BY 2.0).
Figure 18 shows an artist’s concept of a combination of an outer-suburban BEL-hauled train and inner-suburban EMUs operating on the CNW-Northwest Line near downtown Chicago (note the left-hand running characteristic of CNW).
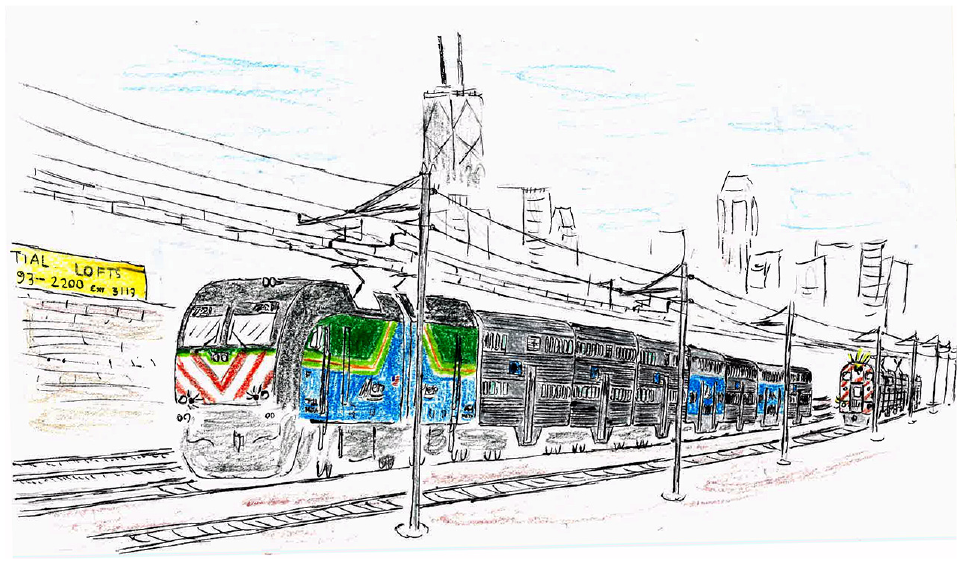
Metra BELs pushing a peak-hour outer suburban express on the Chicago & North Western (CNW)-Northwest Line, passing an inner suburban electric multiple unit (EMU); artist’s concept by John G. Allen.
Powering Additional Lines and Improving Resiliency
But the electrification opportunities involving Deval do not end with just those two lines. We can supply the Milwaukee West Line as far as Elgin, including the equipment storage yard, although not necessarily the remaining 3.2 mi to Big Timber. This was unfortunate, as the 7% ridership at Big Timber would have to be served by a battery-EMU shuttle. However, if a future regional service was developed, it might be possible to serve Big Timber with regional BEL trains (see Strategy 6).
We electrified the Milwaukee West aggressively, even though it has less slightly less ridership than the Milwaukee North, because it has no intermediate yards nor an obvious location for adding one. To have any electric service requires electrification to the outer-end yard at Elgin (an important destination in its own right).
Alternatively, depending on the findings of electrical engineering studies, the electrification range might be increased slightly, either by allowing a larger than normal voltage drop or marginally increasing the line voltage. The link from Deval to the Milwaukee West follows the existing Techny Cutoff railroad alignment. The link between the Elmhurst substation and the Milwaukee West uses Interstate 294 and an existing railroad between two major freight yards.
By having the electrification system’s two primary substations on a “ring” around the metropolitan area, it provides a level of resiliency unavailable with other designs. Should one supply substation drop out for any reason, it may be feasible to supply all lines from the other substation through a cross-feed, perhaps subject to power reduction orders. This would need to be confirmed by detailed design calculations.
BN and Milwaukee West aside, the other lines have or could readily have intermediate yards, with sufficiently strong ridership beyond there to warrant BEL services directly from downtown. This allowed us to save significant catenary mileage. Because a combination of existing transmission lines and BN’s particularly intensive ridership drove the substation location process, there was no obvious way to move the substation outward a few miles to accommodate the Milwaukee West all the way to Big Timber. Further study may suggest other locations that satisfy all other constraints while comfortably powering the entire Milwaukee West.
Having added Milwaukee West, it now makes sense to electrify the North Central Service (even though Table 5 ranks it next to last in ridership intensity) to Wheeling, based on daily diesel train-miles (DDTM) eliminated. From Wheeling, BELs can reach the outer terminal at Antioch. Although the NCS has a lower ridership density than the other lines, it shares tracks with the Milwaukee West between Tower B-12 and downtown, which in fact gives the NCS the highest electrification productivity of the six lines as regards DDTM eliminated per catenary track-mile (Table 7). With just two substations, we can electrify one line fully, and most of five others, with much greater economy of investment than if we tried to electrify these lines in their entirety.
Comparative Electrification Productivity at Line Level, Chicago North and West
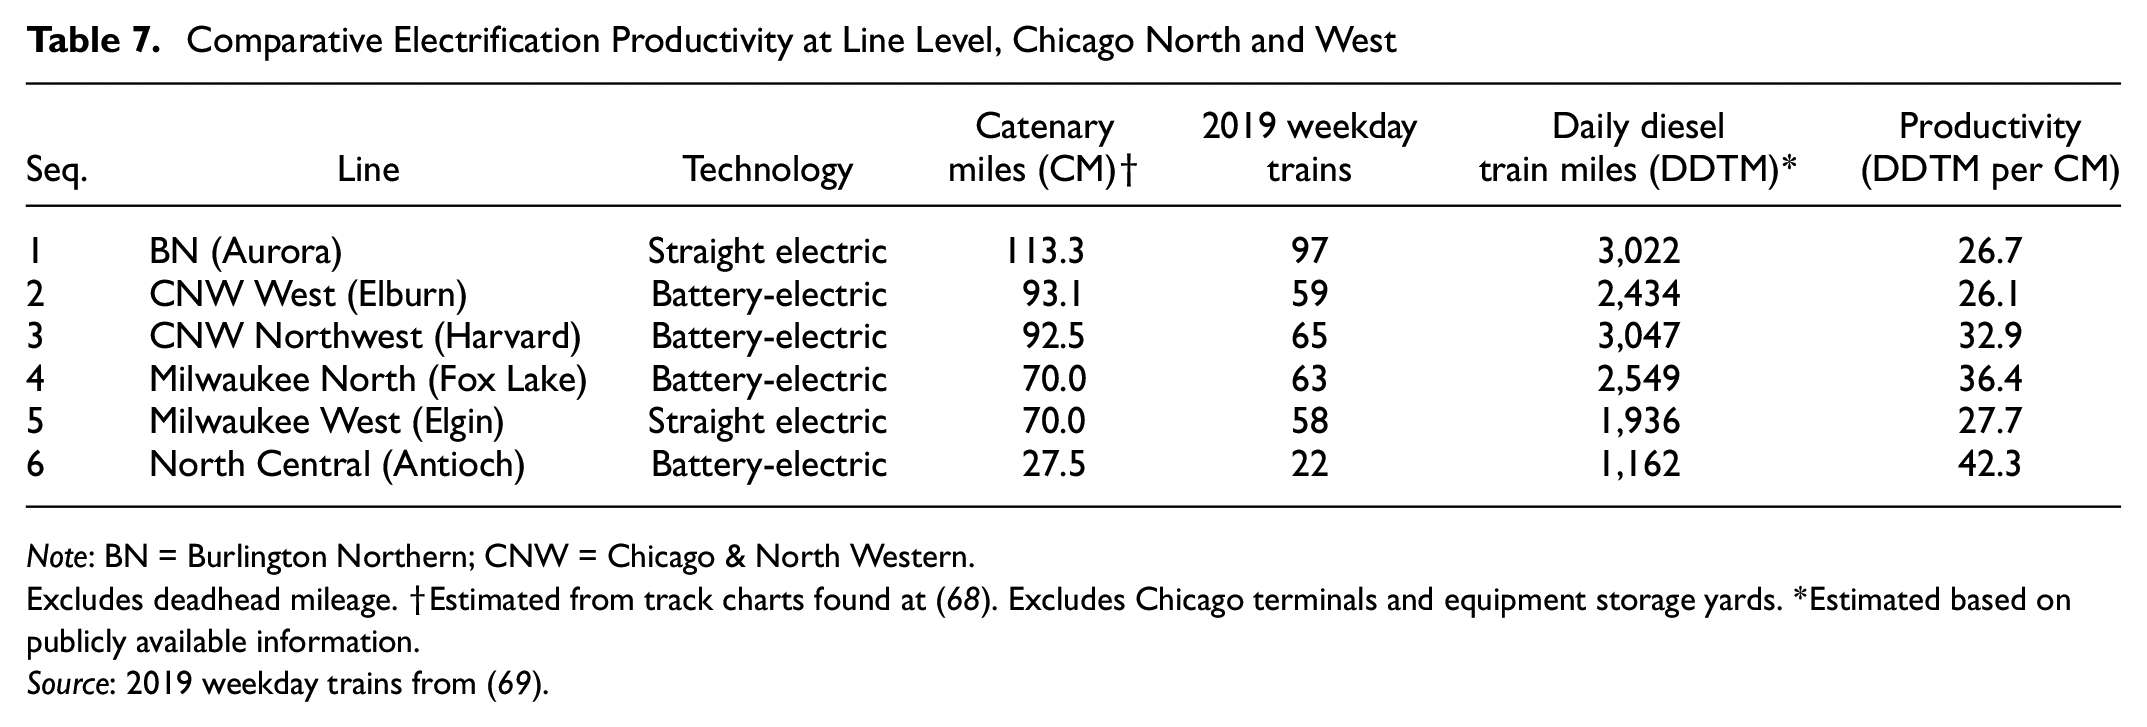
Note: BN = Burlington Northern; CNW = Chicago & North Western.
Excludes deadhead mileage. †Estimated from track charts found at ( 68 ). Excludes Chicago terminals and equipment storage yards. *Estimated based on publicly available information.
Source: 2019 weekday trains from ( 69 ).
This demonstrates the network effect, where it becomes cheaper to add light-density branches (which would otherwise never justify electric service) to an existing network, if most lines are already electrified. Indeed, this may be Boston’s strategy with the planned Fairmount Line electrification, by connecting new catenary to the Northeast Corridor’s existing Sharon, Massachusetts supply substation.
Table 8 shows our working service plan assumptions for all six lines in the Chicago North and West case study. At first, electric locomotives in push-pull mode would be used to provide service with existing coaches, but depending on their remaining useful service life, EMUs may eventually replace them on the BN Line and on inner-suburban segments elsewhere with high ridership densities. Figure 19 shows all the lines to be electrified, with supply substation and feeder line locations.
Operating and Service Plan Details for Chicago North and West Case Study
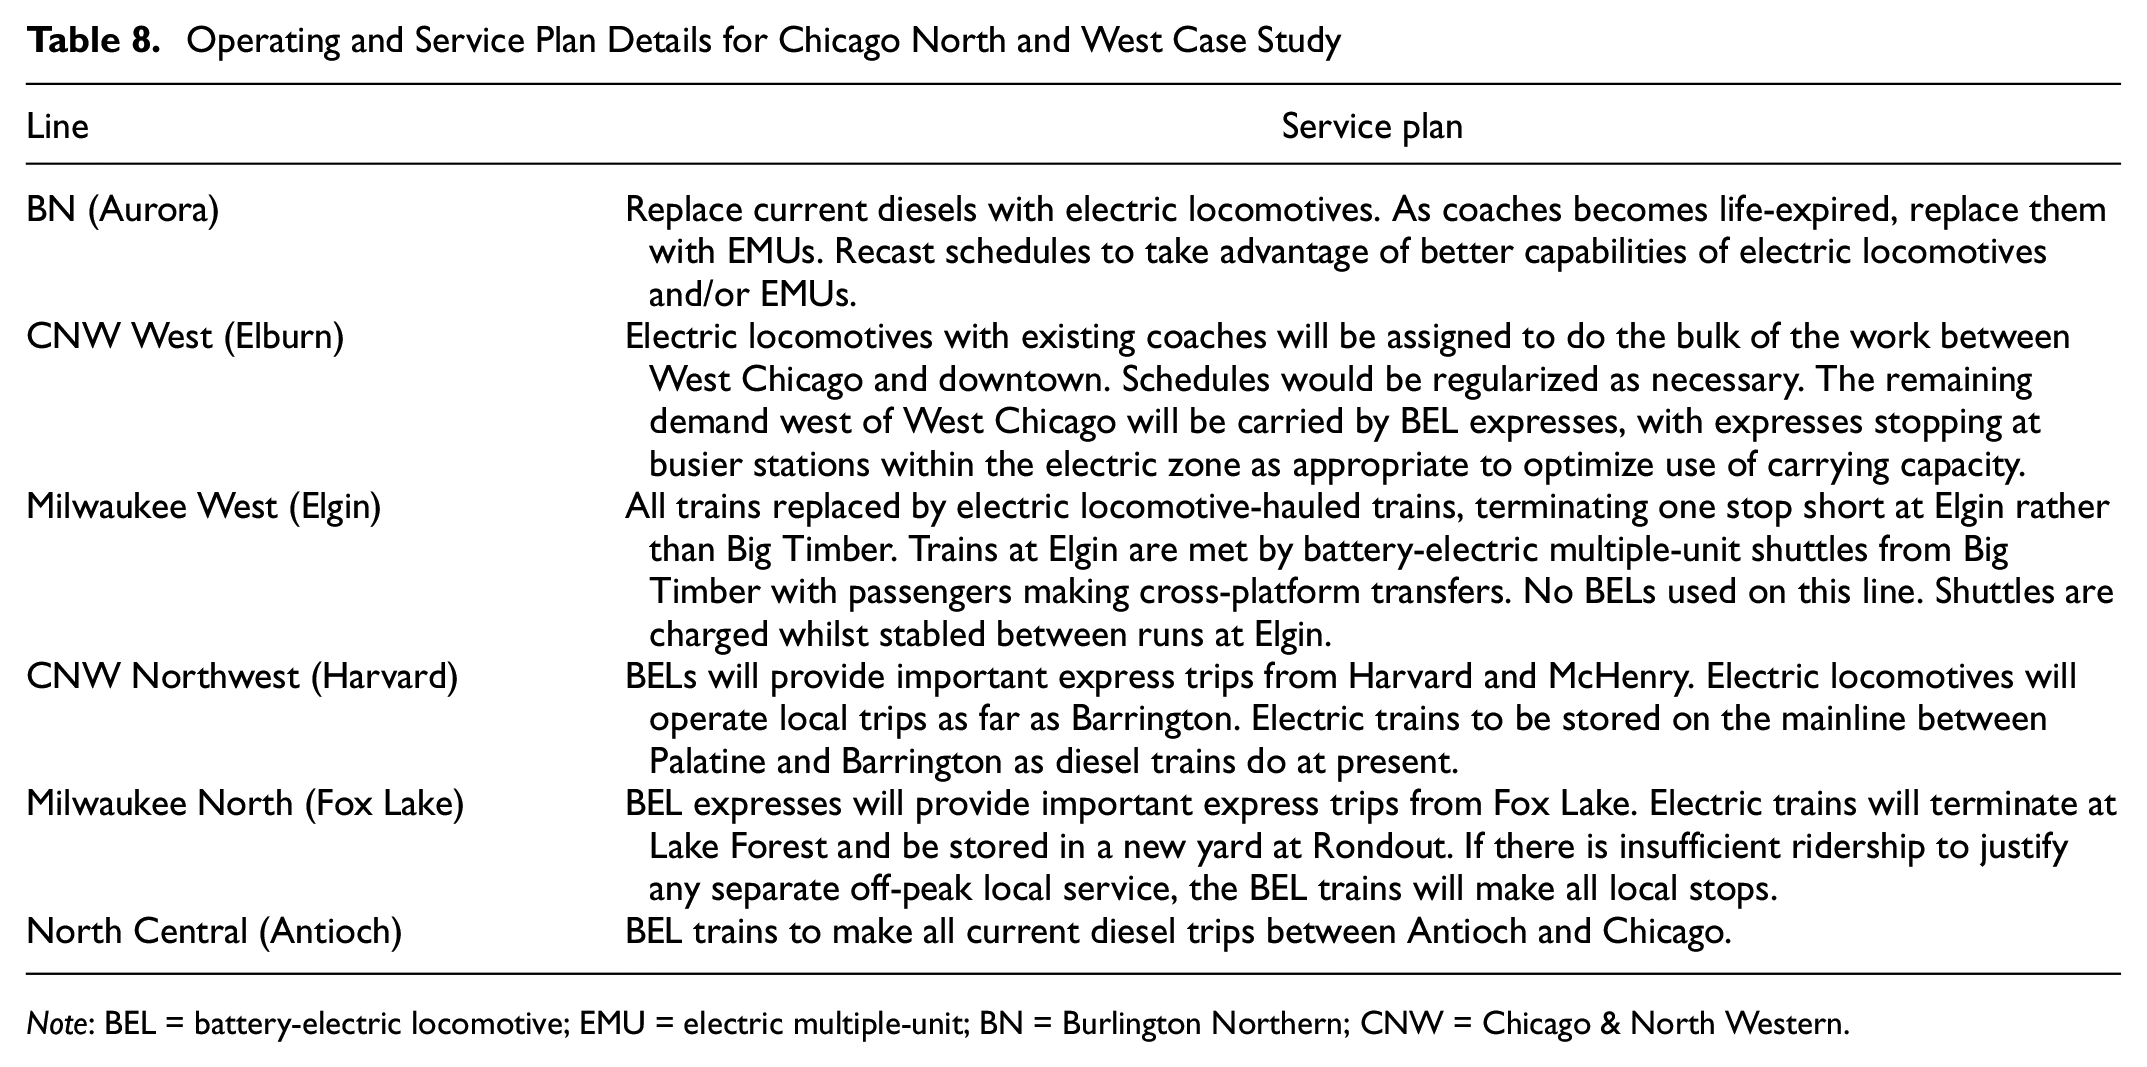
Note: BEL = battery-electric locomotive; EMU = electric multiple-unit; BN = Burlington Northern; CNW = Chicago & North Western.
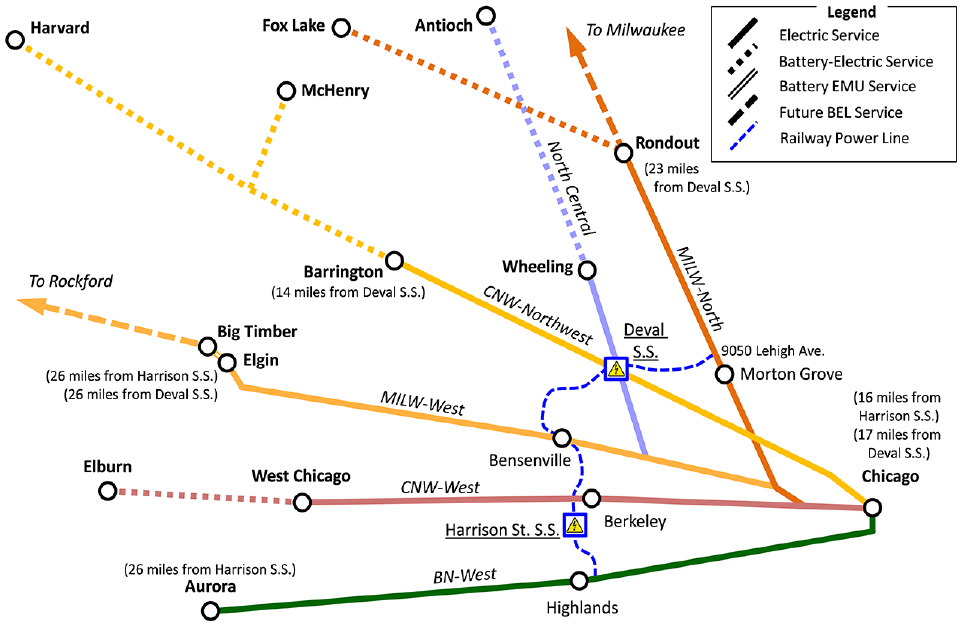
Chicagoland North and West case study, second phase: feasible extent of electrification from two supply substations.
Strategy 6: Charging Pads
Another option is to build “charging pads” at outlying terminals to charge batteries during layover periods, further reducing the track mileage requiring electrification. This makes sense when suitable transmission substations are relatively close to outlying yards, such that one or two dedicated 11.3 kV three-phase distribution circuits can be brought in to provide 3.0/6.0 MW of charging capacity. Charging pads can also extend an existing installation’s effective range, at the expense of reducing trainset utilization owing to the unproductive downtime when sets are held to charge at rest.
One possible use case for a charging pad is where BELs are used on commuter lines with no weekend service. Fairly substantial shore power supplies would be required to keep head-end power (HEP) on in the coaches during weekend layovers (to avoid draining power from the BEL). Concerning power rating, shore power requirements for several stabled sets can be comparable to a charging pad. Figure 20 summarizes situations where charging pads are and are not needed for trains worked on a commuter rail service pattern.
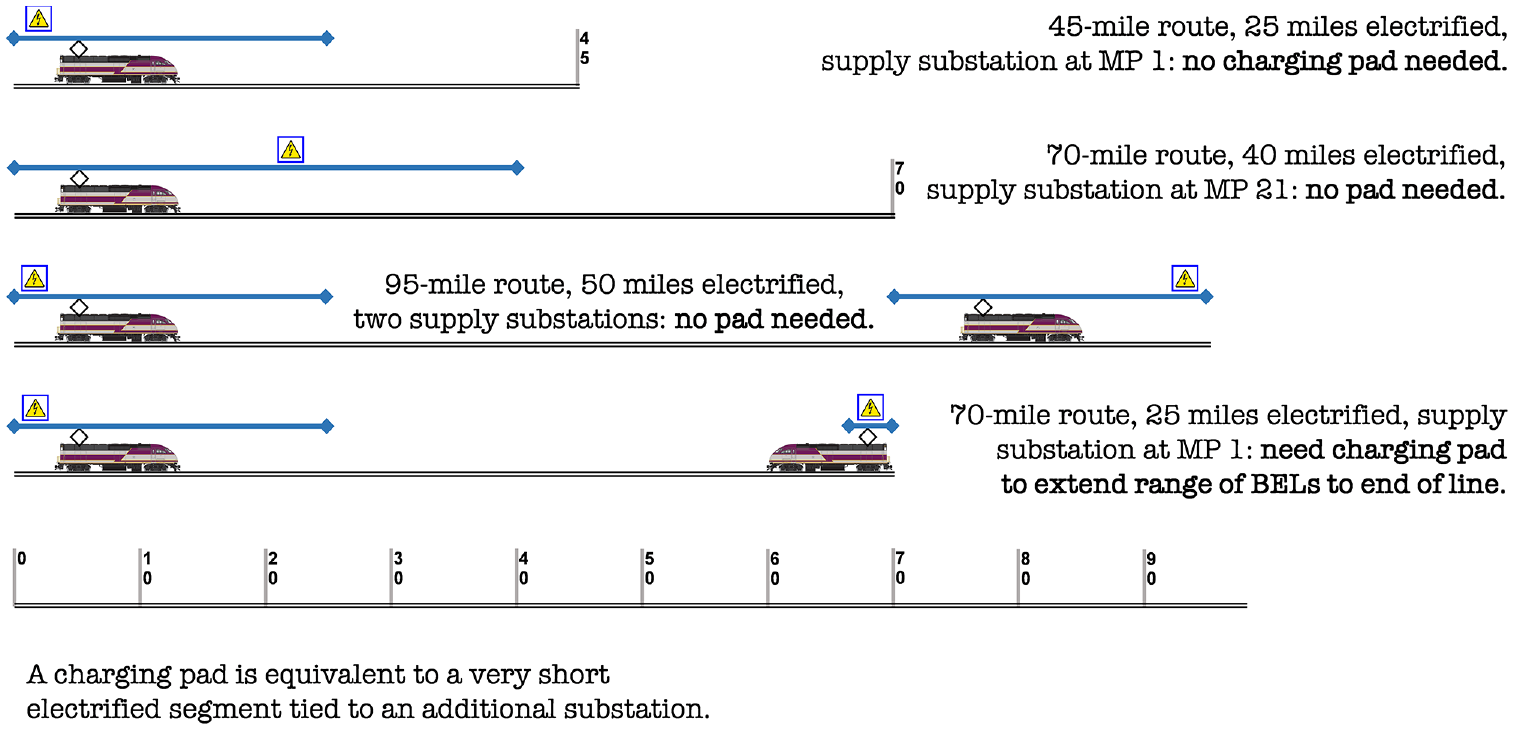
Suitability of charging pads with battery-electric locomotives (BELs) in commuter service.
Charging pads are most likely to find their ideal applications in regional services that extend beyond the normal daily commutershed, where the distances involved mean that locomotives cannot make an out-and-back trip on one charge, but the service does not terminate in a large metropolis with its own commuter rail system that justifies its own electrification. In busy suburban service, which is the primary subject of this paper, it is almost always better to extend the electrification marginally beyond the current terminus, to avoid fragmenting the network and avoid having to construct an expensive substation purely for supplying a charging pad, when the budget for that substation could be better invested in incrementally extending the existing electrified network, which will have a higher expected utilization.
Potential Applications to Regional Services
Logistical arrangements from regional services are different from suburban services; it may be necessary to supply fully-charged BELs before departure, necessitating extended turnaround times at both the city end and the outer terminus. Two fully-charged 4.8 MWh BELs with 350 tons of trailing load traversing average terrain with average curvature will have a range of about 200 mi, but to avoid stranding passengers the useful range is likely to be capped at 120 mi by operations management.
Table 9 shows some rules-of-thumb for planning purposes as to when charging pads will be needed when planning BEL-hauled services, although because BELs’ actual range can be sensitive to terrain, curvature, and payload, plans made based on these criteria should be subject to further verification (using Methodology B, below).
Rules of Thumb for Planning Operating Ranges of Battery-Electric Locomotive (BEL)-enabled Services
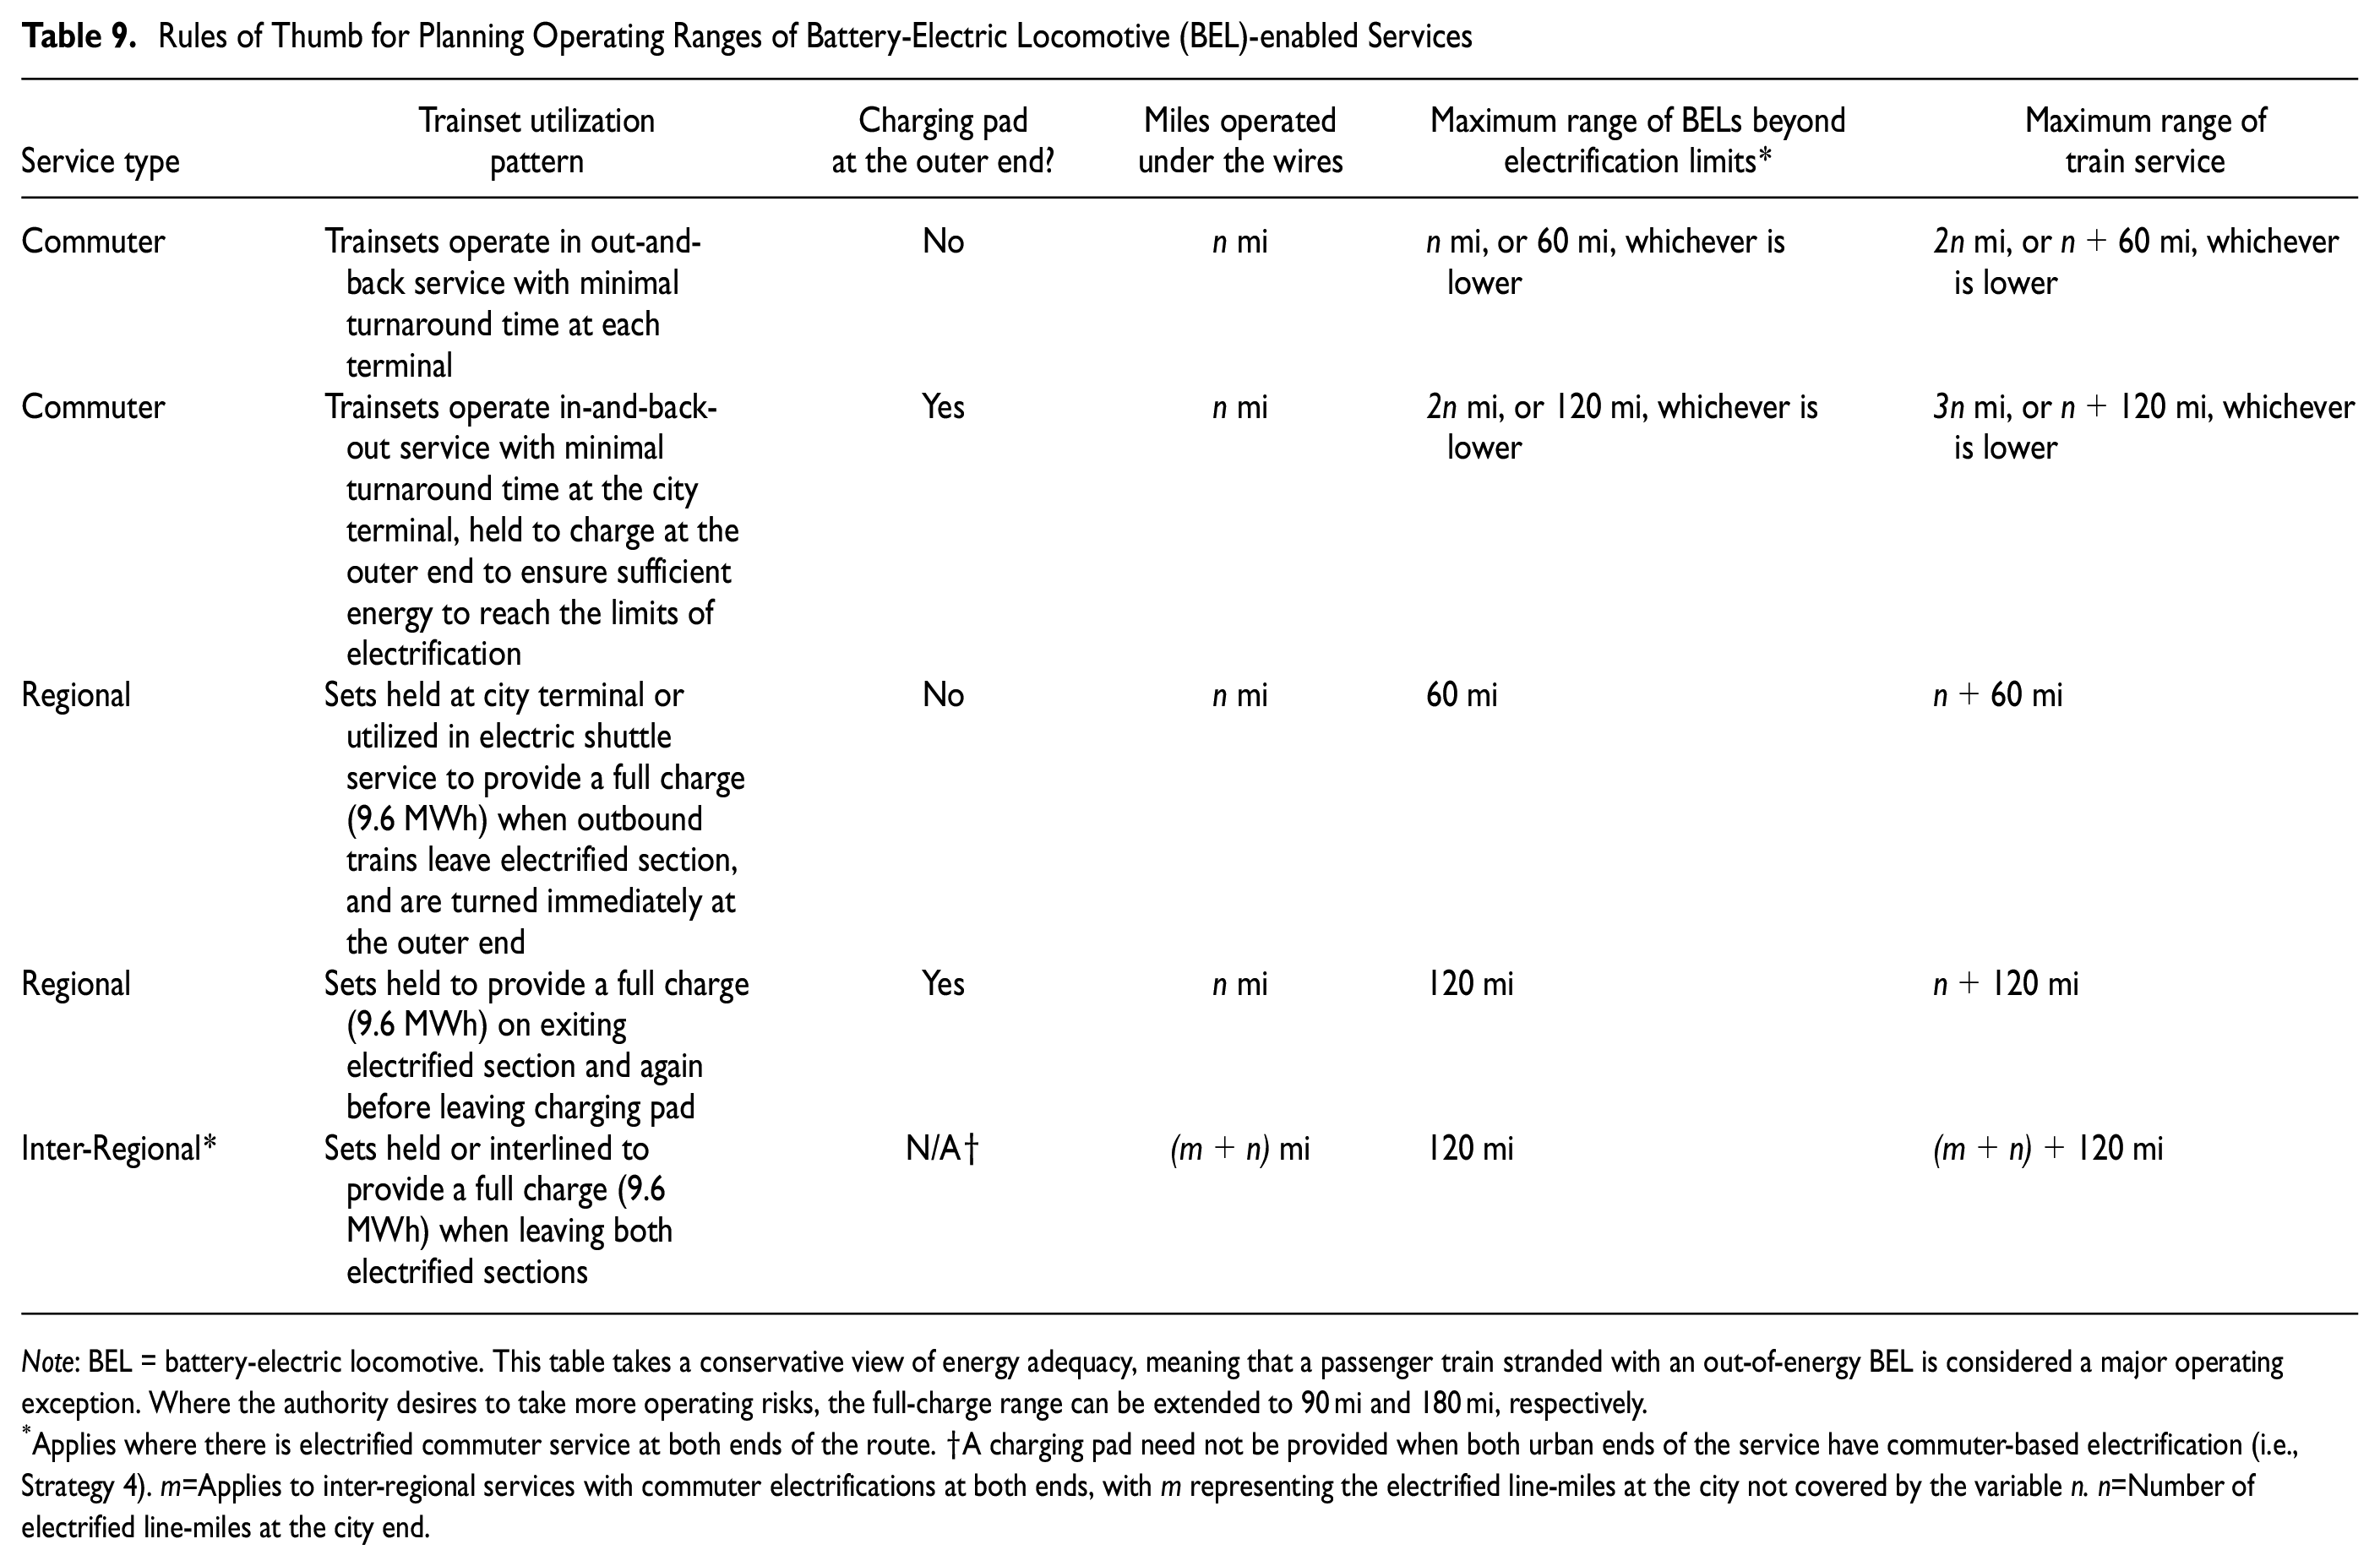
Note: BEL = battery-electric locomotive. This table takes a conservative view of energy adequacy, meaning that a passenger train stranded with an out-of-energy BEL is considered a major operating exception. Where the authority desires to take more operating risks, the full-charge range can be extended to 90 mi and 180 mi, respectively.
Applies where there is electrified commuter service at both ends of the route. †A charging pad need not be provided when both urban ends of the service have commuter-based electrification (i.e., Strategy 4). m=Applies to inter-regional services with commuter electrifications at both ends, with m representing the electrified line-miles at the city not covered by the variable n. n=Number of electrified line-miles at the city end.
We performed no modelling to verify these use cases, but below are some random examples of potential markets for charging pad-enabled regional services. Charging pads are of limited help for commuter services because of the need for short turnaround times at the outer ends.
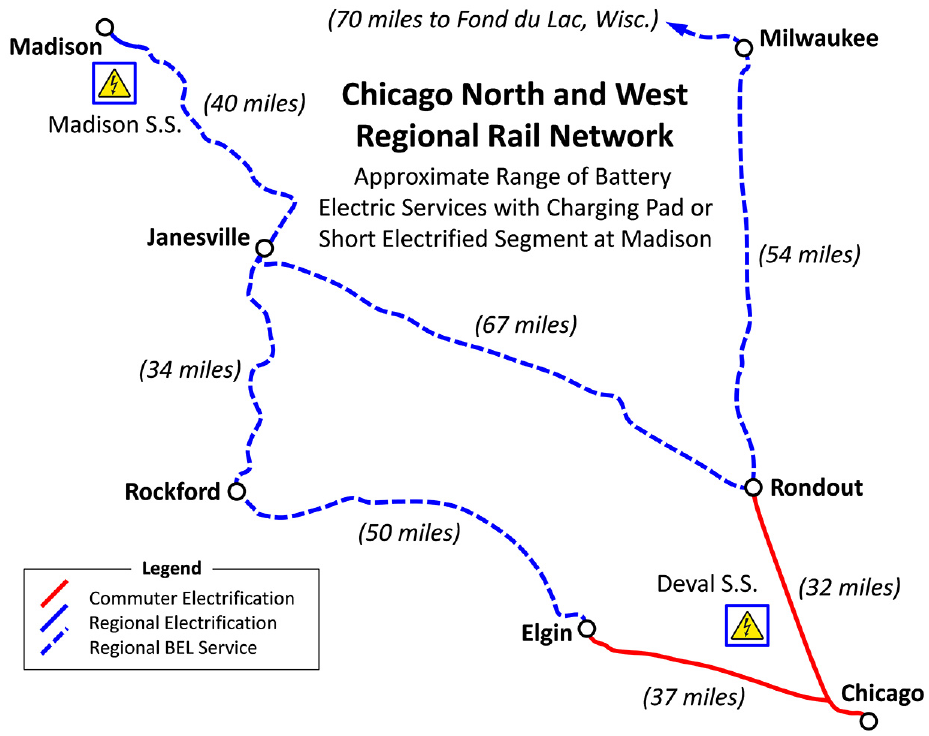
Chicago North and West Regional Service
In Strategy 5, we electrified the Milwaukee District as far as Rondout and Elgin, the maximum prudent extent based on two supply substations located in suburban Chicago required to support commuter service. If we assumed regional service patterns of trainset utilization, how much further can we push out the service and what other infrastructure would we need to support them?
Figure 21 shows a summary of what services are possible. Rondout is 32 mi from Chicago Union Station (CUS). The remaining 54 mi to Milwaukee can be covered on a round-trip basis by fully charged BELs leaving the electrified district northbound at Rondout. By operating the equipment strictly on an out-and-back basis, we find that BELs can operate the existing regional service to Milwaukee with no additional infrastructure. However, if service was extended 70 mi beyond Milwaukee to Fond du Lac, Wis., it would be necessary to install a charging pad there, because the 124 mi between Rondout and Fond du Lac is at the upper limit of a one-way trip with fully charged BELs. Similarly, Madison, is 107 mi from Rondout. A charging pad at Madison would enable service (artist’s concept, Figure 22) to be operated to and from Chicago via Rondout.
Chicagoland North and West case study, regional rail phase: feasible extent of electrification from existing regional rail electrification and one or two charging pads.
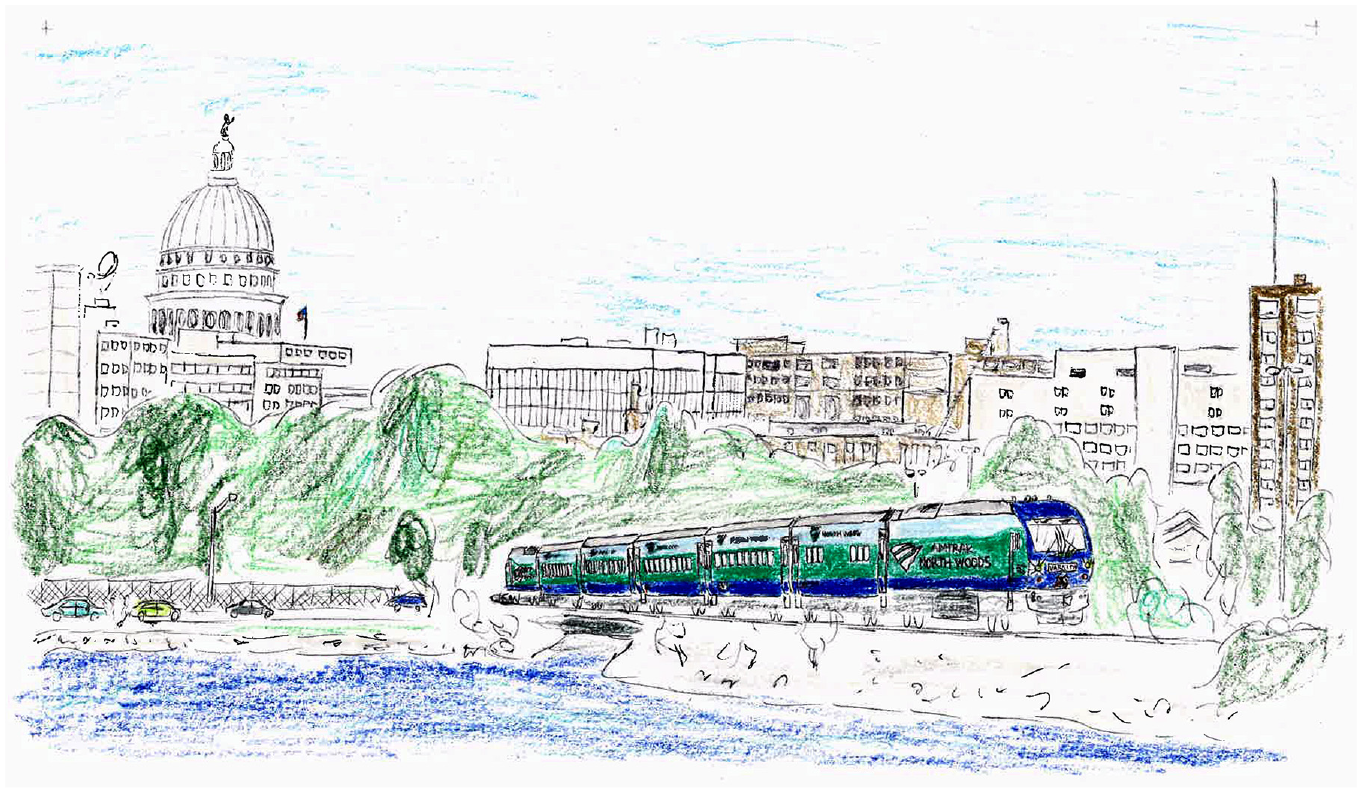
A battery-electric trainset leaves downtown Madison en route to Chicago; artist’s concept by John G. Allen.
Elgin is 37 mi from CUS. The remaining 50 mi to Rockford can also be covered by BELs on a round-trip basis. However, a string of municipalities in the Rock River Valley between Rockford and Janesville may also desire service to Chicago. To provide service on that corridor, it would be necessary to operate the train to Janesville, via Rockford. At that point, the train is 85 mi from Elgin and unable to return to Chicago on a round-trip basis. It is therefore necessary to operate the service to Madison, to use the charging pad.
A side effect of the infrastructure design is thus that Madison-Janesville segment receives a higher frequency of service. Based on the ridership patterns, it is quite possible that at least some of the service will short-turn at Rockford (via Elgin). To further improve trainset utilization, we could use the BEL sets to run commuter round trips to/from Elgin or Rondout during the time when they would otherwise be held at CUS for charging.
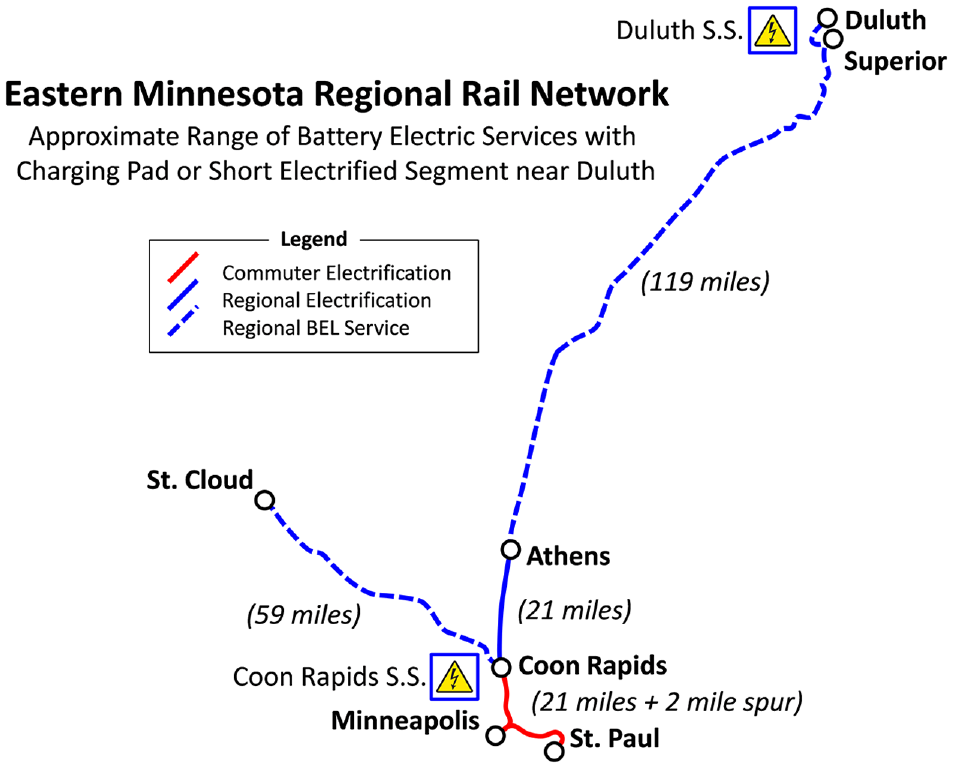
“Twin Cities to Twin Ports” Regional Service
How far can we really go with the judicious use of charging pads? Minneapolis-St. Paul has a relatively small Metropolitan Statistical Area population (3.69 million as of the 2020 Census), but it does have one commuter rail line between Target Field in downtown Minneapolis and Big Lake, Minnesota. Local plans call for an extension to St. Cloud in the future. If we assume a Strategy 5 electrification in the Twin Cities, what services can we run in conjunction with Strategy 6?
St. Cloud is 59 mi from Coon Rapids, which is 13 mi from Minneapolis. Minneapolis is a further 12 mi from St. Paul. If we treat the St. Cloud service as a regional train, where we ensure the BELs are fully charged before leaving downtown, it is possible to run this service out-and-back between St. Paul and St. Cloud. We could also operate every other trip as a Coon Rapids short-turn, which would double the service frequency on the busiest segment of the line between there and St. Paul and, allow the trainset to earn revenue while charging.
Duluth is 140 mi from Coon Rapids, which is too far for the current BELs even if we install a charging pad there. However, if we situate the substation required for Strategy 5 electrification in Coon Rapids, we can electrify a further 21 mi between there and Athens, Minn. This would allow the regional BEL service to run the 119 mi to reach the charging pad in Duluth.
Thus, in this case, we will have completely electrified an Eastern Minnesota suburban and regional rail network with just two substations, and 44 mi of catenary (Figure 23): Athens-Coon Rapids (21 mi) for the regional service, Coon Rapids-St. Paul (21 mi for the commuter service, and a 2-mi spur between Minneapolis Junction (Harrison St.) and Target Field. BELs are extremely infrastructure-efficient in low-density areas such as this (see Methodology E, below).
Eastern Minnesota regional rail network: feasible extent of electrification using a single substation at Coon Rapids and a single charging pad at Duluth.
Analytical Methodologies and Results
The following section provides a technical discussion of the analytical methods used to support the analysis of the six strategies.
Methodology A: Ridership Analysis and Visualization
To identify the busiest line segments, we used a visualization technique to plot weekday passenger loads on each line segment against mileages from downtown (Figures 4 and 14). This allows us to visualize how many passengers would travel entirely within the electric zone if we terminated it at a given station, and how many would cross the zone boundary. We also plotted the data in percentage terms, because a small number of customers may still be a substantial fraction of total ridership on a given line.
In each case we plotted the candidate lines for electrification in color, and other diesel lines in the same metropolitan area in gray, to establish their relative suitability for BEL-enabled electrification (e.g., relatively high ridership density), although by no means was ridership the only consideration for inclusion in the case studies.
Operating considerations such as existing yard locations, combined with substation location and 25 kV transmission limits, may ultimately dictate the extent of electrification. But this visualization helped us to make decisions about initial substation siting and whether a single centrally-located substation or multiple outlying substations would be best. The key consideration is the distance beyond which demand density falls sharply (if it is within the 25-mi threshold based on 25 kV substation reach)—and whether the demand density/distance relationship is linear (e.g., Figure 4, Providence Line; Figure 14, BN-Aurora Line), or significantly non-linear with plots showing either a characteristic S-shape (e.g., Figure 4, Newburyport/Rockport Lines), or a classic L-shape (e.g., Figure 14, CNW-North Line and South West Service). Lines whose travel demands are concentrated in the inner suburban portions are better candidates for partial electrification.
These visualizations also helped with choosing between a local battery EMU shuttle and a direct BEL train from downtown when developing operating plans. If there was substantial ridership beyond electrification limits, then a direct BEL train was considered. Otherwise, the service is relegated to a connecting shuttle.
If the policy goal is to reduce GHG emissions rather than to improve service or reduce costs, ridership density alone should not drive electrification decisions. Electrification productivity, such as daily diesel train miles per catenary mile shown in Table 7, which is ultimately a rough proxy for GHG reduction per dollar invested, is a much more useful indicator with which to evaluate proposals.
Methodology B: Energy Assessment for Service Feasibility and Market Scan
This analysis determines, at a strategic level, how many (existing or proposed) commuter rail corridors could benefit from partial electrification in conjunction with BELs. In selecting corridors to examine, we chose from the following situations:
Existing electrified commuter rail corridors where communities have sought to extend services beyond existing electrified zones. This includes situations where services formerly existed.
Hypothetical new-start electrifications where diesel services currently exist, but an electrification strategy would reduce GHG emissions.
Based on each corridor’s basic service characteristics, we computed the minimum time available for charging the two 4.8 MWh locomotives during a round trip, from entering the (new or existing) electrified zone inbound, to leaving it outbound. Available power leaving electrified territory was based on a combined locomotive capacity of 9.6 MWh (and a C/4 maximum combined charging rate of 2.4 MW). We conservatively assumed that whenever a locomotive was actively accelerating, the battery could not be charged, to avoid exceeding the 4.0 MW substation limit of typical suburban electrifications. It should be possible to configure the circuitry aboard BELs to prevent recharging while drawing power for traction.
Through these calculations, we found BELs to be feasible on 32 distinct services in the Boston, New York, Philadelphia, and Chicago areas. Tables 10 to 13 show detailed results with reference to battery power, train ascent and descent, rolling, curving, accelerating and braking requirements, parasitic loads, charging pad requirements at outer endpoints, energy sufficiency, and capacity for degraded operations. The calculations show the feasibility of operating the various proposed services using BELs under conditions of partial electrification. Interestingly, our findings suggest that it should be feasible to use BELs between Boston South Station and Needham, Massachusetts, even though less than half of this route is on the electrified Northeast Corridor.
Battery-Electric Locomotive Energy Assessment Model Outputs. Basic Service Characteristics
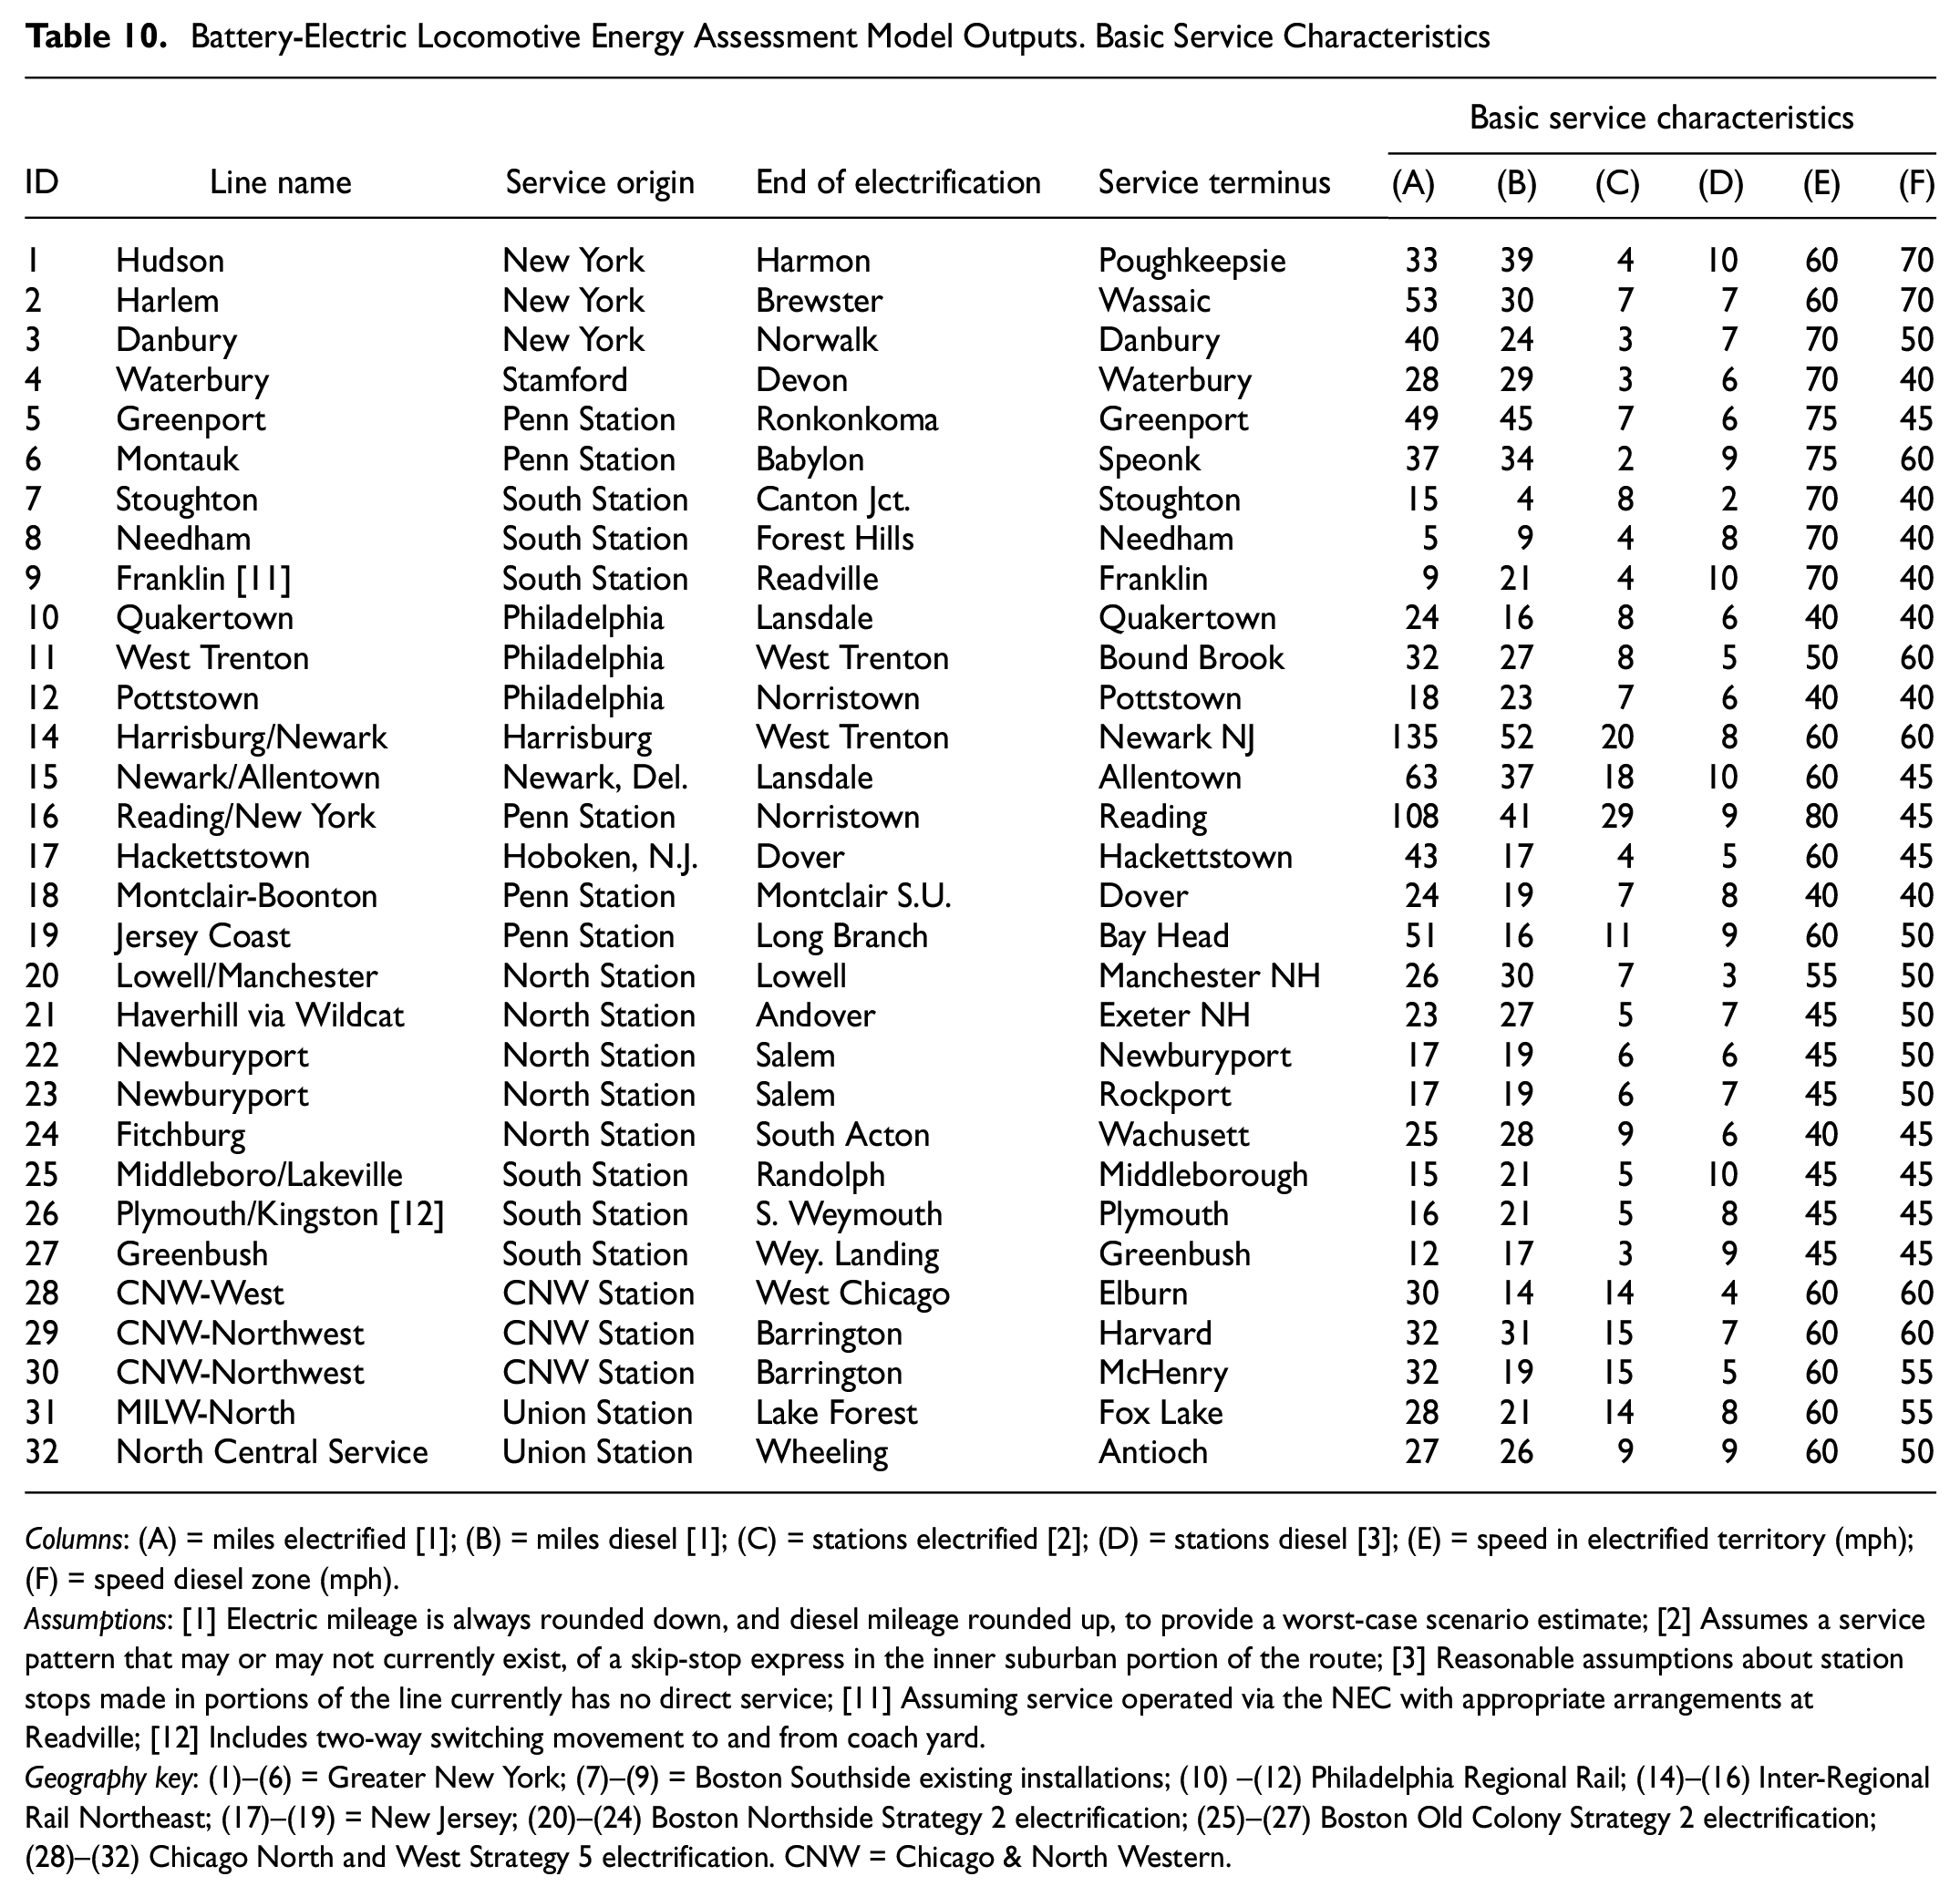
Columns: (A) = miles electrified [1]; (B) = miles diesel [1]; (C) = stations electrified [2]; (D) = stations diesel [3]; (E) = speed in electrified territory (mph); (F) = speed diesel zone (mph).
Assumptions: [1] Electric mileage is always rounded down, and diesel mileage rounded up, to provide a worst-case scenario estimate; [2] Assumes a service pattern that may or may not currently exist, of a skip-stop express in the inner suburban portion of the route; [3] Reasonable assumptions about station stops made in portions of the line currently has no direct service; [11] Assuming service operated via the NEC with appropriate arrangements at Readville; [12] Includes two-way switching movement to and from coach yard.
Geography key: (1)–(6) = Greater New York; (7)–(9) = Boston Southside existing installations; (10) –(12) Philadelphia Regional Rail; (14)–(16) Inter-Regional Rail Northeast; (17)–(19) = New Jersey; (20)–(24) Boston Northside Strategy 2 electrification; (25)–(27) Boston Old Colony Strategy 2 electrification; (28)–(32) Chicago North and West Strategy 5 electrification. CNW = Chicago & North Western.
Battery-Electric Locomotive Energy Assessment Model Outputs. Available Battery Power, Coach Weight, Ascent and Descent Energy Requirement Calculations
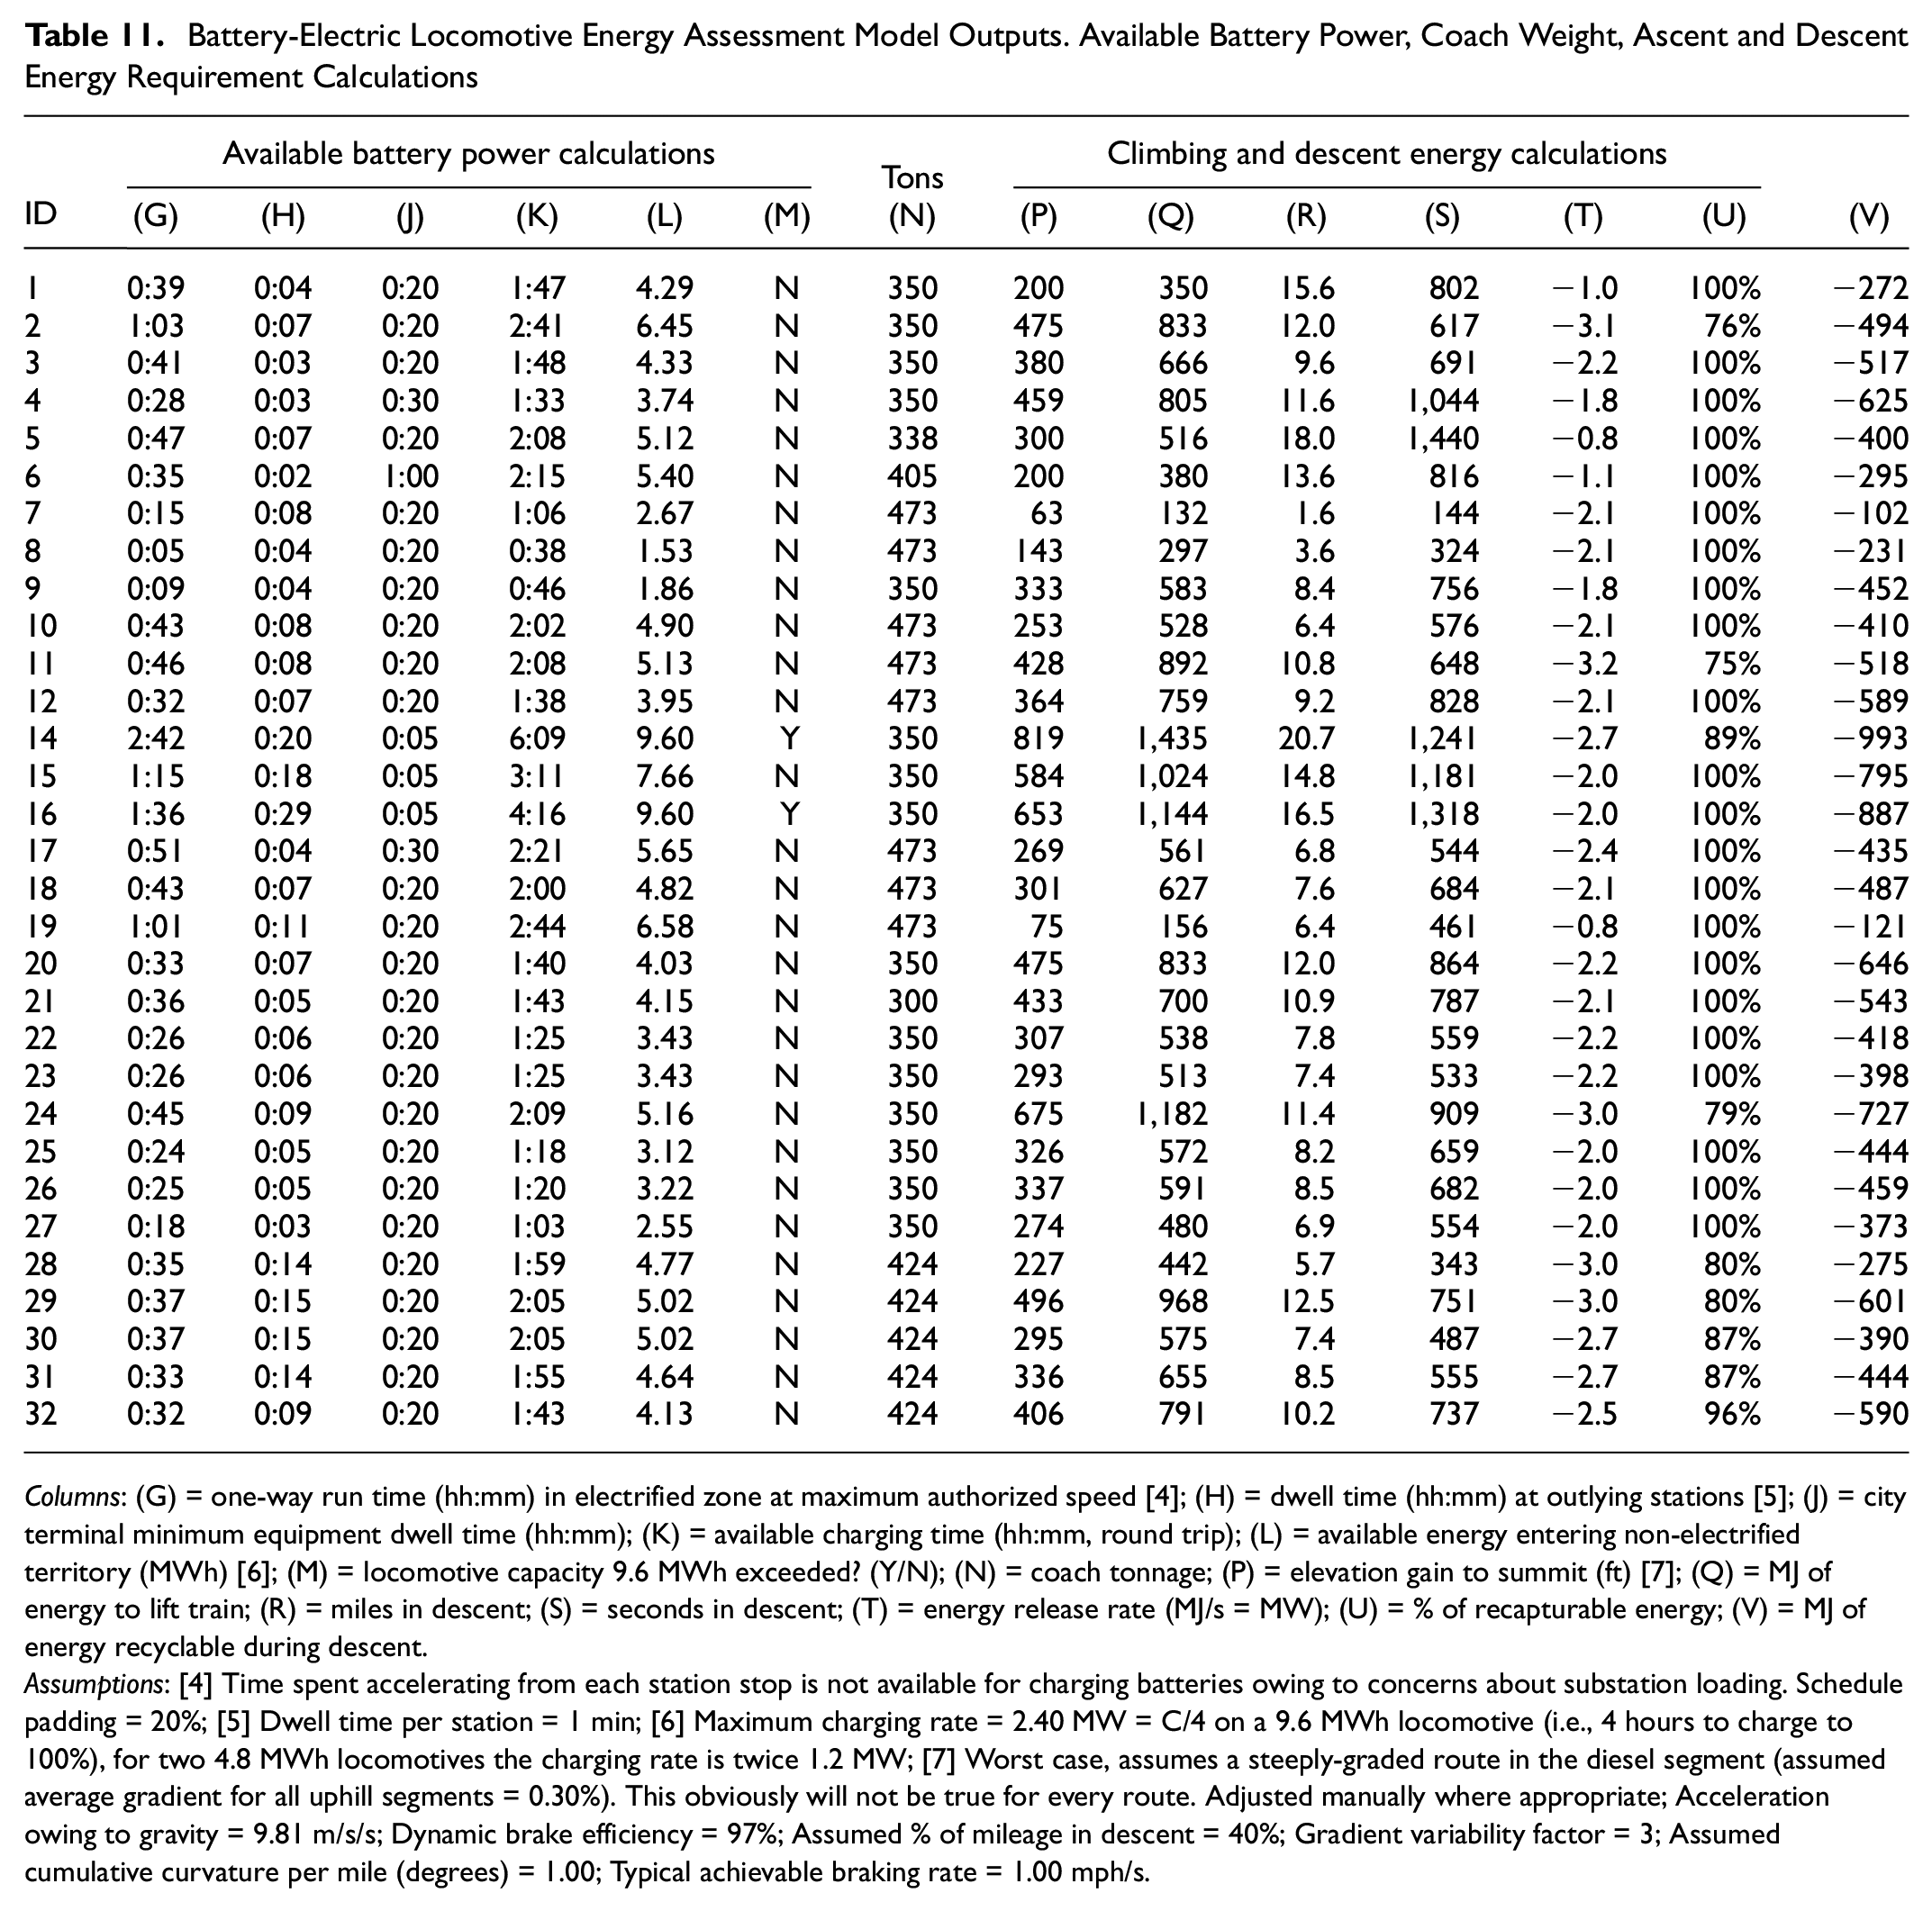
Columns: (G) = one-way run time (hh:mm) in electrified zone at maximum authorized speed [4]; (H) = dwell time (hh:mm) at outlying stations [5]; (J) = city terminal minimum equipment dwell time (hh:mm); (K) = available charging time (hh:mm, round trip); (L) = available energy entering non-electrified territory (MWh) [6]; (M) = locomotive capacity 9.6 MWh exceeded? (Y/N); (N) = coach tonnage; (P) = elevation gain to summit (ft) [7]; (Q) = MJ of energy to lift train; (R) = miles in descent; (S) = seconds in descent; (T) = energy release rate (MJ/s = MW); (U) = % of recapturable energy; (V) = MJ of energy recyclable during descent.
Assumptions: [4] Time spent accelerating from each station stop is not available for charging batteries owing to concerns about substation loading. Schedule padding = 20%; [5] Dwell time per station = 1 min; [6] Maximum charging rate = 2.40 MW = C/4 on a 9.6 MWh locomotive (i.e., 4 hours to charge to 100%), for two 4.8 MWh locomotives the charging rate is twice 1.2 MW; [7] Worst case, assumes a steeply-graded route in the diesel segment (assumed average gradient for all uphill segments = 0.30%). This obviously will not be true for every route. Adjusted manually where appropriate; Acceleration owing to gravity = 9.81 m/s/s; Dynamic brake efficiency = 97%; Assumed % of mileage in descent = 40%; Gradient variability factor = 3; Assumed cumulative curvature per mile (degrees) = 1.00; Typical achievable braking rate = 1.00 mph/s.
Battery-Electric Locomotive Energy Assessment Model Outputs. Rolling, Curving, Acceleration, Braking, Parasitic Load Energy Calculations
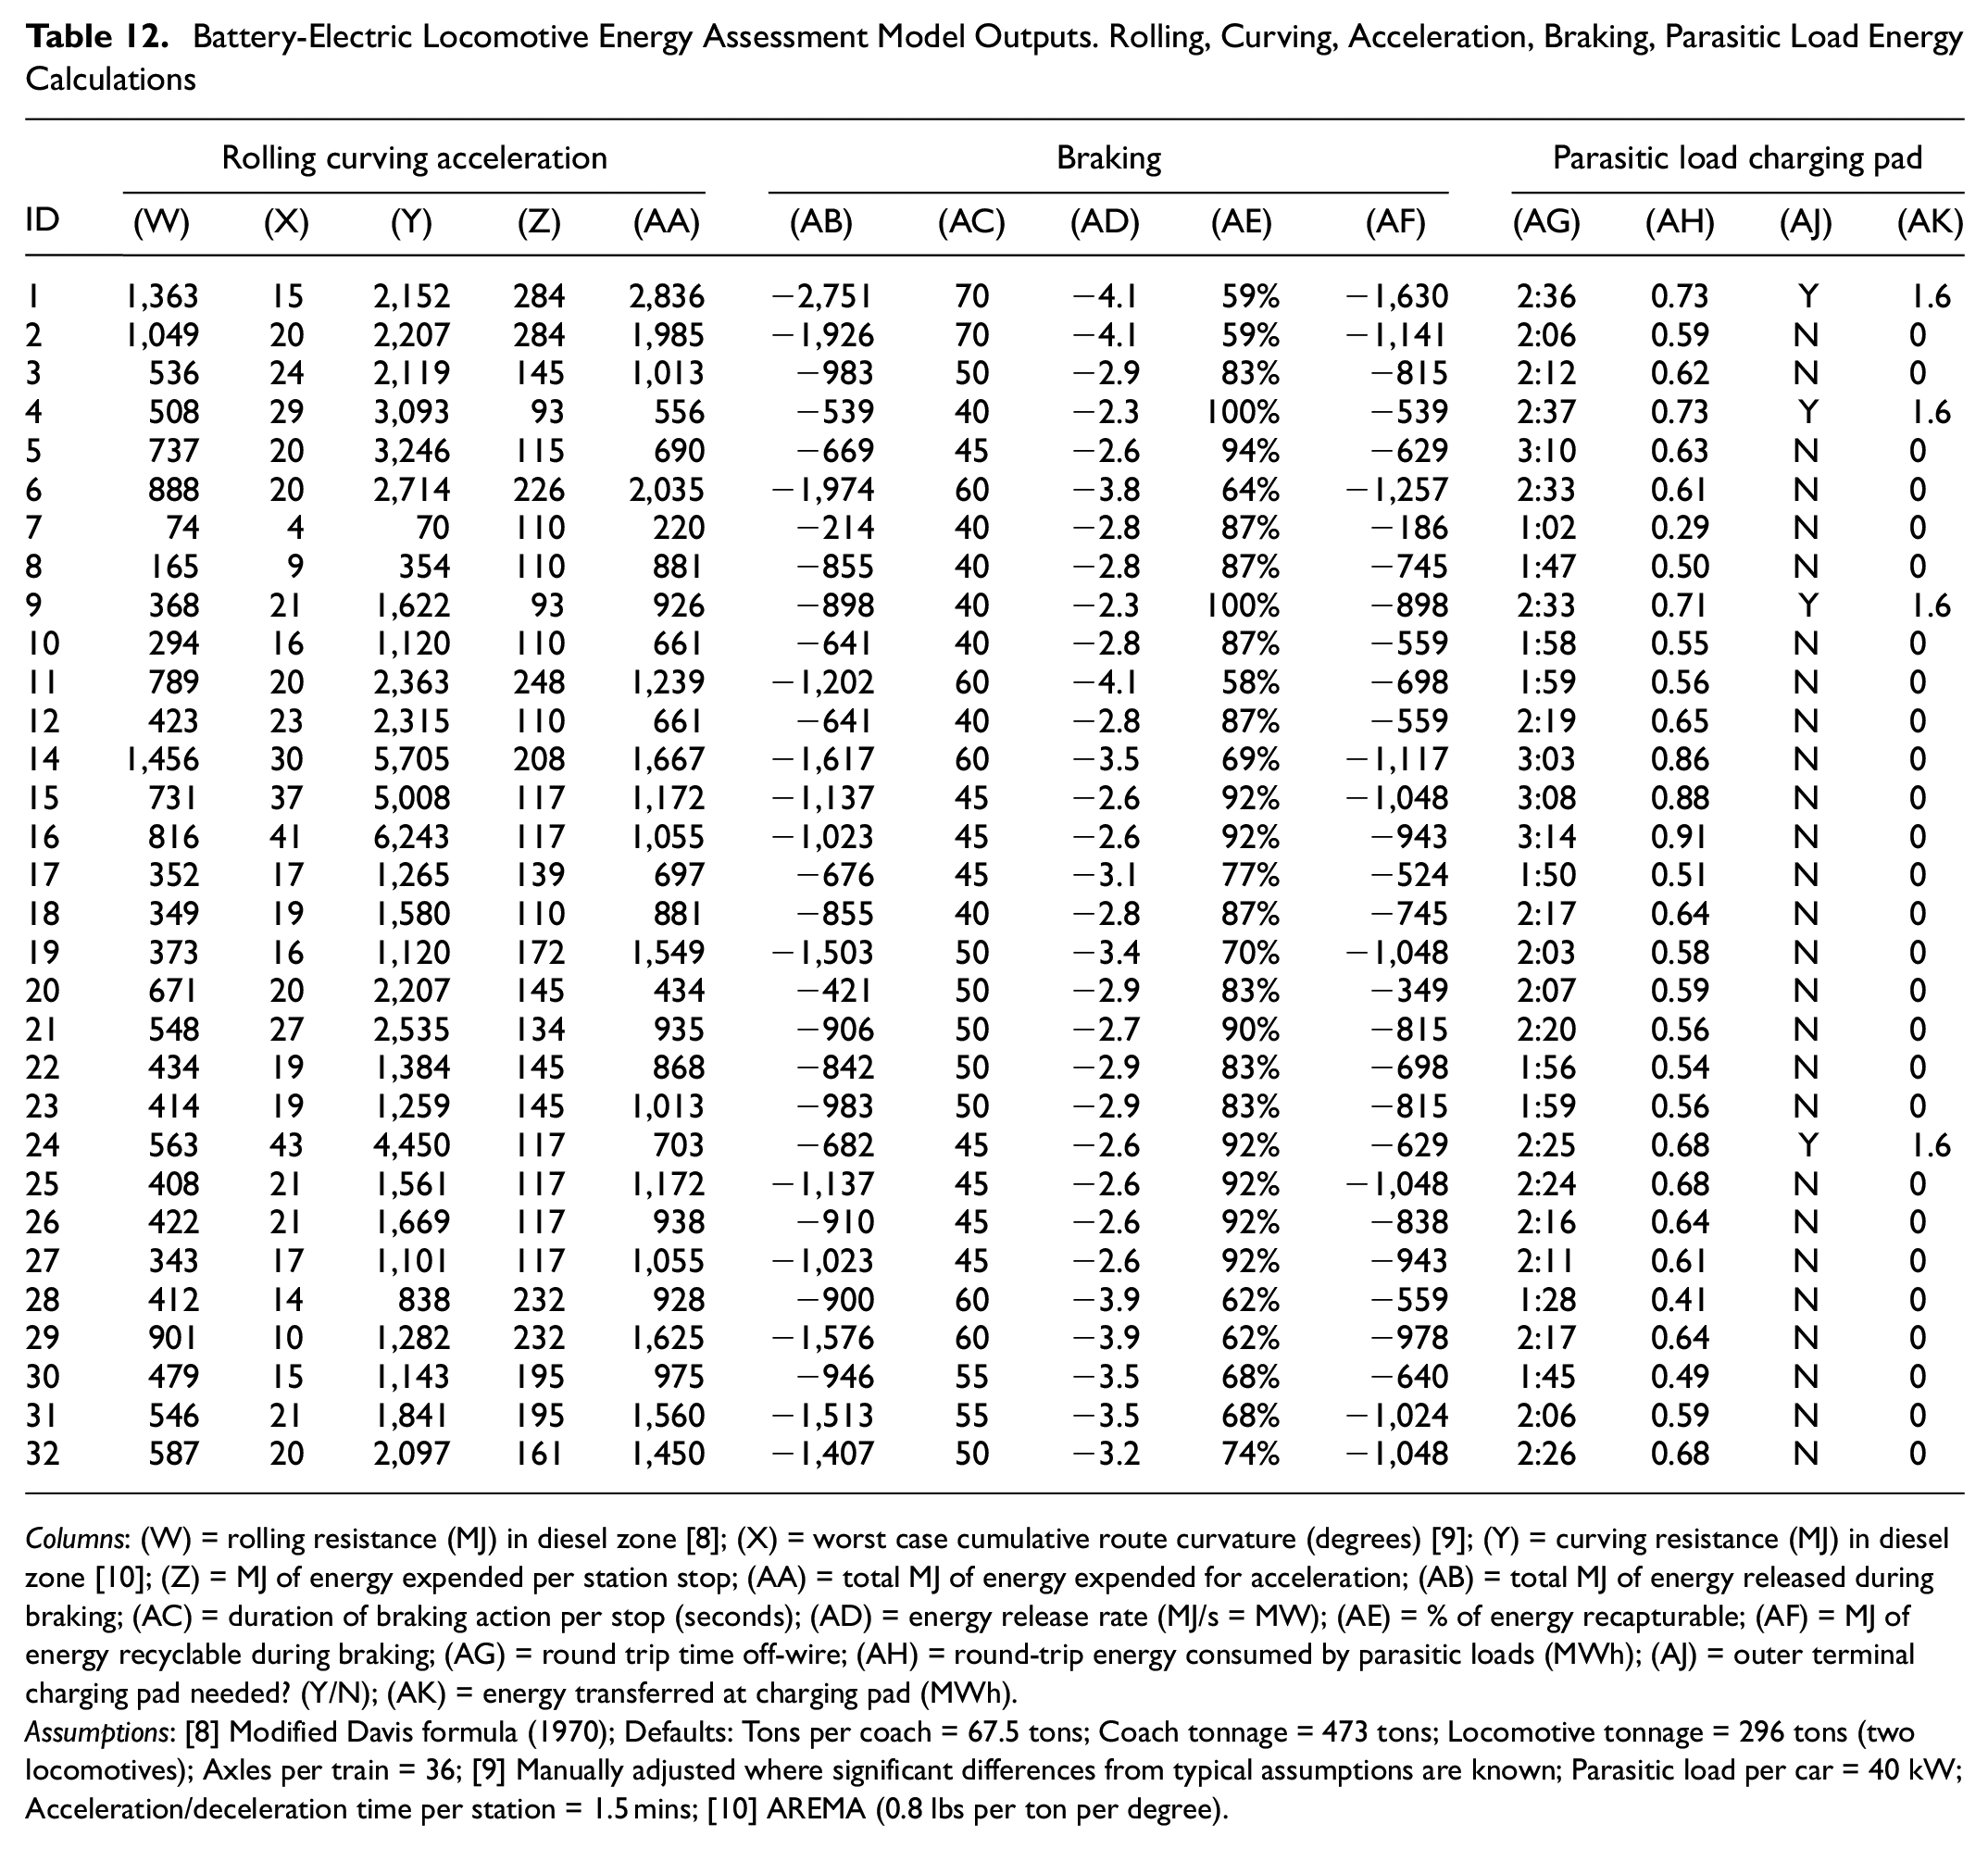
Columns: (W) = rolling resistance (MJ) in diesel zone [8]; (X) = worst case cumulative route curvature (degrees) [9]; (Y) = curving resistance (MJ) in diesel zone [10]; (Z) = MJ of energy expended per station stop; (AA) = total MJ of energy expended for acceleration; (AB) = total MJ of energy released during braking; (AC) = duration of braking action per stop (seconds); (AD) = energy release rate (MJ/s = MW); (AE) = % of energy recapturable; (AF) = MJ of energy recyclable during braking; (AG) = round trip time off-wire; (AH) = round-trip energy consumed by parasitic loads (MWh); (AJ) = outer terminal charging pad needed? (Y/N); (AK) = energy transferred at charging pad (MWh).
Assumptions: [8] Modified Davis formula (1970); Defaults: Tons per coach = 67.5 tons; Coach tonnage = 473 tons; Locomotive tonnage = 296 tons (two locomotives); Axles per train = 36; [9] Manually adjusted where significant differences from typical assumptions are known; Parasitic load per car = 40 kW; Acceleration/deceleration time per station = 1.5 mins; [10] AREMA (0.8 lbs per ton per degree).
Battery-Electric Locomotive Energy Assessment Model Outputs. Charging Pad, Energy Sufficiency, and Degraded Operations Assessments
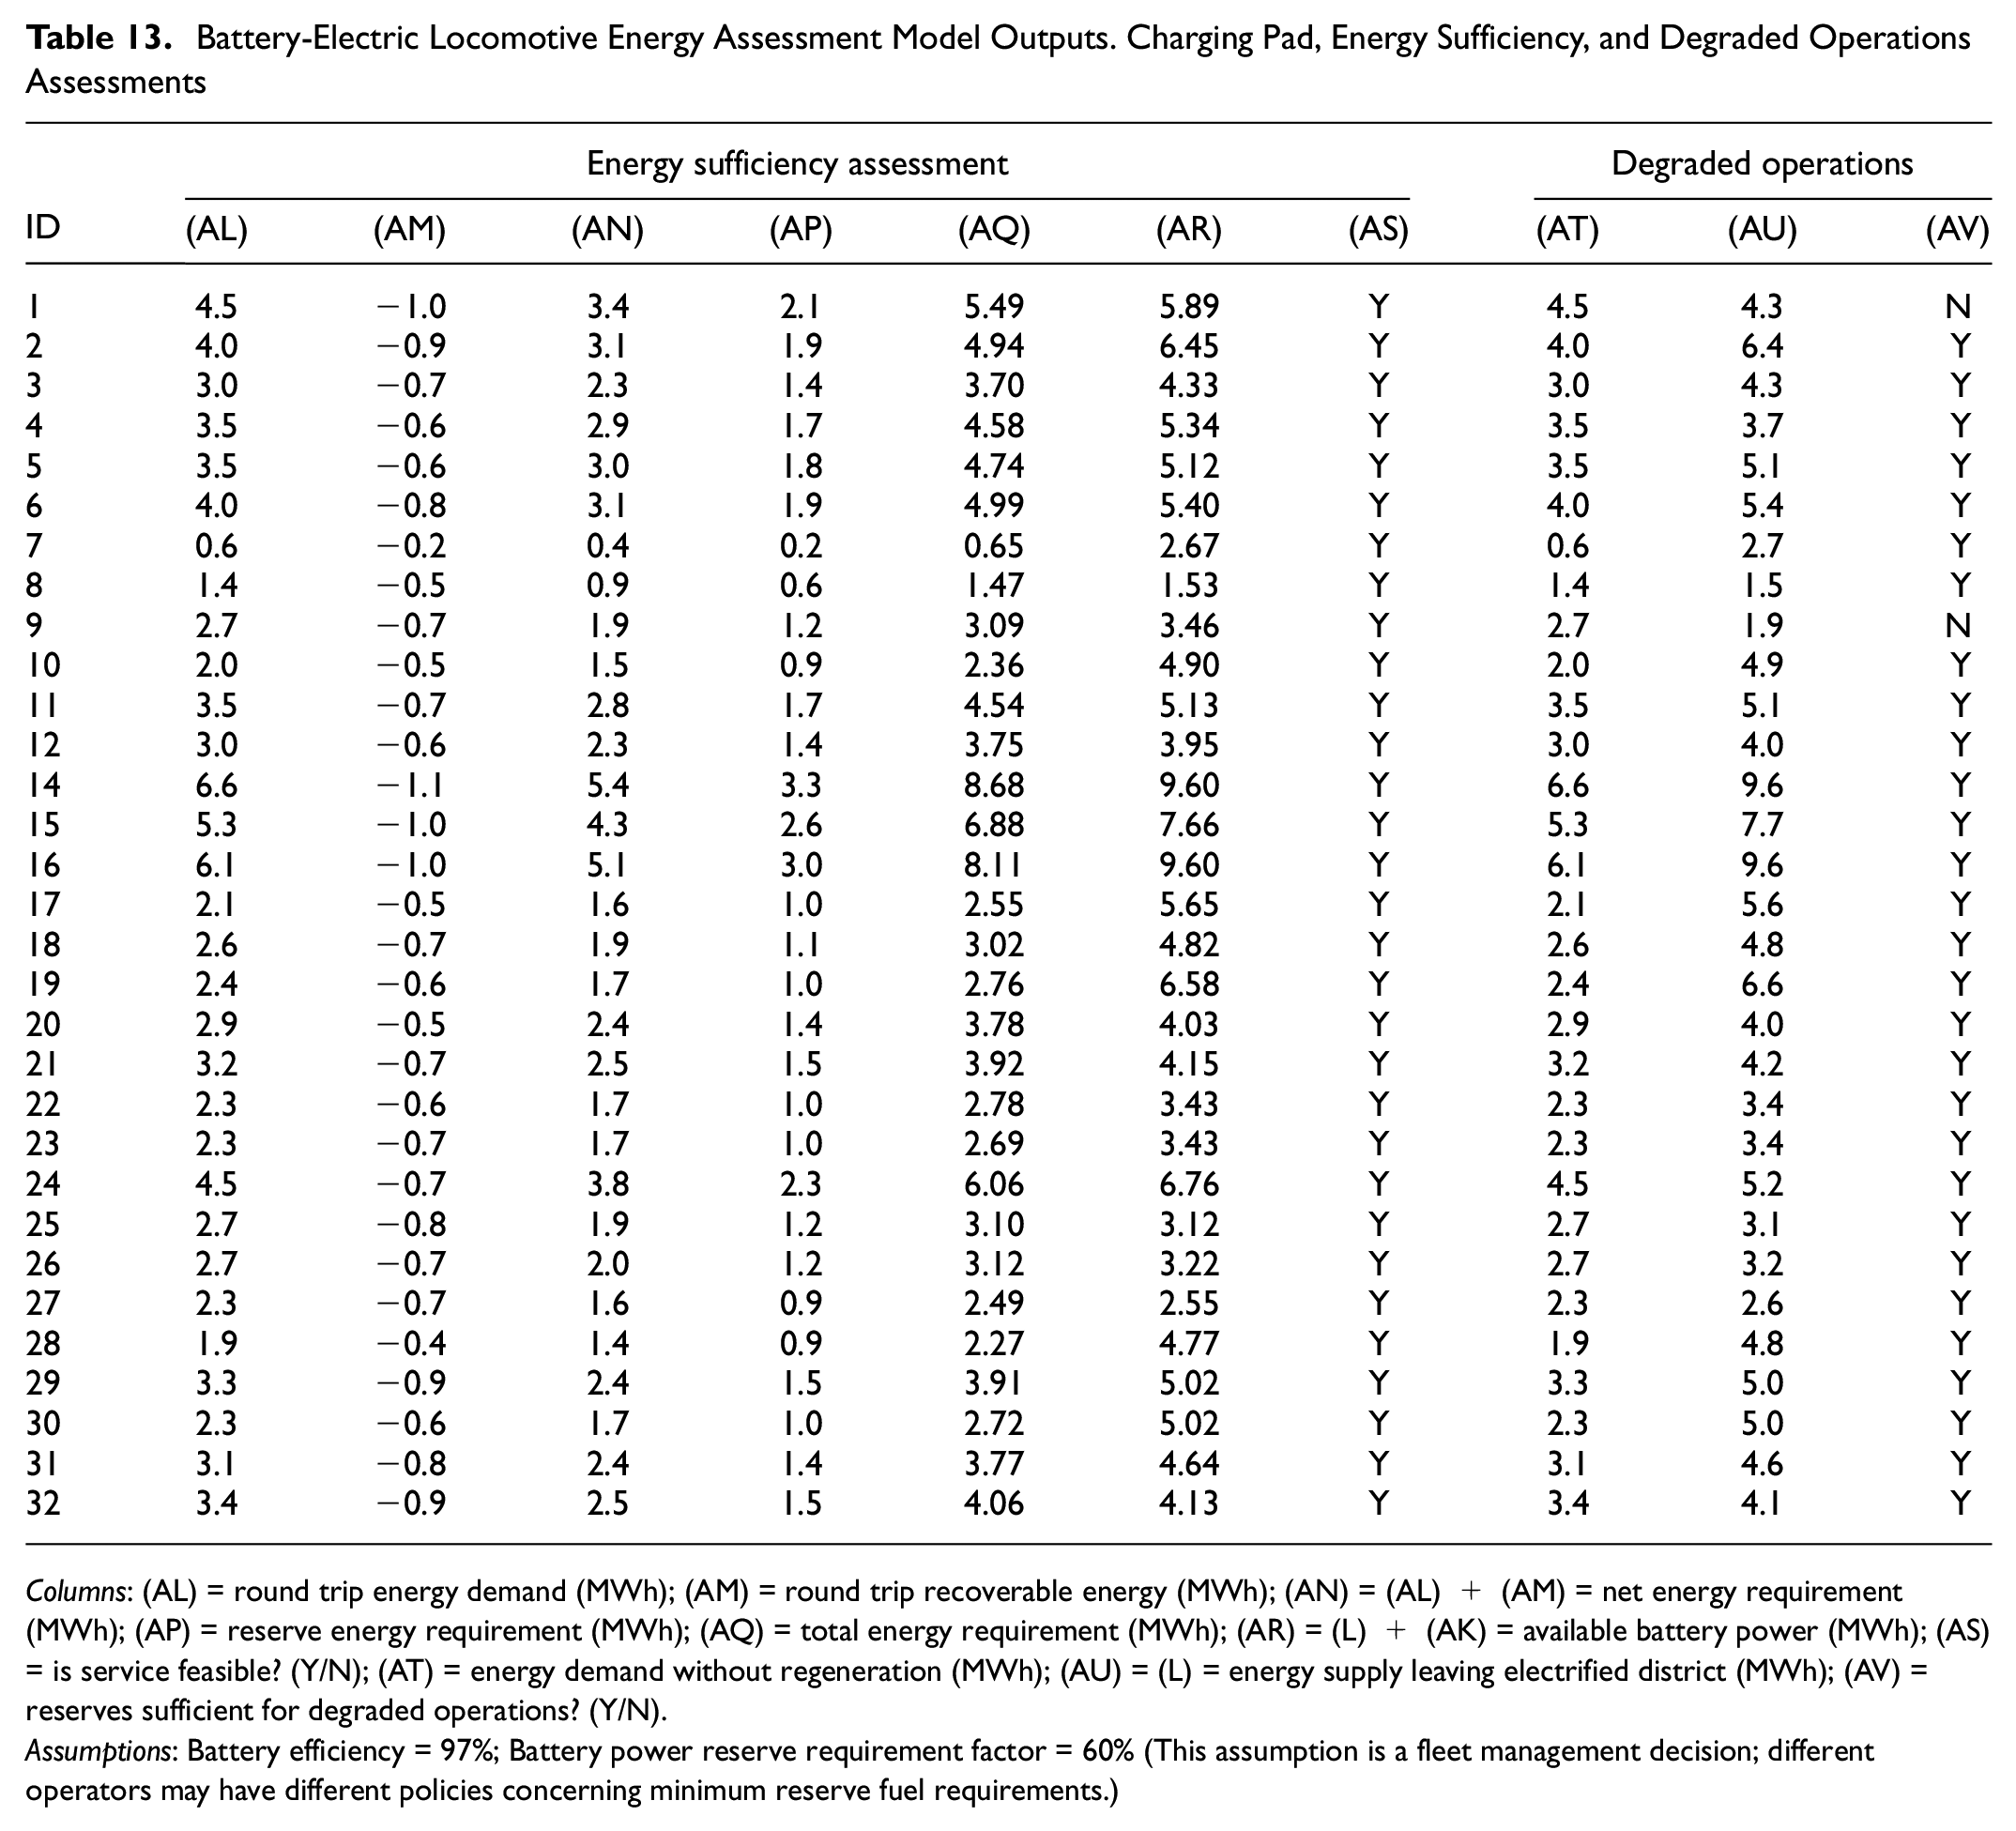
Columns: (AL) = round trip energy demand (MWh); (AM) = round trip recoverable energy (MWh); (AN) = (AL) + (AM) = net energy requirement (MWh); (AP) = reserve energy requirement (MWh); (AQ) = total energy requirement (MWh); (AR) = (L) + (AK) = available battery power (MWh); (AS) = is service feasible? (Y/N); (AT) = energy demand without regeneration (MWh); (AU) = (L) = energy supply leaving electrified district (MWh); (AV) = reserves sufficient for degraded operations? (Y/N).
Assumptions: Battery efficiency = 97%; Battery power reserve requirement factor = 60% (This assumption is a fleet management decision; different operators may have different policies concerning minimum reserve fuel requirements.)
We made reasonable assumptions about typical worst-case rates of grade, curvature, and other physical characteristics (see notes, Tables 10–13). We normally assumed a worst-case commuter rail consist of two 148-ton locomotives with seven 135,000-lb coaches each drawing a parasitic load of 40 kW, although in some cases we scaled back the consist for particularly curvaceous or long routes. These were fed into aggregate formulas that provide cumulative outputs of a train performance calculator (TPC) without having to simulate each linear foot of track. Trains were generally assumed to run express through the electrified zone, and as locals elsewhere.
We separately computed the energy required to lift trains uphill, overcome rolling and curving resistance, and accelerate from station stops, using industry standard formulas. Additionally, taking maximum battery charging rates and regenerative braking efficiency into account, we calculated energy recoverable from descending grades and braking to station stops.
This was not a true TPC exercise, because it was not feasible to collect detailed physical characteristics for all these lines. This methodology should be understood as predicting what a detailed TPC would likely report in the worst case, based on assumptions informed by the authors’ experience. Operators studying given networks should undertake detailed TPC and preliminary engineering analyses, during which they can also examine additional options such as electrifying segments other than immediate approaches to the downtown area and consider alternative supply substation sites.
Operating BELs on Legacy Electrification Infrastructure
Although the Boston and Chicago cases presume 25 kV electrification, we found partial electrification to be feasible with the 12.5 kV systems used in much of the Northeast Corridor, and potentially even with low-voltage third-rail systems. However, the lower the voltage, the more current is needed to provide the same power. Excessive current draw should be avoided so as not to exceed substation and traction return capacity.
The desirability of 25 kV for new-start electrification—with or without BELs—lies in its greater electrical efficiency. The higher voltage allows railroads to electrify more line-miles with fewer substations. Generally, the lower voltages found on legacy installations should not affect the feasibility of using BELs, as the Philadelphia-based examples (Strategies 3 and 4) suggest.
Perhaps counterintuitively, our calculations show BEL operation is feasible on some legacy low-voltage third-rail lines for services where slightly less than half of the distance is electrified. However, in some cases there is a need for either a charging pad at the outer end of the line, or short extensions of existing electrification. These cases exemplify the tradeoff for longer non-electrified portions where additional infrastructure would be built. Studying the specific operating needs and infrastructure costs on a given line would determine what form this should take.
BELs will need to recharge when coming into the electrified zone. As this need will be the greatest when returning to the outer end of the electrified zone after operating in battery mode, rail operators will have to pay particular attention to ratings of their existing power supplies in these outer areas.
These increased power requirements will need to be recognized and planned for. Existing substations may have to be enhanced and/or new ones built to provide the necessary power. Some commuter railroads experienced power shortages when they introduced new, high-performance equipment in the late 20th century without improving power supplies ( 28 ). Likewise, operating power-hungry BELs on unimproved legacy electrifications could have reliability consequences unless power needs are addressed.
On some branch lines, there was not enough charging time under the wires for off-peak services to be operated as shuttles from the branch junction. However, various solutions are possible, such as originating the shuttles from a point further down the mainline, or to provide layover charging facilities near the branch junction.
Methodology C: Lifecycle Cost Analyses for Financial Feasibility
The five Boston Northside alternatives (Table 14) analyzed in the lifecycle cost analysis represent different strategies for how electrification might be addressed. Alternatives (I) and (V) use BELs to provide service beyond a core electrified territory representing the minimum electrification necessary to reach the entire service area, with Alternative (I) representing the existing network and Alternative (V) including long-proposed extensions to New Hampshire. Alternatives (II) through (IV) are conventional electrification solutions that vary in scope, with Alternative (II) not quite covering the entire existing service area owing to the maximum feeding distance of 25 kV substations.
Hypothetical Life Cycle Cost Assessment of Commuter Rail Electrification Strategies: Assumed Infrastructure Characteristics
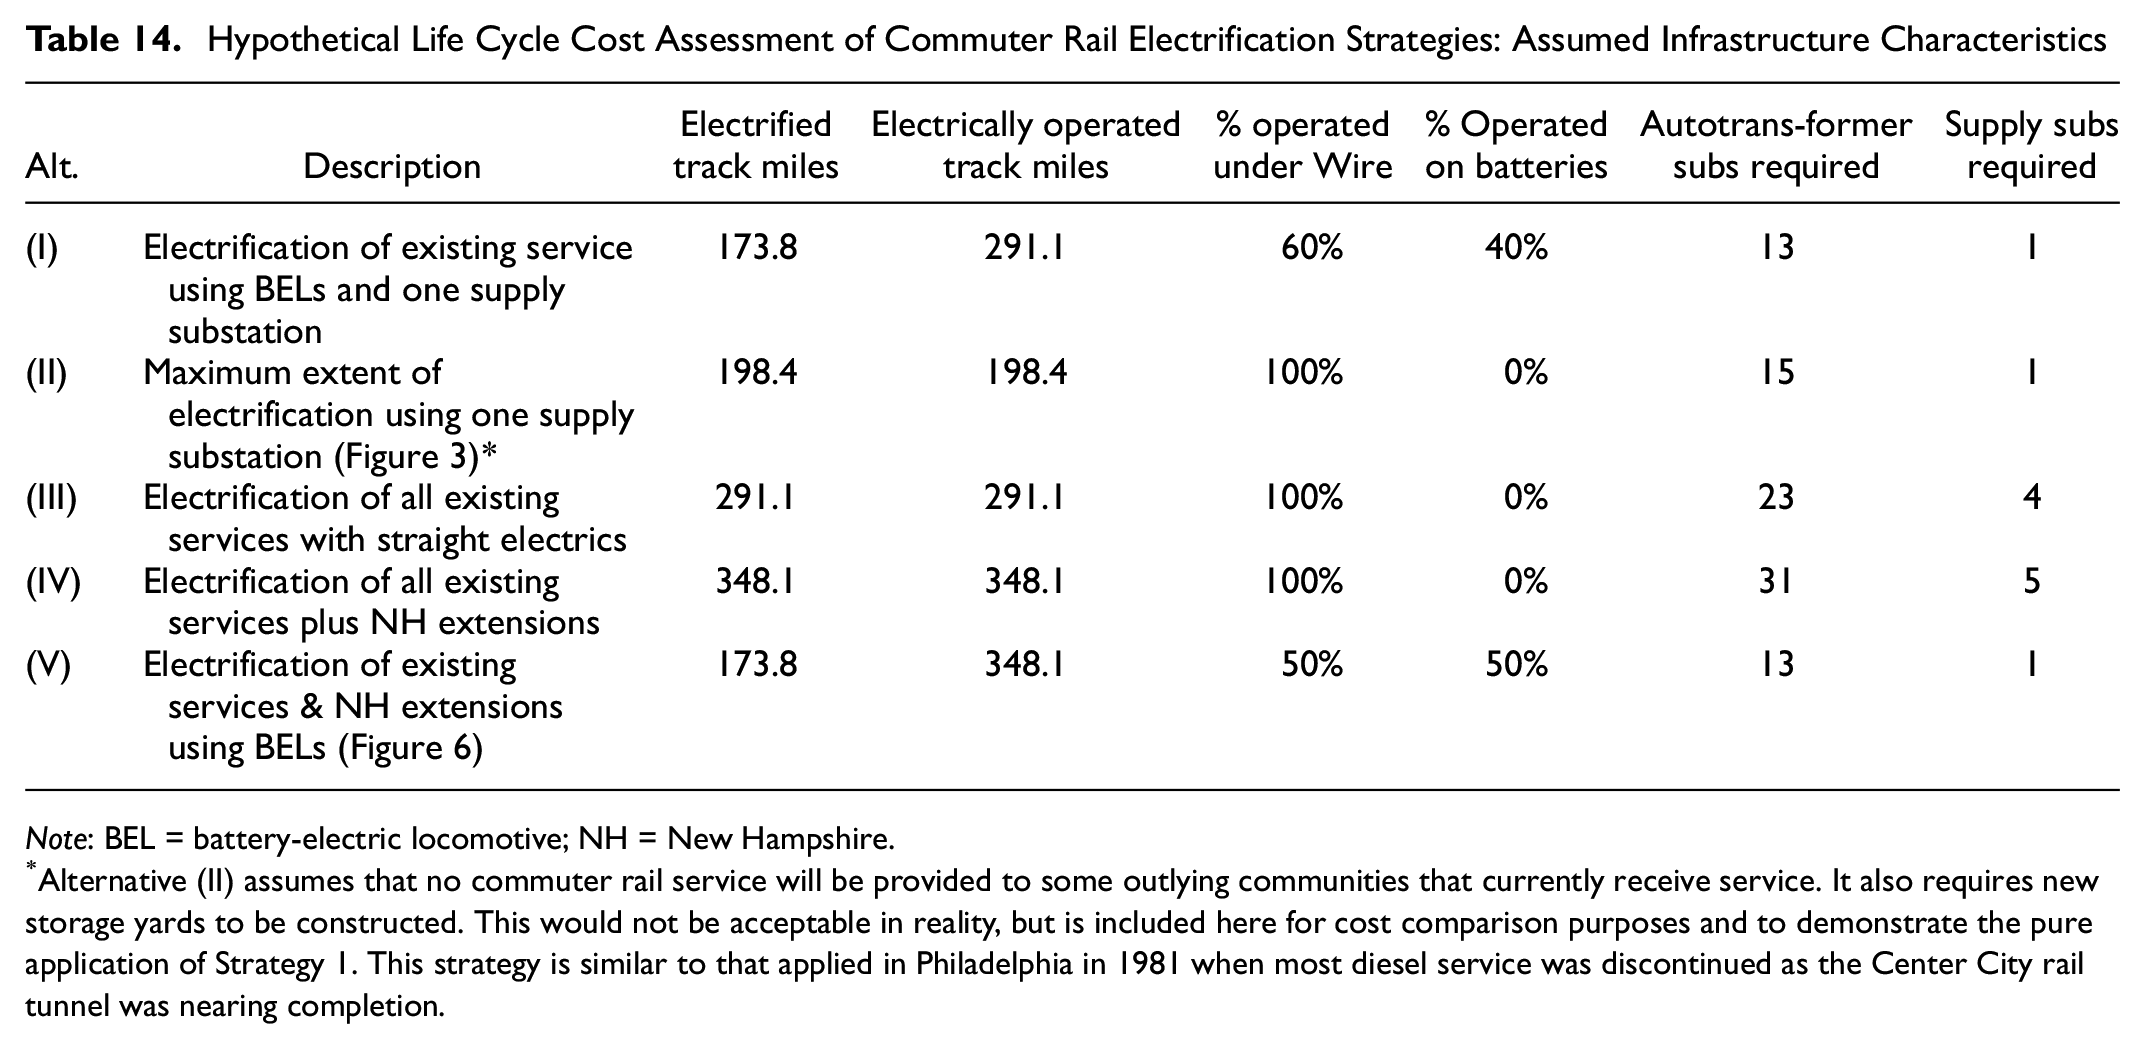
Note: BEL = battery-electric locomotive; NH = New Hampshire.
Alternative (II) assumes that no commuter rail service will be provided to some outlying communities that currently receive service. It also requires new storage yards to be constructed. This would not be acceptable in reality, but is included here for cost comparison purposes and to demonstrate the pure application of Strategy 1. This strategy is similar to that applied in Philadelphia in 1981 when most diesel service was discontinued as the Center City rail tunnel was nearing completion.
We determined the track-miles of catenary required based on the current track map and determined the number of autotransformer substations required based on their maximum feeding distances. Because interlockings require special catenary work, and may require signal interference immunization, we provided extra scopes of work to account for this. We assume a large supply substation at the B.E.T., and other smaller supply substations in outlying areas as needed to meet electrical demands. We made no attempt to determine site-specific conditions or connections to the electrical grid. Eastern Massachusetts has a comparatively dense transmission grid, and suitable supplies should be available close to where they are required.
Based on these asset counts, we used our estimates of unit costs (Table 15) to determine investment needs. These are based on industry experience and reviews of typical projects and are broadly consistent with available industry data ( 38 , 70 ). Some costs might seem high at first glance, but one railroad recently spent almost $50 million rebuilding a single AC supply substation that provides power from a 138 kV source. A significant portion of the construction costs of 25 kV AC electrification is associated with substations, including the utility-side costs of bringing in high-tension lines.
Unit Cost and Labor Productivity Assumptions for the Hypothetical Life Cycle Cost Assessment
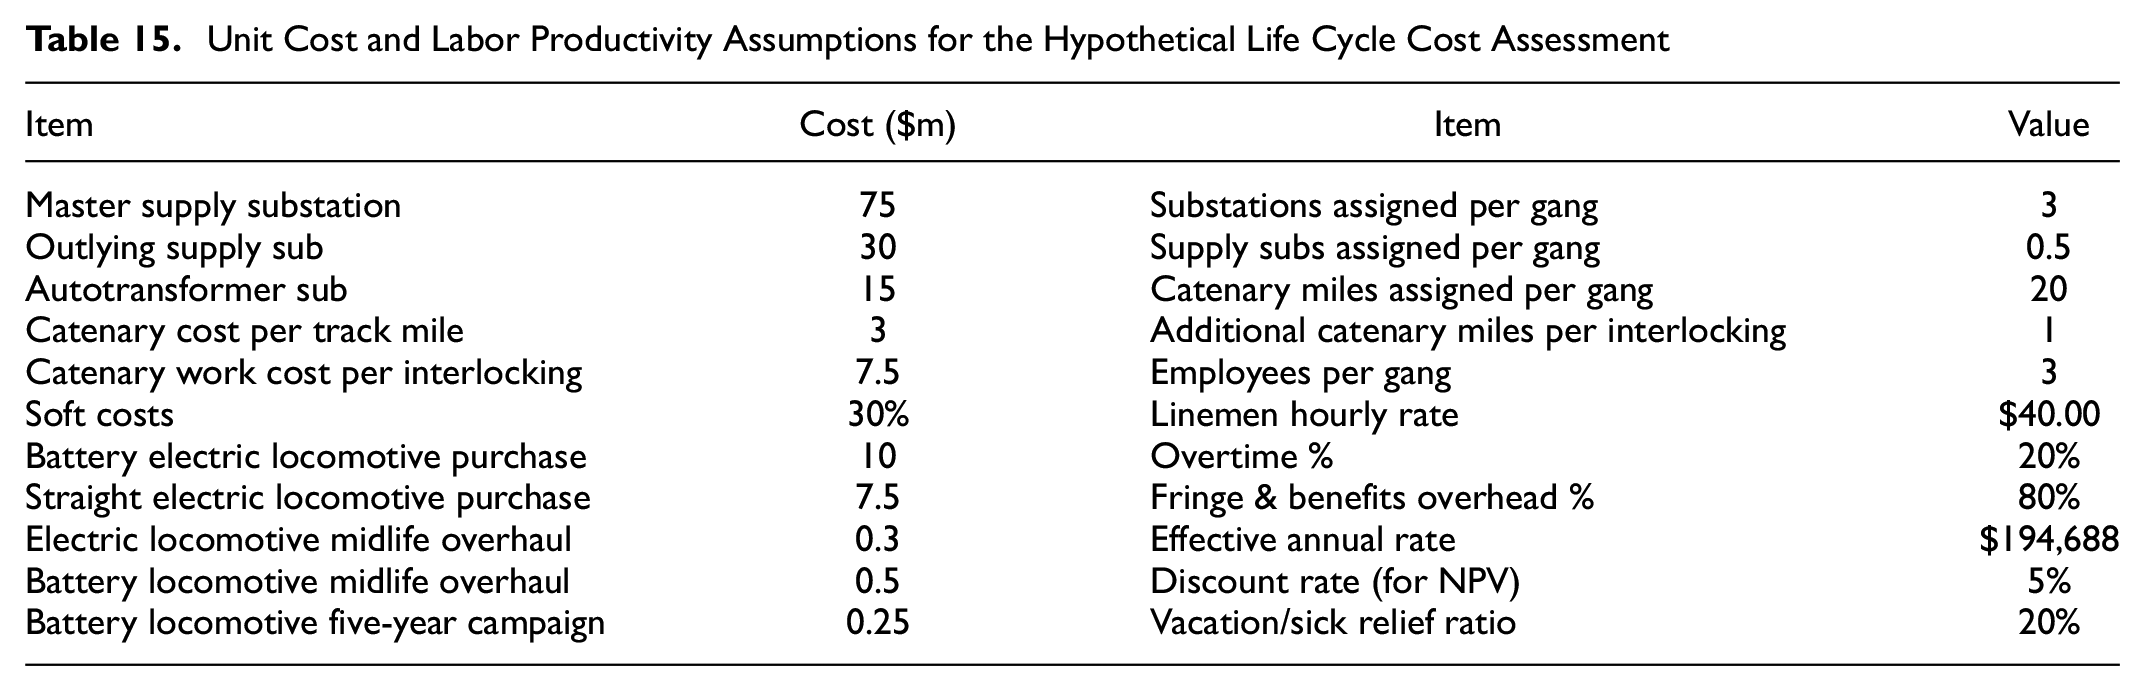
Maintenance of Way costing (Table 16) follows established zero-based methodologies ( 71 ) based on previously-determined asset counts, with assumptions about headcount budgeting methods, labor rates, and line gang productivity (Table 15) consistent with typical commuter rail practice. OCS installation ( 72 ), inspection, and maintenance, even with constant-tension catenary, will require significant track time and will affect costs.
Capital and Maintenance Cost Assessment Results
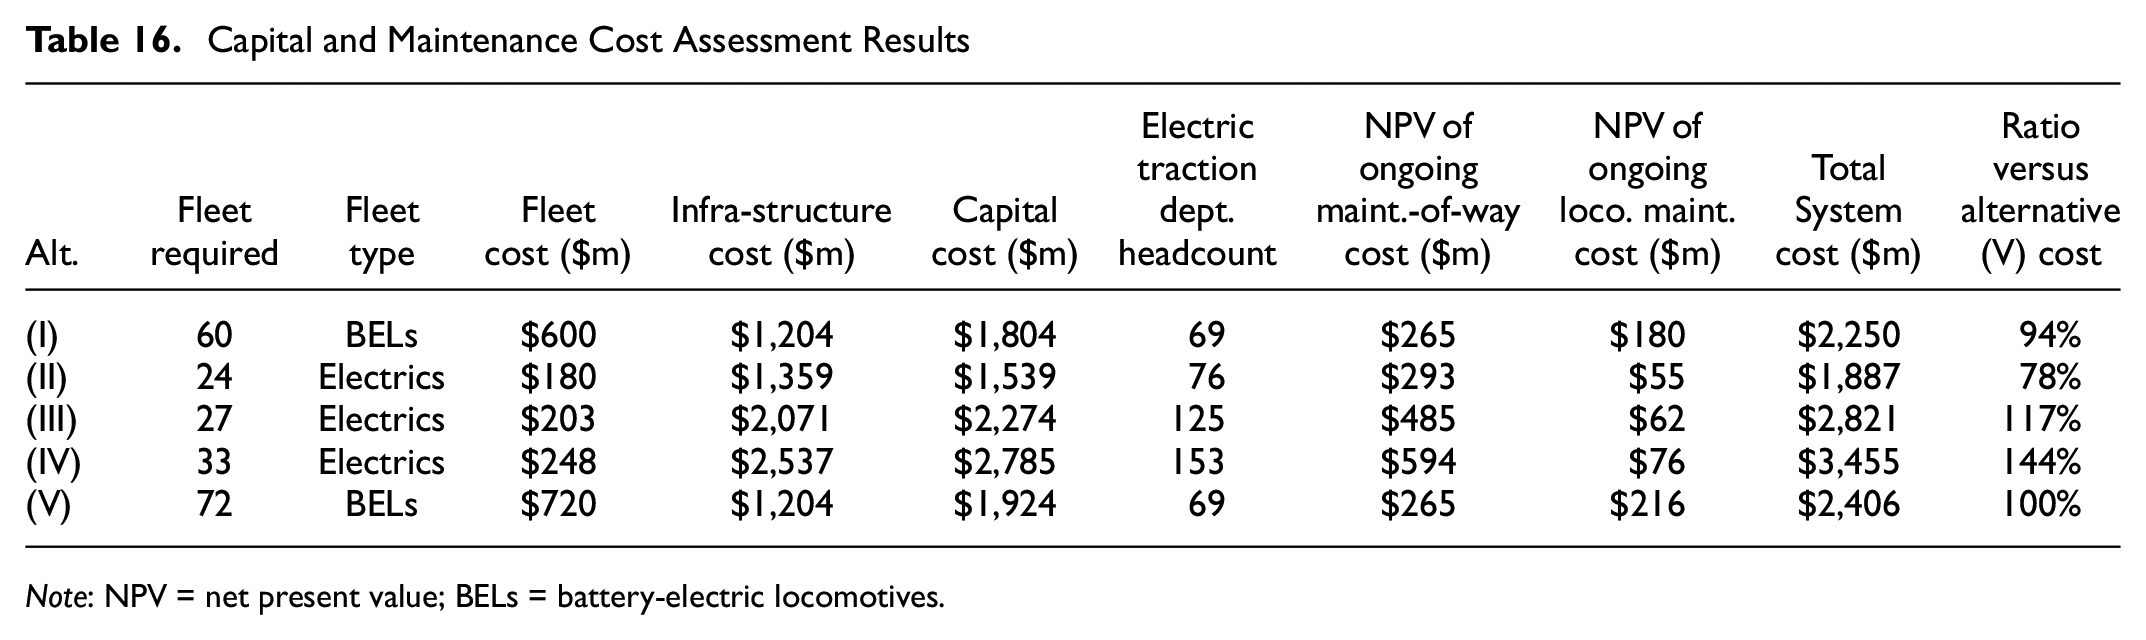
Note: NPV = net present value; BELs = battery-electric locomotives.
Locomotive cost estimates (Table 15) are based on recent procurements. New BEL costs were not available; however, we made the conservative assumption that they would be significantly more expensive than freight locomotives, because North American passenger locomotives are a specialty low-production item. One operator paid $8.8 million per unit for dual-mode electric/diesel locomotives in 2020; another paid $12.4 million. We assumed a passenger BEL would cost $10 million. Shop margins for locomotives were set higher for BELs (20%) than for straight electrics (10%). We estimated locomotive maintenance costs from recent experience ( 73 ), with five-yearly battery overhauls added to BEL maintenance regimes.
The results of this analysis are summarized in Figure 9 above.
Electrification and Legacy Infrastructure Constraints
Even where partial electrification and BEL operation do not involve legacy electrification, other legacy infrastructure issues may arise. Railroads will have to examine their track and yard capacities (perhaps with simulation studies) and decide what limitations can be worked around versus committing to infrastructure expansions. Signal systems and track circuits will need to be immunized against interference from traction return current. Electric or BEL maintenance shops will need to be constructed or existing shops updated with new tooling. Shore power may be needed where weekend layovers are planned.
Overhead clearances need to be analyzed at low bridges and at downtown terminals and their approaches (e.g., Chicago Union Station, Boston North Station) which were not initially designed for electrified operation. This may not be as much of an issue as generally thought. The British Standards used on Network Rail are based on extensive operating experience with 25 kV, and suggest that with proper design, trains may operate safely under bridges with as little as 10½” between the train’s maximum height and the overhead wire ( 20 p. 55). This implies that 25 kV electrification is possible with a 14’6” static height double-deck car if the structure has at least 16’10” of vertical clearance. For structures that are a little lower than that, other techniques have been developed, notably in Scotland, where Clyde Electric trains coast through short neutral sections under bridges having some very restrictive vertical clearances.
There are various options for improving clearances in restricted-space settings. Undercutting the roadbed or installing slab track can provide additional room overhead. Other options include retrofitting or replacing structures, or even using lower voltages (although the latter will, at best, provide a few extra inches).
Methodology D: Simplified Battery Charge Level Simulation
To assess the risk of battery depletion on an individual train basis, assess shore power requirements, and determine logistical plans in case of an unexpectedly flat battery, we worked out a sample operating plan (Figure 24a) for a fairly sparse hypothetical commuter service on a 50-mi line, half of which is electrified. Sparse services are logistically most challenging because there are few opportunities for swapping out equipment when problems arise.
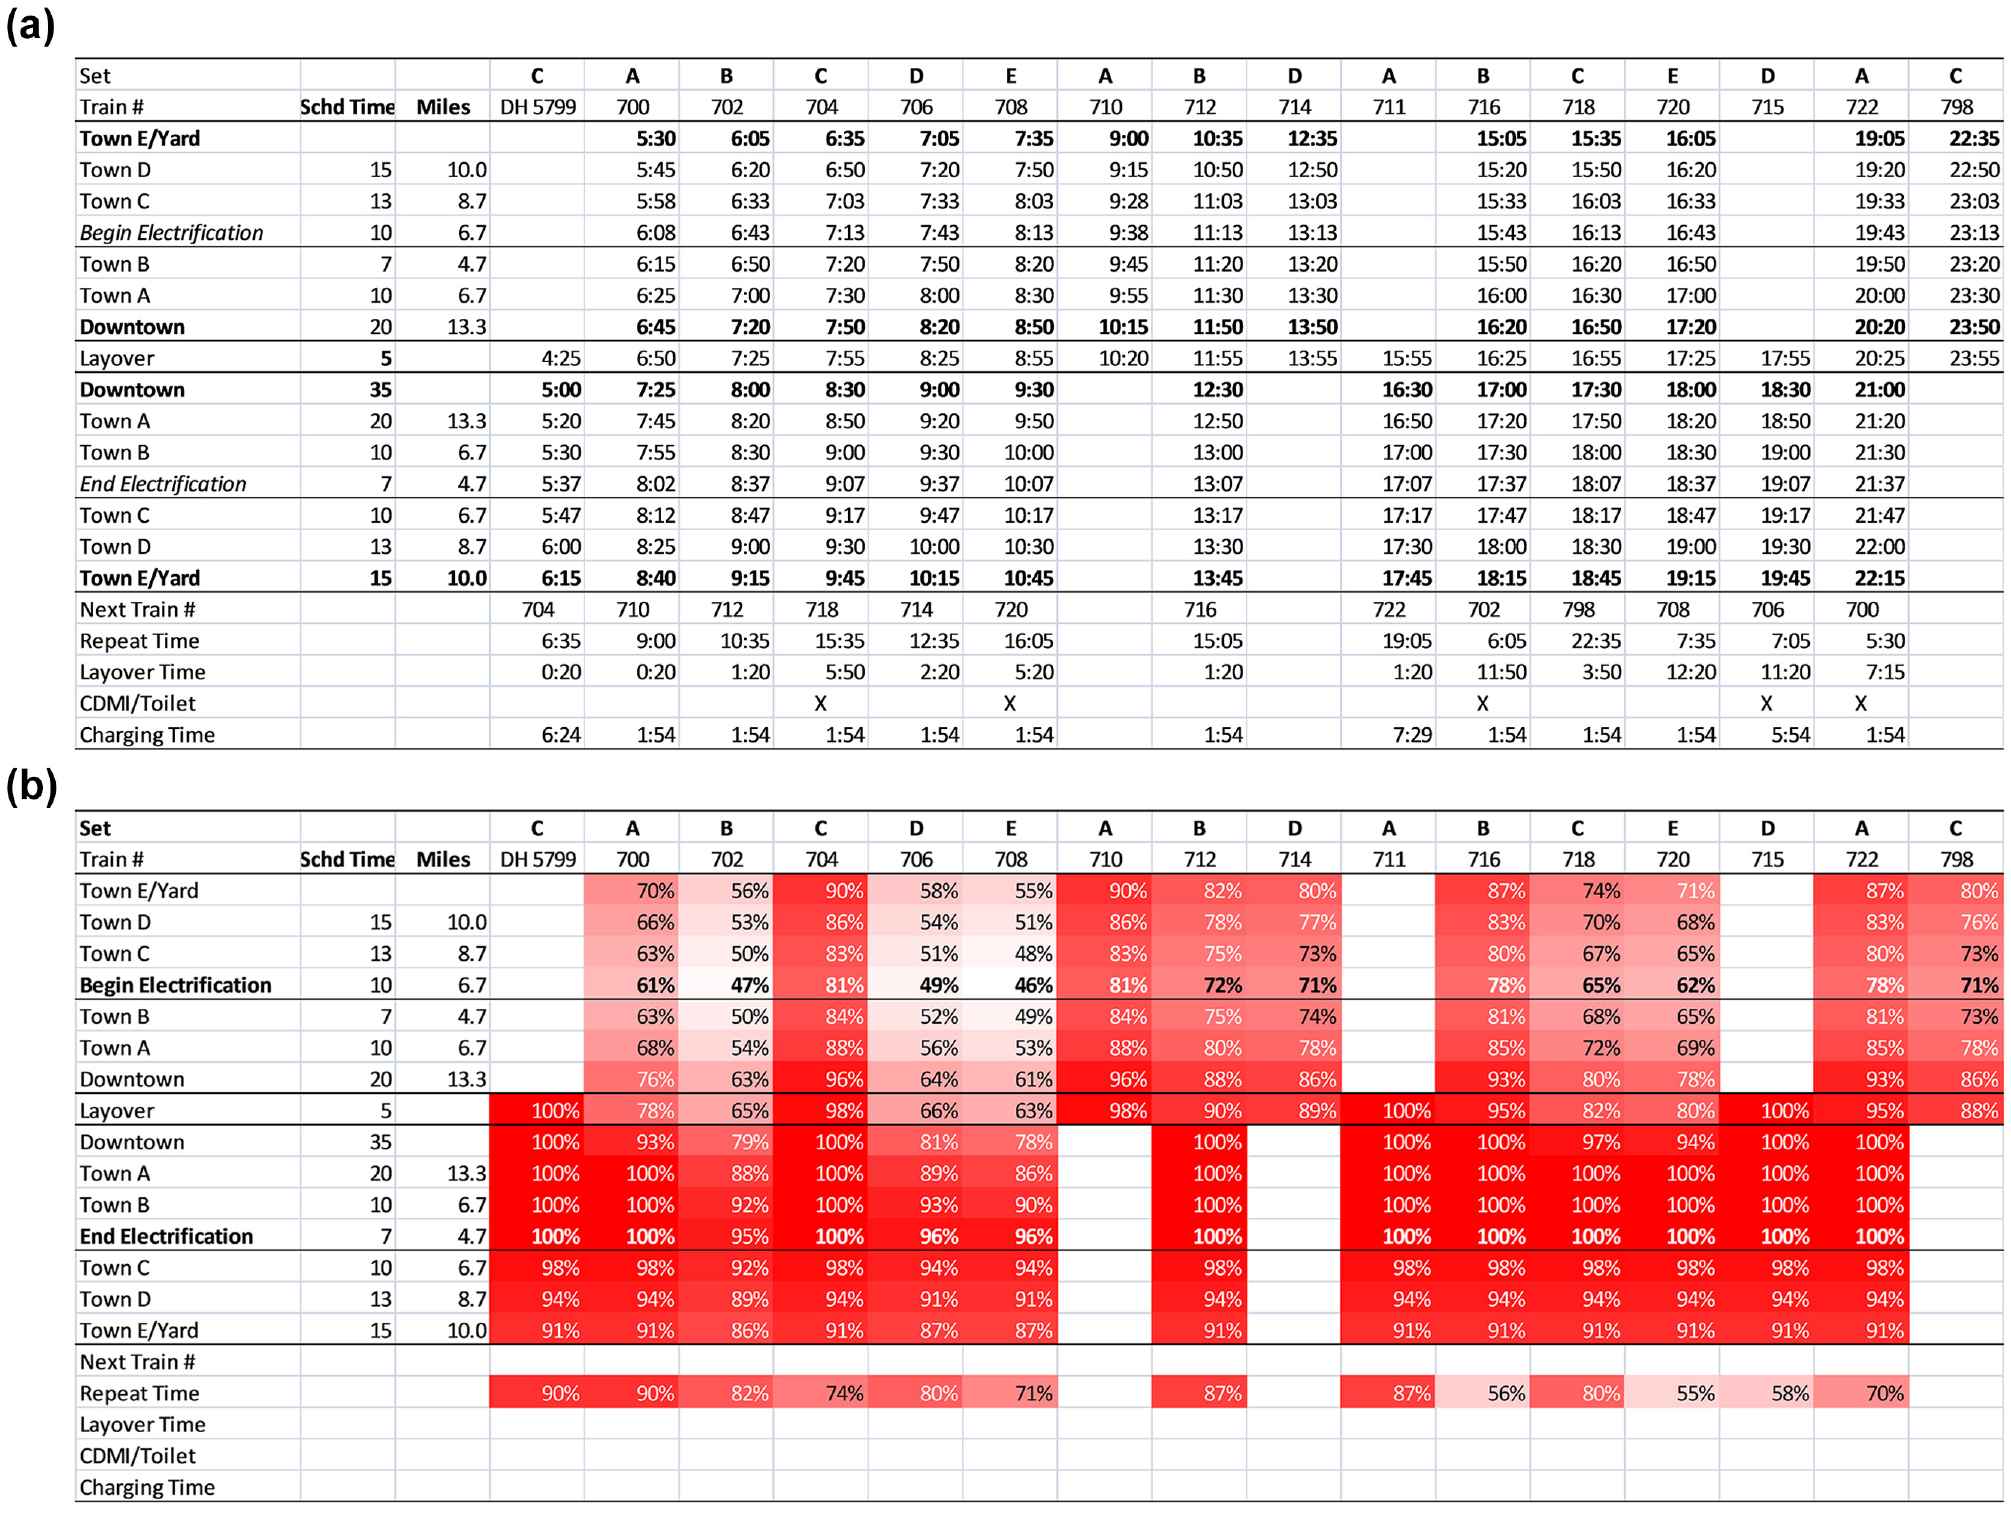
Outputs from simplified battery charge level simulation based on sample operating plan for sparse service: (a) sample operating plan for sparse service, (b) battery level forecast for sample operating plan.
Our battery-level simulations based on energy consumption calculations (Figure 24b) show that the AM peak inbound service has the lowest battery levels owing to overnight HEP loads. Nevertheless, at no point did any trains begin a run with less than 55% charge after laying over for the night, nor enter the electrified zone with less than 49%. This is true even if the outlying yard was not provided with shore power. But if the service does not operate during the weekends, it would be necessary either to deadhead back to the electrified zone, or to provide shore power at the outer end. Operating a weekend service would have higher operating costs but could lead to infrastructure savings.
This sample operating plan also proved out that it was possible to provide extra “charging cycles” in the operating plan in case battery levels becomes unexpectedly depleted for any reason. Sets A, C, and D have extra layover time downtown in the electrified zone in case of an unplanned low-charge condition. Plenty of opportunities exist for set swaps at the outer yard in case a specific set needs to be moved onto a recharge cycle, and set step-ups are possible at the downtown terminal for emergency manipulations. Fleet manipulations to get locomotives with “low battery warnings” onto daytime charge cycles are not difficult even on lines with relatively sparse service frequency.
These are typical concerns an operations manager would have about operating this new type of equipment with energy-based distance constraints that are more restrictive than a diesel. We show that it is possible to work with this through operating plan design. Obviously, plans for each proposed service would need to be worked out individually, through proper consultation between the capital design and operations disciplines. However, we believe additional risks introduced by the range constraint can be mitigated to an acceptable level.
Methodology E: Infrastructure Efficiency Comparison
Implicit in these strategies is a goal of achieving the maximum carbon-reduction from commuter rail operations while minimizing fixed infrastructure investment needs, a theme that was explored in ( 5 ). This methodology provides a high-level assessment of new infrastructure requirements (route-miles electrified) versus GHG reductions achieved compared with other approaches, such as the diesel dual-mode intermittent electrification proposed in ( 12 ), and a hypothetical full-electrification scenario. The Philadelphia case studies (Strategies 3 and 4) were not included because they use existing electrifications.
Table 17 shows the results of this analysis. As can be seen, the BEL-enabled approaches are extremely infrastructure-efficient, although Strategy 6 approaches sacrifices rolling stock utilization to achieve this result in very low traffic density areas. As for GHG performance, the BEL-enabled approaches offer far superior reduction to diesel dual-mode based intermittent electrification, while providing substantial infrastructure savings over full electrification. The performance of the diesel dual-mode strategy proposed elsewhere ( 12 ) is shown at the end of Table 14 for comparison with the more environmentally effective strategies proposed in this research.
Infrastructure Efficiency and Greenhouse Gas Reduction: Comparative Assessment
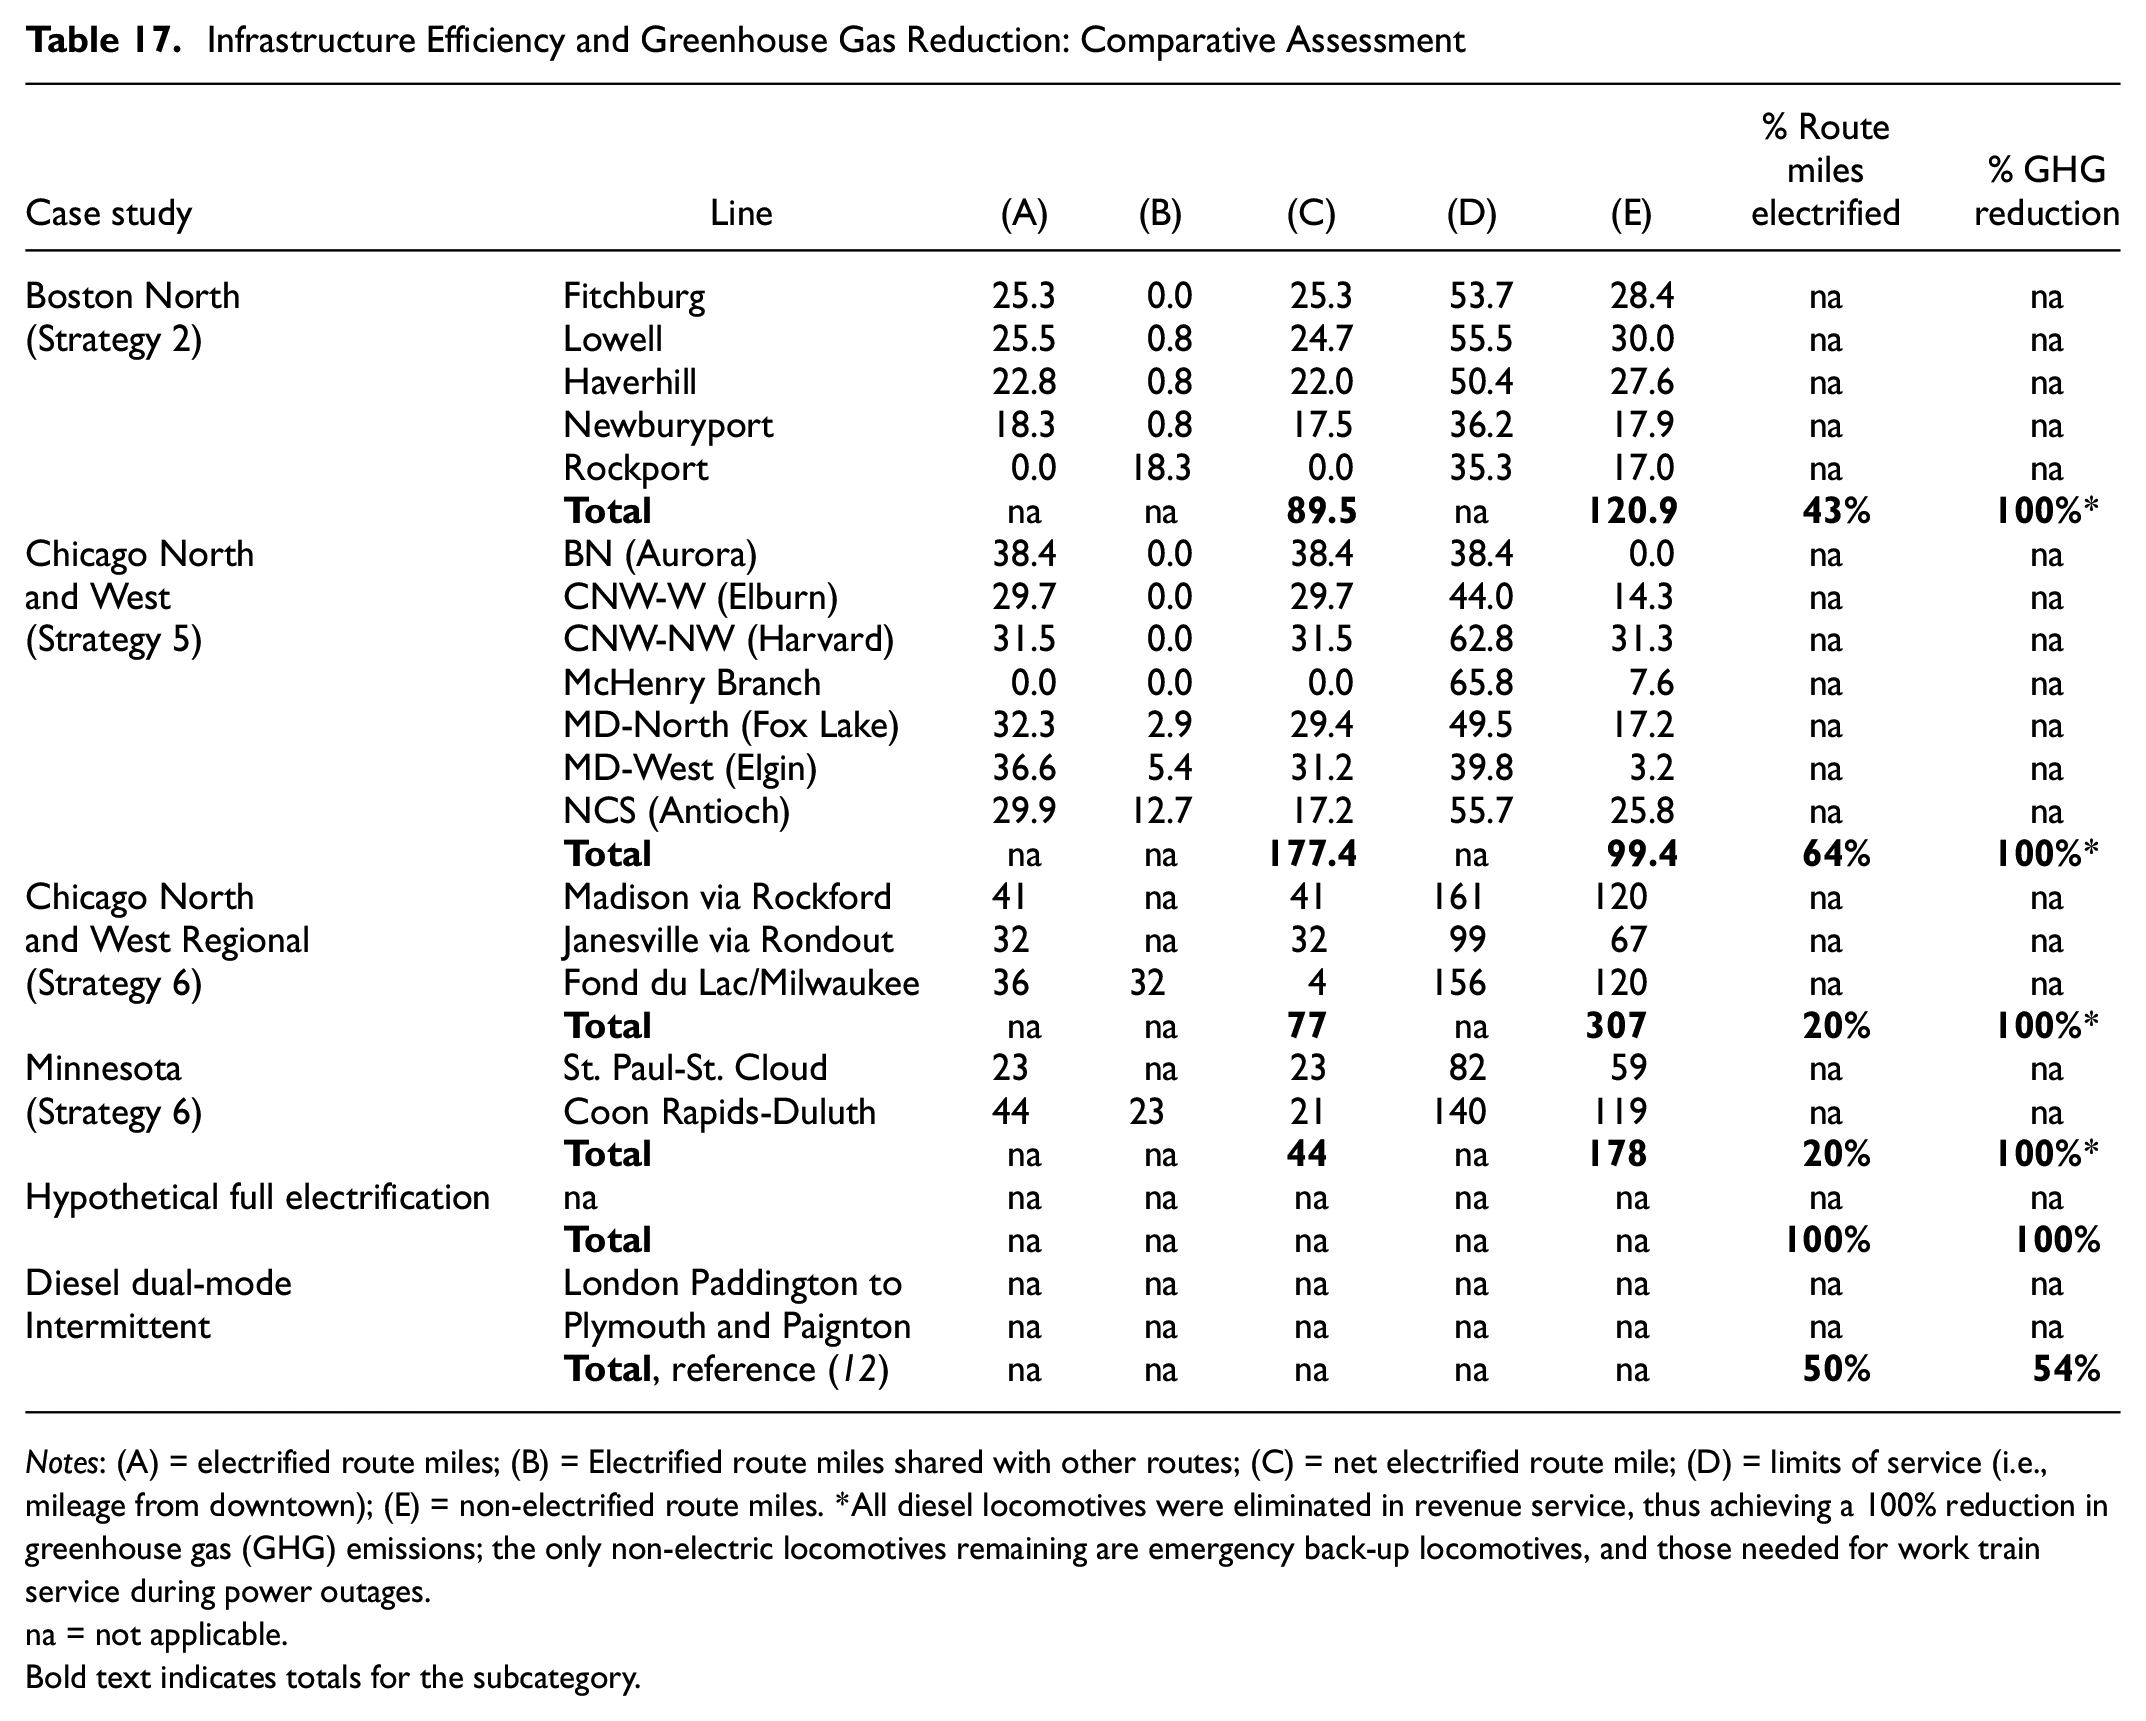
Notes: (A) = electrified route miles; (B) = Electrified route miles shared with other routes; (C) = net electrified route mile; (D) = limits of service (i.e., mileage from downtown); (E) = non-electrified route miles. *All diesel locomotives were eliminated in revenue service, thus achieving a 100% reduction in greenhouse gas (GHG) emissions; the only non-electric locomotives remaining are emergency back-up locomotives, and those needed for work train service during power outages.
na = not applicable.
Bold text indicates totals for the subcategory.
Conclusions
As concern mounts about GHG emissions, commuter railroads should explore electrification and battery technology. Although no BEL has been designed for commuter service as of 2022, it should now be possible to develop a BEL specifically for commuter rail where a market exists. This should be an area for further research, prototyping, and proving out, with research and development funding from government climate action/energy research grants. Combined with judicious electrification based on maximizing each substation’s network reach, BELs offer considerable promise for commuter rail both in operating convenience and environmental sustainability.
We examined six strategies for electrification of traditional commuter rail systems assuming that BELs suitable for commuter service was developed (based on specifications described briefly in this paper). Of these strategies:
Strategies 1 and 2 are suitable for more compact metropolitan areas where commuter lines radiate from a central station in different directions. Strategy 1 is suitable for cities where the commutershed extends out less than 25 mi and does not require the use of BELs. Strategy 2 is suitable for cities with commutersheds up to 50 mi and utilizes BELs.
Strategy 3 is for electric commuter rail cities that are looking to extend electric service beyond existing electrification infrastructure using BELs.
Strategy 4 can be used to provide a regional service to connect two or more commuter rail cities each with existing or future electrified commuter rail systems.
Strategy 5 is suitable for megaregions whose commutersheds extend more than 50 mi from the downtown that do not currently have electrified commuter rail. It may also be suitable for supporting regional services in sparse regions where local desires exist for such service to be electric (rather than operated with alternate fuels).
Strategy 6 can be used to provide regional services beyond the typical commutershed to smaller cities or remote parking facilities that extend up to 120 mi beyond the limits of electrification. Operating more than 120 mi in non-electrified territory is currently a challenge for BELs because their range is not as long as diesel locomotives.
Some practical implementation matters remain to be worked out. But this analysis shows that given current technological progress, a modern electrified network operated with a mixture of straight electrics (locomotives, multiple-unit cars, or both) and BELs should be cheaper than a conventional electric solution and would have a wider geographic reach. Thus, service sponsors should start to examine expanding electric service now, whether by new-start electrification, BEL extensions of existing electrified systems, or new regional or interregional travel opportunities.
Footnotes
Acknowledgements
The authors thank J.E. Kesich, Jim Heimbuecher, Walter Simpson, Lew Hoens, Adam Otsuka, Bob Newhouser, David Mangold, and M.J. Shiffer for useful discussions. The authors are also grateful to the anonymous reviewers at both the Transportation Research Board and the American Society of Mechanical Engineers’ Joint Rail Conference who provided useful feedback on all previous draft manuscripts from this project.
Author Contributions
The authors confirm contributions to the paper as follows: study conception and design: A. Lu, J.G. Allen, S.F. Trout, and J.P. Aurelius; data collection: A. Lu and J.G. Allen; analysis and interpretation of results: A. Lu, J.G. Allen, and S.F. Trout; draft manuscript preparation, J.G. Allen, A. Lu, S.F. Trout, and J.P. Aurelius. All authors reviewed the results and approved the final version of the manuscript.
Declaration of Conflicting Interests
The authors declared the following potential conflicts of interest with respect to the research, authorship, and/or publication of this article: A. Lu is an employee of a commuter railroad but is not acting in his official capacity.
Funding
The authors received no financial support for the research, authorship, and/or publication of this article.
The views are those of the authors and do not necessarily reflect the official policy of any railroads, manufacturers, government bodies, or other organizations.