
Abstract
Little research has been conducted on the financial performance of airports, especially in Europe. This paper employs benchmarking analysis to examine and compare the impact of different airport sizes and ownership structures on the financial performance of European airport companies. The sample consists of 188 European airport companies managing a total of 393 commercial airports. Financial performance is measured from four different perspectives: liquidity, activity, leverage and profitability, using 11 well-established financial metrics during the period 2007–2019. The findings confirm that size and ownership matter for airport financial performance. However, although an initial inspection reveals that medium-sized airports and private airport companies have the best overall performance, there are major differences in relation to different performance areas. For instance, small airport companies show higher liquidity performance and lower profitability, while large airport companies are the most indebted. Furthermore, public airport companies show superior liquidity performance and lower levels of indebtedness and profitability. This analysis provides policy guidance as to which airport companies are better equipped to manage unexpected challenges, such as that posed by the recent COVID-19 crisis, as well as future challenges such as sustainability issues, quality improvements, capacity constraints and attracting private investments.
Keywords
Before the first outbreak of the coronavirus disease in 2019 (COVID-19), the latest data from Airports Council International ( 1 ) showed that, despite the impact of protectionism and trade wars on international air transport services, in 2017 airport traffic had remained resilient at a global level, with all regions experiencing one of the strongest growth rates on record, that is, a 7.5% increase in passengers. In addition, for 2017 the ACI Airport Economics Report 2019 ( 2 ) had revealed a similar resilience of airports’ financial performance in the face of global uncertainties, since revenue had grown 6.2% to reach US$172.2 billion. The return on invested capital had grown to 7.4%, confirming a continuous recovery at an industry level since 2010 ( 3 ). Furthermore, the global medium-term forecast indicated almost 30% growth in passenger numbers from 2017 to 2022.
It is obvious that what was predicted pre-2020 has not been borne out, since aviation has been one of the industries worst affected by the COVID-19 pandemic because of its global nature, the closure of borders and mobility restrictions. In particular, airports have been severely affected in both traffic and financial performance since the second week of March 2020, when almost all national governments implemented strict confinement measures virtually halting activity at airports around the world. In 2020 alone, European airports lost 873 million passengers and €23 billion in revenue ( 4 ). Although the first quarter of 2021 showed small signs of improvement, a genuine recovery did not happen and, in 2021, there was a loss of about 53.2% of global passenger traffic compared with the projected baseline despite a growing number of people being vaccinated and travel restrictions gradually being eased. It has been estimated that airports lost about US$111 billion in revenues in 2021, with Europe being the most affected region in absolute terms ( 5 ).
However, the pivotal role of airports, which are critical for economic development at a local and national level and global connectivity ( 6 ), has never been questioned and appears to be even more important for economic recovery at an international level, for instance, for tackling crises such as that caused by the COVID-19 pandemic. The European Commission adopted the Temporary Framework for State Aid Measures to support the economy in the current COVID-19 outbreak. The Framework set out temporary state aid measures that were considered to be compatible with the European Union (EU) internal market, and that could be approved rapidly on notification by each member state. However, more measures outside the state aid framework, such as temporary derogations to the 2014 Aviation State Aid Guidelines to permit public funding and increase flexibility, were required by ACI Europe in view of the exceptional circumstances. In the US, the Coronavirus Aid, Relief, and Economic Security (CARES) Act provided approximately $10 billion to support US airports experiencing severe economic disruption caused by the COVID-19 public health emergency. This funding came directly from the US Treasury’s General Fund and was administered by the Federal Aviation Administration’s (FAA) Office of Airports to prevent, prepare for, and respond to the impacts of COVID-19. State aid measures in Europe had no impact on the results of this analysis since data are from before 2020, whereas the ‘Temporary Framework’ was launched in March 2020.
Nevertheless, the potential positive impact of airports on economies and societies depends on overall financial health over a long-term perspective. In fact, positive economic returns are required for airports to face major challenges, such as improving service standards to be more competitive, complying with health and safety requirements, reducing pollution and financing new infrastructures to cope with current physical capacity constraints.
Of course, airports may also negatively affect the surrounding communities with noise, emissions, waste, congestion and increased living costs for people, and also cause damage to the endangered nature and animals around the airport. Therefore, it is worth pointing out that it cannot be assumed that the higher the financial performance of airports, the higher the benefits for society, as this depends on an airport’s willingness to integrate sustainability into strategies and share value with stakeholders, including society and the environment ( 7 ).
Assessing airport financial soundness and identifying its determinants are then important to evaluate the survival possibility of different types of airports in case of future disruptive discontinuities such as the unprecedented impact of COVID-19. In fact, the above arguments are true in general for all airports, but particularly for public ones since public funding has become more limited. If the need for investment has always represented a key motivation for airport privatization, crises can substantially affect this process ( 8 ). In this regard, financial health is conducive to attracting new investors, which is even more critical for smaller airports which face a higher risk of insolvency ( 9 ).
Although it is crucial to investigate airport financial performance, since it has a huge impact on future infrastructure development and competitiveness at a country level, there is a paucity of empirical research on the topic. This is likely to result from the persistent view of airports as mere technical extremities of airline operations, which has motivated a much more extensive investigation of airport operational efficiency. The present paper intends to fill this research gap by examining and comparing the financial implications of different airport company characteristics. In particular, it answers the following research question: which airport types present a financial performance suitable for tackling the effect of discontinuities and facing future industry challenges? In particular, two benchmarking analyses are used to establish the impact of different sizes and ownership structures on the financial performance of 188 European airport companies managing a total of 393 commercial airports. Four key financial performance areas relating to liquidity, activity, leverage and profitability are analyzed, using 11 well-established financial metrics during the period 2007–2019.
Literature Review
The rapidly changing environment of the aviation industry, because of the progressive liberalization of regulated air transport markets around the world, has led to a general rethinking of the role of airports. They have moved from being mere monopoly infrastructure providers for aeronautical activities to varied companies competing for traffic and other business opportunities not necessarily associated with the aeronautical side of the industry. The advent of low-cost carriers and, in general, more cost-focused and footloose airlines, more price-sensitive and better-informed passengers, and advances in technology, are among the main factors that have enhanced airport competition. The nature of airport competition lies in their high fixed costs and traffic dependent income streams, which imply the need to outperform other airports by airlines and passengers served ( 10 ).
Passenger and shipper choice “lies at the heart of the airport competition issue” ( 11 ), thus the presence of substitutes (airports and alternative modes of transportation) can make a difference.
Today’s airports are complex, multi-business companies, as they are simultaneously engaged in aeronautical and non-aeronautical businesses, including all the commercial activities in the airport such as retailing, car rental, parking and advertising, as well as real estate or financial investments ( 12 ). This implies the need for substantial amounts of money and expertise to compete with one another to retain and attract airlines, passengers and any other stakeholders who can add value.
Recent studies show that, in Europe, there is an increasing use of secondary airports, mainly by low-cost carriers, but also that passengers still prefer to use their local airports because of switching costs. In addition, the route openings and closures are broadly stable, and this demonstrates that airlines are not becoming increasingly footloose, again because of the switching costs related to investment in facilities, staff recruitment and foregone revenue. Furthermore, a distinction must be made between Europe’s largest airports and smaller airports, since the market power of the former is even less constrained, as shown by increased charges and openings, given their role as hubs ( 13 ).
In parallel, this transformation of airports from public utilities to commercial enterprises adopting a business-like management philosophy has naturally increased airports’ need to gain insights into their operations and to improve their performance by benchmarking themselves against others ( 14 ). Consequently, benchmarking of airports, which can be defined as a performance measurement technique used to compare and monitor their relative performance, has gained momentum in both the academic literature and within the practitioner community ( 15 ). Humphreys and Francis ( 16 ) were among the first to pay attention to this issue by examining the changing nature of the performance measurement of airports, finding that the growth in the extent and sophistication of measurement systems was a response to the gradual transformation of airports into commercial, profit-oriented and competitive entities that need to make better-informed decisions.
Furthermore, some major challenges make airport economics important both to airport companies striving to survive and succeed in an increasingly competitive market and to the development of countries’ economies and societies given the strategic role of the industry.
The air traffic forecasts before the COVID-19 pandemic projected an outstanding passenger growth rate of 5.2% per annum, resulting in over 14 billion global passengers by 2029 and over 20 billion by 2040 ( 17 ). This growth will require existing airports to expand their capacity in new runways, terminals and equipment. In a context in which obtaining state aid or government finance has become more difficult because of increased budgetary constraints at national levels, the ability of airport companies to attract capital markets by envisaging a fair return on investments will be crucial to support airport development. In addition, examining and comparing the financial health of airports is of utmost importance to understand which airports are better equipped to tackle the severe effects of discontinuities, such as the impact of the COVID-19 crisis, and to manage the accompanying challenges of safety, sustainability and quality standards.
In general, most research on airport performance has primarily focused on the topic of efficiency, in line with a view of airport operators as providers and administrators of public infrastructures whose primary aim is to work efficiently. Many studies have empirically addressed the efficiency of airports by investigating how airports combine their inputs to produce a combination of outputs, using both parametric methods, such as stochastic frontier analysis ( 18 , 19 ), and non-parametric methods, such as total factor productivity ( 20 , 21 ), and data envelopment analysis (DEA) ( 22 , 23 ). Among the latter, Barros and Dieke ( 24 ) analyzed the financial and operational performance of Italian airports via four DEA models. Although this was an efficiency analysis, the inputs and outputs included several financial variables. They found that large airports, measured by book value of assets, tend to have higher efficiency scores than small ones and, additionally, that totally private airport companies tend to have higher efficiency scores than partially private airport companies. Similarly, Rotondo ( 25 ) included some financial variables among the inputs and outputs of a DEA to examine the relationship between corporate governance models and the technical and financial performance of Italian airport companies. In this case, findings were also interpreted in light of some airport characteristics such as size, ownership, being listed on a stock exchange, or being part of a multi-airport system (MAS), which occurs when a single company controls a group of airports. Fasone and Zapata-Aguirre ( 26 ) analyzed the research on DEA techniques and described the main complementary procedures refining this technique for improving the operational efficiencies of airports through benchmarking.
Graham ( 14 ) first provided an overview of the attitudes and practical experience of airport benchmarking, finding that although benchmarking techniques have become well established within the airport sector, some difficulties associated with inter-airport comparisons and with dealing with problems of comparability had yet to be resolved effectively. In particular, she pointed out that few benchmarking studies had made a truly international comparison of performance. This is also because airport regulation—including government interventions to discipline both access to the market by companies and access to regulated services by users, as well as setting prices for services—differs by country and may affect airports’ financial performance. For instance, in Europe, industry regulation varies from pure cost-plus models to pure price-cap models and has recently evolved toward hybrid models and ex-ante models ( 27 ). This has led to different regulatory frameworks by time or situation also within the same country ( 28 ).
Fry et al. ( 29 ) explored the use of best practice benchmarking in both the airport and airline industries. They found that airports mainly concentrated on benchmarking with similar organizations and placed a relatively greater emphasis on its use for performance measurement over process improvement. An international data sample of airports and airlines was investigated by Mackenzie-Williams ( 30 ) to highlight several issues that must be considered when making performance comparisons in aviation. Among others, he demonstrated the need for a degree of understanding of contextual factors when comparing airport performance measures. Merkert et al. ( 11 ) reviewed the existing literature on airport benchmarking to assess the advantages and disadvantages of partial productivity measures and discuss parametric and non-parametric methods with reference to previous applications of these methods to the airport sector. From this review, they concluded that although the more sophisticated approaches can deliver powerful insights into the performance of regional airports, some challenges do exist, especially for very small airports, and thus they recommended that an appropriate methodology for comparing the efficiency of regional airports should be based on a combination of approaches. In general, the difficulties of benchmarking relating to comparability and data availability, as well as the influence of selected variables, model structure, and underlying assumptions on the results of benchmarking, were described by Morrison ( 31 ) and Graham ( 32 ). Baltazar and Silva ( 33 ) reviewed and compared several methodologies for benchmarking airports, then used a multiple-criteria decision analysis tool to analyse and improve Spanish airport performance and efficiency. Pacagnella et al. ( 34 ) then carried out a benchmarking study to identify the operational efficiency drivers of international airports.
Conversely, airport financial performance has not sufficiently been investigated to date. Oum et al. ( 35 ) measured and compared profitability (other than productivity efficiency) among major Asia-Pacific, European and North American airports with different ownership structures. They showed that airports with private majority ownership achieve significantly higher operating profit margins than other airports, whereas those with government majority ownership or multi-level government ownership have the lowest operating profit margin. Vogel ( 36 ) assessed the financial performance of 35 European commercial airports for the decade 1990–2000 to identify distinctive features typical for sample airports under different ownership. That study revealed the existence of significant differences between publicly owned and privatized airports. In particular, publicly owned airports generate higher unit revenue and asset turnover, and have a higher debt to equity ratio, while partially and fully privatized airport companies rank higher in efficiency metrics, profit margin, operating margin and cash flow to revenue.
Kato et al. ( 37 ) examined the accounts of 41 Japanese major airports to verify the ability of airports controlled by local governments to be financially viable after the deregulation of the airline market in 2000. They found that these airports were very difficult to sustain financially without subsidies and that size, measured by passenger numbers, mattered for profitability. Vogel and Graham ( 38 ), to assess whether cluster analysis might be useful to select airport groups for comparative financial and economic performance studies, used nine key performance indicators (KPIs) to classify a sample of 73 airports from around the world. A similar approach was used by Richardson et al. ( 39 ), who used four key financial performance indicators to perform a cluster analysis to examine whether the different types of airline lease agreements used by US hub airports support the subcategorization of airport performance indicators. They found that financial performance varies according to traffic mix while airports with the same agreement types are clustered together. The same authors then conducted a pragmatic benchmarking analysis of traditional financial performance ratios and indicators to examine the impact of the different types of airline lease agreements used by 23 US large-hub airports ( 40 ). They highlighted trends relating to five sub-functional areas: cost effectiveness, revenue generation, commercial performance, financial profitability and capital investment.
Fasone et al. ( 41 ) analyzed the financial performance of 14 Italian airport companies related to different ownership forms. They found that companies with a private majority achieved better results in operating income than the others. Fasone and Zapata-Aguirre ( 26 ) then focused on business performance of airports in non-aviation revenues and investigated their determinants, using a dataset of 15 German airports. Their findings revealed a potential conflict between the number of passengers and non-aeronautical revenue, both per passenger and partly per square meter. Yet Fuerst et al. ( 42 ) focused on the determinants and constraints of European airports’ commercial revenues using different independent variables, both internal and external to the airport. They found that while aviation revenues per passenger were mainly determined by the national income per capita in the area in which the airport was located, the percentage of leisure travelers and the size of the airport, commercial revenues per passenger were mainly influenced by the number of passengers passing through the airport, the ratio of commercial to total revenues, national income, the share of domestic and leisure travelers and the number of flights.
More recently, Raghavan and Yu ( 43 ) selected six pertinent financial performance metrics to measure and compare the operational performance, leverage and liquidity of 60 large and medium-sized commercial US airports over the period 2010–2017. Since such airports are owned and operated by government entities, they also discussed the applicability of traditional financial metrics to public entities. Among others, findings revealed that the effect of airport size is inconclusive, since large airports have better liquidity while medium-sized airports have better leverage.
The growing pressure for policymakers, practitioners and academics to have more detailed information about airport performance and compare business processes and performance metrics to industry bests has led the main international industry associations and scientific societies to develop projects based on annual surveys to collect and benchmark financial performance data against airports ( 44 ). This is the case for the Global Airport Benchmarking Report by the Air Transport Research Society (ATRS), published for the first time in 2001, and the Airport Economics Report released by the ACI since 1997. The 2021 edition of the ACI report provides a representative picture of the industry before the COVID-19 pandemic, which serves as a landmark and reference to assess the recovery of the airport business.
In the US, the Congressional Budget Office (CBO) ( 45 ) was the first to understand the importance of examining and presenting the financial strength of an airport to potential investors. It suggested the following four financial indicators to be measured: operating ratio, net take-down ratio, debt to asset ratio and debt-service safety margin. These financial ratios were compared between the US commercial airports for the periods from 1975–1978 to 1979–1982 and it was concluded that their financial performance had improved on every metric except debt to asset ratio. Furthermore, the Federal Aviation Administration (FAA) Authorization Act of 1994 required commercial service airports to file financial reports annually with the FAA. As a consequence, the Certification Activity Tracking System (CATS) was created to gather and disseminate congressionally mandated airport financial information. Based on this information, airports’ credit ratings are determined by the main credit rating agencies.
Definitively, research suggests that airport financial performance is influenced by several different variables, with no single one playing a dominant role. However, precise identification of the determinants of airport financial performance is difficult because of the different approaches used in the studies on the topic, as well as their contradictory results. In the meantime, official reports suggest that some factors, such as size, seem to have a role in driving financial performance of airports. In fact, as reported by the ACI’s Airport Economics Report 2019 ( 2 ), although the global airport industry was profitable on the aggregate level before the advent of the COVID-19 crisis, 94% of all loss-making airports (which were two-thirds of the total) handled annual traffic volumes below one million passengers, suggesting that large airports are better. The disparity between large and small airports is a challenge that appears to be even more serious when considering that 80% of airports in the world are small. However, more empirical analyses are required to assess the impact of size on financial performance and, in particular, to explain the reasons for that, for instance, economies of scale or the possibility of gaining multiple non-aviation revenue streams. The outstanding growth in air transport demand predicted for the near future requires airports to be able to invest a huge amount of money in infrastructure and service improvement. In this regard, the question of financing infrastructure development becomes critical for airport companies, regardless of their size or ownership structure. The business transformation of the industry has pushed airports of all types to become more efficient and boost service quality to attract new demand and investors. Considerable levels of investment are essential prerequisites to continue to deliver increased capacity, quality and connectivity for both publicly owned airports, which face a persistent dearth of public funding, and privately owned airports, which struggle to attract new investors. In many contexts, the number of fully publicly owned airports has decreased. For instance, in Europe, the percentage of this ownership type of airports dropped from 78% to 59% between 2010 and 2016 ( 46 ), with a vast majority of public airports now “corporatized,” that is, structured and run as independent commercial entities. Elsewhere, there persists a divisive view between privately owned airports, which attempt to maximize returns for shareholders and investors like any other business, and publicly owned airports (e.g., many airports in the US), which are primarily aimed at generating local economic benefits. It is, therefore, logical to ask whether the traditional distinction between public and private airports is beginning to blur and lose significance in regard to airport companies' financial performance.
Although most studies reveal that larger and private airports are more profitable and efficient, this is not considered an assumption. Since findings are rather inconclusive, the rationale behind this study is that financial performance has many facets that must be simultaneously considered to account for overall financial health. A new explorative approach is required to shed light on the areas included in the concept of financial performance and their relationships. As a consequence, the only assumption is that airport company types (i.e., size and ownership) perform differently in relation to specific financial performance areas, and their overall performance stems from different relationships among these areas.
Methodology
This paper focuses on the European airport market. The final sample includes 188 airport companies, with a total number of 393 airports involved in commercial aviation operations for transporting passengers, cargo, or both, via scheduled flights, charters and aerotaxi services. In particular, sample airports are from 37 countries, divided between 27 EU countries and 10 countries that are not part of the EU. Airports by country and their main characteristics are shown in the Appendix (Table A). Selecting airports from a single continent served the dual purpose of eliminating accounting differences among companies and limiting contextual factors potentially affecting competition (such as differences in traffic development, operational conditions and governance structure).
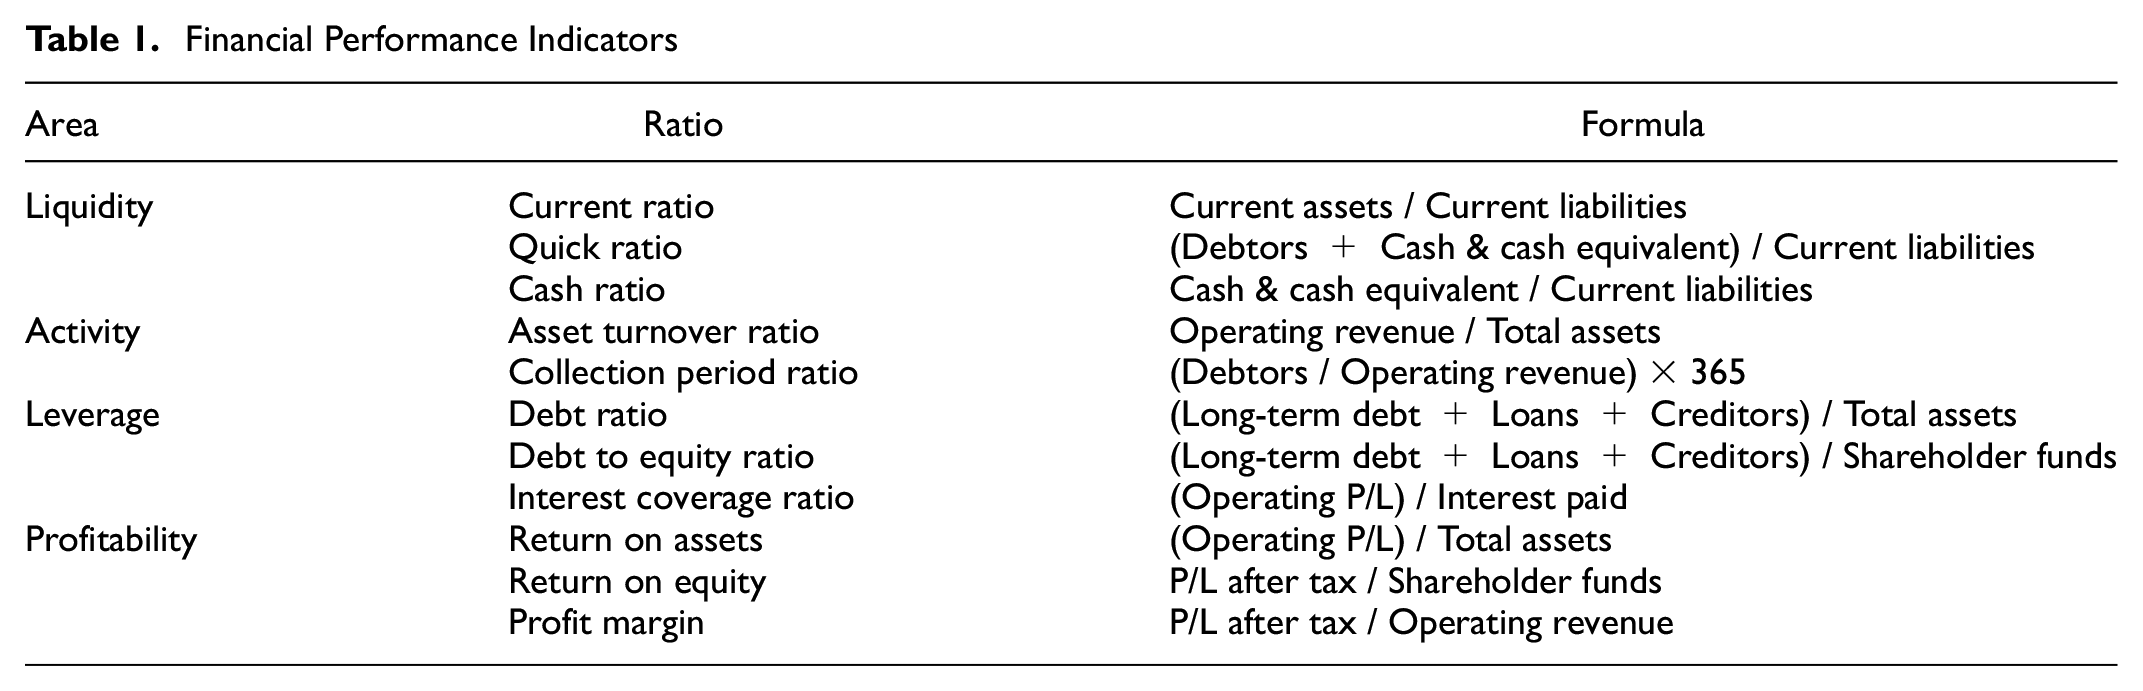
Based on the literature on financial analysis and official industry reports and studies (ACI, ATRS, CBO, CATS), this paper analyzes four key financial performance areas relating to liquidity, activity, leverage and profitability, by using 11 well-established financial metrics measured during the period 2007–2019. The rationale behind this approach is that financial performance is a complex concept made up of many facets, and several equally important measures representing its main areas, as mentioned above, must be simultaneously considered to assess a company’s financial health and viability. Table 1 reports and explains the 11 indicators, which have been calculated using a unique source of data, the Orbis database by Bureau van Dijk, which contains comprehensive and detailed business and financial data on companies across the globe. In general, it is difficult to compare financial data because of different accounting standards across countries and different ownership structures (for instance, the prevalence of the public or private sector as shareholders or the presence of companies listed on a stock exchange). However, these issues are addressed by the use of data that are, first, collected from audited financial statements and, second, standardized to homogenize accounting differences and make them comparable. All values are expressed in euros.
Financial Performance Indicators
Two benchmarking analyses are used to establish the impact of different airport sizes and ownerships on the financial performance of European airports. Benchmarking is a performance measurement technique widely used to assess and compare relative performance of airports ( 15 , 47 ). Based on the use of KPIs, it promotes intuitive performance comparisons and the identification of trends, the knowledge of which is crucial to improve airport management decisions ( 33 ). Although issues related to comparability and data availability may affect benchmarking analysis ( 31 , 32 , 38 ), this method remains the most appropriate to highlight both relative overall performance and trends relating to sub-functional areas ( 40 ).
First, the 188 airport companies were categorized according to the size of airports they control, using the EU airport classification, which identifies five categories: category A (large Community airports handling more than 10 million annual passengers), category B (national airports with between five and 10 million annual passengers), category C (large regional airports with between one and five million annual passengers), category D (small regional airports with fewer than one million annual passengers), category E (small local airports with fewer than 250,000 annual passengers). We aggregated them into three categories: large airport companies (total passengers of category A), consisting of 41 units, medium airport companies (total passengers comprised in the ranges of category B and category C), consisting of 70 units, and small airport companies (total passengers comprised in the ranges of category D and category E), consisting of 77 units. These groups were benchmarked against one another and the industry mean. Following previous studies ( 39 ), for each performance indicator, the three size types were given a score from 3 to 1, where the best in class (i.e., the type showing the higher value) was given a 3 and the worst (i.e., the type showing the lower value) was given a 1. In line with Richardson et al. ( 39 ), we considered average values over the period 2007–2019. This enabled the size types to be given a total score and a score for each financial performance area (liquidity, activity, leverage and profitability).
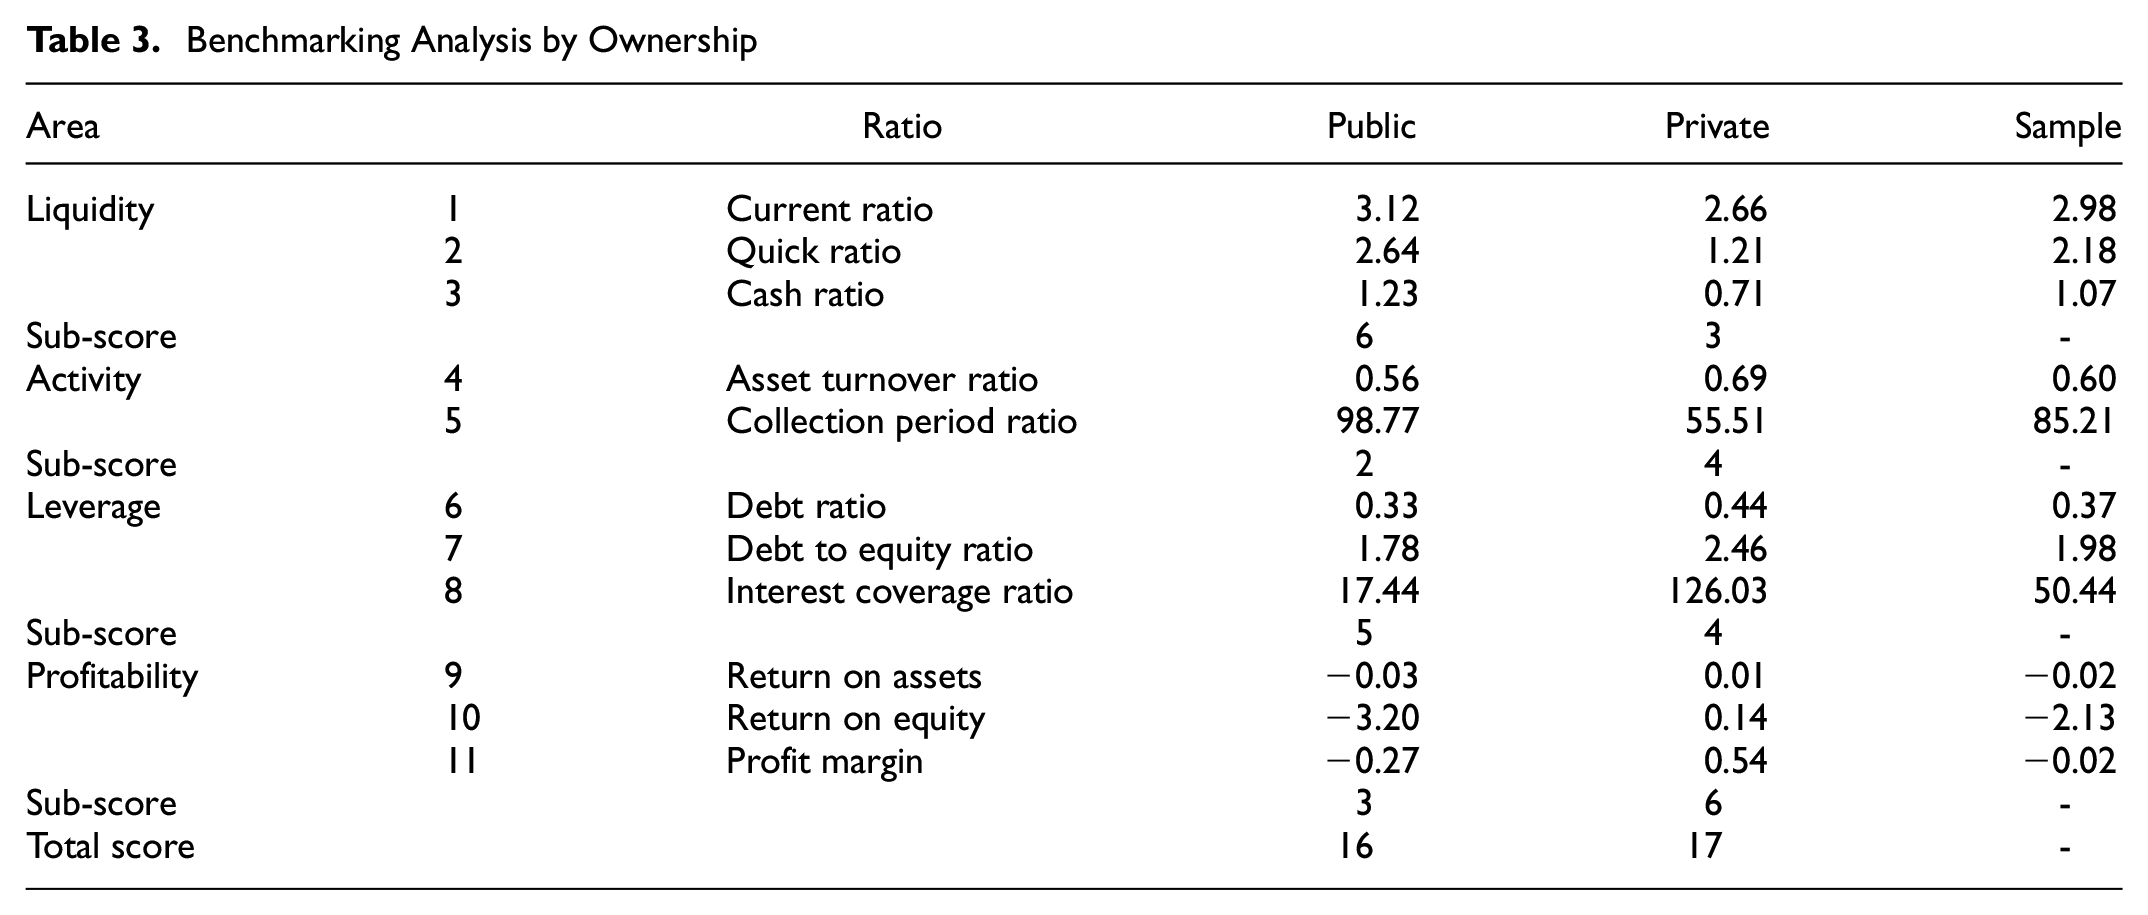
Second, the 188 airport companies were categorized according to their ownership using the classification proposed by the ACI in its report on the ownership of Europe’s airports ( 46 ): fully public companies, fully public corporatized companies, mostly public companies, companies with an equal public and private capital, mostly private companies and fully private companies. To focus on the differences between airport companies having public or private majority ownership, we grouped them into two categories: public airport companies (fully public companies + fully public corporatized companies + mostly public companies), consisting of 127 units, and private airport companies (mostly private companies + fully private companies), consisting of 59 units. Two airport companies with an equal public and private capital (Flughafen Duesseldorf GMBH and TAV Yatirim Holding Anonim Sirketi) were excluded from this benchmarking analysis. Again, in line with Richardson et al. ( 39 ), for each performance indicator, the two ownership types were given a score from 2 to 1, where the best in class (i.e., the type showing the higher value) was given a 2 and the worst (i.e., the type showing the lower value) was given a 1. We considered average values over the period 2007–2019. This enabled the ownership types to be given a total score and a score for each financial performance area (liquidity, activity, leverage and profitability). By considering average values of the indicators for each single year over the period investigated, we also examined and compared trends among both size types and ownership types.
In both benchmarking analyses, outliers were removed to improve comparability. The principle was to consider as outliers those values not just different from the majority of the sample but also not representative of the population, potentially distorting the analysis. For outlier detection, for each financial metric, the data values were converted to standard scores and, taking account of the sample size, a threshold value of three or greater was set for the designation of an outlier. After outliers were identified, on the retention or deletion of each one was decided after a qualitative case investigation aimed at assessing whether they were indicative of the characteristics of the population or not. In the end, the following outliers were removed: all the liquidity ratios for Graz airport and Kerntner airport; the “current ratio” for Vinci airports; the “asset turnover ratio” for Zagreb airport; the “collection period ratio” for Vinci airports; the “debt to equity ratio” for Maribor airport, d’Angers Marce airport, Tulcea airport, Brugge airport, Karlovy Vary airport, Novaport, DAA International Limited, Hermes airports, Aktsionernoe airport, Liverpool airport and Trapani airport; the “profit margin” for Vinci airports.
The benchmarking analyses were completed through a trend analysis for each indicator to shed light on the evolution of the average financial performance of the three size types and the two ownership types of airports over the period investigated. Furthermore, to support and complement our results, a panel data model with random effects was used to estimate the determinants of financial performance of European commercial airports. We chose to adopt a random effects model because some key variables of interest, such as type of ownership and being a multi-airport company, are time-invariant, and the effect exerted by these types of variables cannot be estimated by alternative panel data models such as the fixed effects method and the first different method.
The dataset was unbalanced, since not all panel members were observed every period. This was, first, because airport companies have different dates of establishment and operating periods and, second, because of lack of full financial data availability over the period 2007–2019. This was done to use as much data as possible and was not an issue because missing data were within acceptable ranges given the large sample size and the number of observations.
Three measures were selected and used as independent variables, namely, size and ownership, which represent the criteria used to benchmark airports, and managing a MAS, which occurs when a single company controls a group of airports. The latter was included in the analysis since previous studies revealed that managing a MAS, at least within certain traffic thresholds, negatively affects an airport company’s financial performance ( 48 , 49 ). These variables were measured as follows:
Size was measured by considering annual passengers flying from and to airports (Pax);
Ownership was evaluated as the degree of private ownership following the categorization proposed by the ACI Europe report ( 46 ). This was done to complement the benchmarking analysis as it adds a further key aspect, such as the different impacts on the financial performance of the increased presence of private capital. Consequently, this qualitative variable was transformed into an ordinal variable. In ascending order of privatization, the value 0 was given to fully public companies, 1 to fully public corporatized companies, 2 to mostly public companies, 3 to companies with an equal public and private capital, 4 to mostly private companies and 5 to fully private companies;
Being a multi-airport company (MAS) was measured by a dummy variable taking the value 0 if the company controlled one airport and 1 if the company controlled more than one airport.
Three further control variables were used as independent variables since they might have an impact on the dependent variables. They were related to the socioeconomic characteristics and attractiveness of an airport’s country of origin:
Gross domestic product (GDP) per capita in purchasing power standards, which accounts for the economic activity, wealth and willingness to fly of the population;
Population (Pop), which accounts for potential national market size;
Nights spent at tourist accommodation establishments (Nights), which accounts for attractiveness of a country and completes the information provided by the previous control variable about the potential size of air transport market.
In this case, the main sources of data were the official reports of the aviation authorities of each country and the EU website and database for passenger information, the ACI Europe report ( 40 ) for ownership information and the annual reports and websites of each airport company for MAS information. To have comparable and harmonized information on these aspects, Eurostat was used as unique source of data for the three control variables. Consequently, 24 airport companies were excluded from panel regression since data on the control variables were unavailable.
The 11 financial metrics used in the benchmarking analyses were used, one at a time, as the dependent variable.
Results
The findings of the two benchmarking analyses are shown in Tables 2 and 3 and presented below separately. For the benchmarking analysis by size, the initial inspection of the empirical results suggests that medium-sized airports are the best type for financial performance, achieving a total score of 25, followed by small airports with 22 and large airports with 19. However, it is believed that more useful information can be drawn from the examination of sub-scores related to each performance area. For instance, examination of the “liquidity area” reveals a clear trend related to size, since all indicators and, consequently, the sub-score, steadily decrease with size increase. Furthermore, examination of the “activity area” reveals that while small airport companies have a higher ability to generate revenue from their assets, large airport companies are more able to turn their accounts receivable into cash during a given period. Although medium airport companies continue to perform better in “leverage” and “profitability” areas, it is worth highlighting some key differences among different types related to specific indicators. For instance, as regards “leverage,” small and medium-sized airport companies are the least indebted in relation to total assets and shareholder funds, respectively, but they have opposite performances in interest coverage through operating profit/loss, with small airport companies being the worst and medium airport companies the best. Large airport companies are the most indebted in relation to both total assets and shareholders’ funds. With reference to “profitability,” small airports show negative values (and the worst ones) for all the three indicators. Profitability performances are basically the same for medium and large airport companies, but it is worth noticing that while large airport companies have a negative value of return on assets (ROA), they are the best performers in relation to return on equity (ROE).
Benchmarking Analysis by Size

Benchmarking Analysis by Ownership
Figures 1 to 11 show the evolution of the average financial performance of the three sizes of airports. They are useful to compare trends for each performance area over the period investigated.

Average liquidity ratios: Current ratio 2007–2019 (size).
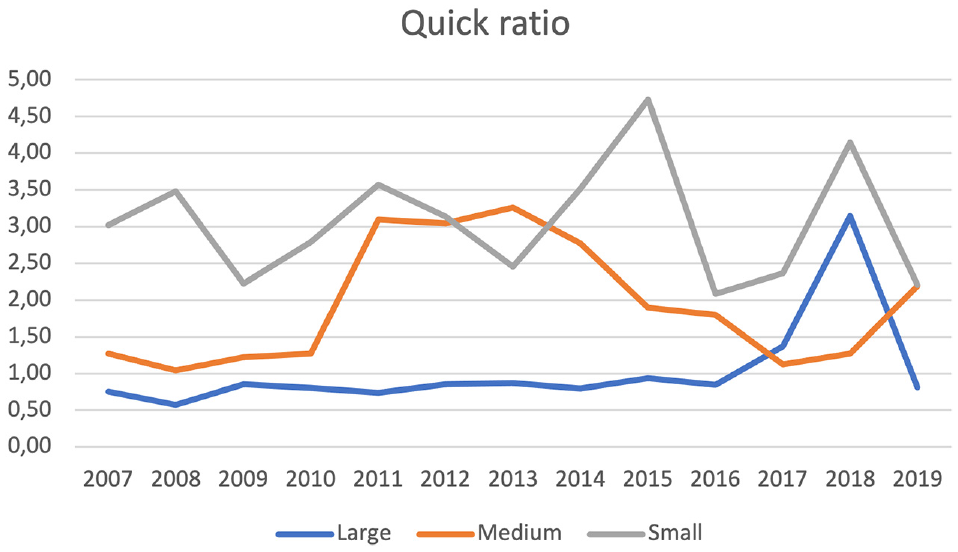
Average liquidity ratios: Quick ratio 2007–2019 (size).
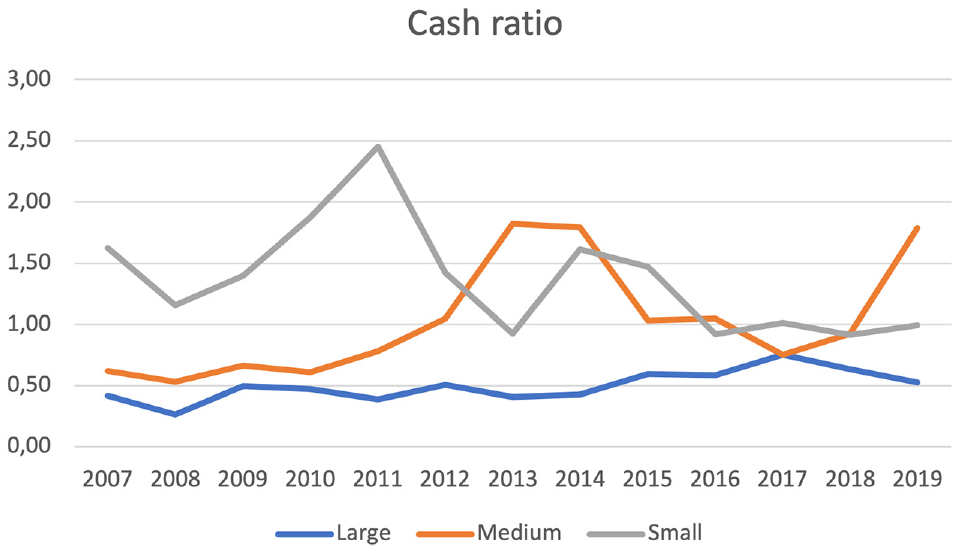
Average liquidity ratios: Cash ratio 2007–2019 (size).
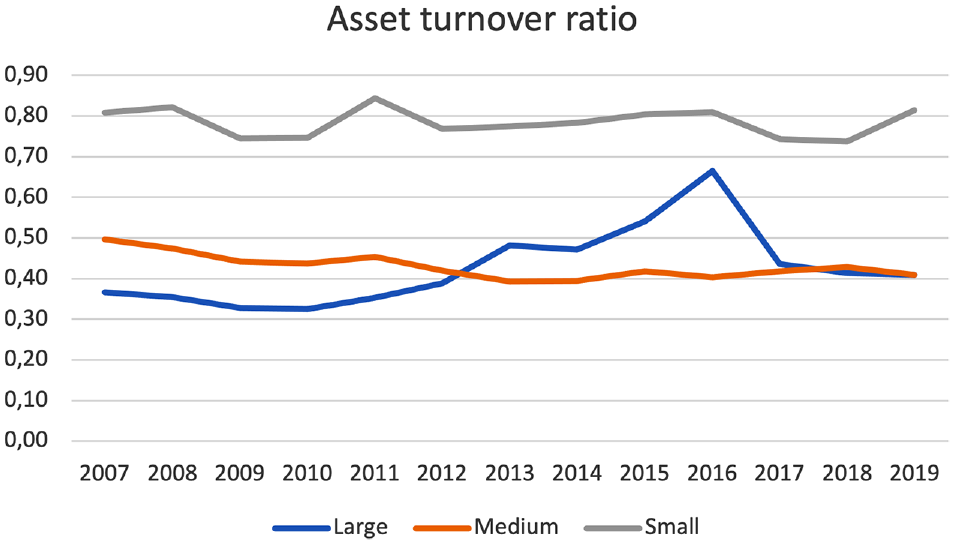
Average activity ratios: Asset turnover ratio 2007–2019 (size).
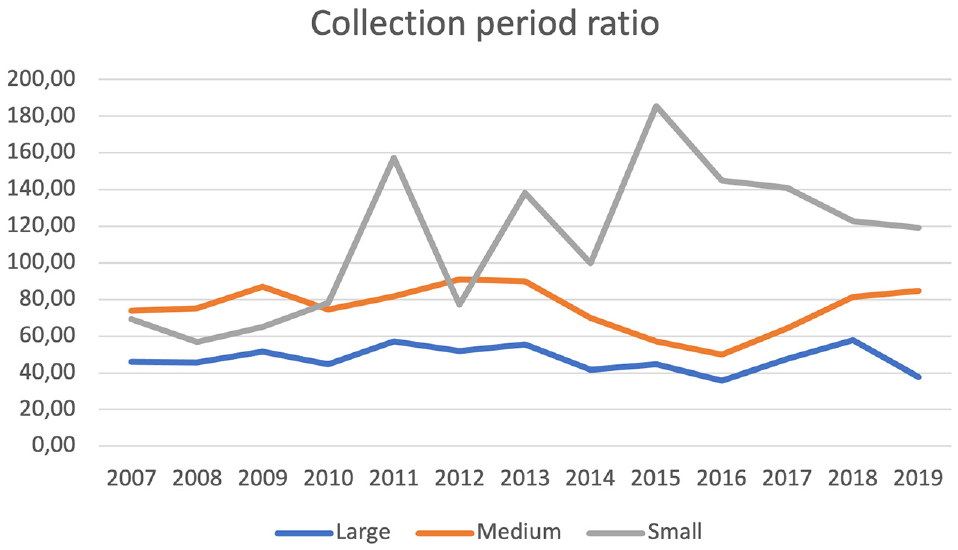
Average activity ratios: Collection period ratio 2007–2019 (size).

Average leverage ratios: Debt ratio 2007–2019 (size).
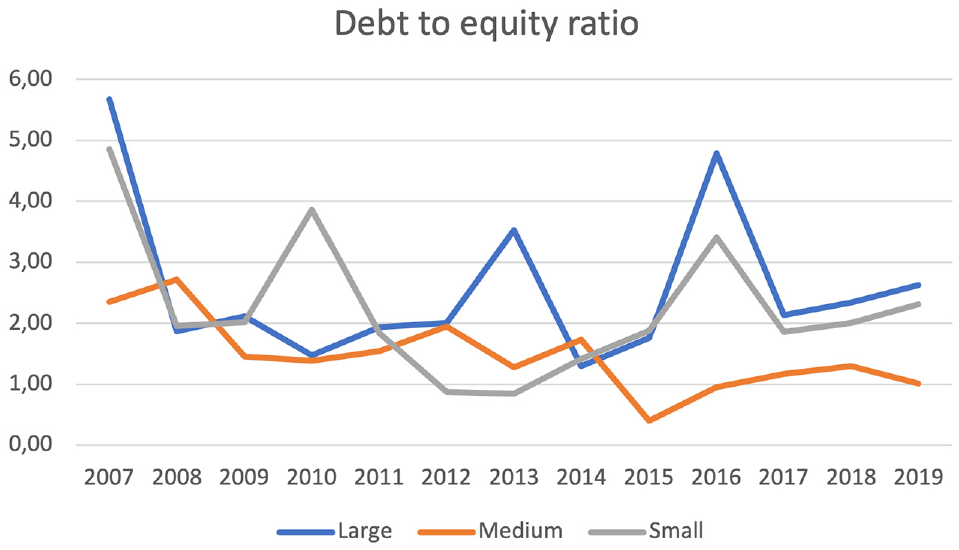
Average leverage ratios: Debt to equity ratio 2007–2019 (size).
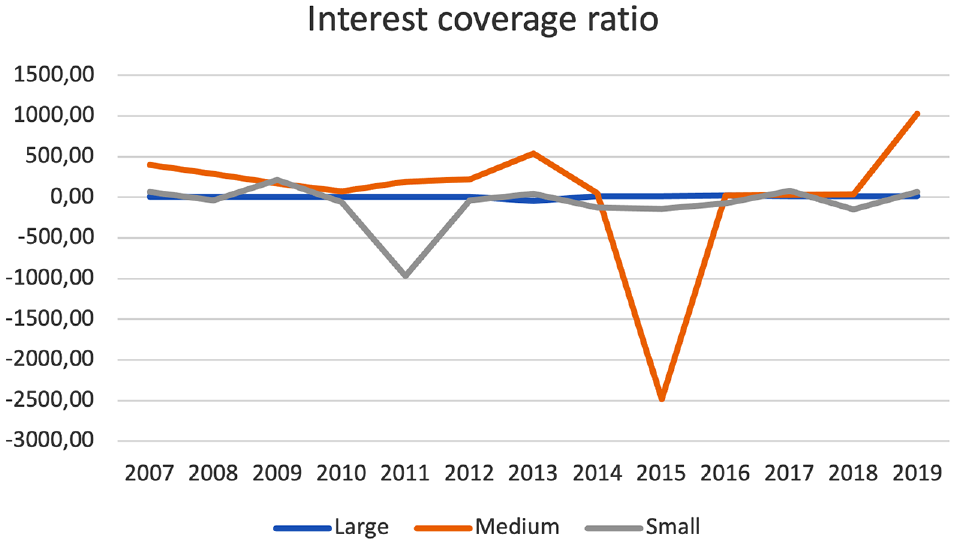
Average leverage ratios: Interest coverage ratio 2007–2019 (size).
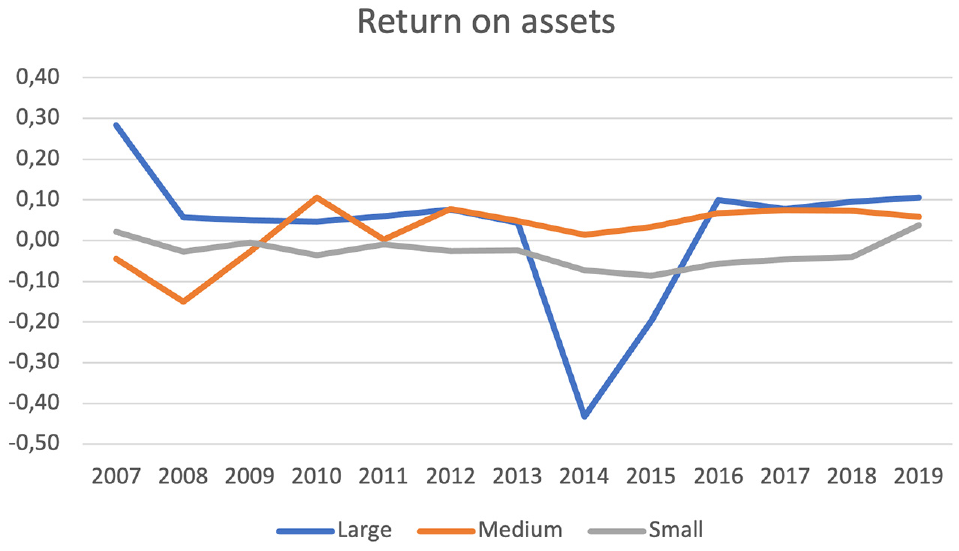
Average profitability ratios: Return on assets 2007–2019 (size).
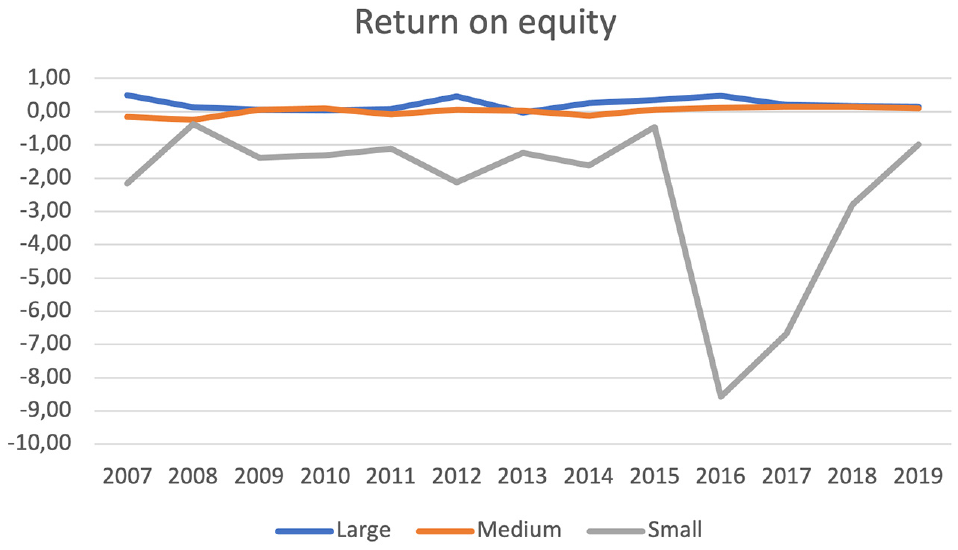
Average profitability ratios: Return on equity 2007–2019 (size).
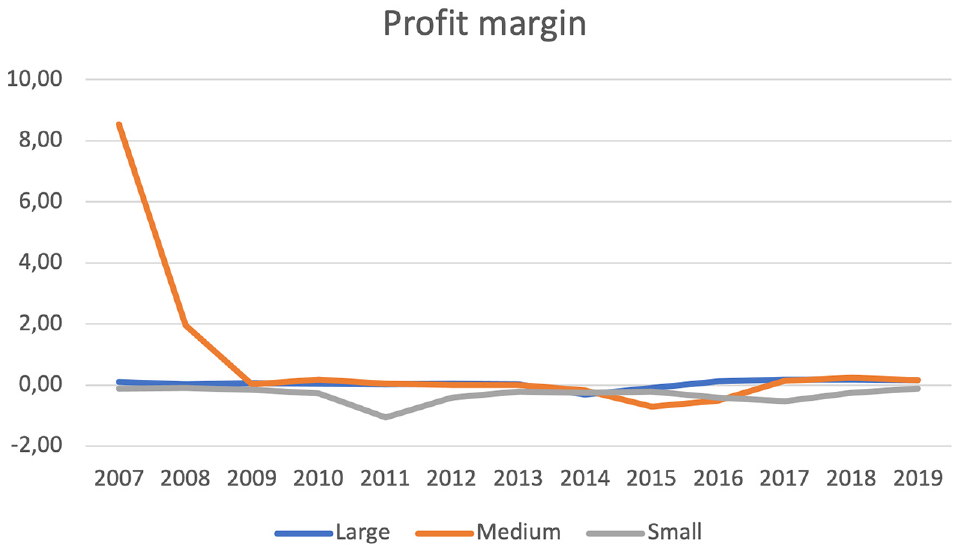
Average profitability ratios: Profit margin 2007–2019 (size).
With regard to liquidity ratios, it is easy to grasp the steady higher liquidity that characterizes small airport companies, while the lines representing medium and large airport companies’ values often intersect over time.
The activity ratios confirm a far higher value of the asset turnover ratio of small airport companies across the period, but also the larger number of days it takes them to convert their accounts receivable into cash. Conversely, large airport companies distinguish themselves for the least days required to collect their accounts receivable over the period. With regard to the leverage ratios, a clear trend emerges only in relation to the debt ratio, since the level of indebtedness is always directly connected with the number of annual passengers handled by airports. With reference to profitability ratios, it is interesting to focus on ROE trends, which reveal steady lower values for small airport companies and similar values across the period investigated for medium and large airport companies.
With regard to the benchmarking analysis by ownership, initial inspection of the empirical results suggests that private airport companies are slightly better than public airport companies in financial performance, achieving a total score of 17 versus 16. However, it is important to examine sub-scores to understand how overall performance is achieved and what main differences affect the two airport types. Similar to the previous benchmarking analysis, a clear trend emerges from the consideration of the “liquidity area” since public airports report higher values in all the three indicators. Conversely, “activity area” performance is shown to be better for private airport companies, which are more able both to generate revenue from their assets and to turn their accounts receivable into cash during a given period. With regard to the “leverage area,” public airport companies are less indebted in relation to both total assets and shareholder funds, but private airport companies show much higher ability to cover interest through operating profit. The main difference between the two types lies in profitability performance, which is considerably higher for private airport companies. In particular, while private airport companies report positive values for all the three profitability indicators, public airport companies have negative values for all three indicators.
Figures 12 to 22 show the evolution of the average financial performance of the two ownership types of airports for each performance area over the period investigated. With regard to liquidity ratios, except for the 2007 “current ratio,” there is a clear higher performance of public airport companies for all the three indicators throughout the period investigated. A clear trend is also visible in the “activity” area, considering that private airport companies perform substantially better in both indicators for all years.
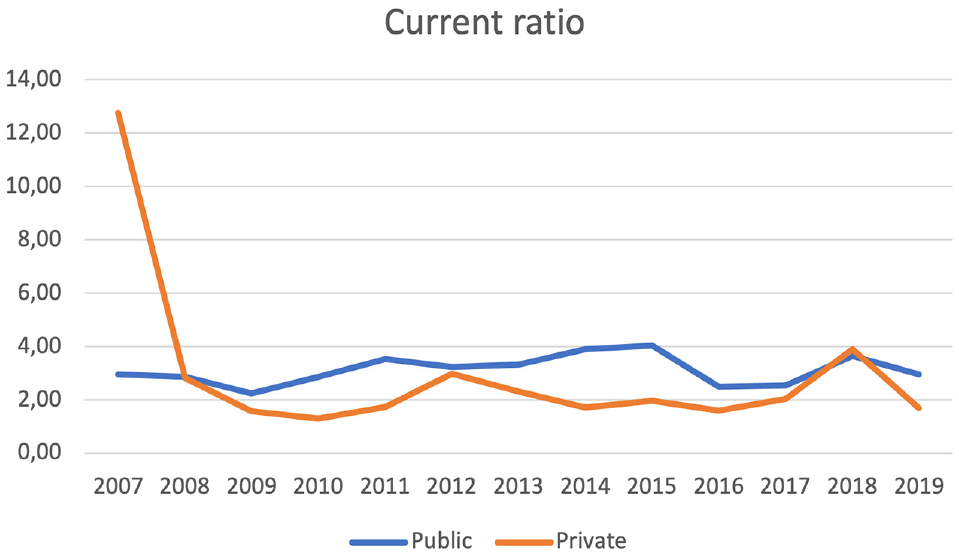
Average liquidity ratios: Current ratio 2007–2019 (ownership).
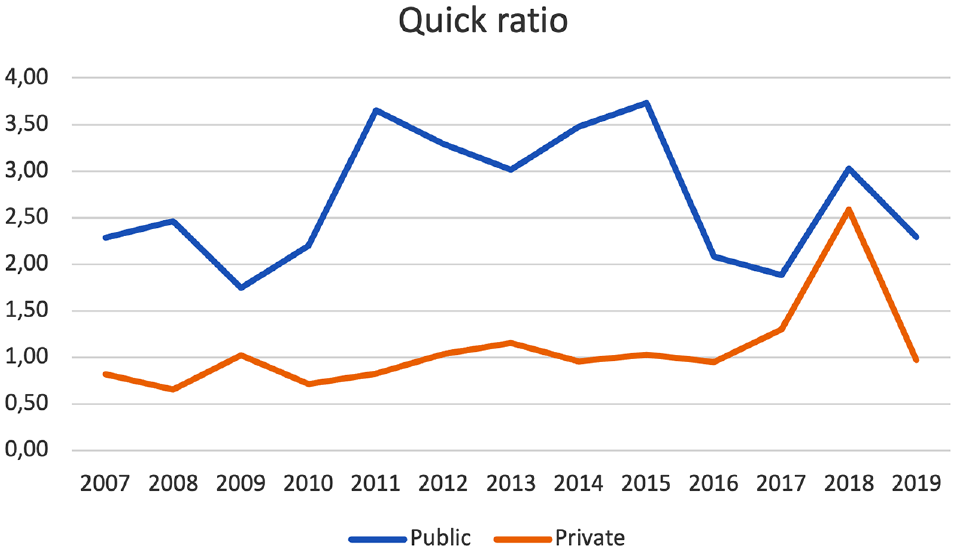
Average liquidity ratios: Quick ratio 2007–2019 (ownership).
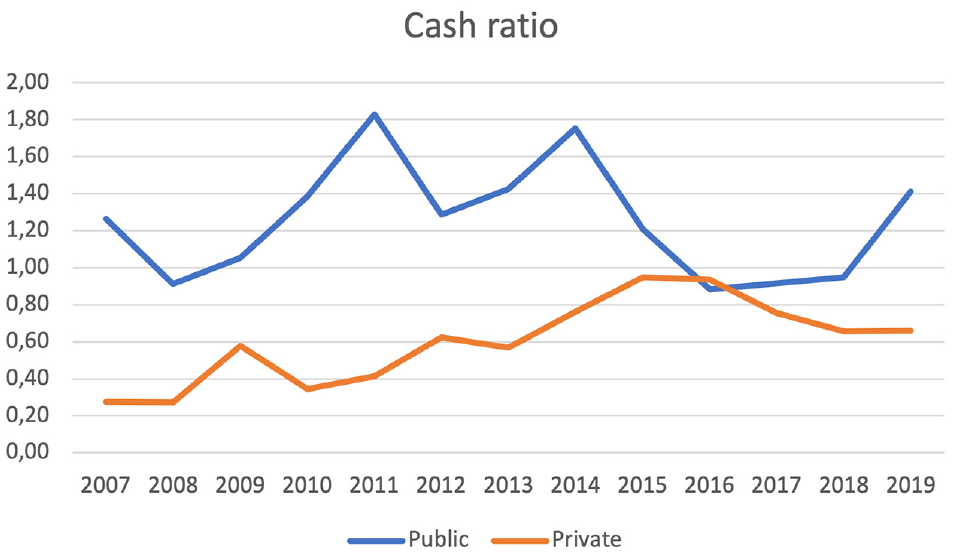
Average liquidity ratios: Cash ratio 2007–2019 (ownership).
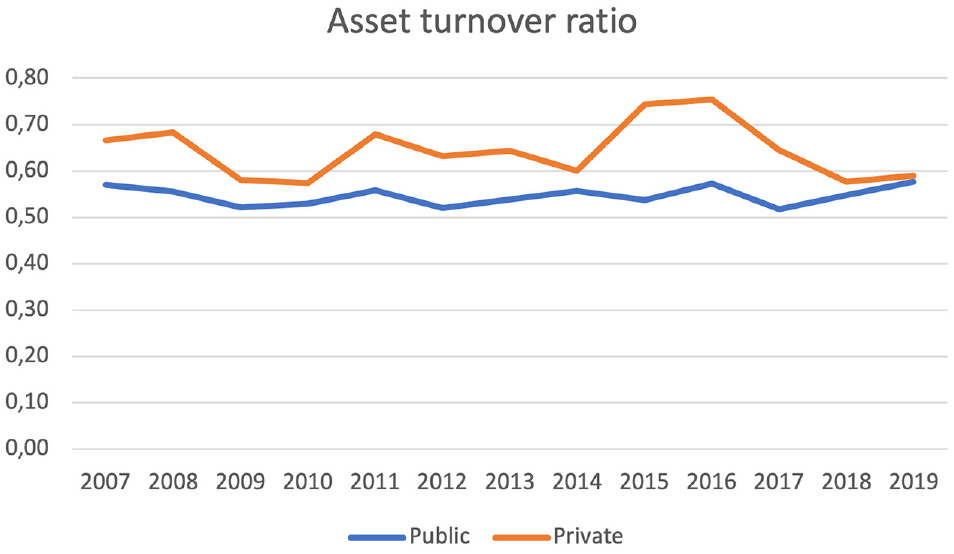
Average activity ratios: Asset turnover ratio 2007–2019 (ownership).
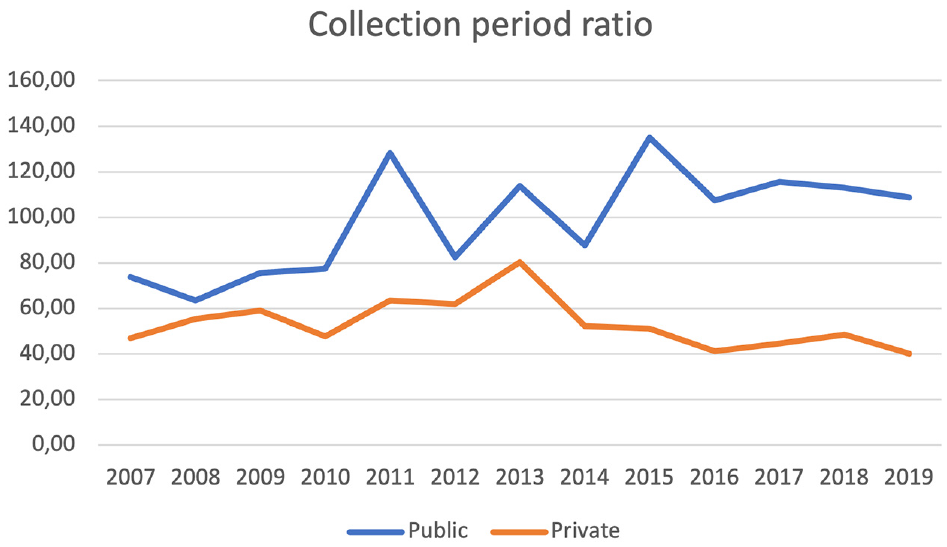
Average activity ratios: Collection period ratio 2007–2019 (ownership).
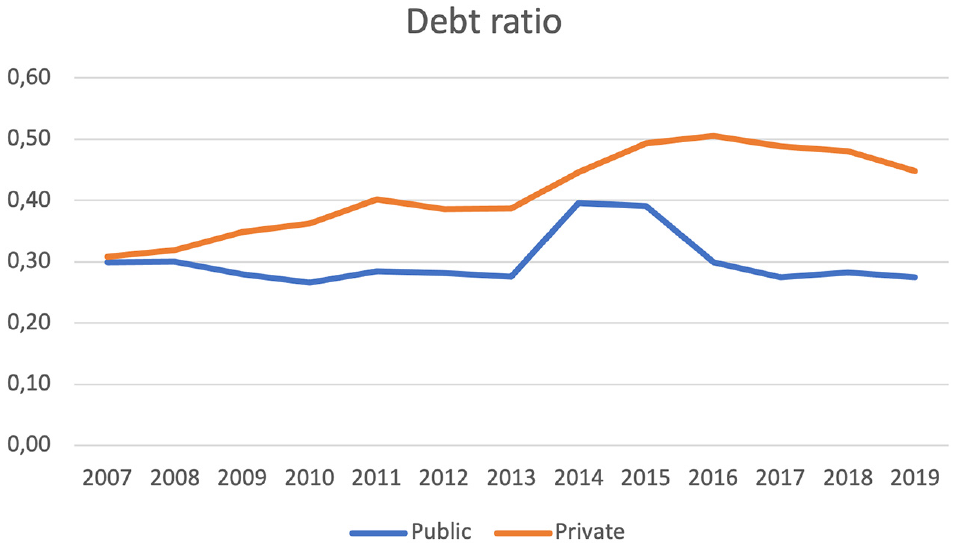
Average leverage ratios: Debt ratio 2007–2019 (ownership).
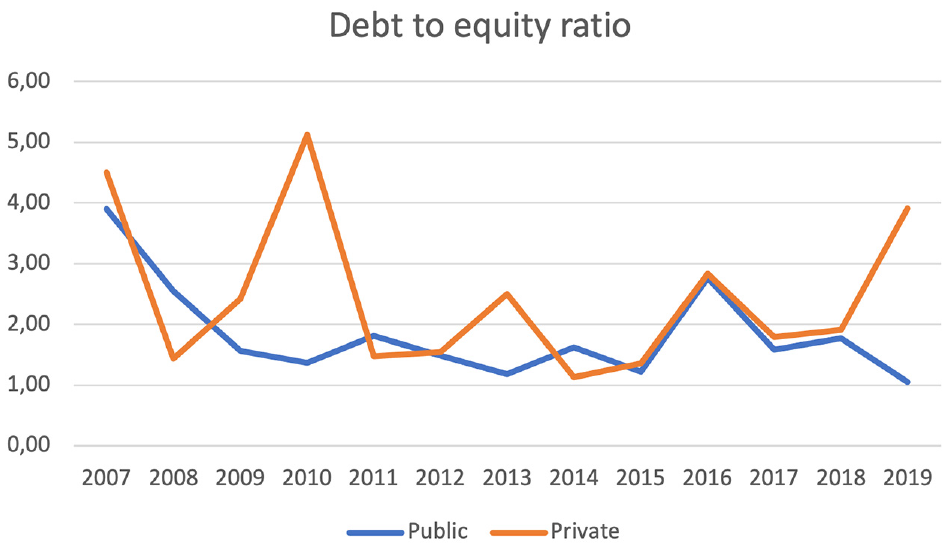
Average leverage ratios: Debt to equity ratio 2007–2019 (ownership).
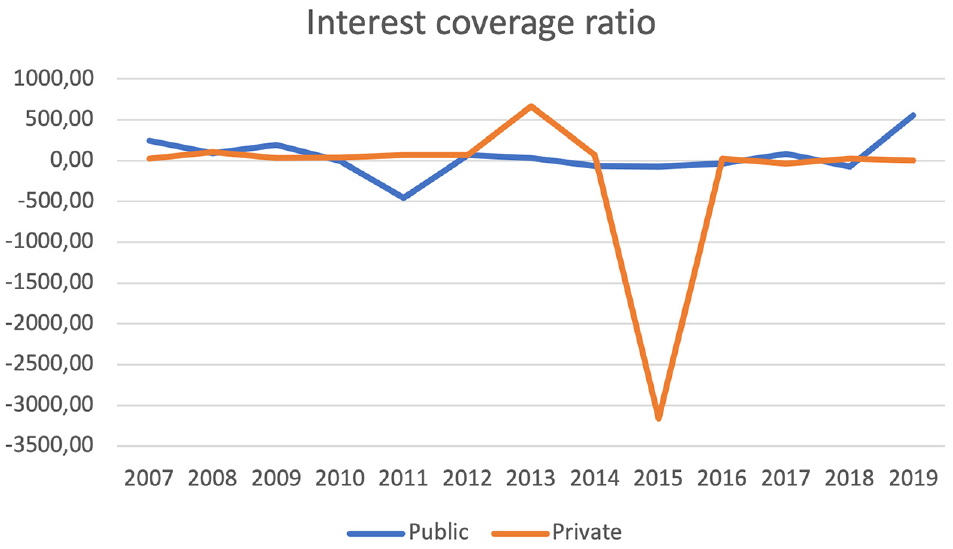
Average leverage ratios: Interest coverage ratio 2007–2019 (ownership).
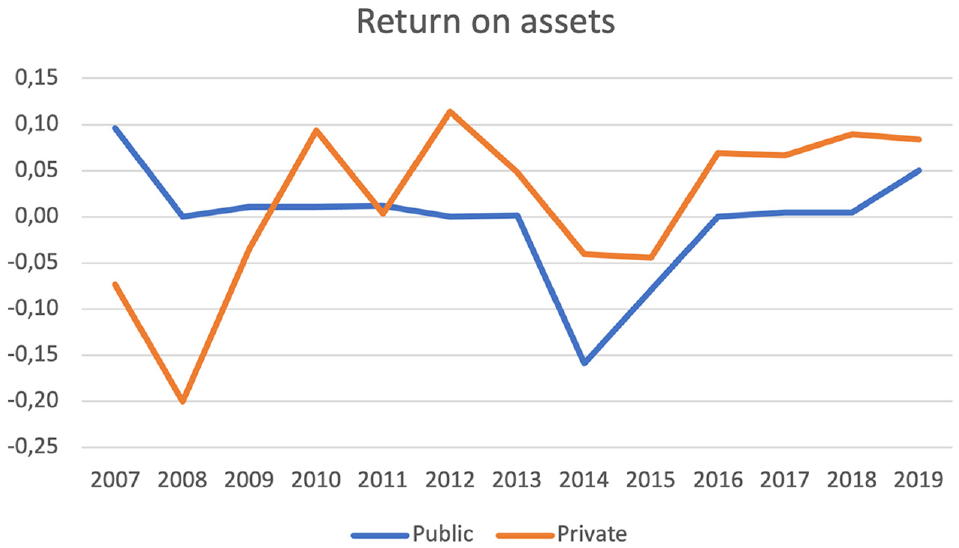
Average profitability ratios: Return on assets 2007–2019 (ownership).
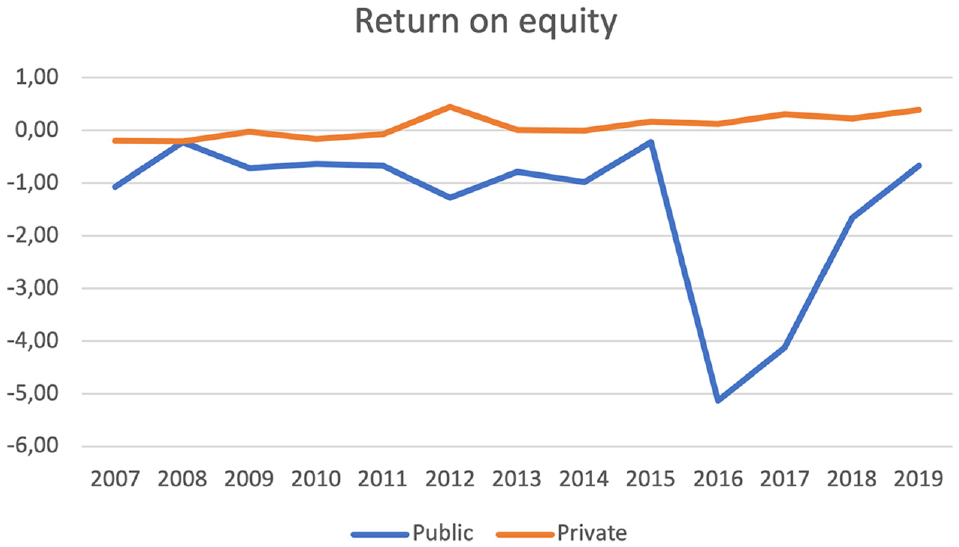
Average profitability ratios: Return on equity 2007–2019 (ownership).
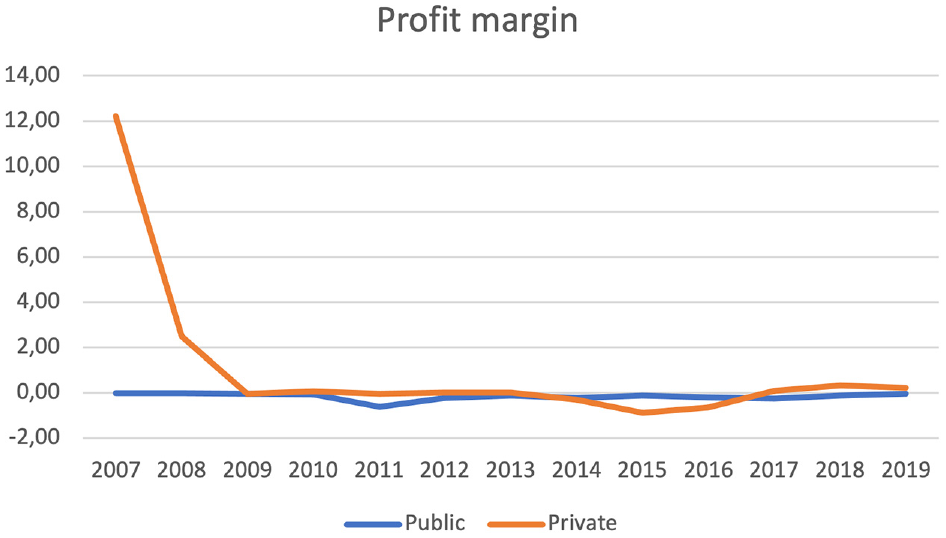
Average profitability ratios: Profit margin 2007–2019 (ownership).
With regard to the “leverage area,” a clear trend emerges only in relation to the debt ratio, which is steadily higher for private airport companies, while the lines relating to the two ownership types in the other two indicators intersect several times. Although private airport companies report higher average values over the period 2007–2019 for all the profitability indicators, only the ROE reveals a clear trend of steadily higher values for private airport companies for each year of the period under investigation.
Finally, we ran a series of panel regression analyses to corroborate and complement our findings. Tables 4 to 7 list the factors that influence airport financial performance, for each performance area. All tables report, in columns, the different models that were estimated and significance level for each of the independent variables. Although the analysis reveals that none of the independent variables have a significant effect on liquidity, the negative values related to “Pax” and “Ownership” for all the three indicators confirm the trends that emerged from the benchmarking analyses, that is, that liquidity decreases with an increase in passengers and private ownership (Table 4).
Factors Affecting Liquidity Performance

Note: Standard errors in parentheses. * p<0.1.
Factors Affecting Activity Performance
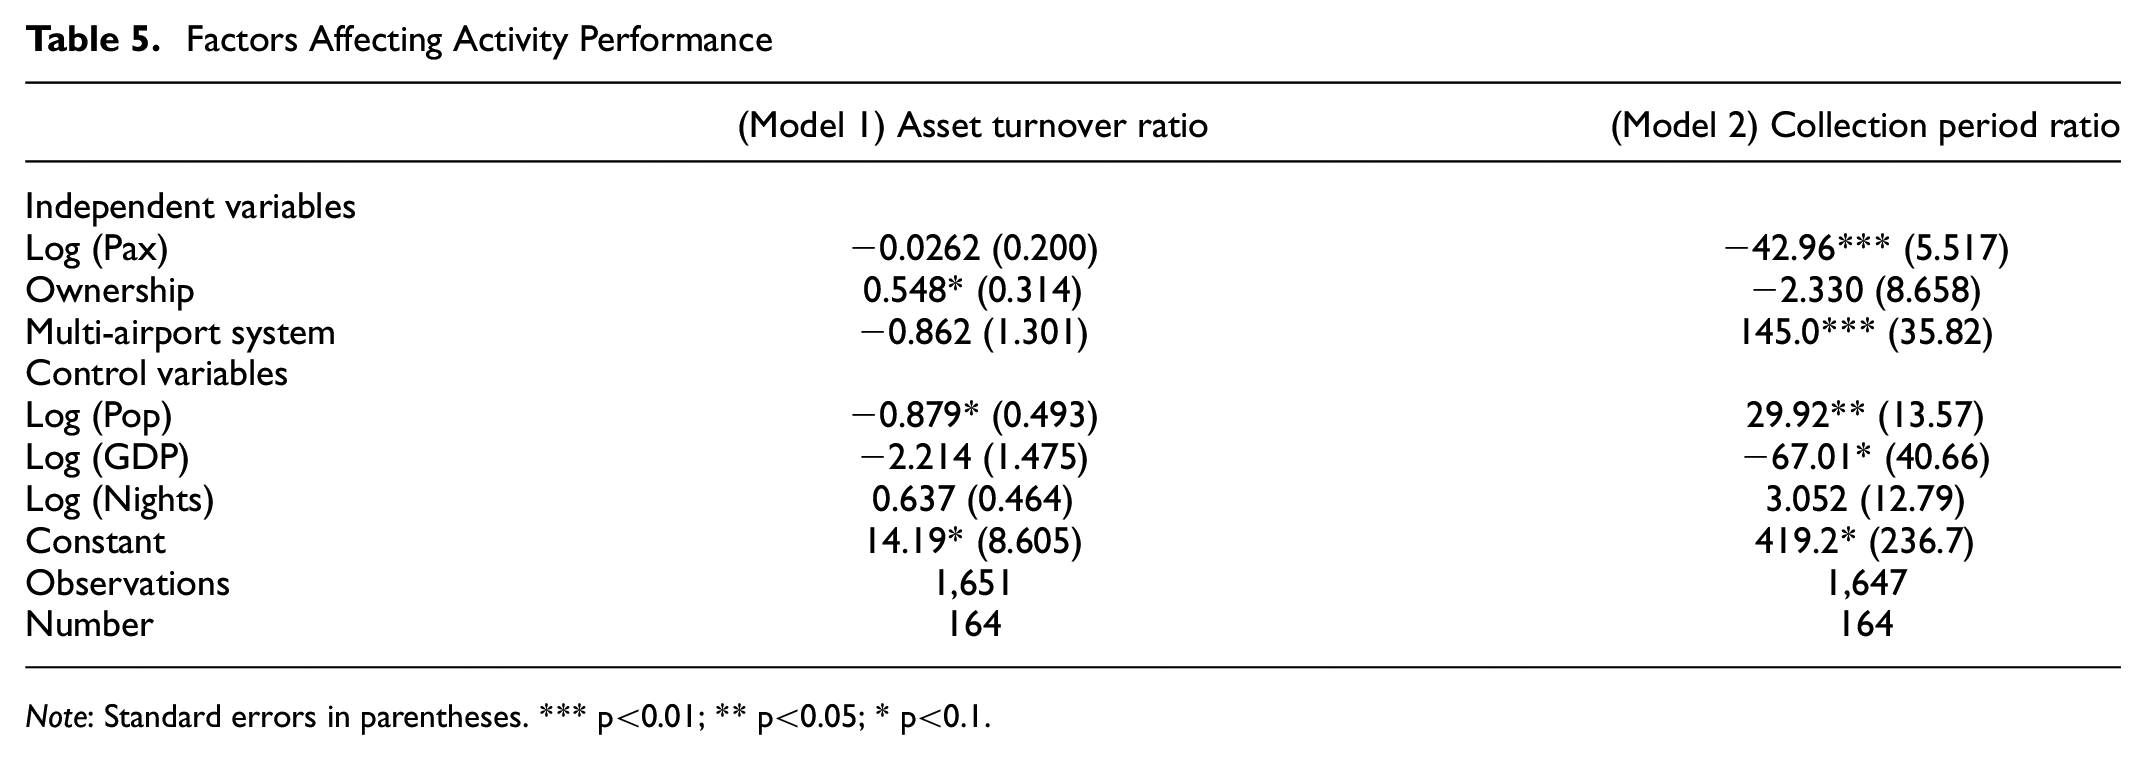
Note: Standard errors in parentheses. *** p<0.01; ** p<0.05; * p<0.1.
Factors Affecting Leverage Performance
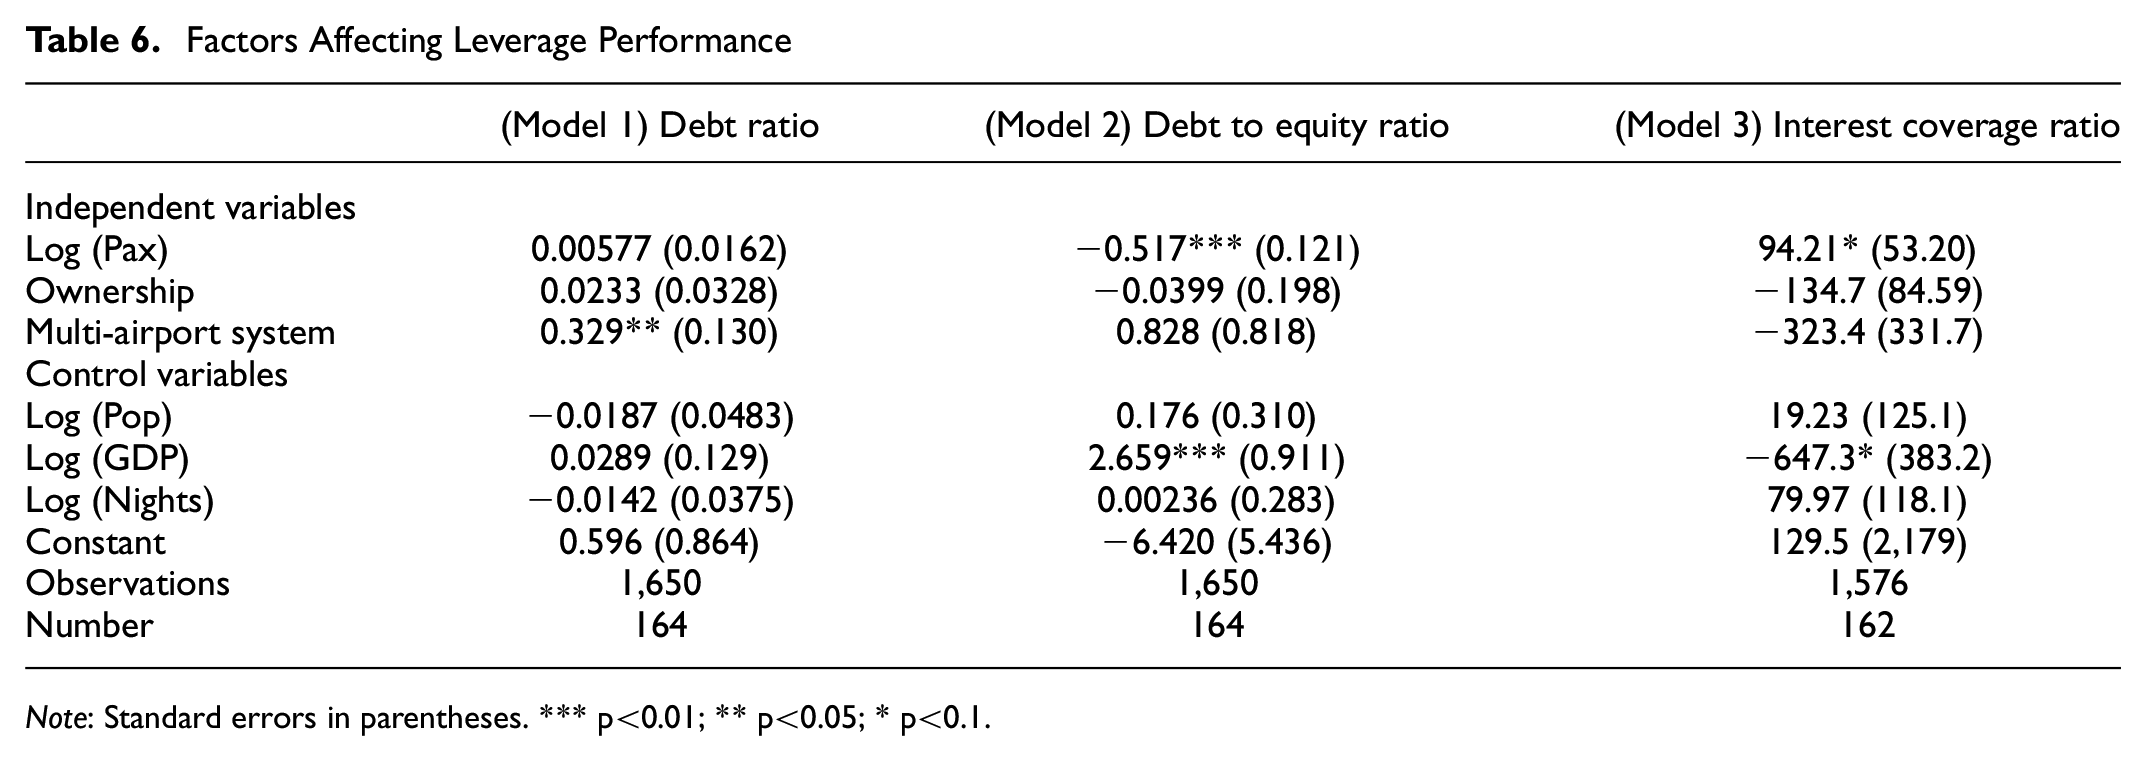
Note: Standard errors in parentheses. *** p<0.01; ** p<0.05; * p<0.1.
Factors Affecting Profitability Performance

Note: Standard errors in parentheses. *** p<0.01; ** p<0.05; * p<0.1.
With regard to activity performance, the findings reported in Table 5 are important to confirm two trends: Model 1 reveals that the degree of private ownerships positively influences the asset turnover ratio (p < 0.1), whereas Model 2 shows that a lower number of days is required for large airport companies to convert their accounts receivable into cash (p < 0.01). Model 2 also reveals that controlling more than one airport is statistically significant (p < 0.01) and positively related to the collection period ratio.
In Table 6, Models 2 and 3 highlight that increased airport company size is negatively associated with the level of indebtedness on equity (p < 0.01) and positively associated with interest coverage (p < 0.1). As evidenced in the benchmarking analysis by size, we know that such effects are mainly because of the contribution of medium-sized airports. Furthermore, Model 1 shows a statistically significant positive relationship between managing a MAS and the ratio of total debt to total assets (p < 0.05).
Although Models 1 and 2 reported in Table 7 show positive values associated with increased size and degree of private ownership, the only statistically significant relationships are those assessed by Model 3, which reveals that profit margin is positively influenced by the number of annual passengers (p < 0.01) and the presence of private capital in the ownership structure (p < 0.05). It is also worth observing that being a MAS has a statistically significant negative effect on both ROA and profit margin (p < 0.1).
Discussion
The findings emerging from the analysis need to be debated in the light of the extant research. At first glance, the findings reveal that size and private ownership positively influence financial performance. However, in line with other studies ( 39 ), major differences exist in relation to different performance areas. With regard to size, examination of the “liquidity” area shows a clear trend since all indicators steadily decrease with handling more passengers. The activity area presents contrasting findings since small airport companies show the highest average asset turnover ratio, accounting for their ability to convert assets into revenue. This might be explained by higher efficiency levels of airports for which low levels of investments are required, which would challenge the studies asserting that airports with a higher book value of assets tend to have higher efficiency scores than others because of economies of scale ( 24 ). Conversely, there is a clear trend, confirmed by a statistically significant relationship, revealing that high passenger traffic permits airport companies to reduce the collection period, that is, the days required to collect accounts receivable. This can probably be ascribed to the increase in commercial revenues, since commercial service payments are usually made by cash leading to a decrease in the debtors to operating revenue ratio. The topic needs further investigation since the relationship between operational size and structural size as well as airport efficiency are beyond the scope of this study. Concerning leverage, increased airport company size seems to produce several positive effects as it is associated with lower debt to equity and a higher ability to cover interest payments. However, consistent with Raghavan and Yu ( 36 ), such effects are mainly because of medium-sized airport companies, which show far better values for both indicators than large airport companies. For profitability, our study confirms that size matters, especially for profit margin, as found by Kato et al. ( 37 ). In particular, the lowest sub-score recorded by small airport companies is the result of lower (and negative) values for all the three profitability indicators.
With regard to ownership, in line with Vogel ( 36 ) and Fasone et al. ( 41 ), several differences between the financial performance of privatized and publicly owned airports are also found. First, public airport companies have better liquidity but are outperformed by private airport companies in activity ratios. In particular, a statistically significant relationship is found between the degree of privatization and the asset turnover ratio, revealing that a higher presence of private capital influences the ability to generate revenue from assets. Contrary to Vogel ( 36 ), our study reveals that private airport companies are more indebted in relation to both total assets and shareholders’ funds, but also more able to cover interest with operating profit. Furthermore, profitability is far higher for private airport companies, with public airport companies showing lower and negative values for all three profitability indicators. The regression analysis supports this finding and reveals, in particular, that the degree of privatization of airports is associated with a higher profit margin, which is consistent with the study of European airports by Vogel ( 36 ), but also that it is not necessarily associated with higher returns on shareholders’ funds. Consistently with the findings of the study of European airports by Vogel ( 36 ), our analysis reveals that the degree of privatization of airports is associated with a higher profit margin, but not necessarily with higher returns on shareholders’ funds. The positive effect of private ownership on profit margin also confirms the findings of Oum et al. ( 35 ) in relation to major Asia-Pacific, European and North American airports.
The findings of the two benchmarking analyses suggest a connection between liquidity, leverage and profitability. Both small and public airport companies show high liquidity, low indebtedness and poor profitability. Looking at this finding from a different perspective, it could be argued that larger and private airport companies have been more likely to invest in non-current assets during the period investigated and they have not hesitated to resort to indebtedness to support their growth. The trend analyses reveal that the gap between small airport companies and medium-sized and large airport companies, as well as that between public and private airport companies, has increased in both the debt ratio and the debt to equity ratio. However, medium airport companies demonstrate to have a more balanced financial structure, since a larger part of their development has been financed with equity. In turn, greater investment in quality, technology and non-aeronautical business seems to be conducive to higher profitability.
In this regard, some brief observations on the effects of some socioeconomic factors, used as control variables, on airport financial performance can be made. First, the population size of the country of origin has a negative effect on the liquidity ratios of airport companies, suggesting that the larger the potential national market, the higher the level of investment in non-current assets. Since the size of the population accounts for the demand for both aeronautical and non-aeronautical activities, airports could be pushed into expanding capacity to match demand. Second, the economic wealth of airports’ countries of origin, measured by the GDP per capita, leads airport companies increasingly to resort to debt rather than equity, which is probably motivated by easier access to financial markets and lower interest rates. When the return on the total value invested is higher than the interest rate, profitability increases, as confirmed by the most indebted airport types also being those showing superior profitability performance and, in particular, the highest ROE.
Finally, an interesting side comment of our analysis concerns the negative effects that managing a MAS has on airport financial performance. The complex operation of more than one airport by a single company leads to an increased number of days required to collect accounts receivable, more debts and less profitability measured by ROA and profit margin. This latter effect, in line with previous studies ( 48 ), essentially implies an efficiency issue, since it means that the relative proportion of inputs and outputs, in costs and revenue, is higher for this type of airport company. Controlling several airports also has an impact on airport management, since it delays decisions, requires greater coordination costs and use of additional resources not adequately offset by increased revenue.
Conclusion
This paper aimed to examine and compare the impact of size and ownership structure on the financial performance of airport companies to understand which types are more likely to tackle discontinuities or face industry challenges. The findings confirm that size and ownership matter for airport financial performance and provide new insights into which areas of financial performance are mainly affected by size and ownership and which relationships exist among these areas.
In particular, the study highlighted that:
Medium-sized and private airport companies are the best in overall performance.
Significant differences exist between airport company types when considering specific financial performance areas. In particular, liquidity is higher for small and, in contrast with previous studies, public airport companies. Activity, which can be viewed as a proxy of efficiency, shows contradictory results, but large and, as already observed, private airport companies have slightly higher performance. For leverage, it was found that larger and, differently from previous studies, private airport companies are more indebted, whereas larger and private airport companies are confirmed to be the more profitable.
A possible relationship between liquidity, leverage and profitability emerges. This preliminary evidence is very relevant and needs further investigation.
All facets of financial performance, and their relationships, must be considered to assess airport companies’ overall financial health.
This study has several implications for theory and practice. For theory, it advances the understanding of airport financial performance, which has been largely neglected in the air transport management literature despite its increasing importance for the viability of today’s airport companies. In addition, this study contributes to reinforcing the view of financial performance as a multi-faceted concept involving several aspects such as liquidity, activity, leverage and profitability, which are differently affected by airport company characteristics. For practice, a valuable insight for airport management is the need to keep investing in capacity and quality improvements to gain a financial advantage. The findings increase the rationality of policymakers who, in light of the challenges faced by airport industries, should support airport company types conducive to financial health to ensure that citizens have access to fair, safe, sustainable and high-quality air transportation. Furthermore, this study provides policy guidance as to which airport types are better equipped to recover from major discontinuities such as that caused by the ongoing COVID-19 crisis.
This study has several limitations, which are used to plan future research. First, the findings should be interpreted with caution since, as observed in the literature, benchmarking is fraught with issues that cannot be completely addressed ( 14 ). Second, the findings suggest that size matters for financial performance but also the possible existence of a size threshold beyond which financial performance deteriorates. Therefore, a deeper analysis to identify reasons and drivers behind financial performance gaps between medium-sized and large airport companies is required. Furthermore, this study does not consider internal variables such as managerial ability and types of passengers, which clearly affect performance. Since the main reason was the absence of direct observation and the lack of reliable and comparable data, the adoption of a qualitative approach will be used in the future to examine the effect of these aspects on airport companies’ financial performance. On this occasion, it will be interesting also to investigate which financial strategies airports have used to make it through the pandemic. Third, the types of airport regulation showed high heterogeneity in the sample, and their evaluation was beyond the scope of this study. Therefore, this issue will be included in future analyses focusing on a limited number of countries showing consistent regulatory frameworks over time. This will give us a chance to consider indicators of aeronautical and non-aeronautical activities separately, which have been excluded from performance measures in the present study because of the lack of sufficient and homogeneous data. Finally, since airport performance is a complex concept involving several issues, the current research will be extended in the future to include service quality as well as social and environmental aspects.
Supplemental Material
sj-docx-1-trr-10.1177_03611981231180201 – Supplemental material for Impact of Size and Ownership on the Financial Performance of European Commercial Airports
Supplemental material, sj-docx-1-trr-10.1177_03611981231180201 for Impact of Size and Ownership on the Financial Performance of European Commercial Airports by Lucia Giovanelli, Federico Rotondo and Sunder Raghavan in Transportation Research Record
Footnotes
Author Contributions
The authors confirm contributions to the paper as follows: study conception and design: L. Giovanelli, F. Rotondo; data collection: F. Rotondo; analysis and interpretation of results: L. Giovanelli., F. Rotondo, S. Raghavan; draft manuscript preparation: L. Giovanelli, F. Rotondo. All authors reviewed the results and approved the final version of the manuscript.
Declaration of Conflicting Interests
The author(s) declared no potential conflicts of interest with respect to the research, authorship, and/or publication of this article.
Funding
The author(s) received no financial support for the research, authorship, and/or publication of this article.
Supplemental Material
Supplemental material for this article is available online.
References
Supplementary Material
Please find the following supplemental material available below.
For Open Access articles published under a Creative Commons License, all supplemental material carries the same license as the article it is associated with.
For non-Open Access articles published, all supplemental material carries a non-exclusive license, and permission requests for re-use of supplemental material or any part of supplemental material shall be sent directly to the copyright owner as specified in the copyright notice associated with the article.