
Abstract
Pilots’ excessive mental workload could reduce their ability to perform concurrent tasks during emergency flights, which is one of the most critical aviation safety concerns. Several past efforts have attempted to investigate the underlying issues, but all had limited success owing to the challenge of collecting representative data under realistic operating conditions. This study aimed to address this challenge by conducting a flight simulator study involving a comparatively large number of participants, who were pilot cadets with flight experience, and using noninvasive functional near-infrared spectroscopy (fNIRS) to collect the pilots’ brain activity data. Pilots’ subjective ratings and brain activity records were collected over a total of 75 simulated flights under three subtask scenarios comprising different equipment failures. A statistical analysis was carried out on the subjective ratings and on the changes observed in the saturation of the oxyhemoglobin (ΔOxyHb) of individual fNIRS channels. The mental workload of the pilots was classified using a support vector machine hierarchical combination classifier, focusing on the question of whether it is feasible to classify pilots’ mental workload using brain activity signals (i.e., ΔOxyHb). The results suggested that the pilots’ mental workload levels were highly associated with the ΔOxyHb measures as well as with the activities of different brain regions, including the prefrontal-, motor-, and occipital cortex. The findings from this study could provide a reference for optimizing pilot training systems and improving pilot performance during emergency flight operations.
Keywords
When emergencies occur, pilots have to process the information on multiple tasks simultaneously, leading to an increase in their mental workload ( 1 ). Although a high mental workload may not have direct adverse consequences, it can lead to fewer residual resources being available for pilots to perform concurrent tasks during emergencies, which may result in task management- and pilot decision-making errors, thereby threatening flight safety ( 2 ). Several studies have found that the performance of operators of any type of vehicle, train, or aircraft declines when the cognitive demand exceeds their cognitive resources ( 3 – 6 ). Therefore, a comprehensive evaluation of pilot mental workload could be an effective method of reducing flight safety risks during emergencies. According to statistics, equipment failure is one of main factors in the occurrence of emergencies during flights ( 7 ), therefore, it is of both theoretical and practical significance to evaluate pilots’ mental workload induced by equipment failure.
Evaluation of pilots’ mental workload is generally conducted through various methods such as subjective reports, performance evaluations, and physiological measurements ( 8 ). One of the most widely used tools in subjective reporting is the National Aeronautics and Space Administration Task Load Index (NASA-TLX), which is designed to obtain workload estimates relating to a task, for example, during flight missions ( 9 ). A performance evaluation can be divided into primary and secondary tasks: here, the primary task takes processing priority when a pilot needs to complete multiple tasks at the same time. In such a case, the pilot uses residual capacity to complete the other task, the secondary task ( 10 ). Physiological measurement uses physiological data to evaluate the pilots’ mental workload. Some of the methods of measuring such data include electrocardiogram (ECG; to record heart-related data), eye movement, electroencephalogram (EEG; to record brain-related data), and functional near-infrared spectroscopy (fNIRS; an optical brain monitoring technique), which is more objective and interpretable than the other three methods ( 11 – 14 ).
Mental workload is related to the activity of the brain and central nervous system. Although ECG and eye movement data can effectively be used to evaluate pilots’ mental workload, they are not direct measures of neural activity in the brain and thus cannot be used to explain the relationship between mental workload and neural mechanisms ( 15 ). EEG is a relatively traditional method of measuring brain signals, and has high temporal resolution. However, because of its vulnerability to environmental electromagnetic fields, the accuracy of EEG for locating specific functional areas of the brain is not high ( 16 ). Compared with EEG, fNIRS has higher spatial resolution and more flexible operating conditions, but lower temporal resolution. Leff et al. systematically reviewed studies about brain activity in driving tasks based on fNIRS and showed that it is beneficial in exploring the internal mechanisms of skill learning, motion controlling, and neurological diseases ( 17 ). Zhang et al. used fNIRS to analyze changes in oxyhemoglobin (ΔOxyHb) concentrations in pilot cadets with different turning behavior ( 18 ). Pan et al. utilized fNIRS to identify pilots’ fatigue status during flight missions ( 19 ). Though previous studies have made progress in evaluating pilots’ mental workload using fNIRS, few have investigated this specific aspect during emergency flight operations considering specific brain regions for data acquisition in relation to emergency flight scenarios.
A support vector machine (SVM) is a two-class machine-learning classification model, which has been widely used in the field of aviation human factors research. SVMs find support vectors to reduce the computational complexity, obtain the optimal interface between sample sets of two classes, separate the two classes, and keep the hyperplane away from the largest “margin” ( 20 ). Chen et al. analyzed the sensitivity of the pilot’s EEG and physiological factors under different flight tasks, and established a pilot workload evaluation model based on SVM ( 21 ). Mohanavelu et al. employed an SVM classifier to effectively identify the pilots’ cognitive workload level during takeoff, cruise, and landing phases with ECG and EEG ( 22 ). Thus, the current study selected SVM to establish the mental workload classifier.
We focused on detecting and assessing pilots’ mental workload based on the collected fNIRS data from simulated emergency flight scenarios induced by different equipment failures. We first investigated changes in the pilots’ subjective mental workload levels with different emergency flight scenarios based on the self-report inventory. Then, statistical analysis was used to determine whether changes in the saturation of the ΔOxyHb of individual fNIRS channels were able to differentiate mental workload levels. Moreover, the SVM was used to build a mental workload classifier for detecting pilots’ mental workload levels in emergency flight scenarios. This research makes the following distinctive contributions to this field of research. Firstly, compared with past efforts on pilot mental workload using a flight simulator, our study is unique in three aspects: the equipment-induced emergency flight scenarios simulated, the relatively representative number of pilots participating in the study, and the high-resolution and multichannel fNIRS pilot data collected. Secondly, our study is one of the first to explore the relationship between subjective mental workload (i.e., pilots’ subjective ratings) and objective measures of brain activity (i.e., fNIRS data) during simulated emergency flight scenarios. Classification models were calibrated, confirming that changes in the saturation of ΔOxyHb in the brain, measured during simulated emergency flight scenarios, could be used to detect changes in pilots’ mental workload. Lastly, the research found varied levels of significance in the relationship between the subjective mental workload ratings under different emergency scenarios and the associated saturation of ΔOxyHb of the fNIRS channels in different regions of the brain. These findings could have significant implications with regard to developing effective pilot training programs and equipment design for responding to emergencies during flights.
Methods
Participants
Twenty-five healthy Chinese, male, pilot cadets (aged between 21 and 30) from the Flight Technology College of the Civil Aviation Flight University of China were recruited to participate in the simulator study. All had experience of flying real aircraft (e.g., Cessna 172SP, Diamond DA42), with flight hours ranging from 230 to 250 h. The Edinburgh Handedness Inventory showed that all participants were right-handed. They had normal or corrected-to-normal eyesight and hearing. All participants took part in the experiment between 9 and 11 a.m. and 2 and 4 p.m. Any form of drugs, alcohol, or caffeine were prohibited before the experiment. All participants had signed a consent form and were paid for their time. This research complied with the tenets of the Declaration of Helsinki and was approved by the Ethical Review Board of Southwest Jiaotong University (No. SWJTU-2109-001-QT).
Flight Simulator
The flight simulator used in the experiment was a Diamond DA42 fixed-base flight training device (FTD; CnTech Co., Ltd), as shown in Figure 1. The DA42 is a four-seat, twin-engine, propeller-driven airplane (Diamond Aircraft Industries), which is widely used in pilot training. The flight simulator is composed of a visual environment, an audio environment, a cockpit, and an instructor control platform for setting tasks (certificate no. FSD-453). The simulator meets Civil Aviation Administration of China (CAAC) FTD Level 5, Federal Aviation Administration FTD Level 5, and European Union Aviation Safety Agency Flight and Navigation Procedures Trainer II standards and can be used to simulate the closed-loop response of a human–aircraft environment system in real time and for various typical emergency flight conditions.
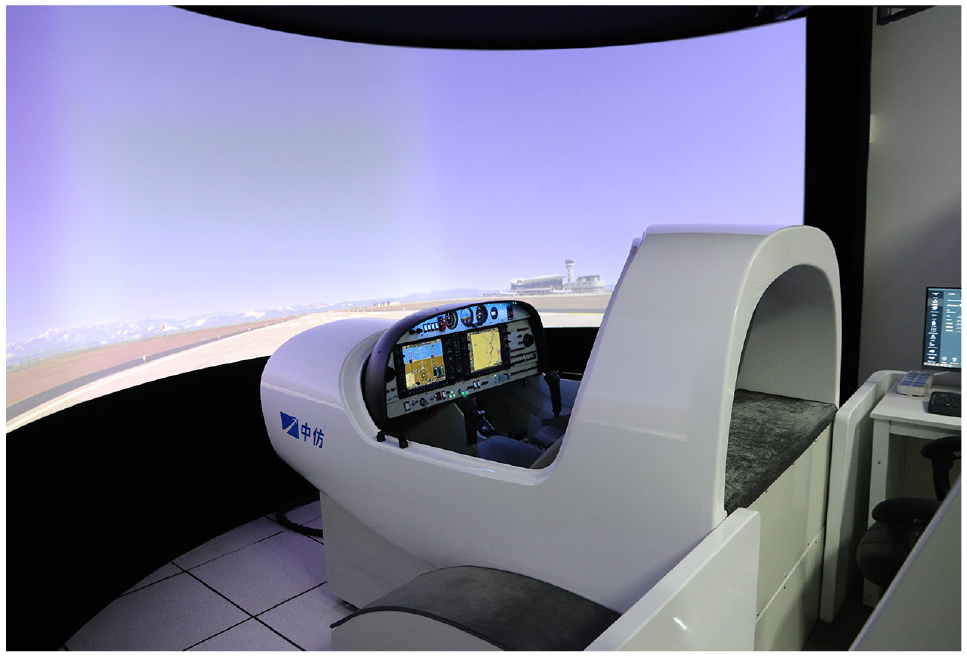
Flight simulator used in the experiment.
fNIRS
The current study used the NIR Smart fNIRS (Danyang Huichuang Medical Equipment Co., Ltd). The wavelengths emitted by the device’s emission point of the light source were 730 nm and 850 nm, respectively. The absorption coefficients in response to light of ΔOxyHb and deoxyhemoglobin (ΔDeoxyHb) differ, therefore fNIRS can record changes in the saturation of oxygen concentrations in the human brain. The fNIRS used in this experiment (Figure 2), had a sampling frequency of 11 Hz.
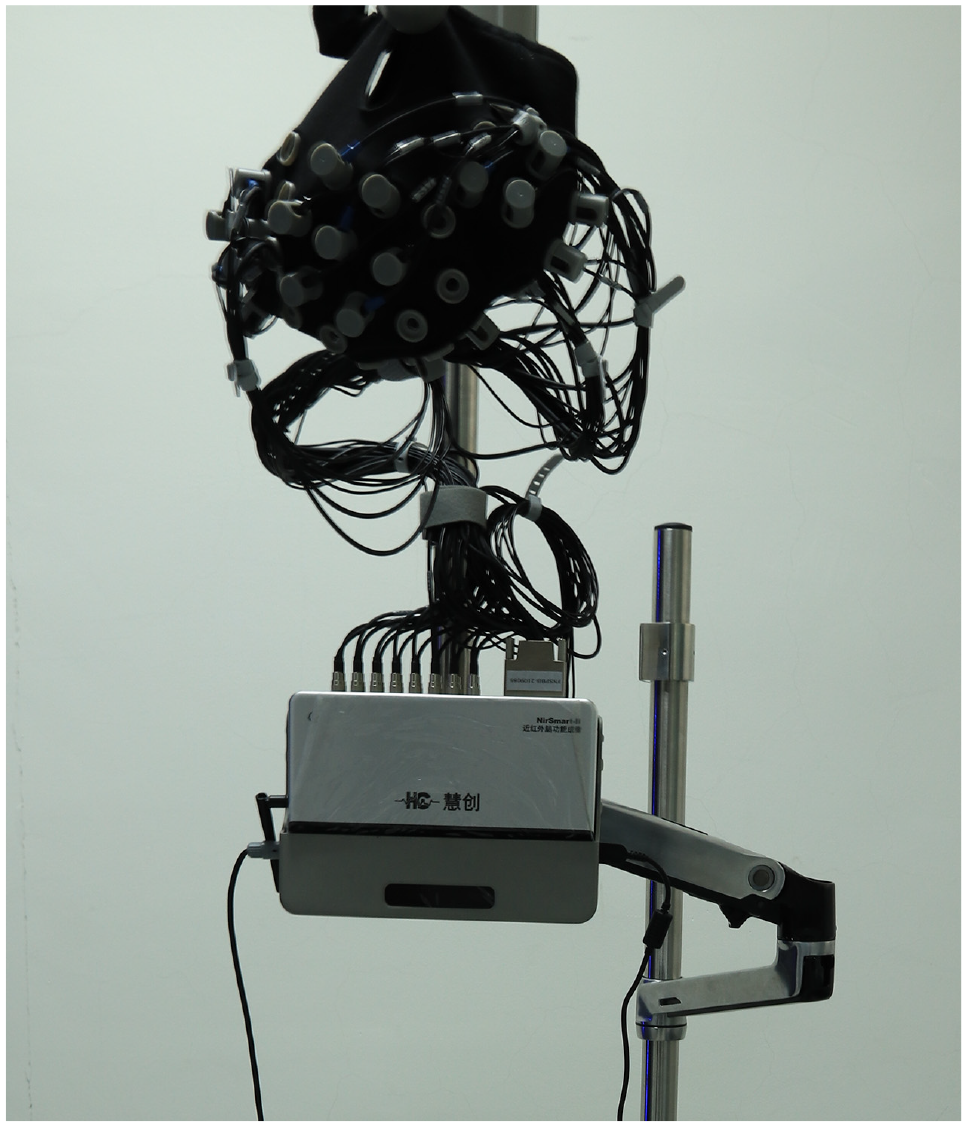
Functional near-infrared spectroscopy (fNIRS) device used in the experiment.
The fNIRS channel distribution diagram, shown in Figure 3, comprised 16 source points (red circles, S1 to S16) for the emission of the light source, and 16 source points (blue circles, D1 to D16) for signal reception; the distance between each light source and detector was 3 cm. The spatial locations of the sources, detectors, and anchor points (located at Nz, Cz, Al, Ar, and Iz referring to the standard international 10 to 20 system of electrode placement) were measured by an electromagnetic three-dimensional digitizer device (Patriot, Polhemus, USA) worn by participants. Specifically, S1 corresponded to OZ, S8 to C4, D8 to C3, and D15 to FpZ. When placing the probes into the cap, each participant’s hair was pulled aside to ensure that the probes were in direct contact with the scalp. These 38 data sampling channels covered the corresponding positions of the prefrontal cortex (PFC), left motor cortex (LMC), right motor cortex (RMC), and occipital cortex (OC).

Channel distribution diagram of fNIRS.
Subjective Ratings
The NASA-TLX is a multidimensional mental workload assessment scale ( 9 ) that includes six dimensions: mental demand, physical demand, temporal demand, own performance, effort, and frustration. Operators rate the contribution made by each of the workload dimensions to identify the intensity of the perceived workload. To this end, participants were asked to make a mark on a straight line representing each of the six dimensions; these were used as their base scores. The six dimensions were then paired, and participants chose the most important dimension of each pair. The weight of each dimension was determined by the number of times of each dimension chosen. The NASA-TLX score was calculated from a combination of the original score and weight.
Experimental Procedure
Before commencement of the experiment, each participant was required to put on the fNIRS, sit on the left-hand seat of the simulator alone (i.e., single pilot operation), learn the appropriate actions to address different equipment failures and deal with emergency flight scenarios, and complete a “no failure” level flying task as a practice. After that, the participant was asked to close their eyes, remain at the simulator, and rest for 5 min. During this period, the simulator was “frozen” and the experimental parameters in the simulator were set. The position of the aircraft was reset. The weather was set to calm with no wind and no clouds, and visibility was set to 9,999 m. The time was set to noon, and Mianyang Nanjiao Airport (IATA: MIG) was selected, which had distance measuring equipment (DME) and very-high-frequency omnidirectional range. The simulator was subsequently “unfrozen” and participants began to operate the simulator, flying straight and level.
The schematic diagram of the experimental procedure is shown in Figure 4. The experiment was divided into three subtasks to reflect different types of equipment failure. The first (I) was flying without failure, the second (II) was flying with an attitude and heading reference system (AHRS) failure, and the third (III) was flying with right-hand engine (RH ENG) failure. For each participant, the order of three subtasks was randomly set, as was the experimental procedure of each subtask. After completing each subtask, participants rested for 10 min before starting the next, ensuring that the physiological data collected by the subsequent subtask would not be affected by the previous one. It was worth mentioning that no participant knew in advance whether or when equipment failure might be triggered during each subtask. For better assessment of the manual flying skills of participants, none of the participants were allowed to use the autopilot function during the experiment.

Schematic diagram of the experimental procedure.
At the beginning of each subtask, the position of the aircraft was on the fixpoint of inbound DME 7 nm, at an altitude of 3,900 ft, and flight speed of 100 kt. Before reaching the fixpoint of inbound DME 2 nm, participants flew straight and level at a constant speed and altitude. Once the aircraft had flown over the fixpoint of inbound DME 2 nm, an equipment fault was triggered, and the participants were required to take appropriate action before resuming flying at the same heading and altitude. After that, if the aircraft flew over the fixpoint of outbound DME 1 nm, the simulator immediately froze. Participants were then asked to complete the NASA-TLX scale to provide their subjective ratings of the flight between the fixpoint of inbound DME 2 nm and that of outbound DME 1 nm. During each subtask, the experimenter pressed the “F” key on the keyboard to mark the data being collected by the fNIRS at the time the failure was triggered and again when the simulator froze. The duration of each subtask was about 7 min, and the whole experiment for each participant lasted approximately 80 min including practice and rest time. All participants completed the experiment.
Statistical Analysis
Before obtaining changes in the saturation of ΔOxyHb and ΔDeoxyHb, we performed artifact removal by spline interpolation and filtering (0.01 Hz high-pass and 0.2 Hz low-pass) on the original signal using NirSpark 1.7.3. Considering that ΔOxyHb is sensitive to changes in regional cerebral blood flow and has a higher signal-to-noise ratio than ΔDeoxyHb, the authors selected ΔOxyHb for the classification of pilots’ mental workload ( 23 ). To be linked to the subjective mental workload ratings, the ΔOxyHb data of the flight between the fixpoint of inbound DME 2 nm and that of outbound DME 1 nm in each subtask were extracted for analysis.
To discover whether there were significant correlations between the ΔOxyHb levels of all channels and the NASA-TLX scores, whether there were significant differences in the subjective mental workload ratings of pilots undergoing these three subtasks, and which brain channels had significant responses to different mental workloads, statistical analyses were undertaken, as shown in Figure 5. To determine the data distribution pattern, a normality test was first carried out. Among the commonly used normality test methods, the Shapiro–Wilk test is generally suitable for use with small samples (n ≤ 50), whereas the Kolmogorov–Smirnov test is typically employed for large sample tests (n > 50) ( 24 ). Therefore, the Shapiro–Wilk test was used in the standard test of the NASA-TLX subjective ratings, and the Kolmogorov–Smirnov test was used in that of the ΔOxyHb data of each channel. If a factor satisfied the conditions for normality, it would be analyzed using Pearson’s test and repeated measures analyses of variance, otherwise, it would be tested using Spearman’s- and the Kruskal–Wallis test. Post hoc testing was subsequently conducted using the Bonferroni test, and Bonferroni correction was used for multiple comparisons. The statistical analysis was performed using SPSS Statistics v.26 (IBM), and the significance level was set at p < 0.05.

Flowchart of statistical analyses.
Mental Workload Classification
An SVM hierarchical combination classifier was used to attain three classifications of mental workload, including two layers, namely SVM1 and SVM2. The input variables for SVM1 and SVM2 were different. An SVM classifier comprising three classes directly is a typical multiclass classifier, known as “one-versus-rest.” Compared with an SVM classifier with three classes directly, an SVM hierarchical combination classifier can show the differences between the input variables of different layers, improving the accuracy of each layer ( 25 ). The three-class model of mental workload is shown in Figure 6.
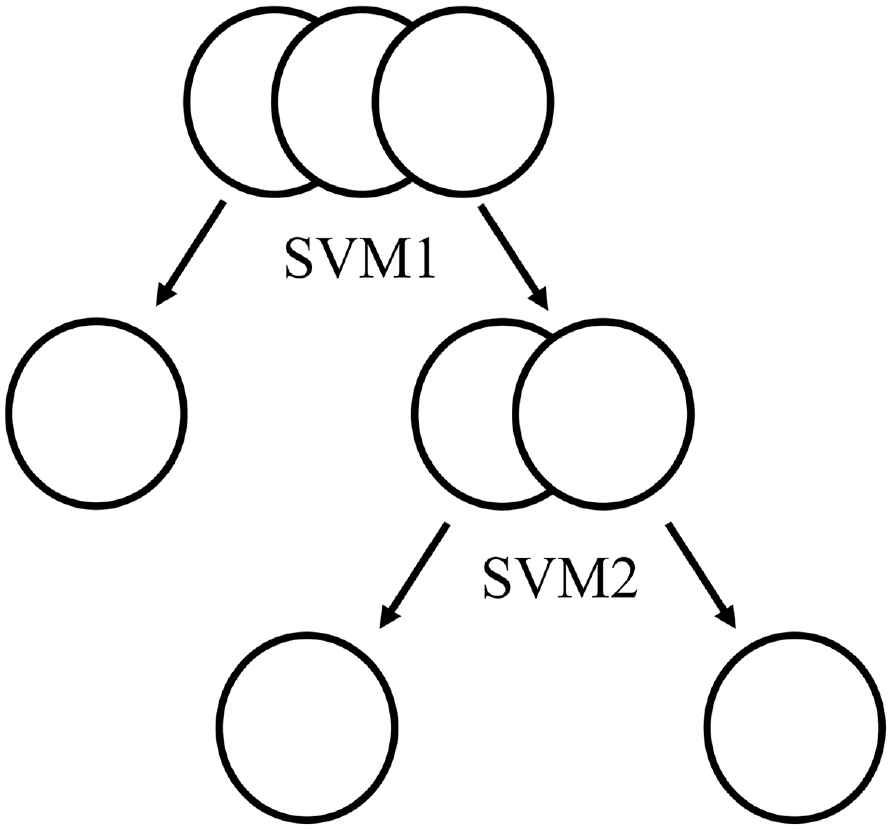
Support vector machine (SVM) hierarchical combination classification model.
Each layer of the classifier used ΔOxyHb data of different channels as classification factors according to the results of the statistical analysis. For selecting channels, we normalized the average ΔOxyHb data of all channels with significant differences for each subtask. The normalization used Equation 1, where i refers to the ith sample in a dataset.

Before training the model, we normalized each classification factor. Then, for each layer of the classifier, 80% of the data were used for parameter training and the rest for validation following a multifold cross-validation approach. We used a fivefold cross-validation to train and test the model for mental workload detection, so as to obtain the average results. Both SVM1 and SVM2 used the Gaussian kernel with heuristic procedure for selecting an appropriate scale factor. To further verify the validity and credibility of the mental workload classification model established by SVM, the same classification factors as SVM1 and SVM2, respectively, were reclassified according to the same classification order, using the k-nearest neighbor (KNN) algorithm: KNN1 and KNN2. In existing traffic human-factor studies, KNN is typically compared with SVM to assess the validity of a model ( 26 ). Both KNN1 and KNN2 used 50 neighbors calculated by the grid search and employed the Minkowski metric with an exhaustive searcher. After the classification was completed, two algorithms were compared with some common evaluation indexes such as accuracy, precision, recall, and F1-score. F1-score was the harmonic mean of precision and recall. In addition, we obtained results of the SVM classifier with three classes directly for comparing performance, which also used a Gaussian kernel. Mental workload classification was performed using Python package sklearn 0.24.2.
Results and Discussion
The NASA-TLX scores under three subtasks (I, II, and III) are displayed in Figure 7. The range of NASA-TLX scores of Subtask I was 1.00 to 4.93; 5.67 is a discrete point shown as a dot in Figure 7, indicating that it is an outlier. The range of Subtask II NASA-TLX scores was 2.00 to 6.60, and that of Subtask III was 2.73 to 9.60. The upper and lower horizontal lines of each box represent the maximum and minimum subjective scores of each subtask. The cross in each box represents the average subjective score of each subtask, and the horizontal line in each box represents the median of subjective score of each subtask. It can be seen that the average subjective score of Subtask III was the largest, whereas the average subjective score of Subtask I was the smallest. Because the NASA-TLX scores did not satisfy the normality test (p < 0.05), the Kruskal–Wallis test was performed on the subjective ratings. The results of the Kruskal–Wallis test showed that there was a statistically significant difference in the participants’ NASA-TLX scores between subtasks (p < 0.05). Furthermore, the Bonferroni test revealed a significant difference in the self-reported mental workload scores between multiple pairwise comparisons (p < 0.05). The results from the subjective ratings provided evidence supporting the experimental control of the three mental workload levels in this experiment.

Boxplot of National Aeronautics and Space Administration Task Load Index (NASA-TLX) scores.
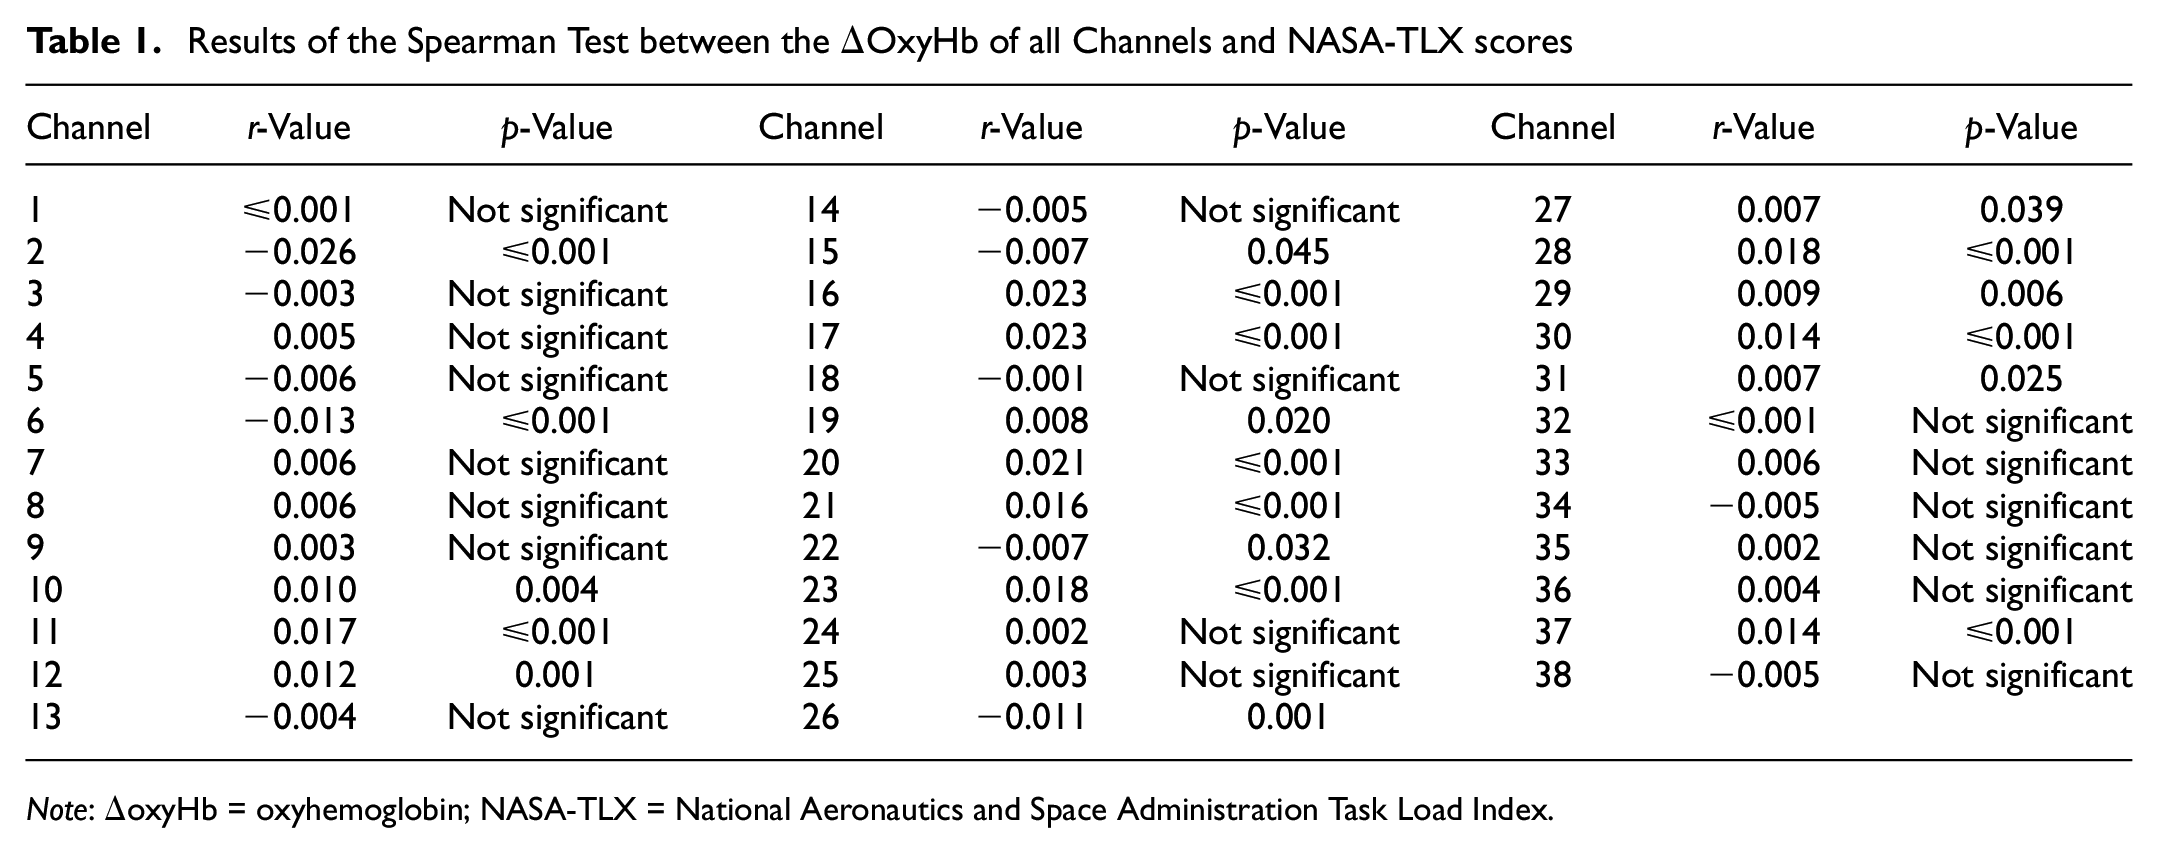
Similarly, because the ΔOxyHb data of all channels failed to satisfy the normality test (p < 0.05), Spearman’s and the Kruskal–Wallis tests were performed on the ΔOxyHb data. Table 1 shows the results of the Spearman test between the ΔOxyHb of all channels and the NASA-TLX scores (significance criterion: p < 0.05). Table 2 shows the sample mean of ΔOxyHb of all channels corresponding to the three different subtasks and the results of the Kruskal–Wallis test on the ΔOxyHb of all channels (significance criterion: p < 0.05). “↑” represents the increase of average ΔOxyHb with increasing subjective mental workload levels, whereas “↓” represents the decrease of average ΔOxyHb with increasing subjective mental workload levels. “↑–↑” means that as subjective mental workload level increases, average ΔOxyHb also keeps increasing; “↑–↓” means that as subjective mental workload level increases, average ΔOxyHb first increases and then decreases; “↓–↑” means that as subjective mental workload level increases, average ΔOxyHb first decreases and then increases; “↓–↓” means that as subjective mental workload level increases, average ΔOxyHb keeps decreasing.
Results of the Spearman Test between the ΔOxyHb of all Channels and NASA-TLX scores
Note: ΔoxyHb = oxyhemoglobin; NASA-TLX = National Aeronautics and Space Administration Task Load Index.
Sample Means of ΔOxyHb Under Subtasks and the Results of the Kruskal–Wallis Test on the Difference in ΔoxyHb of all Channels

Note: ΔoxyHb = oxyhemoglobin.
“↑” represents an increase in average ΔoxyHb with increasing subjective mental workload levels; “↓” represents a decrease in average ΔoxyHb with increasing subjective mental workload levels.
P < 0.05.
In Table 1, the ΔOxyHb of 20 out of 38 channels were significantly correlated with the NASA-TLX scores. Among them, Channel (CH)10, CH11, CH12, CH16, CH17, CH19, CH20, CH21, CH23, CH27, CH28, CH29, CH30, CH31, and CH37 were positively correlated with NASA-TLX scores, whereas CH2, CH6, CH15, CH22, and CH26 were negatively correlated with NASA-TLX scores. In Table 2, it can be observed that most channels’ΔOxyHb data differed significantly between mental workload levels, except for CH3, CH13, CH32, and CH34. In addition, with increases in subjective mental workload levels, trends in the average ΔOxyHb of different channels varied. Average ΔOxyHb of CH7, CH8, CH9, CH10, CH11, CH12, CH13, CH16, CH17, CH20, CH24, CH25, CH28, CH29, and CH30 increased with increasing subjective mental workload levels. Average ΔOxyHb of CH1, CH4, CH5, CH6, CH14, CH15, CH18, CH19, CH21, CH22, CH23, CH26, CH27, CH31, CH32, CH33, CH34, CH35, CH36, CH37, and CH38 increased first and then decreased with the increase of subjective mental workload levels. Average ΔOxyHb of CH2 decreased first and then increased with the increase of subjective mental workload levels. Average ΔOxyHb of CH3 decreased with increasing subjective mental workload levels.
Using the Bonferroni test, the results of multiple pairwise comparisons of all channels with statistically significant differences are shown in Figure 8. The gray boxes represent p-values greater than or equal to 0.05 (not significant), whereas the black boxes represent p-values less than 0.05 (significant).

Results of multiple pairwise comparisons.
Based on the results presented in Table 2, Figure 9 shows the normalized average changes in ΔOxyHb data of all channels with statistically significant differences by subtask. It can be observed that two channels did not reach their peaks during Subtask I. Considering the impact of classification order on -difficulty, Subtask I was initially selected to be separated from the other subtasks by SVM1. Subtask II was separated from Subtask III by SVM2. According to the results of the multiple pairwise comparisons of channels with significant differences, the ΔOxyHb data of CH2, CH6, CH7, CH8, CH10, CH11, CH12, CH16, CH17, CH19, CH20, CH21, CH23, CH26, CH27, CH28, CH29, CH31, CH33, CH36, and CH37 were used as input data to train and test machine-learning model SVM1, and the ΔOxyHb data of CH1, CH2, CH5, CH6, CH7, CH9, CH10, CH14, CH15, CH18, CH19, CH20, CH21, CH22, CH23, CH24, CH25, CH26, CH27, CH30, CH33, CH35, CH36, and CH38 were used as input data to train and test machine-learning model SVM2. Moreover, the ΔOxyHb data of all channels with significant differences were used as input data to train and test machine-learning model SVM (three classes directly).

Results of multiple pairwise comparisons.
After fine-tuning the parameters, penalty parameter C of all of SVM (three classes directly), SVM1, and SVM2 was set to 10. The results for mental workload classification using SVM and KNN are shown in Table 3. Accuracy, precision, recall, and F1-score were used to evaluate the classification models. All four evaluation indexes of SVM1 and SVM2 were higher than KNN1 and KNN2, and all four evaluation indexes of SVM1 and SVM2 were higher than SVM with three classes directly. For the different layers of the classifier, all four evaluation indexes of SVM2 were better than SVM1. However, the accuracy of KNN2 was better than KNN1, whereas the precision, recall, and F1-score of KNN1 was better than KNN2.
Results for Mental Workload Classification using SVM and KNN
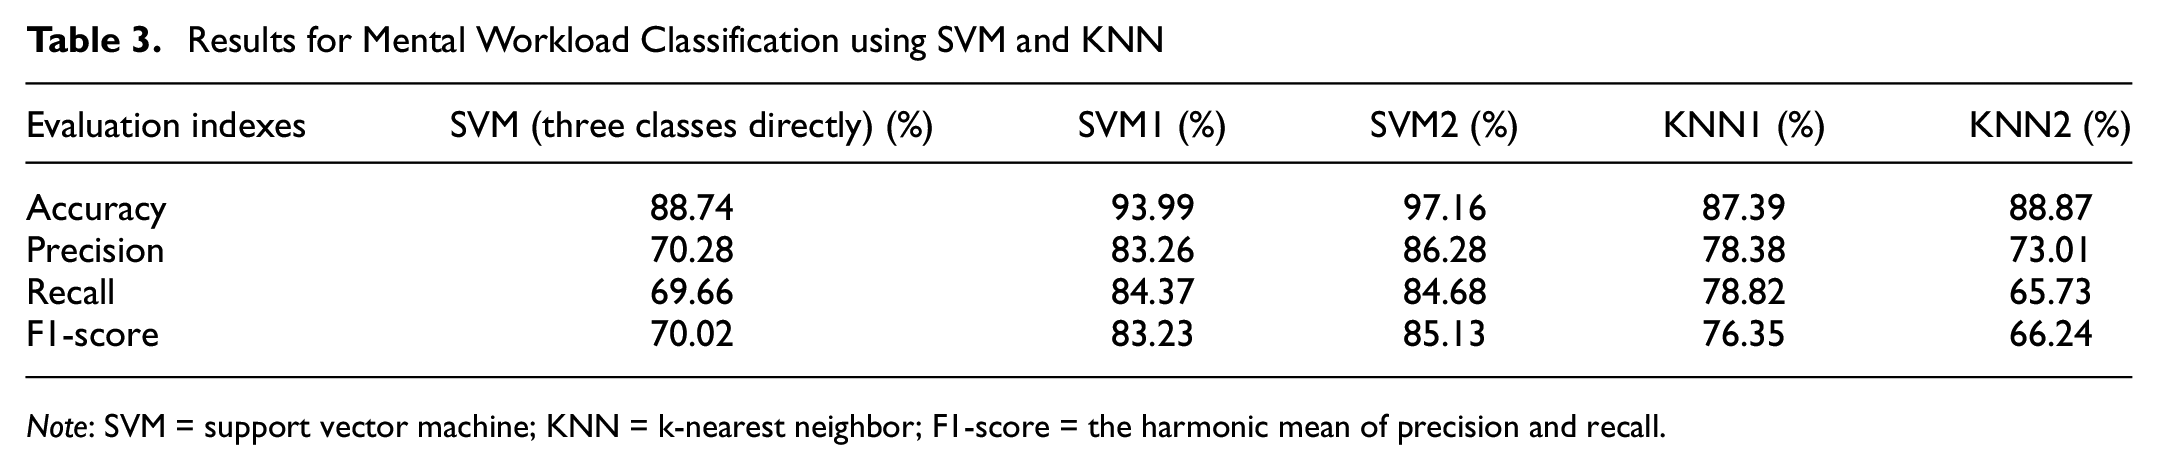
Note: SVM = support vector machine; KNN = k-nearest neighbor; F1-score = the harmonic mean of precision and recall.
In this experiment, the NASA-TLX scores varied by subtask, indicating that these simulated emergency flight scenarios comprising different equipment failures successfully captured the mental workload levels of pilots, which was in accordance with previous studies ( 27 ). Compared with the “no failure” scenario, both AHRS- and RH ENG failures had an effect on the pilots’ manipulation of the aircraft—that is, the average NASA-TLX score of Subtask I was the smallest. Furthermore, because the operations to be performed following RH ENG failure were more complex, subjecting the pilots to a higher mental workload level than that of the AHRS failure, this could explain why the average subjective score of Subtask III was the largest.
From the results given in Table 1, the fNIRS ΔOxyHb data were found to have a certain correlation with the NASA-TLX scores, which indicated a relationship between two methods for evaluating pilots’ mental workload. However, the absolute values of r of all significantly correlated channels were less than 0.05, indicating that the correlations were weak. Nonetheless, the ΔOxyHb data from 34 channels could be sufficient to differentiate between different mental workload levels, indicating the potential of applying changes in the saturation of ΔOxyHb in the brain to detect pilot mental workload (see Table 2). Based on the aforementioned 10 to 20 system and on Brodmann’s map published by Korbinian Brodmann in 1909, we determined within which functional part of the brain each channel was located (Table 4).
Brain Regions Corresponding to Different Channels
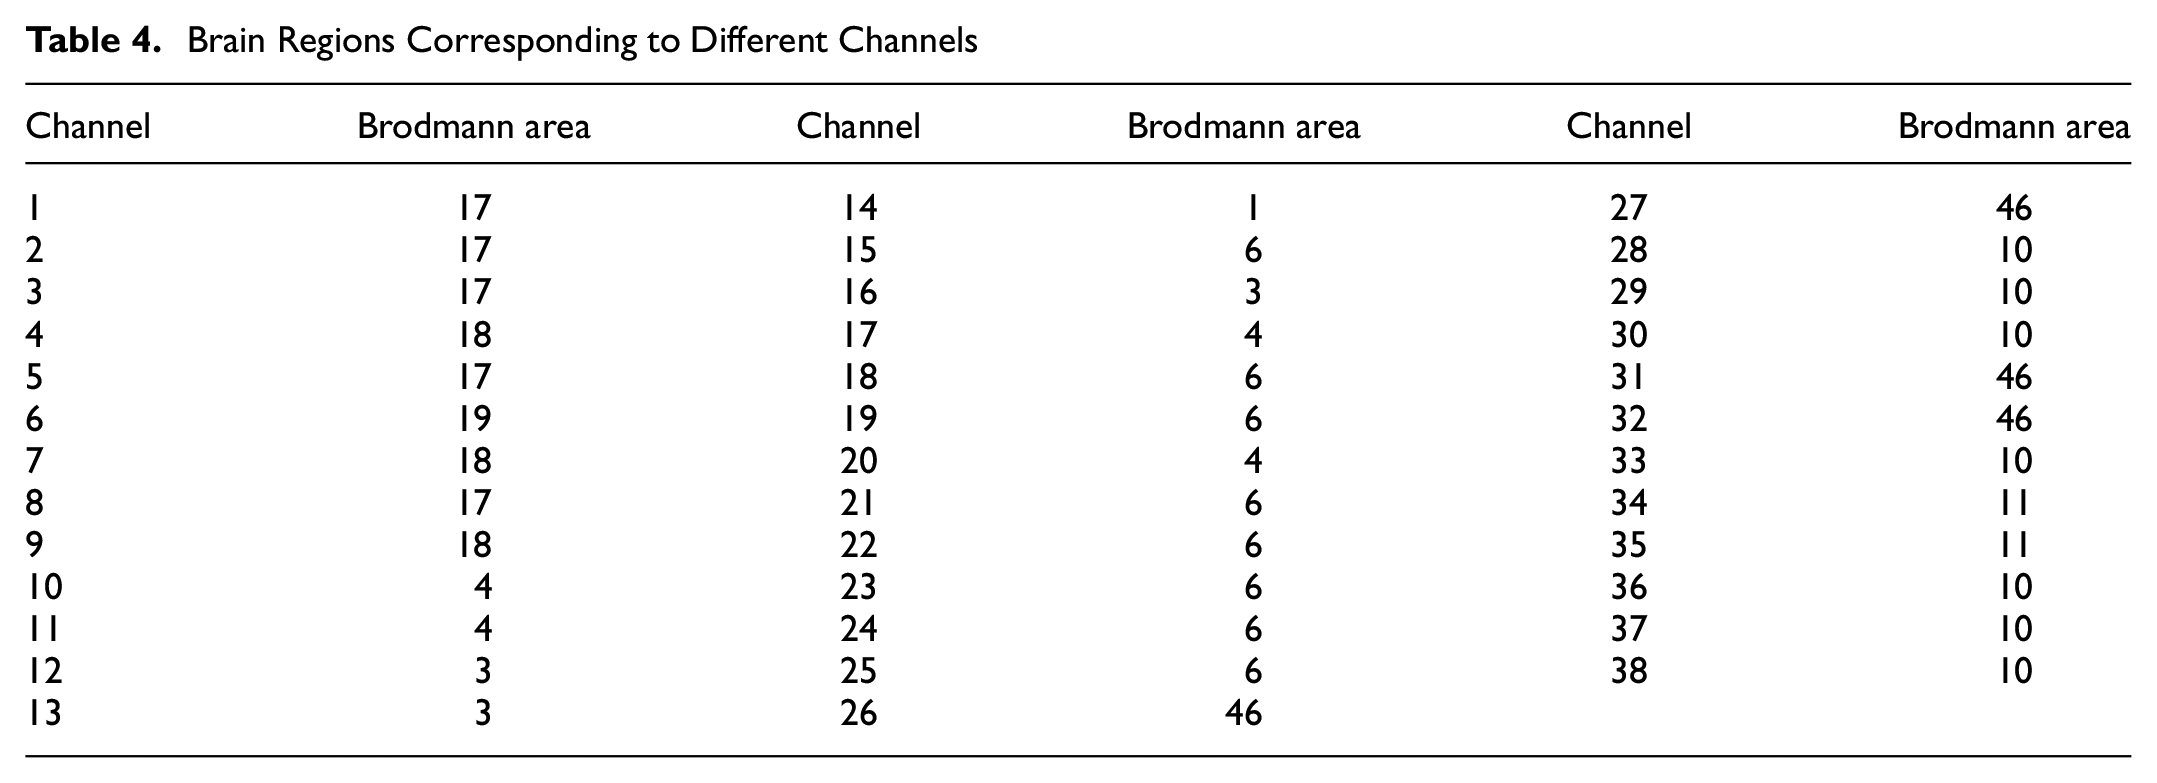
The PFC was covered by 13 channels, of which the average ΔOxyHb mostly increased first and then decreased with the increase of subjective mental workload levels, except for CH28, CH29, and CH30. This suggested that much of the PFC was more active under AHRS failure than RH ENG failure. However, Causse et al. found that ΔOxyHb in the PFC increased as the tasks became more complex, which differed from the results of this study, possibly because of the different types of task undertaken ( 28 ). In addition, the average ΔOxyHb of CH28, CH29, and CH30 increased with increasing subjective mental workload levels. These three channels were all located at the frontopolar area of PFC, corresponding to Brodmann Area 10 (BA10), which suggested that the frontopolar area was more active in RH ENG failure than during AHRS failure. BA10 is the largest cytoarchitectonic area in the human brain ( 29 ). Some researchers have found that BA10 can play a major role in the highest-level integration of information from visual, auditory, and somatosensory systems, thus achieving a modeless, abstract, and conceptual interpretation of the environment ( 30 ). Considering that the operations to be performed after RH ENG failure were more complex than those after AHRS failure, the degree of activity in BA10 across the simulated emergency flight scenarios might indicate the intensity of the emergency scenario.
The motor cortex was covered by a total of 16 channels, 8 each on the left and right sides. Among them, the average ΔOxyHb of most channels increased with increasing subjective mental workload levels, except for CH14, CH15, CH18, CH19, CH21, CH22, and CH23, which showed that much of the motor cortex was more active in RH ENG failure than in AHRS failure. This result might be related to the high number of complex actions required following RH ENG failure. Moreover, the mean ΔOxyHb of CH14, CH15, CH18, CH19, CH21, CH22, and CH23 increased first and then decreased with an increase in subjective mental workload levels. In particular, CH14 was located at the primary somatosensory cortex, corresponding to BA1, whereas other channels were all located at the premotor and supplementary motor cortex, corresponding to BA6. BA1 belongs to the primary somatosensory cortex of the human brain, which has basic somatosensory function and can receive incoming sensory signals from the opposite limb. The results suggested that BA1 was more active under AHRS failure than RH ENG failure. This will need to be verified on a moving-base flight simulator in the future, since this experiment used a fixed-based flight simulator. BA6 is thought to play an important role in complex and coordinated motor planning ( 31 ). Similar to BA1, our results indicated that BA6 was more active in AHRS- than in RH ENG failure, whereas Yamauchi et al. found that the hemodynamic changes in BA6 rose significantly in a linear trend with the increase in workload ( 32 ).
Nine channels were located in the OC. CH1, CH2, CH3, CH5, and CH8 were located at the primary visual cortex, corresponding to BA17; CH4, CH7, and CH9 were located at the visual association cortex, corresponding to BA18; and CH6 was located at the peristriate cortex, corresponding to BA19. These three Brodmann areas were involved in the processing of visual information. He et al. found that pupil size, average fixation time, fixation frequency, saccade frequency, and average saccade velocity changed significantly with mental workload ( 33 ). However, our results showed varied trends of activity in these three Brodmann areas in relation to subjective mental workload levels, which might be related to the function of each Brodmann area.
To detect and assess pilots’ mental workload levels based on the collected fNIRS data in the simulated emergency flight scenarios induced by different equipment failures, we trained and tested an SVM hierarchical combination classifier using the ΔOxyHb data of different channels as input. All evaluation indexes of SVM1 and SVM2 were found to be greater than 80%, which indicated that the SVM hierarchical combination classifier was reliable. Moreover, all four evaluation indexes of the SVM hierarchical combination classifier obtained by multiplying SVM1 and SVM2 were higher than the SVM with three classes directly, indicating the performance of the SVM hierarchical combination classifier was better than the SVM classifier with three classes directly. To verify the representativeness and credibility of the mental workload classification model established by SVM, the same classification factors as SVM1 and SVM2, respectively, were reclassified according to the same classification order using KNN. The results indicated that all SVM evaluation indexes were higher than those of KNN, which was consistent with the findings of Mohanavelu et al. ( 22 ); the was probably because SVM outperformed KNN provided the sample size was not small ( 34 ). For the SVM hierarchical combination classifier, all evaluation indexes of SVM2 were higher than SVM1, probably because the second layer of the classifier had more classification factors than the first, which might also explain why the accuracy of KNN2 was higher than KNN1. Furthermore, the accuracy of each layer of the classifier was generally more than 10% higher than their other evaluation indexes (i.e., precision, recall, and F1-score), possibly because the number of each class was different for each layer of the classifier. To be specific, for the first layer of the classifier, the number of samples in Subtask I was lower than the sum of Subtasks II and III. For the second layer of the classifier, the number of samples in Subtask II was lower than that of Subtask III, which might be because RH ENG failures resulted in a reduced flight speed and corresponding increased flight duration. It is worth noting that this study did not consider pilots’ personal attributes as input for mental workload level classification; it is feasible that by including factors such as age and gender such data might improve the classification results achieved from machine learning models ( 35 ).
Conclusions
This study aimed to detect and assess pilots’ mental workload based on fNIRS data in simulated emergency flight scenarios induced by equipment failure. Twenty-five pilot cadets who, uniquely for this type of study, had actual flight experience were recruited from the Civil Aviation Flight University of China; during flight operations their ΔOxyHb data related to brain activity were collected via wearable devices. To investigate the pilots’ mental workload under emergency flight scenarios, an extensive flight simulation study was conducted using a high-fidelity flight simulator and fNIRS, and a mental workload classifier incorporating a machine learning approach was built. The results supported the feasibility of detecting pilots’ mental workload using ΔOxyHb data in simulated emergency flight scenarios, here induced by different equipment failure, which is critical to aviation safety. Furthermore, activity within distinct regions of the brain (e.g., PFC, motor cortex, and OC) was found to differ under diverse mental workload levels. Based on these results, the mental workload classifier proposed in this study achieved good levels of accuracy, precision, recall, and F1-score, and the performance of SVM was superior to KNN.
This study successfully detected and evaluated pilots’ mental workload based on the collected fNIRS data in simulated emergency flight scenarios. However, our study was subject to a few limitations as follows. Firstly, this study used a fixed-based flight simulator to simulate the emergency flight scenarios, which differed to a certain extent from actual emergency flight scenarios. Secondly, this study did not consider the pilots’ personal attributes such as age, gender, or flight experience as input for mental workload level classification. The incorporation of these factors would be expected to improve the classification accuracy of machine learning models. In the future, we intend to evaluate pilots’ mental workload in a more realistic emergency environment, incorporating a full flight simulator and combining this with pilot training systems to improve the pilots’ capability during emergency flights.
Footnotes
Acknowledgements
The authors thank the pilot cadets from the Flight Technology College of Civil Aviation Flight University of China; and are grateful for the support of Danyang Huichuang Medical Equipment Co., Ltd and CnTech Co., Ltd.
Author Contributions
The authors confirm contribution to the paper as follows: study conception and design: L. Fu, C. Jiang, C. Wen, C. Zhang; data collection: C. Zhang, J. Yuan; analysis and interpretation of results: C. Zhang, Y. Jiao, H. Liu; draft manuscript preparation: C. Zhang. All authors reviewed the results and approved the final version of the manuscript.
Declaration of Conflicting Interests
The authors declared no potential conflicts of interest with respect to the research, authorship, and/or publication of this article.
Funding
The authors disclosed receipt of the following financial support for the research, authorship, and/or publication of this article: This research was funded by the Open Fund of the Key Laboratory of Flight Techniques and Flight Safety, CAAC (grant no. FZ2021KF05) and the Key Research Base of Humanistic and Social Sciences of Deyang-Psychology and Behavior Science Research Center (Sichuan Institute of Industrial Technology) (grant no. XLYXW2023202).