
Abstract
With the increase in the use of technology, smartphone distraction has become a significant pedestrian safety issue. Research on pedestrian smartphone distraction has been conducted mainly in western countries, and there is a scarcity of research in low- and middle-income countries (LMICs). This study is the first attempt to investigate the effect of smartphone distraction on pedestrians’ road crossing behavior in India. We conducted a survey of pedestrians, with 560 respondents (63.4% males), about their demographics and walking characteristics, pedestrian behavior (violations, errors, lapses, aggressive behaviors, and positive behaviors), and smartphone distraction. The associations of smartphone distraction and pedestrian characteristics with pedestrians’ road crossing behavior were identified by developing structural equation models (SEMs). The strongest influence of smartphone distraction was found to be on violations (factor loading = 0.50), followed by errors (factor loading = 0.44), lapses (factor loading = 0.41), and aggressive behaviors (factor loading = 0.37). No significant effect of smartphone distraction was observed on the positive behaviors. Male pedestrians were more likely to commit violations, errors, lapses, and aggressive behaviors, whereas female pedestrians showed more positive behaviors. Older pedestrians showed more positive behavior than young pedestrians. Pedestrians who walk at high speeds tend to engage in a high number of violations. Pedestrians with a crash history were more likely to commit violations and show aggressive behaviors than those with no prior crash experience. The study findings can aid policymakers in understanding the smartphone distraction habits of pedestrians, which are required to design behavior-based road safety interventions.
In recent years, walking has been promoted by researchers and governments around the world as it has positive impacts on physical, psychological, social, economic, and environmental health ( 1 , 2 ). Walking is a basic mode of transportation for making trips ( 3 ). Even though walking has several benefits, pedestrians are the most vulnerable group reported in road traffic fatalities ( 4 , 5 ). The recent global road safety report states that 23% of road deaths are comprised by pedestrians ( 6 ). Worldwide, observational studies have reported that pedestrians are often found to commit road safety violations, especially during road crossings at midblock sections and intersections ( 7 – 12 ).
Mobile phones have become an integral component of everyday life. With new technologies penetrating the consumer market every day, the use of mobile phones has significantly increased over the years. Considering this growth, technological distraction among pedestrians has emerged as an interesting area for road safety researchers. Many times, pedestrians have been observed to be engaged with their mobile phones during the task of road crossing ( 13 ). The pedestrians who are found to use mobile phones during road crossing are also found to have slow walking speeds, which makes them more vulnerable to being involved in road traffic crashes ( 14 ). A recent systematic review suggested that the act of mobile phone use during road crossing has been observed in 12% to 45% of pedestrians, which is quite alarming ( 15 ).
The detrimental impact of smartphone distraction on pedestrian safety has been well established in laboratory experiments ( 16 ), observational studies ( 17 ), crash-based investigations ( 18 ), as well as survey-based research investigating pedestrian psychology ( 19 ). In a recent study, Liu et al. ( 20 ) modeled the effects of visual and auditory mobile phone distractions on the reaction time of pedestrians in response to green signals. They found that Chinese pedestrians responded more quickly than Canadian pedestrians, and the pedestrian reaction was faster at intersections than midblock crosswalks. Visual distractions resulted in a 50% increment in the reaction time of pedestrians, while this increment was 67% in the case of auditory distractions ( 20 ). A new term has been coined in the recent literature, where the pedestrians engaged in their mobile phones are termed as “smartphone zombies,” or “smombies” ( 21 ). The type of mobile phone distraction can be cognitive, auditory, visual, or physical ( 22 ). Different types of distraction activities lead to varying levels of attention deficit among pedestrians ( 20 ). For instance, texting and web surfing have resulted in a higher unsafe road crossing behavior among pedestrians compared with talking and listening to music ( 23 ). Lennon et al. ( 24 ) reported that pedestrians in the age group of 18 to 30 years have a significantly higher likelihood of using a mobile phone during road crossing compared with older pedestrians. Lin and Huang ( 25 ) found different gaze scanning patterns and event response performances among the pedestrians involved in various distraction activities. With an increase in mental workload, situational awareness among pedestrians diminished ( 25 ). These findings highlight the importance of understanding the behavioral aspects of pedestrian distraction in the fast-growing technological world ( 26 ).
The literature on pedestrian technological distraction is far less than the plethora of study on driver distraction ( 27 , 28 ). The studies on pedestrian smartphone distraction have been conducted mainly in developed countries, and there is a scarcity of research from the perspective of low- and middle-income countries (LMICs)/developing countries. Traffic conditions vary widely between the developing and developed countries. Where developed countries have lane-based homogeneous traffic with dedicated lanes for traffic movement, developing nations have no-lane-based heterogeneous traffic movements, that is, the vehicles do not strictly follow lane-based discipline and drive through the gaps between the lead vehicles. Moreover, compliance with the law and adherence to traffic rules by road users are more stringent in developed countries than in developing countries. Additionally, developed countries are well equipped with pedestrian safety infrastructure/facilities, adequate pedestrian phase/signal timing for road crossing, and so forth, which is not as prevalent in a developing nation like India. A recent study on cross-cultural comparison of pedestrian behaviors reported that pedestrians in developing countries have higher tendencies to perform risky road crossing behavior than those in developed countries ( 29 ). As more than 90% of road fatalities occur in LMICs, there is a need to conduct detailed examinations on pedestrian distraction ( 6 ). Further, much of the research on pedestrian distraction has been done through traffic observations and laboratory experiments, and relatively few studies have utilized self-reported measures for understanding pedestrian behavior. In addition, the Pedestrian Behavior Questionnaire has been widely used to study the risky road crossing behavior of pedestrians, and the association of self-reported pedestrian behavior with mobile phone distraction is scarcely studied. Therefore, the present study used a self-reporting approach to examine the behavioral impairment among Indian pedestrians when using their mobile phones during road crossing. This study aims to test two major hypotheses. First, it can be hypothesized that smartphone distraction leads to a higher frequency of violations, lapses, errors, and aggressive behaviors among pedestrians. The second hypothesis is that pedestrians involved in higher levels of smartphone distraction tend to show lower positive behaviors.
In this context, the objectives of the present study are as follows:
a. To investigate the influence of self-reported smartphone distraction frequencies on the road crossing behavior of Indian pedestrians. Road crossing behavior has been categorized into five aspects: violations, errors, lapses, aggressive behaviors, and positive behaviors ( 29 , 30 ).
b. To evaluate the associations of the demographics and walking characteristics (age, gender, crash history, walking duration, walking speed, and quality of walking environment) with the road crossing behavior of pedestrians.
This paper is structured as follows: the detailed discussions on the Pedestrian Behavior Questionnaire, smartphone distraction, and the role of pedestrian characteristics along with the data collection procedure are provided in the survey design section. Further, the sample characteristics, descriptive statistics obtained from the survey, and data analysis technique are described. Next, the detailed data analysis, model results, and their interpretations are illustrated. Subsequently, the study findings are discussed in the light of past research along with practical implications of the findings. At the end, the limitations and future research scope of the study are highlighted, and the conclusions are outlined.
Methods
Survey Design
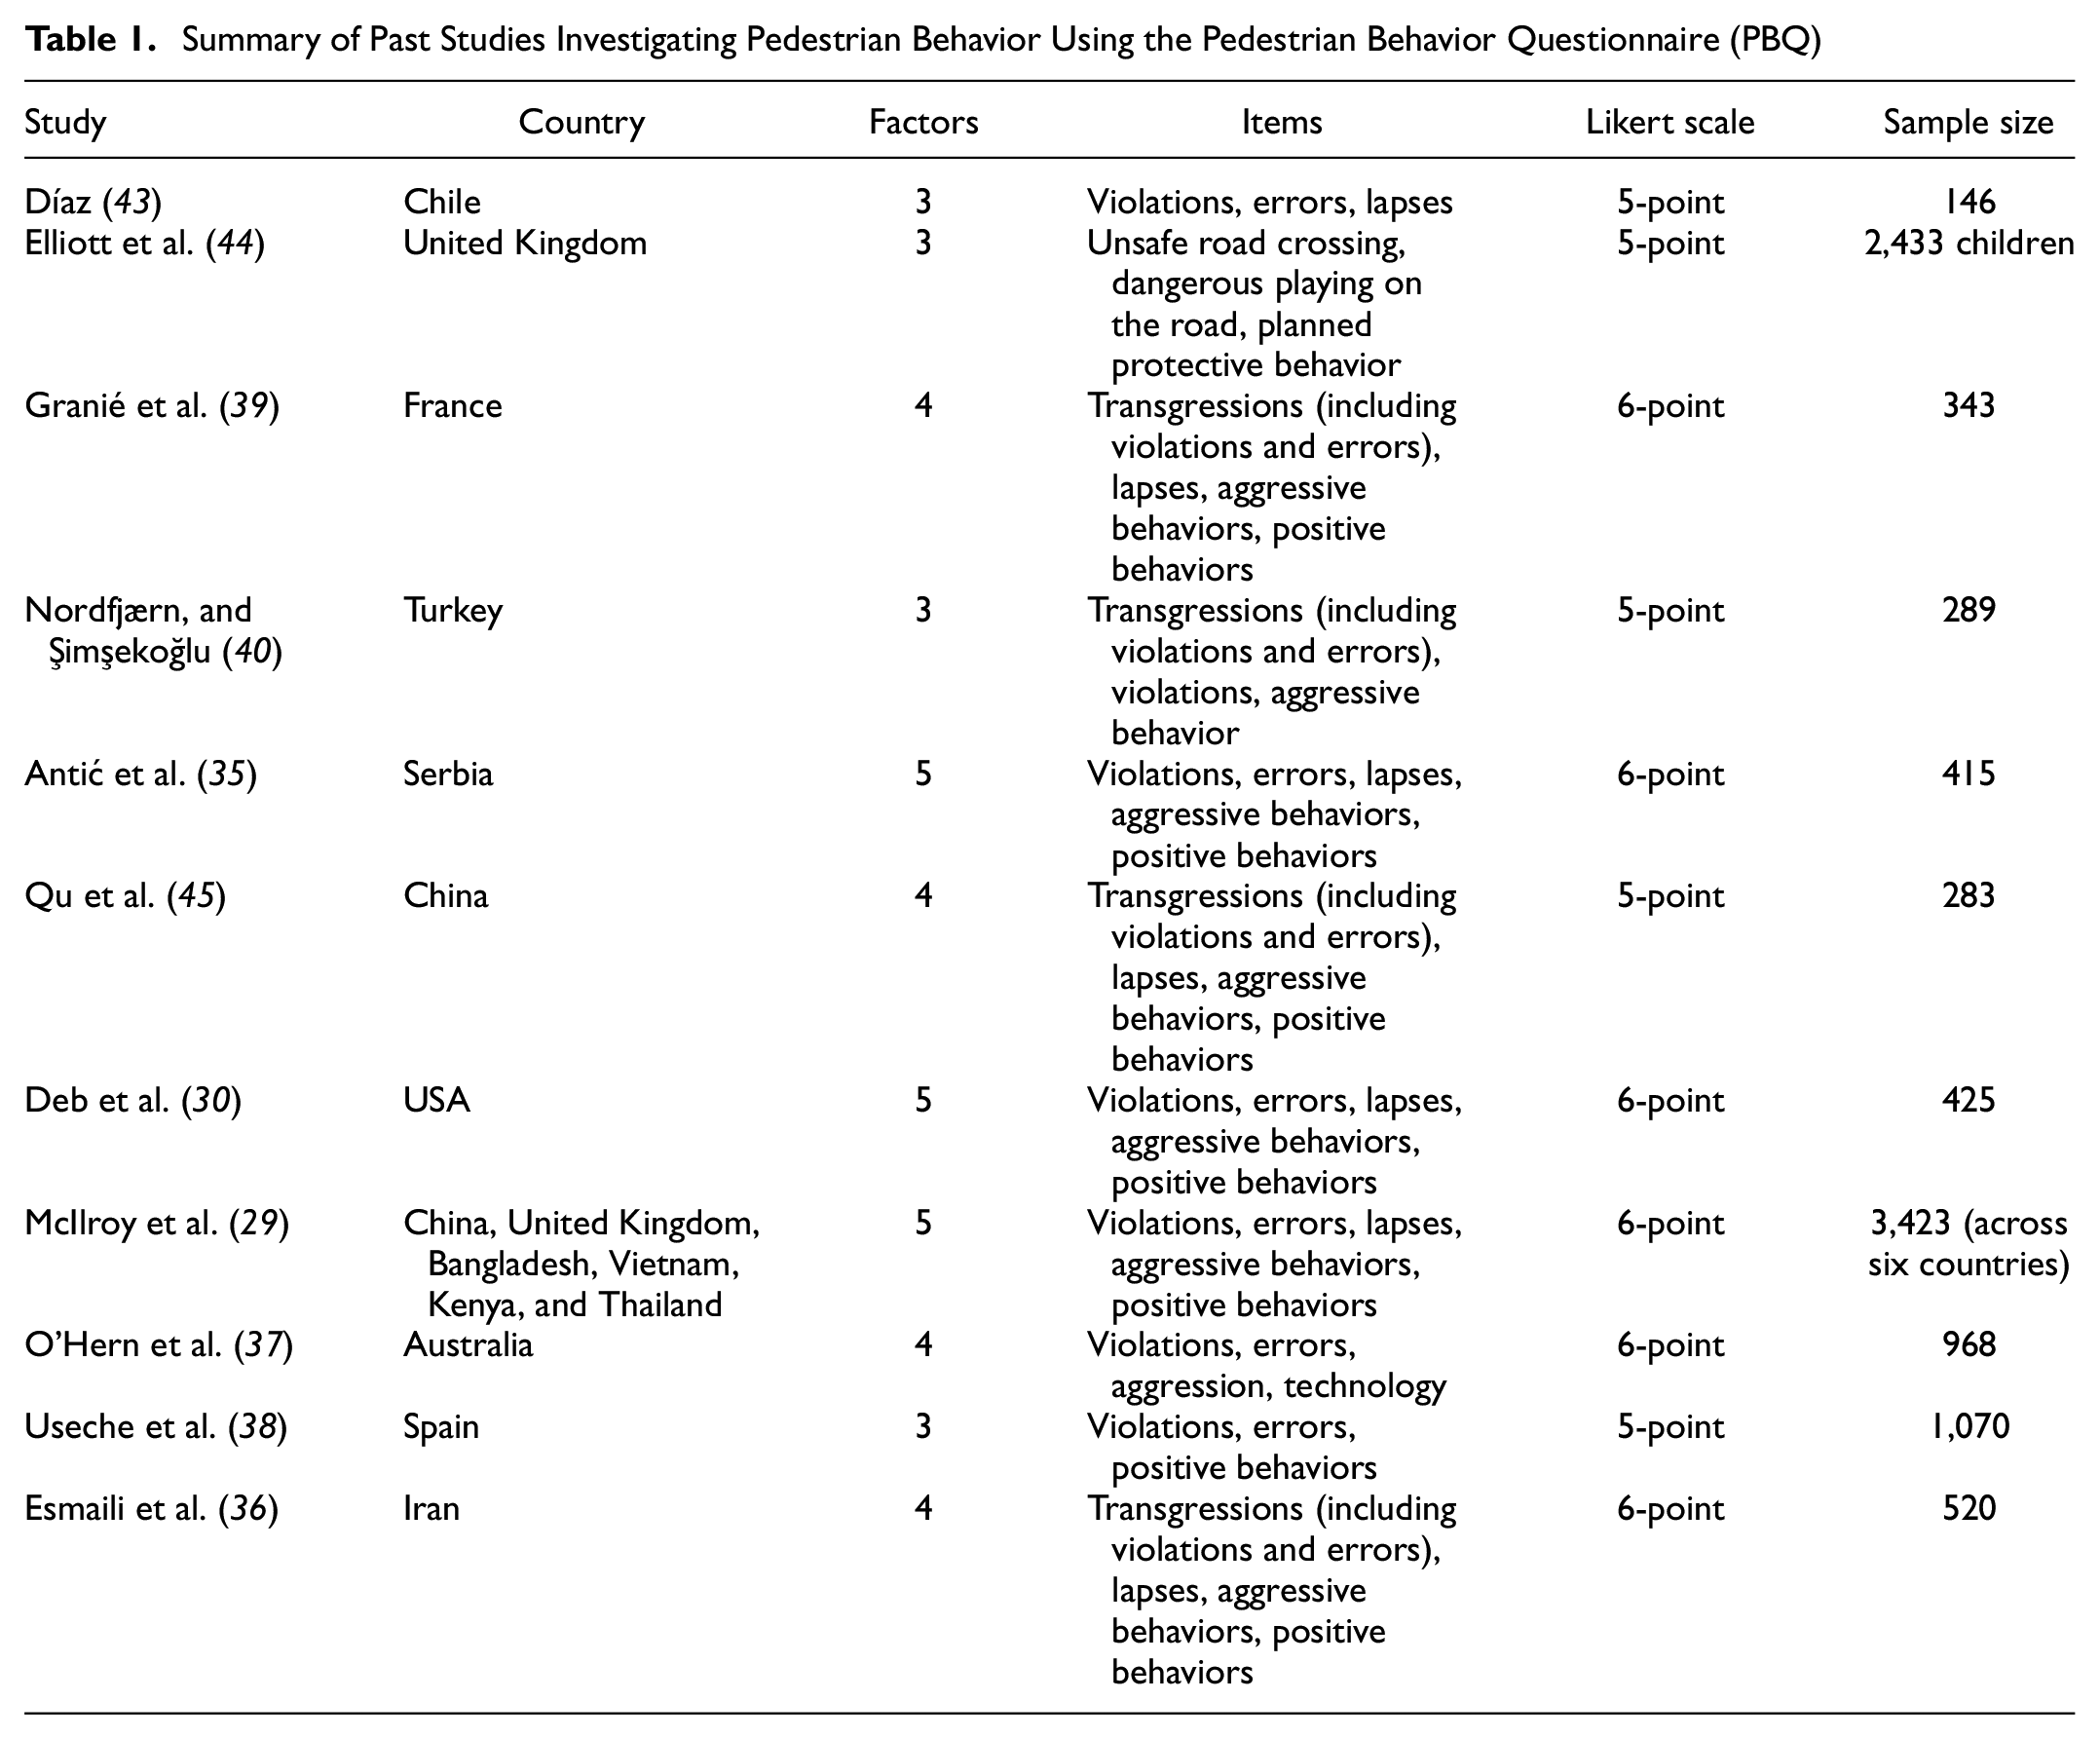
Various versions of the Pedestrian Behavior Questionnaire (PBQ) have been utilized in the literature, which have been adapted from the Driver Behavior Questionnaire (DBQ) given by Reason et al. ( 31 ). The initial structure of DBQ consisted of two factors: violations and mistakes, where the violations represented intentional behavior while mistakes depicted the unintentional errors. Parker et al. ( 32 ) further categorized driver behavior into three factors: violations (intentional behavior), errors (unintentional mistake), and lapses in attention. Further, Lawton et al. ( 33 ) added the fourth component of aggressive behavior, and Özkan and Lajunen ( 34 ) included the fifth component of positive behavior. Over the years, the PBQ has been used to understand pedestrian behavior in various countries such as the United States of America ( 30 ), Serbia ( 35 ), Iran ( 36 ), Australia ( 37 ), Spain ( 38 ), France ( 39 ), Turkey ( 40 ), Chile ( 41 ), and the United Kingdom ( 42 ). Deb et al. ( 30 ) introduced a short version of the 20-item PBQ with five items (violations, errors, lapses, aggressive behaviors, and positive behaviors) developed from the lengthy version of the 50-item PBQ and demonstrated its efficacy in examining pedestrian behavior at crosswalks. McIlroy et al. ( 29 ) used this 20-item PBQ to analyze the differences in pedestrian behavior among six distinct countries: China, the United Kingdom, Bangladesh, Vietnam, Kenya, and Thailand. A summary of previous studies investigating pedestrian behavior using PBQ is shown in Table 1.
Summary of Past Studies Investigating Pedestrian Behavior Using the Pedestrian Behavior Questionnaire (PBQ)
In this study, a questionnaire was designed with different sections on pedestrian demographics, walking characteristics, smartphone distraction frequencies, and pedestrian road crossing behavior. The Institutional Review Board (IRB) of the Indian Institute of Technology Bombay approved the study protocol (Reference: IRB-2021-021). Pedestrian road crossing behavior was evaluated using the 20-item PBQ, which has been widely used in previous studies on pedestrian behavior ( 29 , 30 , 39 ). The PBQ consisted of five constructs: violations, errors, lapses, aggressive behaviors, and positive behaviors ( 30 ). All five constructs consisted of five items each. The pedestrians had to rate their respective behavior on a five-point Likert scale where “1” represented “never or very infrequently” and “5” signified “always or very frequently.” Further, smartphone distraction frequencies were captured using the 10-item instrument covering the various distracting activities, adapted from Young et al. ( 46 ).
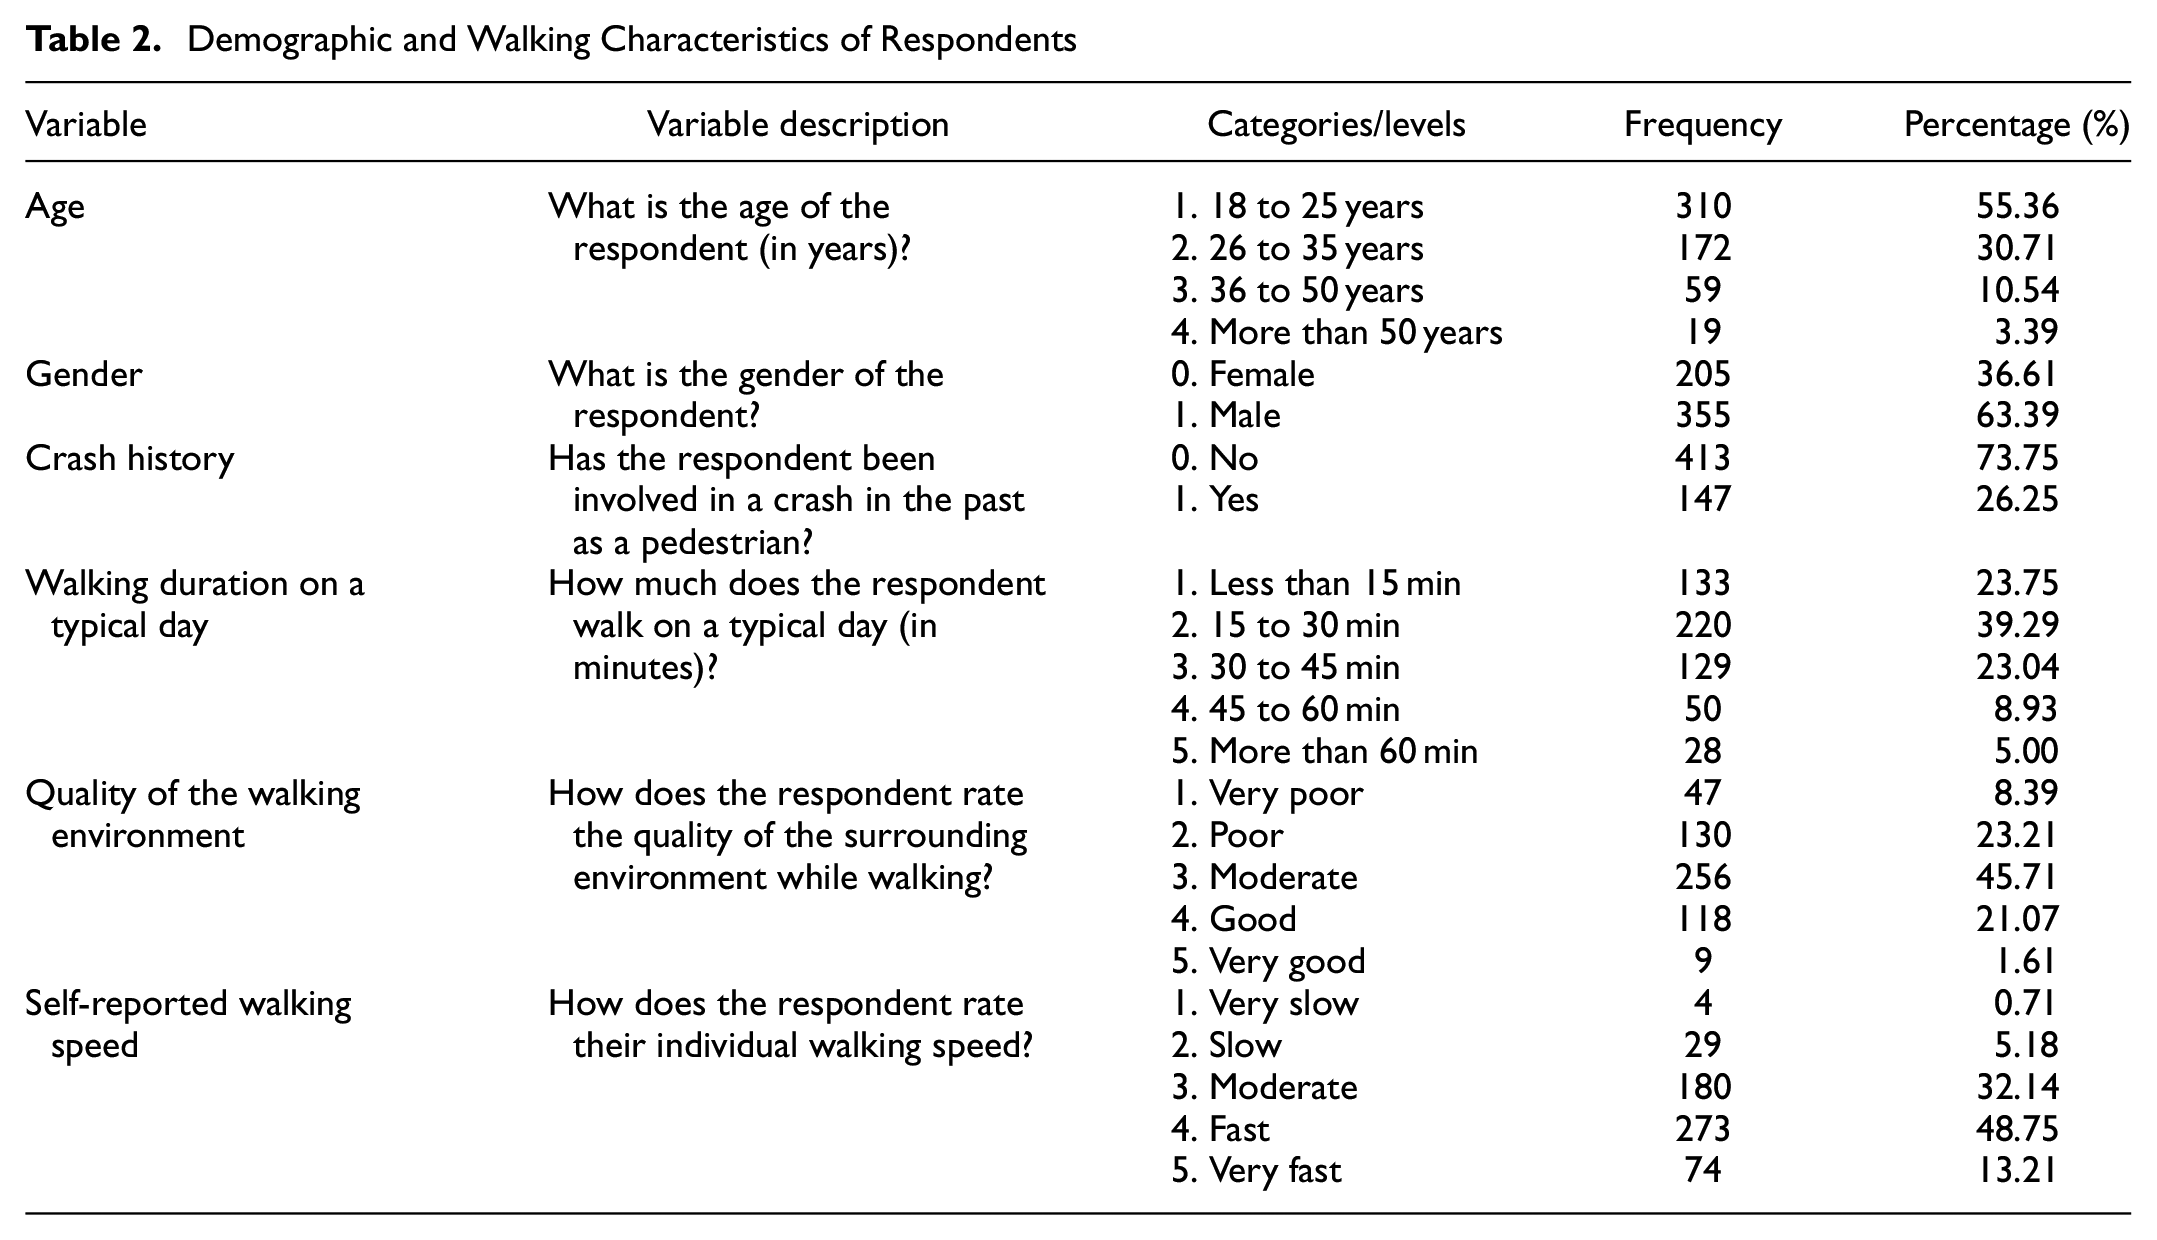
Along with smartphone distraction, pedestrian characteristics have also been found to play an essential role in influencing the road crossing behavior of pedestrians. Previous studies have examined the role of various contributing factors such as pedestrians’ age ( 17 ), gender ( 47 ), walking duration ( 48 ), quality of walking environment ( 49 ), and walking speed ( 16 ) on their road crossing behavior. In a recent study, older pedestrians showed safer road crossing behavior than younger pedestrians ( 50 ). Further, male pedestrians were found to have 4.1 times higher odds of displaying unsafe road crossing behavior at unsignalized intersections compared with female pedestrians ( 17 ). Therefore, in addition to the PBQ items, pedestrians’ age, gender, crash history, and walking characteristics, such as the walking duration on a typical day, quality of the walking environment, and self-reported walking speed, were also recorded in the questionnaire. For the crash history, the respondents were asked whether they had any experience of a prior crash as a pedestrian or not. Responses on the quality of the walking environment were on a five-point Likert scale where “1” indicated “very poor” and “5” indicated “very good.” The description of each variable asked in the questionnaire is provided in Table 2.
Demographic and Walking Characteristics of Respondents
The survey was circulated on online platforms and social media groups where the participation was restricted to Indian pedestrians with the age of 18 years and above. The data collection was conducted between September and November 2021. The average survey duration was about 15 min. Participation was voluntary and anonymous, and no monetary rewards were provided. Only complete responses were recorded as it was mandatory for all the questions to be answered.
Sample
In this study, the target sample size was calculated using Cochran’s formula ( 51 ), shown below:
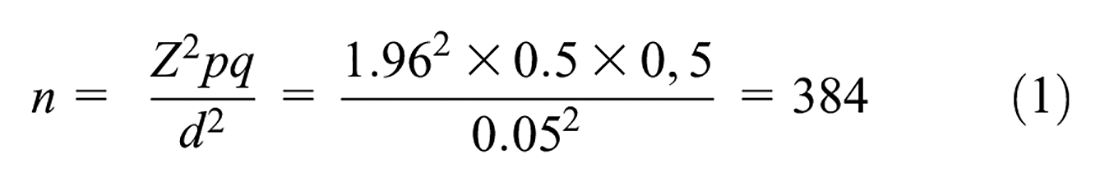
where p represents the target population (0.5 for a very large population), q = 1 −p, d is the error margin (5%), and considering 95% confidence interval, equivalent Z = 1.96. Accordingly, the responses collected in the survey were more than the target sample size.
In total, 592 participants completed the survey. Out of these, 32 responses were filtered because of incorrect responses provided in either of the two check questions included in the survey. The remaining 560 participants’ responses were considered for the final analysis. Table 2 shows the demographic and walking characteristics of the final sample: 63.4% of the participants were males, and 36.6% were females. About 55.4% of the participants were in the age group of 18 to 25 years. This indicates that the majority of the participation came from younger people as they are more likely to be technology-enabled than older people.
Data Analysis and Results
STATA MP-15 software was used to conduct the statistical analysis in the present study. The preliminary analysis included estimating the reliability/internal consistency of all the scales used in the study. For this purpose, Cronbach’s alpha was obtained for each scale, with values more than 0.7 being considered accepted ( 52 ). Further, two structural equation models (SEMs) were developed. The first SEM model aimed to identify the associations of smartphone distraction frequencies with the five constructs of pedestrian road crossing behavior. The second SEM model was developed to investigate the relationships of pedestrians’ demographic and walking characteristics with the five constructs of PBQ.
Descriptive Statistics
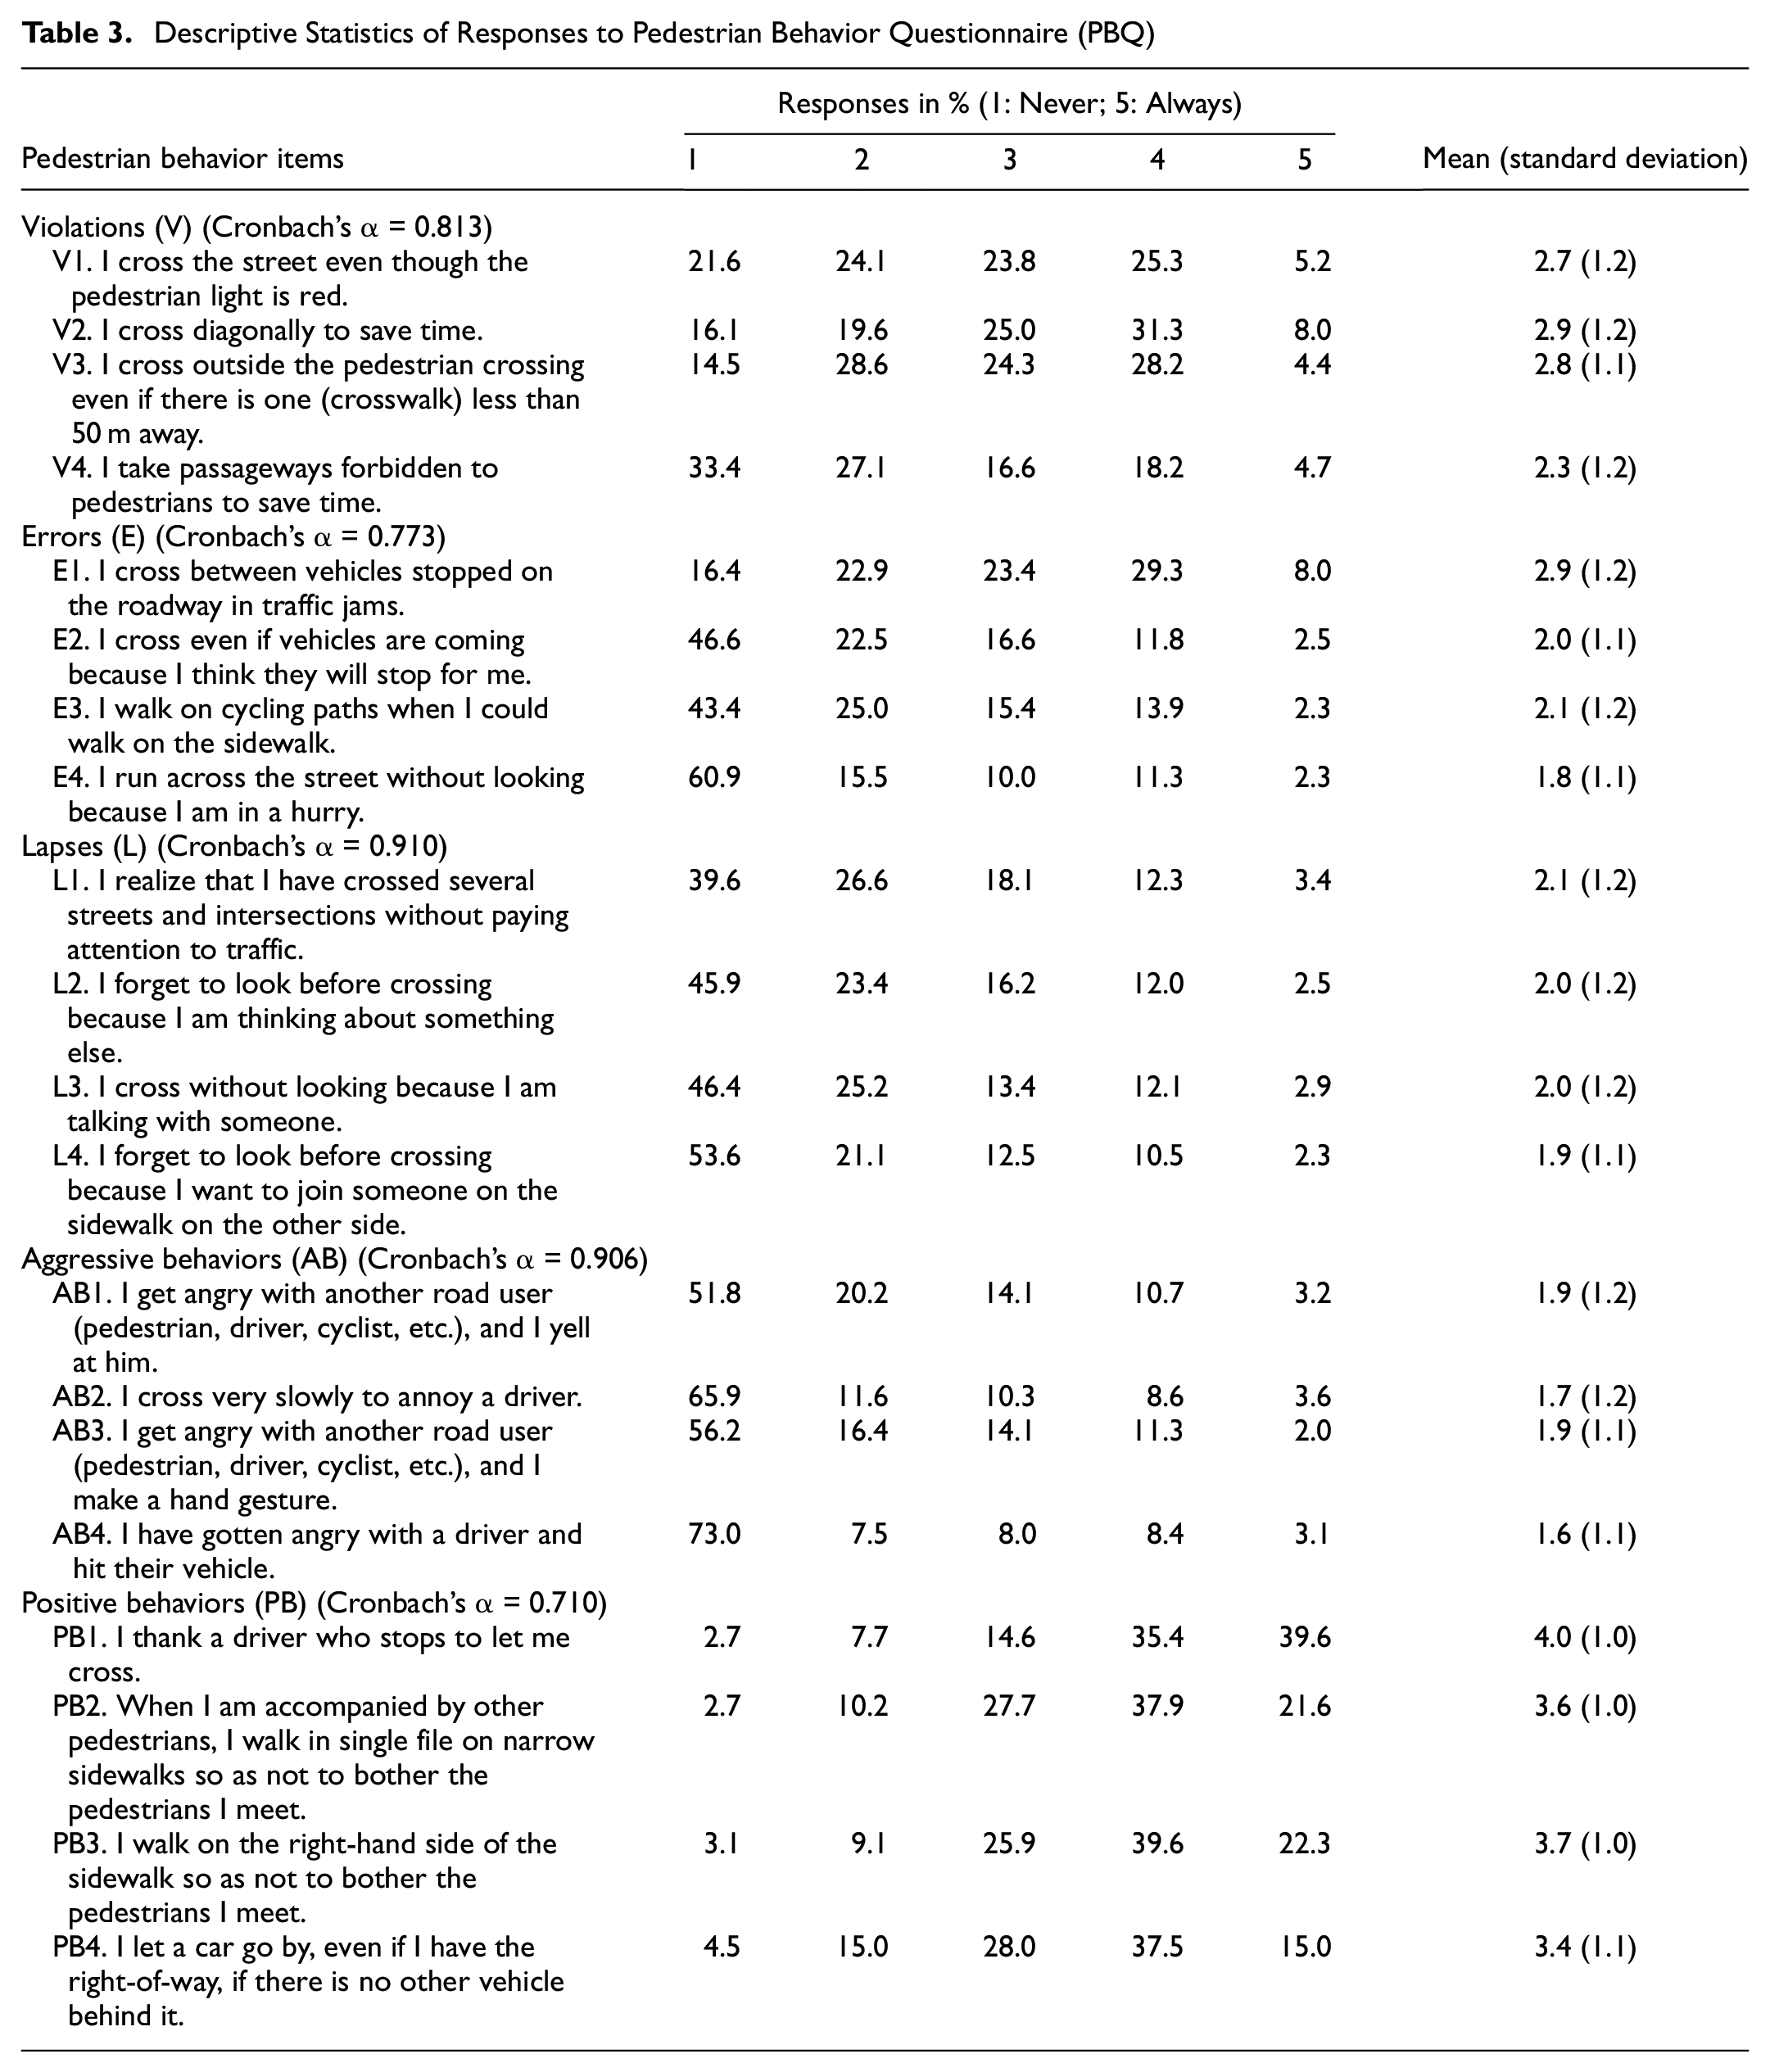
Table 3 presents the descriptive statistics (percentage distribution of responses, mean and standard deviation) of all the 20 behavioral items of the PBQ responded to by the pedestrians. The reliability coefficients (Cronbach’s α) of each of the five subscales are as follows: violations (0.813), errors (0.773), lapses (0.910), aggressive behaviors (0.906), and positive behaviors (0.710), indicating that these subscales were reliable ( 19 ). Pedestrians rated higher frequencies in showing positive behaviors during road crossing (e.g., thanking a driver for stopping and allowing the pedestrian to cross). The aggressive behaviors were found to have the lowest frequency ratings by the pedestrians (Table 3). The ratings of violations, errors, and lapses lay in between these two extremes. Similar reporting was also made by American pedestrians in a previous study ( 30 ).
Descriptive Statistics of Responses to Pedestrian Behavior Questionnaire (PBQ)
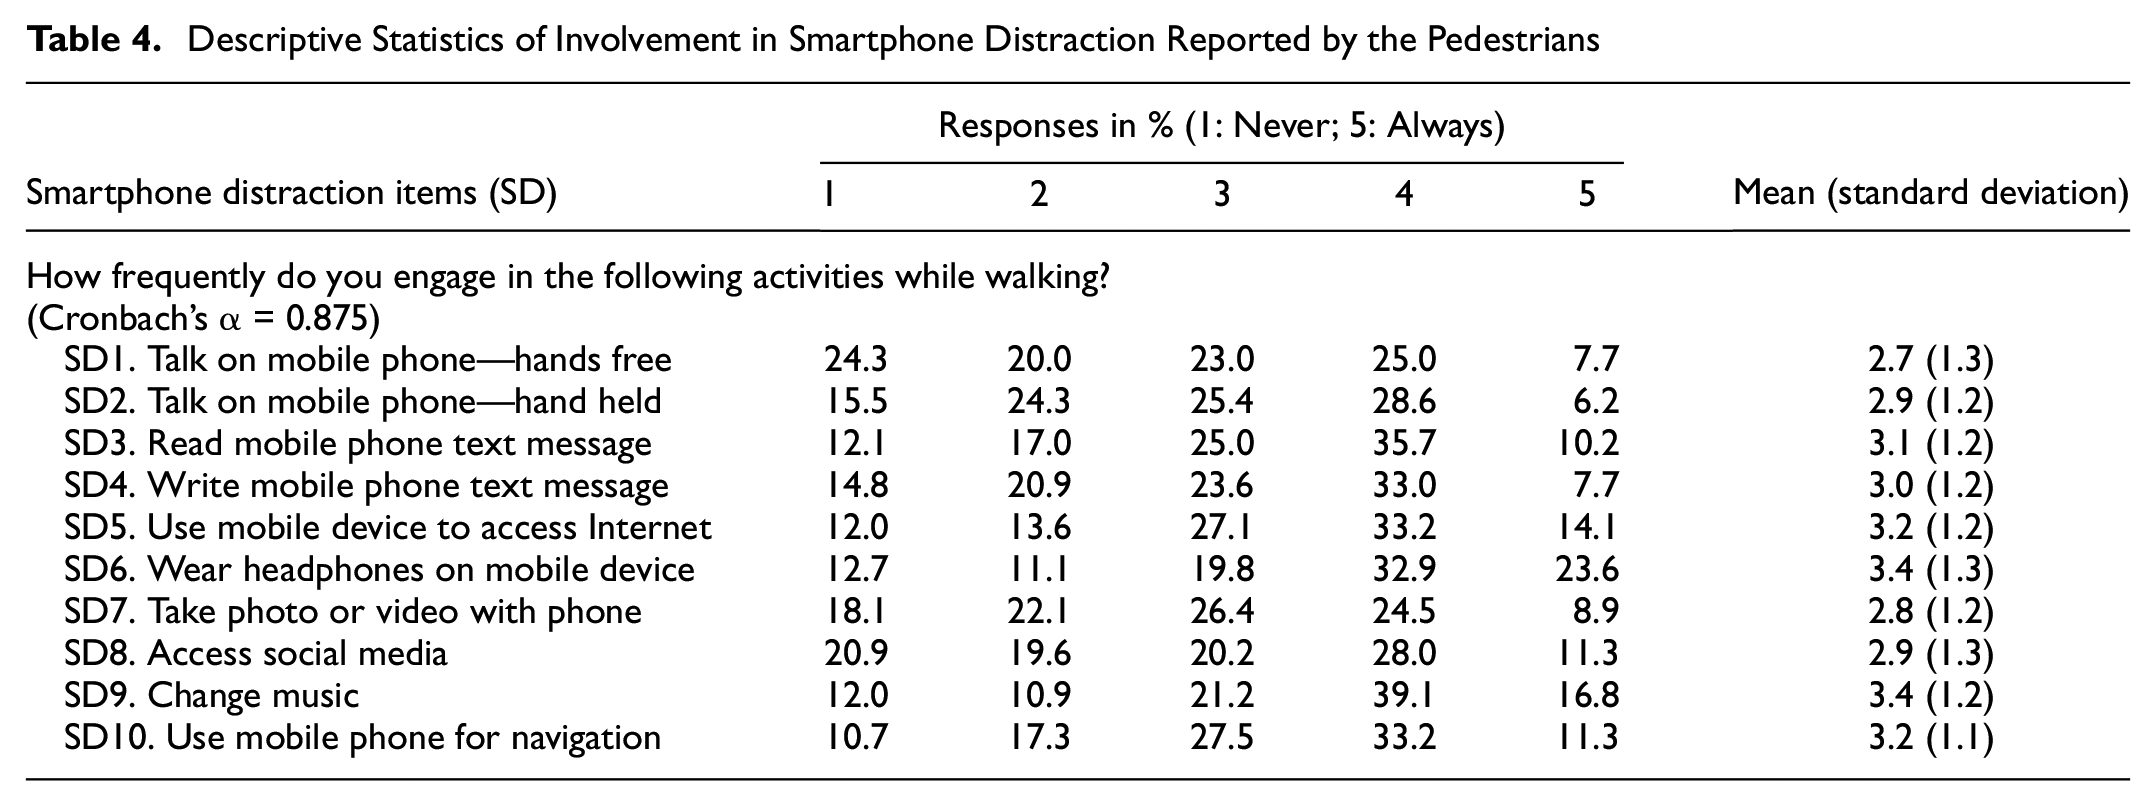
The descriptive statistics of involvement in smartphone distraction reported by pedestrians are compiled in Table 4. The pedestrians responded to the question “How frequently do you engage in the following activities while walking?” on a scale of 1 to 5, with respect to 10 items reported in Table 4. The table shows the distribution of responses along with the mean and standard deviation of each response. The reliability coefficient of the smartphone distraction scale was found to be 0.875 indicating acceptable reliability ( 52 ). The pedestrians reported the highest frequencies for using headphones on a mobile device (mean response = 3.4) and changing music (mean response = 3.4). In contrast, the lowest frequencies were observed for talking on a mobile phone in hands-free mode (mean response = 2.7).
Descriptive Statistics of Involvement in Smartphone Distraction Reported by the Pedestrians
Structural Equation Modeling
The SEM approach is used to identify the directional relationships between the observed/measured variables and unobserved/latent variables, by processing the endogenous and exogenous variables ( 53 ). SEM involves a set of simultaneous equations to establish these relationships ( 54 ). The benefits of SEM include simultaneous estimation of all the parameter estimates in the model to identify the strength of the relationship between the variables, handling complex interrelationships involving unobserved or latent variables, and accountability of multicollinearity ( 53 ).
There are two components in an SEM model: (a) measurement model and (b) structural model ( 53 , 55 , 56 ). The measurement model is developed to define the association of the corresponding exogeneous variables with the latent variable, and the structural model is used to establish the links between the different observed and unobserved/latent variables ( 53 , 57 ). The measurement model can be written in the form of the following equations (Equation 2 is for exogenous variables and Equation 3 is for endogenous variables) ( 55 – 57 ):
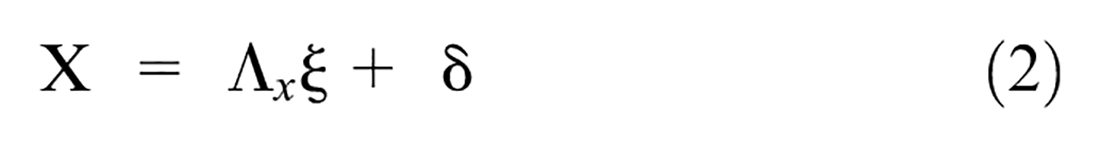
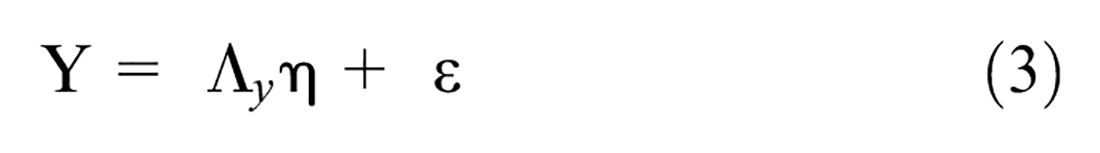
In the above equations, X and Y represent the respective column vectors of the observed exogenous and endogenous variables. The parameter estimates in the form of matrices are designated by Λx and Λy. The respective error terms are indicated by the column vectors δ and ε ( 55 , 57 ).
Further, the structural model can be represented in the form of the following equation (Equation 4) ( 55 ):
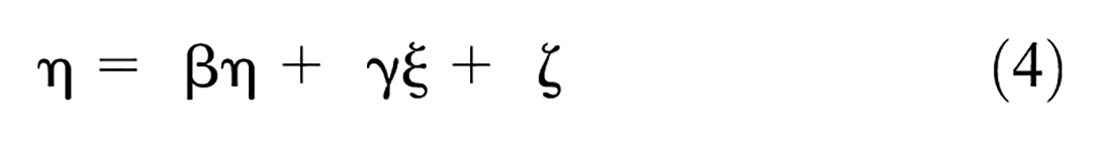
where the variables η and ξ represent the vectors of latent endogenous and latent exogenous variables in the model. The structural coefficient matrices for latent endogenous and exogenous variables are depicted by β and γ respectively. The term ζ indicates the random variables vector ( 55 , 56 ).
In this study, path diagrams have also been developed based on the findings of the SEM models, as they are quite useful in visually representing the associations between the variables obtained from an SEM ( 58 ). Moreover, the maximum likelihood estimation method is used in this study to estimate the model parameters as suggested by past research ( 57 ). The goodness of fit of the SEMs was assessed using the comparative fit index (CFI), standardized root mean square residual (SRMR), coefficient of determination (CD), Tucker-Lewis Index (TLI), and root mean squared error of approximation (RMSEA) ( 55 – 57 ).
Findings of SEMs
In both of the SEMs, five latent variables were considered for pedestrian behavior (violations, errors, lapses, aggressive behaviors, and positive behaviors) The latent variables of pedestrian behavior were defined based on the following measured items in the questionnaire: violations (V1 to V4), errors (E1 to E4), lapses (L1 to L4), aggressive behaviors (AB1 to AB4), and positive behaviors (PB1 to PB4), as described in Table 3. The results of both SEMs are discussed in the following subsections. The overall goodness-of-fit statistics indicated a good fit for both models ( 59 ).
SEM 1: Influence of Smartphone Distraction on Road Crossing Behavior
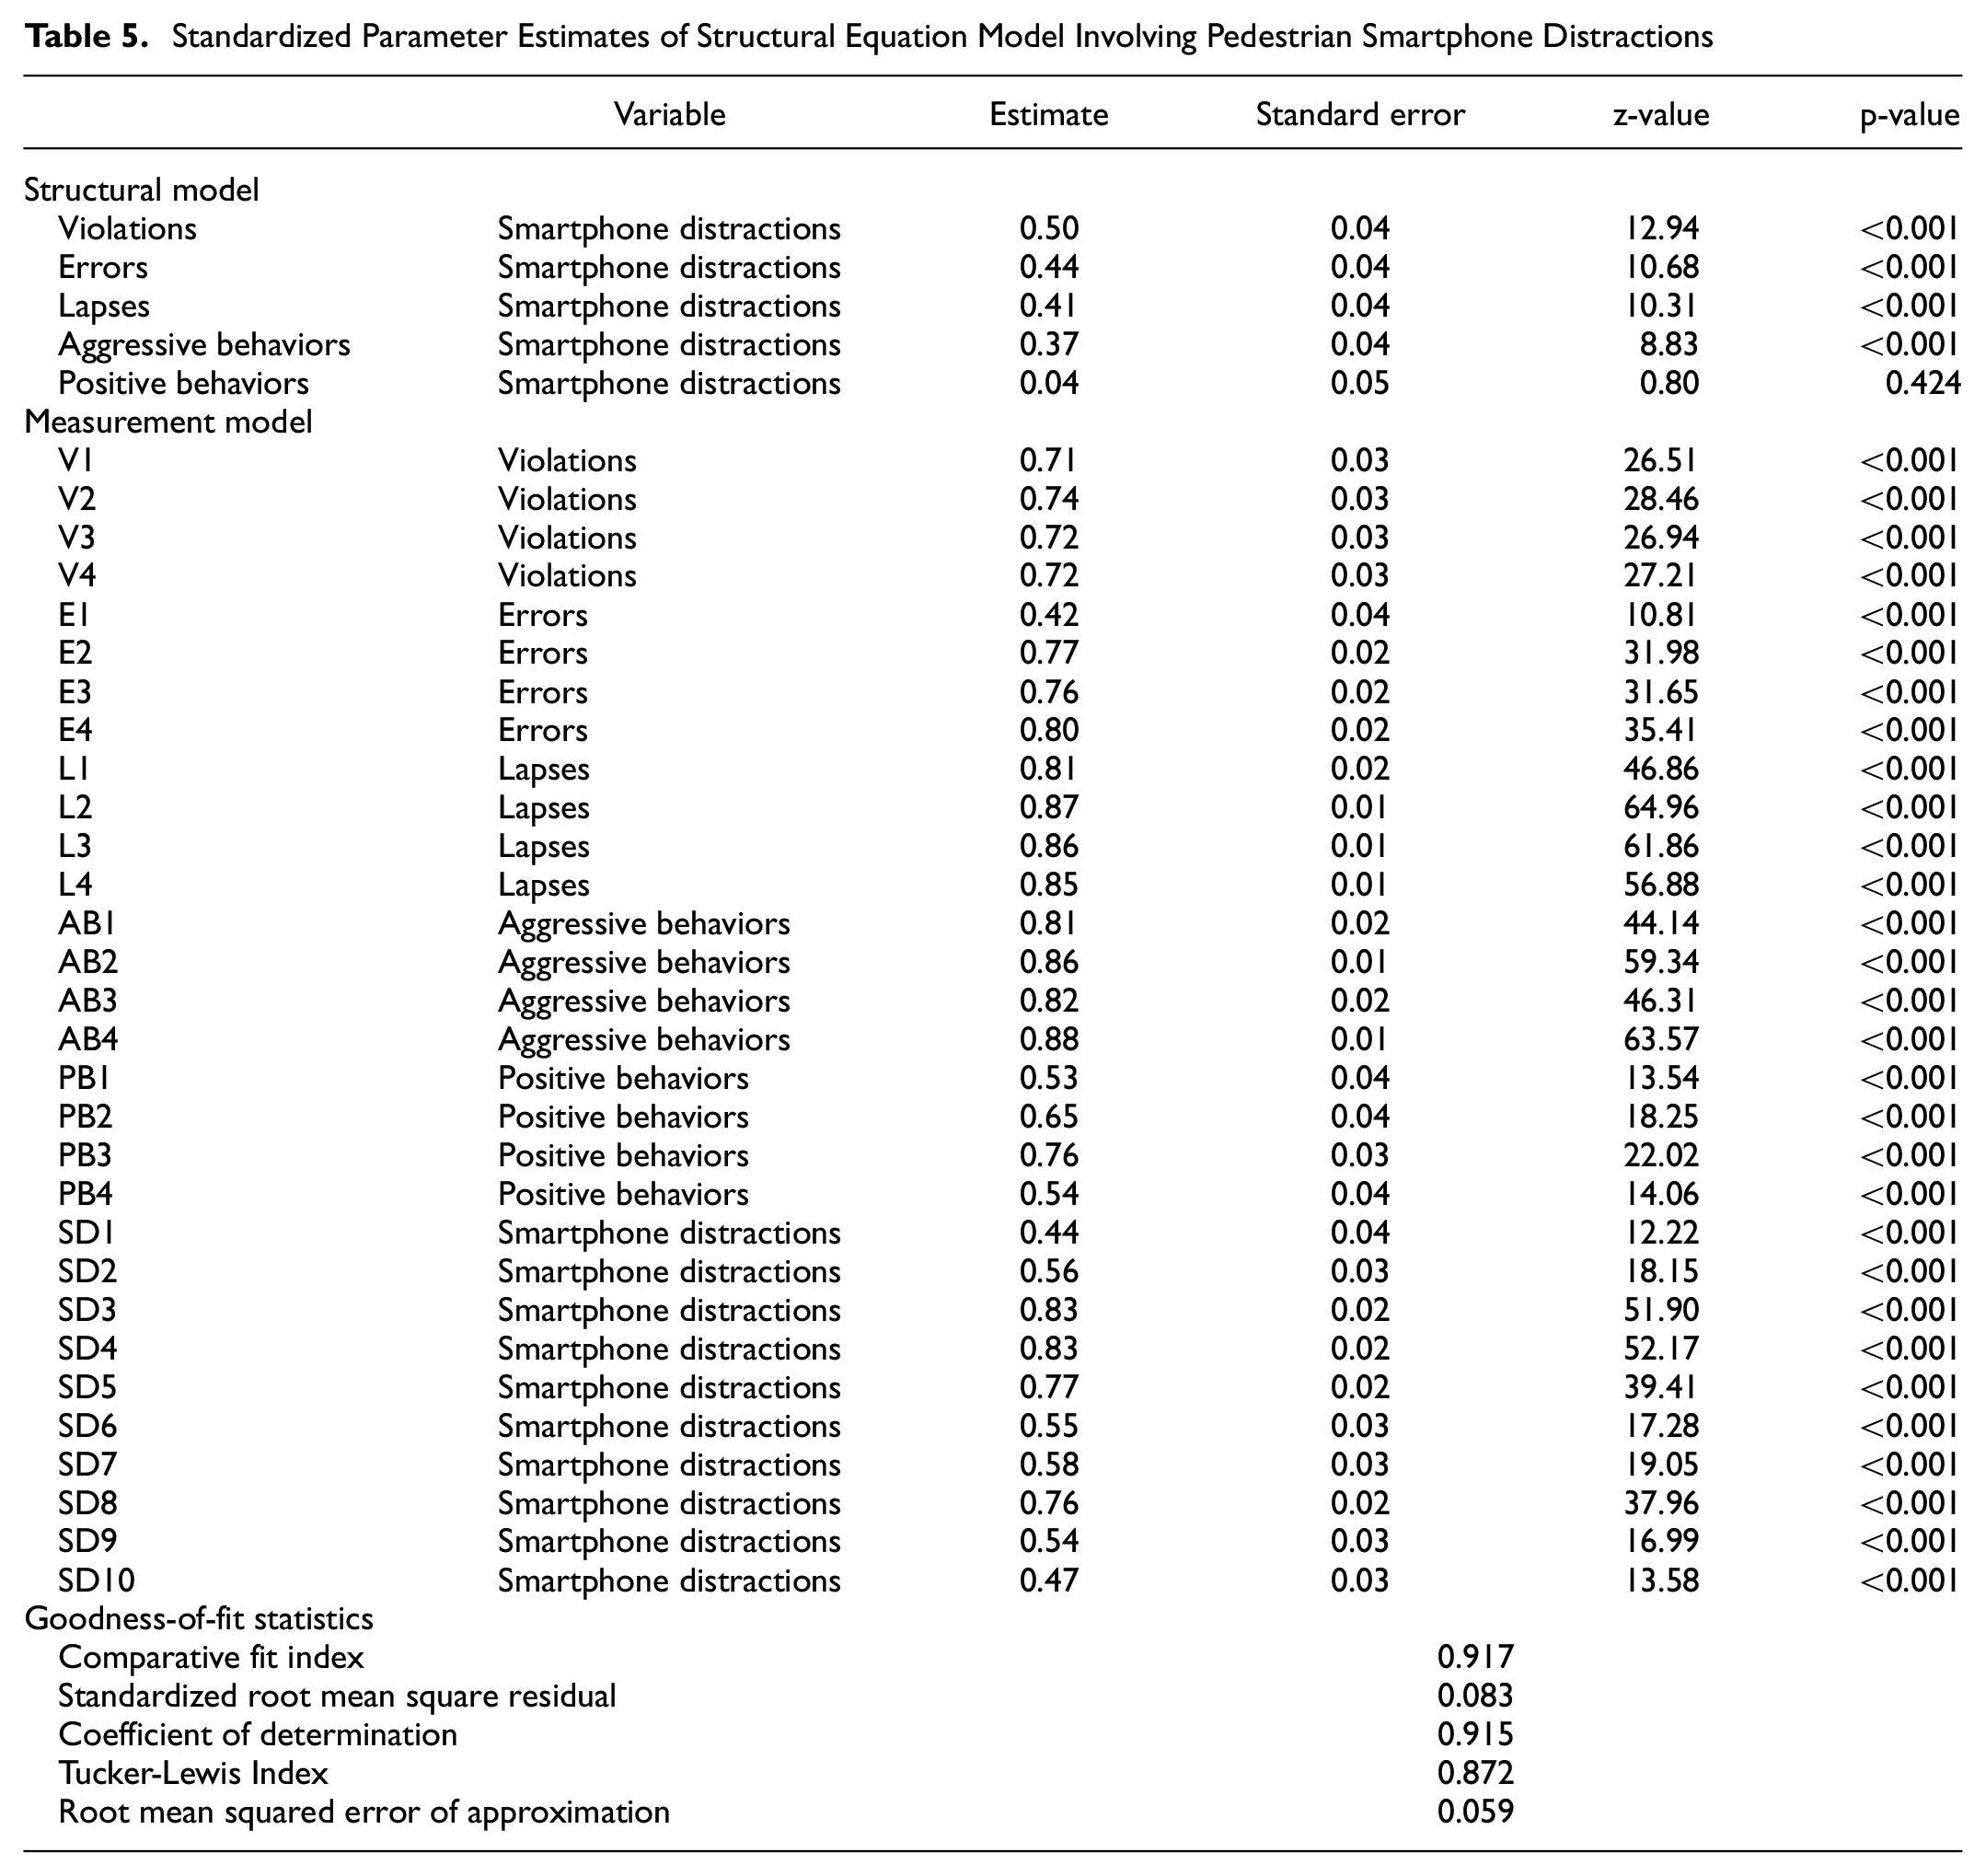
Along with the five latent variables of pedestrian behavior mentioned above, one latent variable corresponding to smartphone distractions was considered in the first SEM. The latent variable “smartphone distractions” was defined based on the items SD1 to SD10 reported in Table 5. The standardized parameter estimates of the first SEM are presented in Table 5. Along with the estimates of variables, the table highlights the standard error, z-value, significance of the variable (p-value), and the goodness-of-fit measures at the bottom end of the table. The measurement model estimates indicate the relationships between the latent variables and their corresponding observed variables measured from the questionnaire. The structural model estimates signify the association of the “smartphone distractions” latent variable with the pedestrian behavior latent variables: “violations,”“errors,”“lapses,”“aggressive behaviors,” and “positive behaviors.” The corresponding path diagram is shown in Figure 1. In the figure, the dotted arrows indicate non-significant relationships between the variables.
Standardized Parameter Estimates of Structural Equation Model Involving Pedestrian Smartphone Distractions
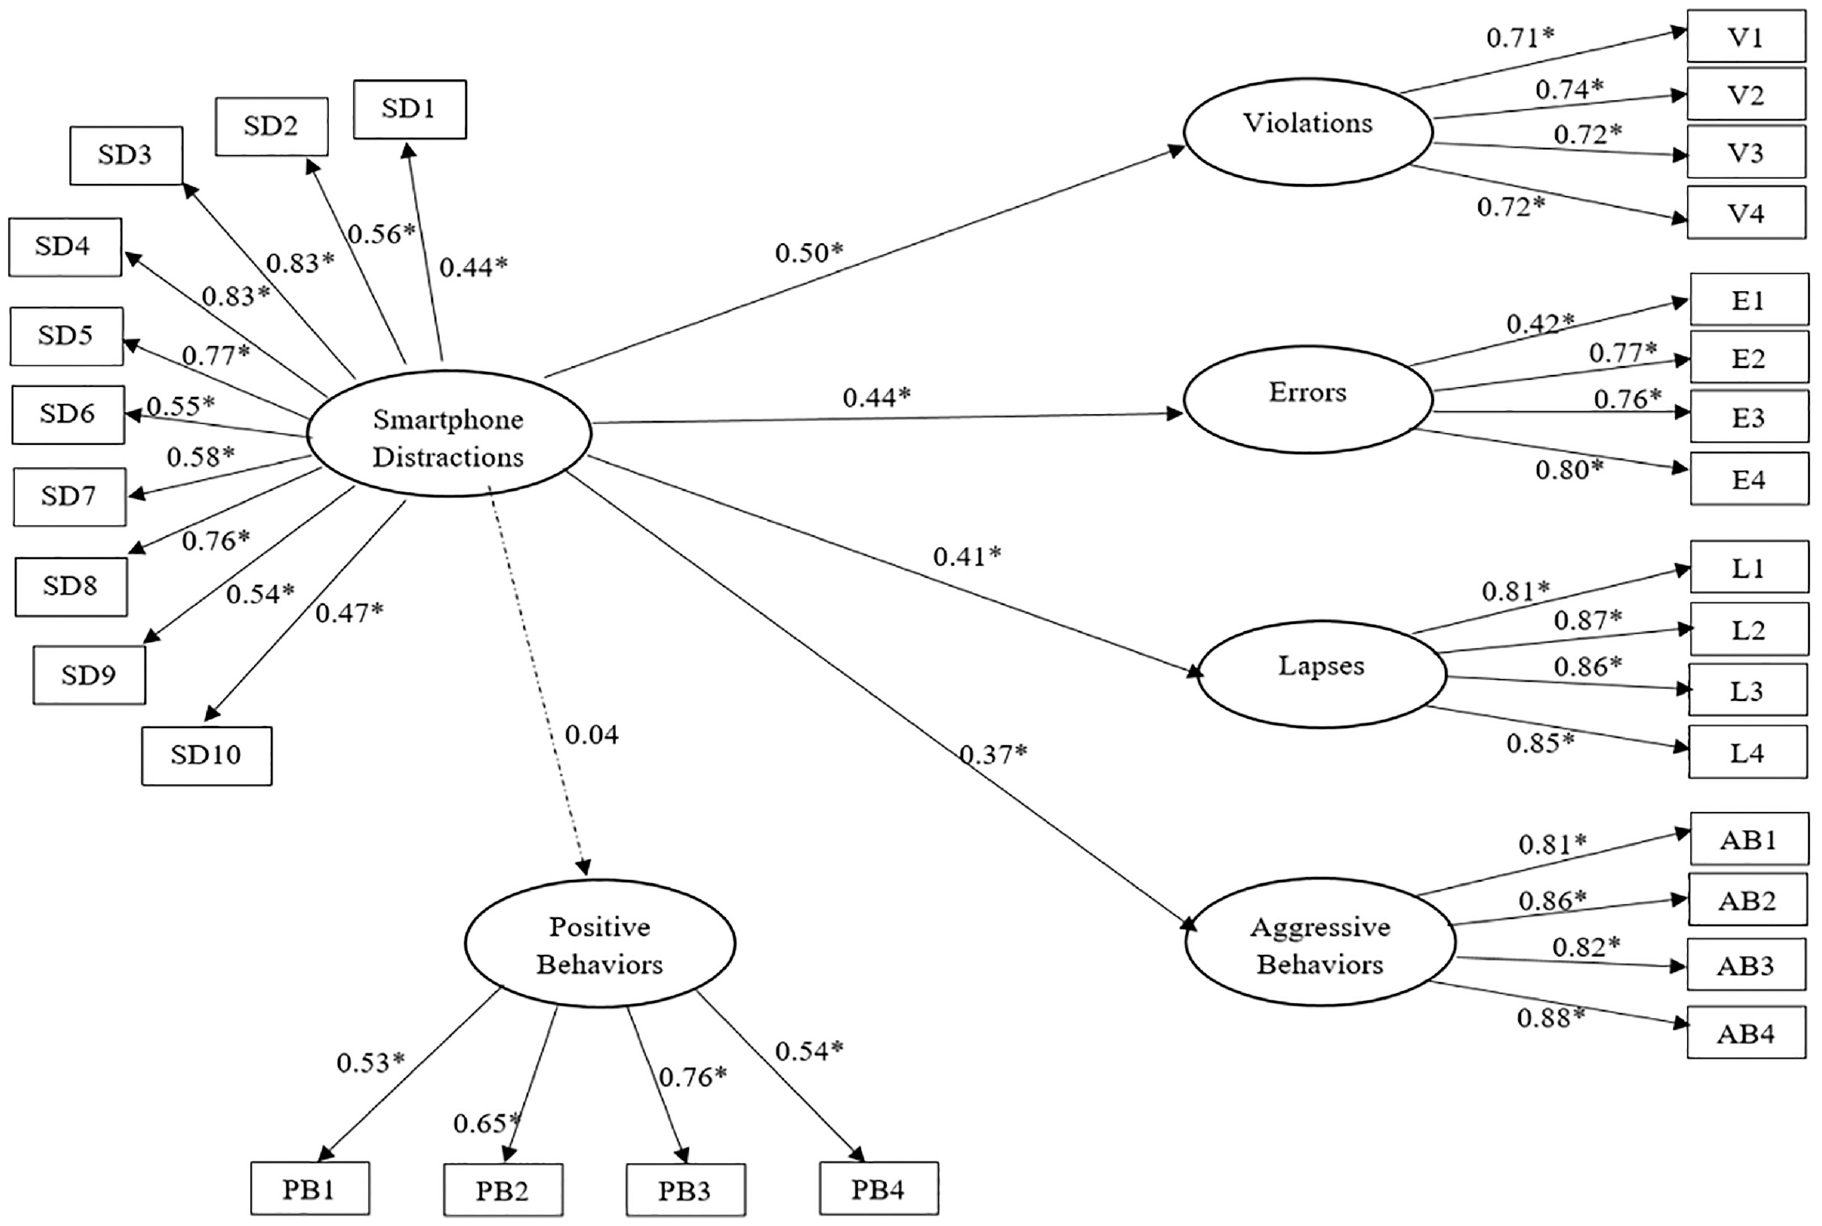
Path diagram for associations between smartphone distraction and pedestrian behavior.
The measurement model results showed that all six latent variables had significant associations with their respective observed variables (factor loading > 0.4). The highest influence on “smartphone distractions” was caused by SD3 and SD4 (factor loading of both = 0.83), indicating that the smartphone distractions were best explained by reading and writing text messages (Table 5). The measured violation items had similar effects on the latent variable “violations” (factor loadings > 0.7). Similar was the case with “lapses” and “aggressive behaviors” (factor loadings > 0.8). The latent variable “errors” was best explained by E4, which indicates running across the street in a hurry without looking (factor loadings = 0.8), and least explained by E1, that is, crossing between vehicles stopped on the roadway in traffic jams (factor loadings = 0.42). Further, the “positive behaviors” latent variable had the strongest influence of PB3, that is, walking on the right-hand side of the sidewalk so as not to bother oncoming pedestrians (factor loading = 0.76) and the lowest influence of PB1, which meant thanking a driver who stops to let the pedestrian cross (factor loading = 0.53).
The structural model results revealed that smartphone distractions had the strongest influence on pedestrian road crossing violations (factor loading = 0.50), followed by errors (factor loading = 0.44), lapses (factor loading = 0.41), and aggressive behaviors (factor loading = 0.37). Interestingly, no significant effect of smartphone distractions was found on the positive road crossing behaviors of pedestrians (Figure 1).
SEM 2: Influence of Pedestrian Characteristics on Road Crossing Behavior
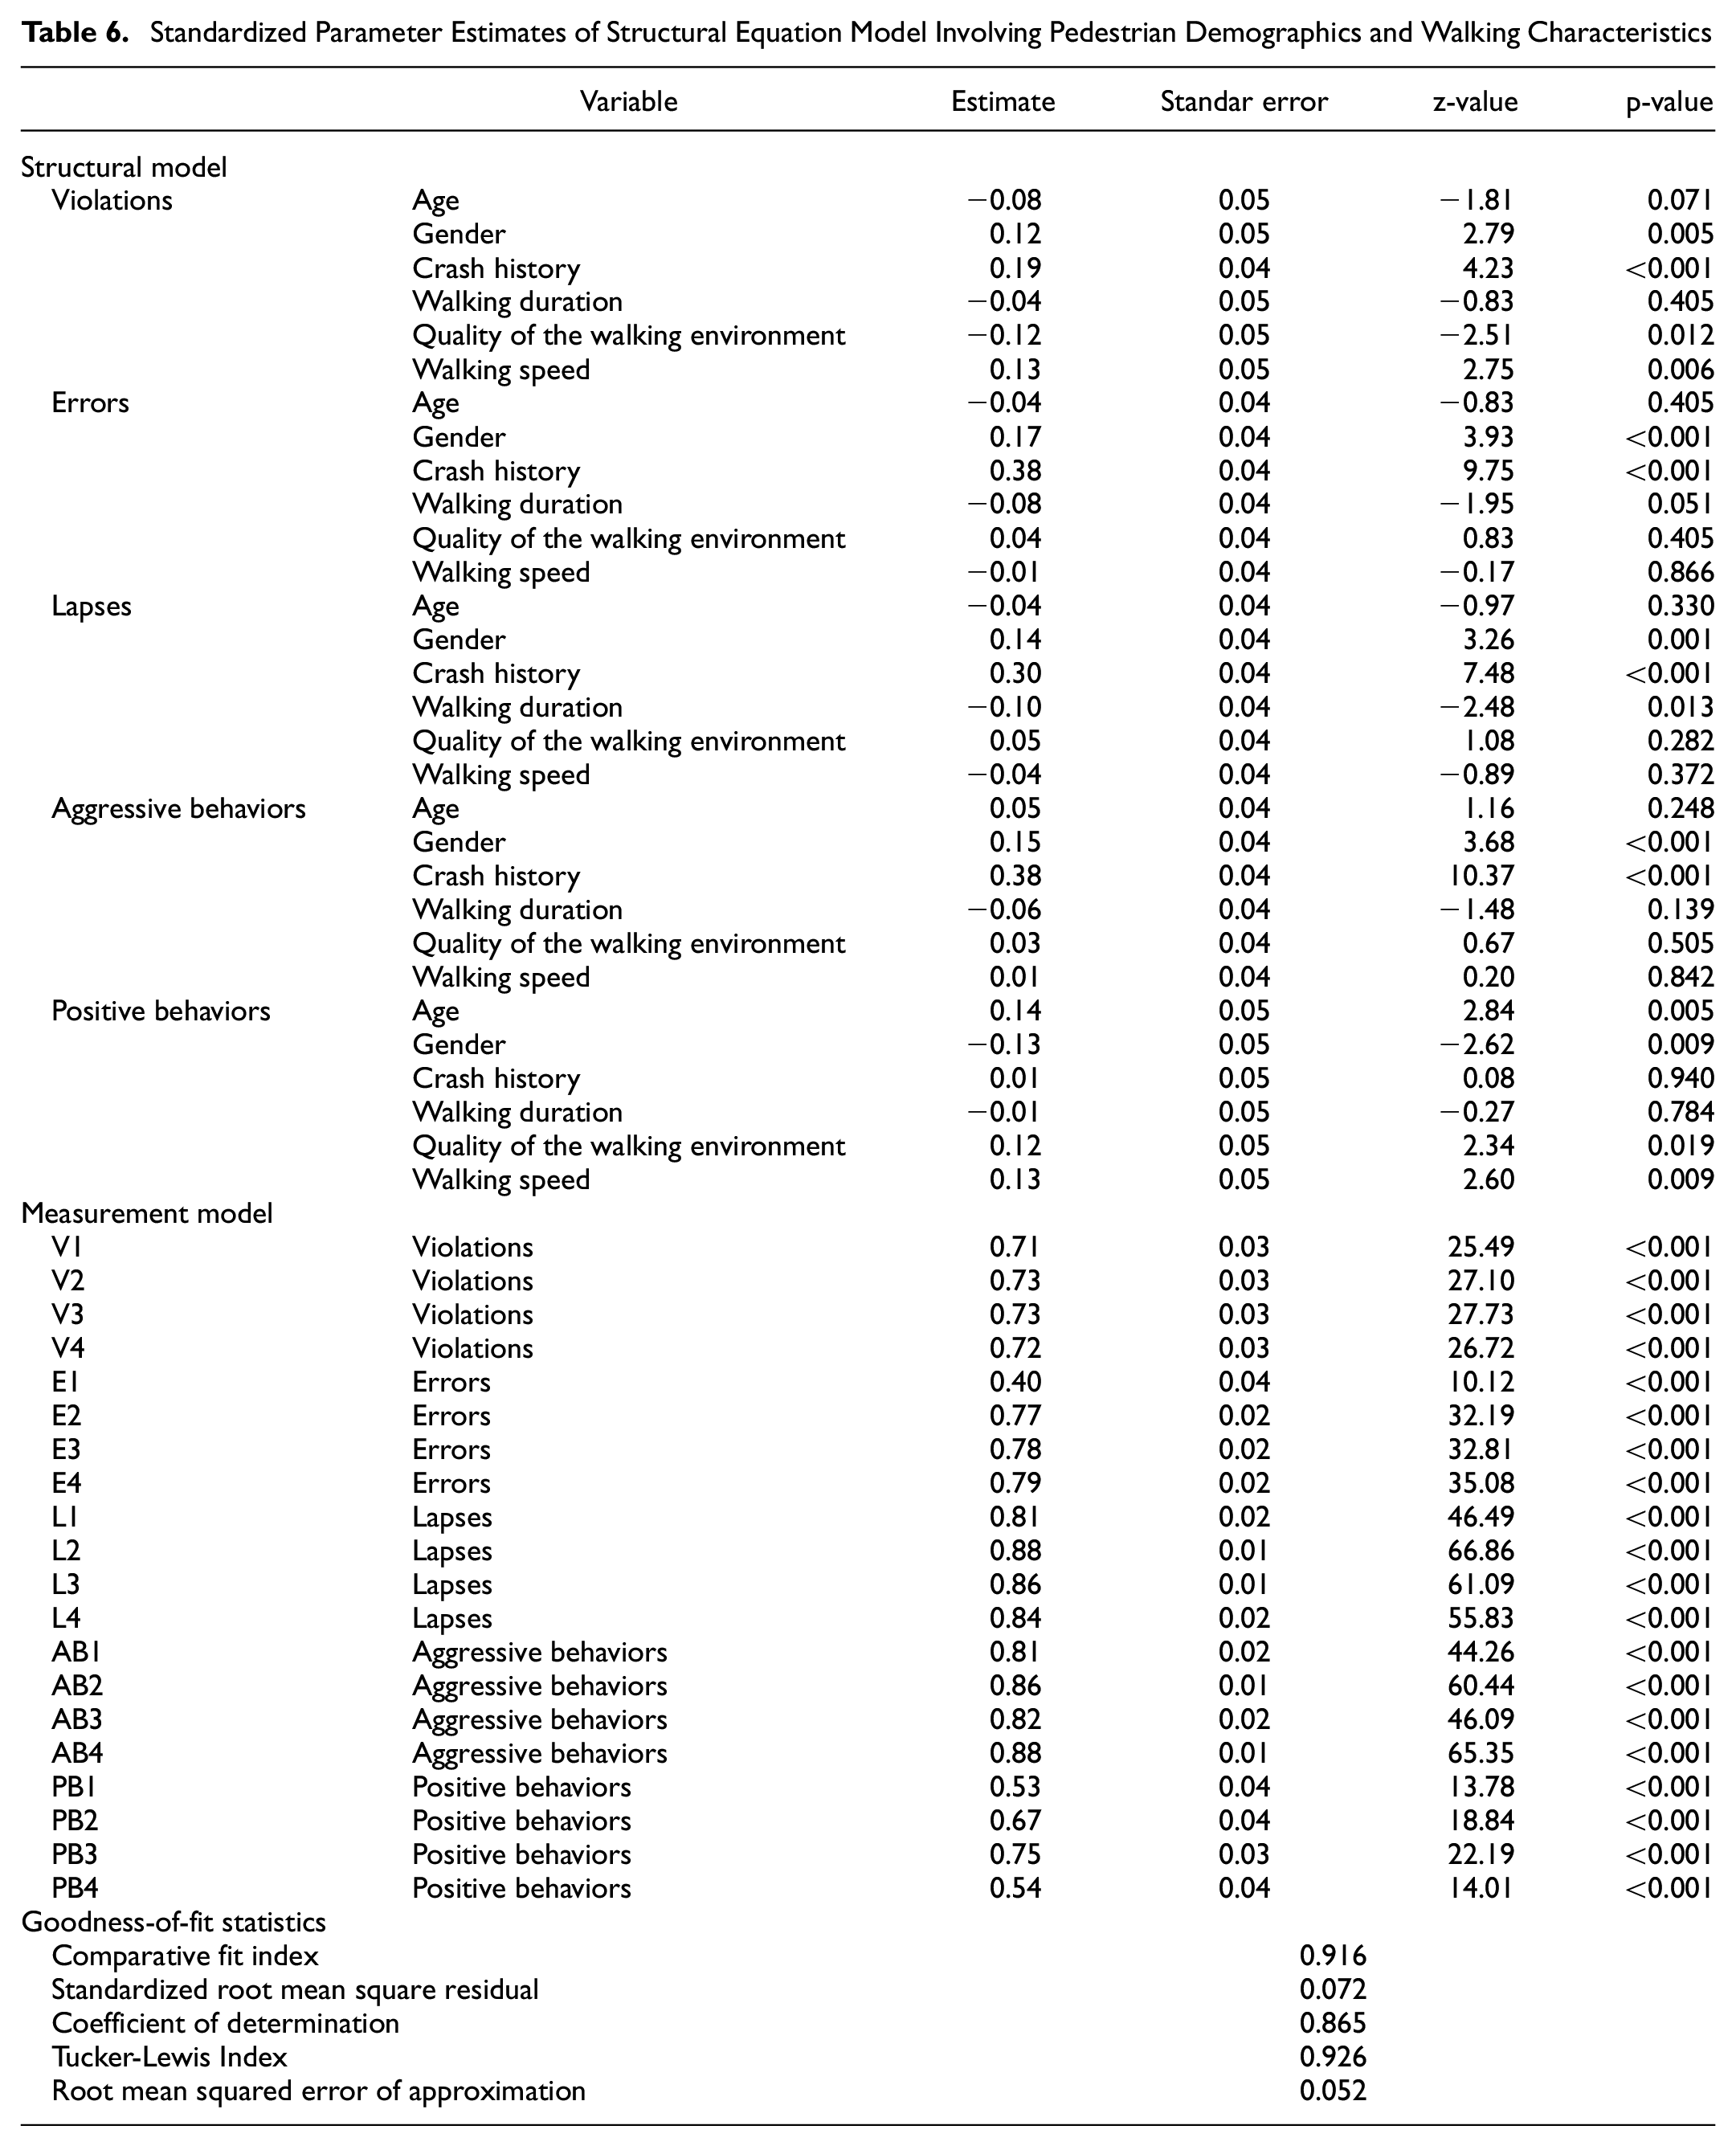
Table 6 summarizes the standardized parameter estimates of the second SEM model explaining the relationships of pedestrian demographics and walking characteristics with their road crossing behavior. The corresponding path analysis diagram is shown in Figure 2. In this model, along with the five latent variables of pedestrian behavior (violations, errors, lapses, aggressive behaviors, and positive behaviors), the six measured/observed variables of pedestrian characteristics obtained from the questionnaire (age, gender, crash history, walking duration, walking speed, and quality of walking environment) were included, as shown in Figure 2. The significant relationships between the variables are shown with full arrows, while the dotted arrows represent the non-significant associations.
Standardized Parameter Estimates of Structural Equation Model Involving Pedestrian Demographics and Walking Characteristics
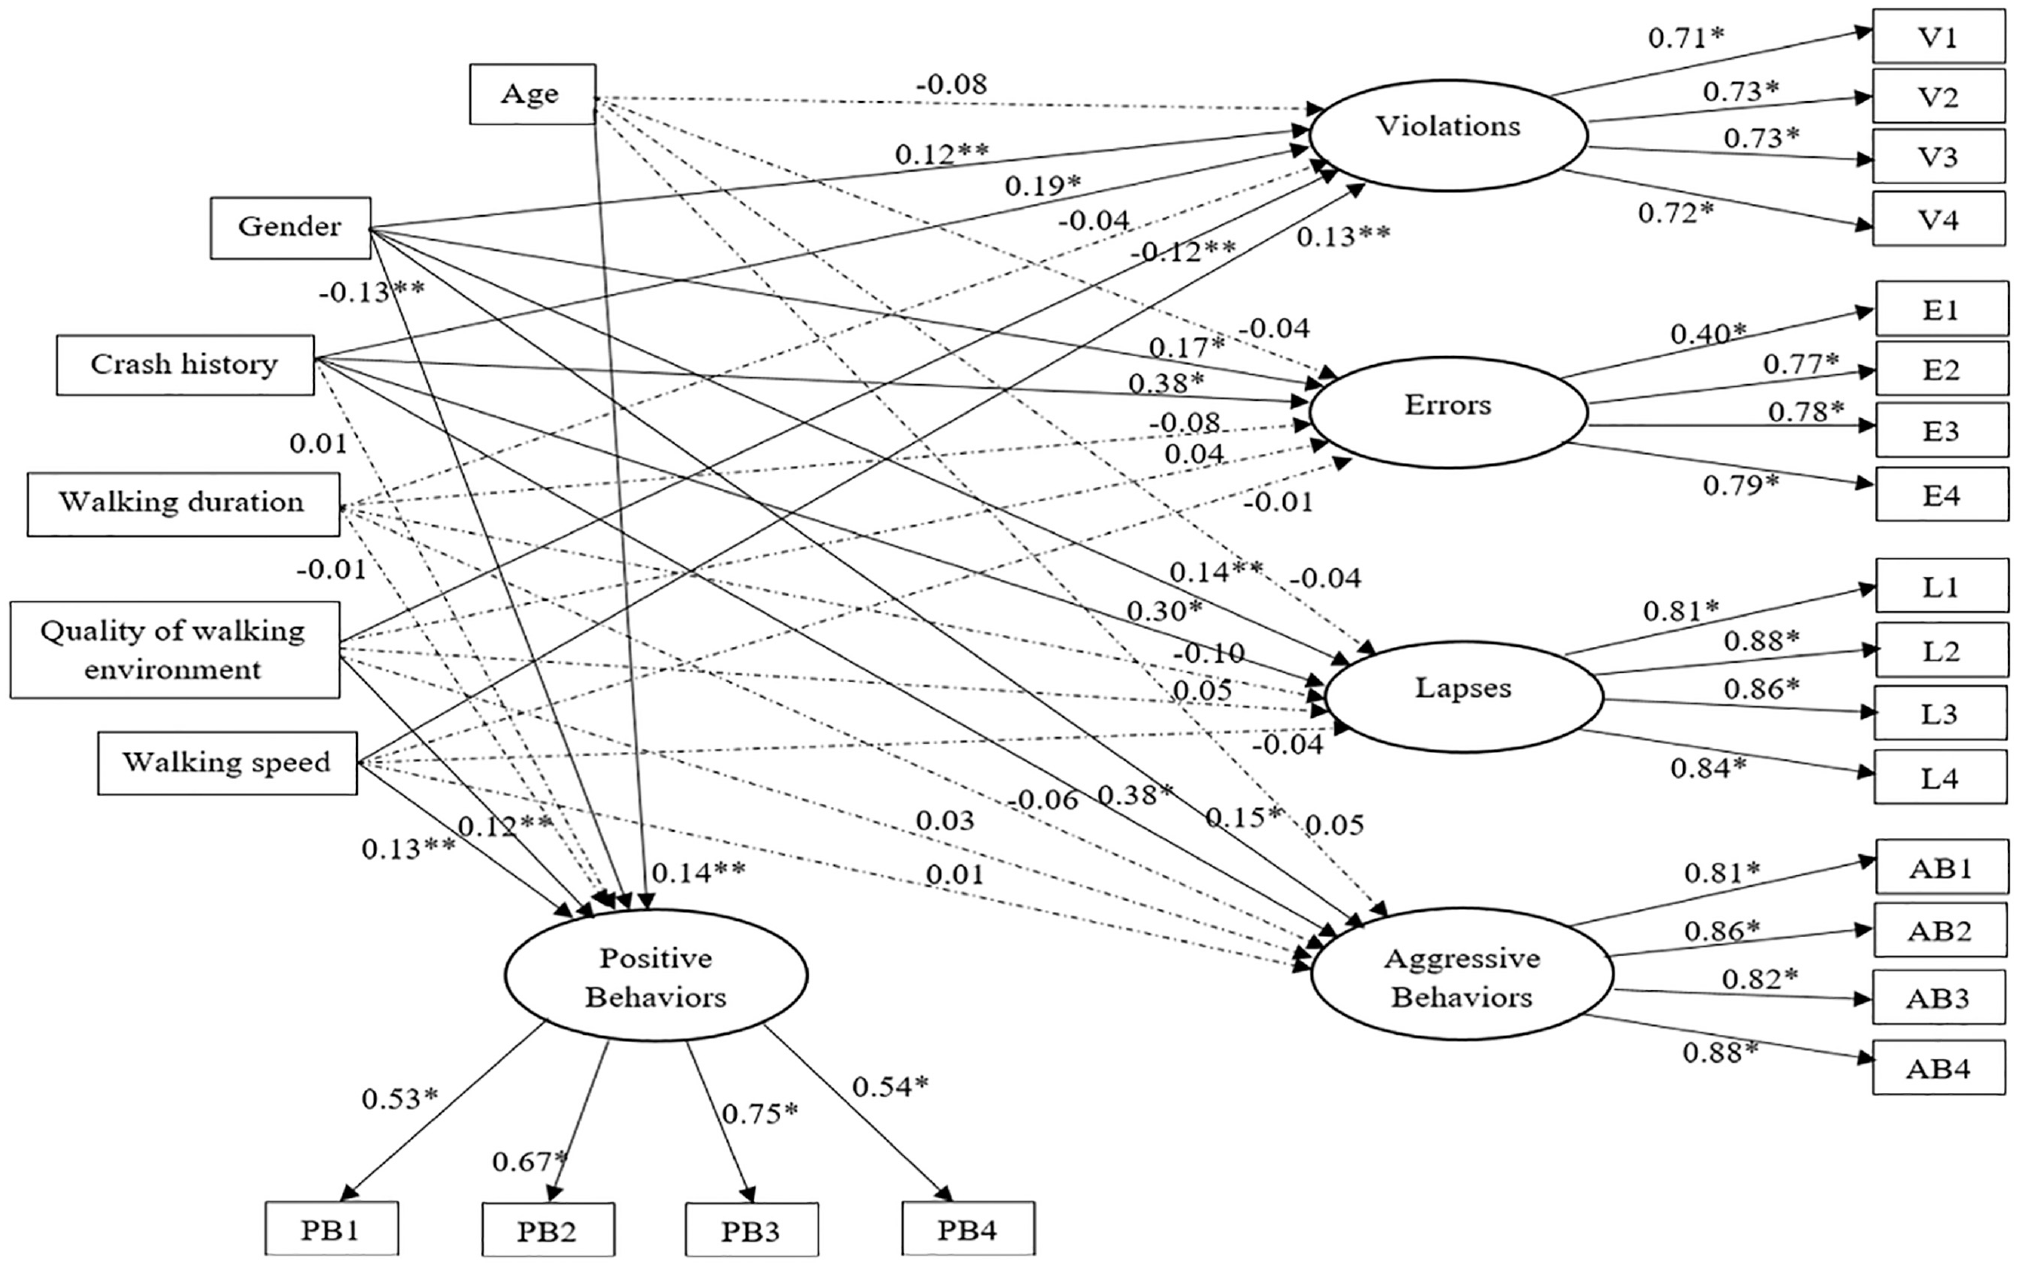
Path diagram for associations between pedestrian demographics, walking characteristics and pedestrian behavior.
Pedestrians’ gender significantly influenced all the five pedestrian behavior variables. Male pedestrians were found to be more likely to commit violations (factor loading = 0.12), errors (factor loading = 0.17), lapses (factor loading = 0.14), and aggressive behaviors (factor loading = 0.15), whereas female pedestrians showed more positive behaviors (factor loading = −0.13). Interestingly, the influence of age was significant only on positive behaviors (factor loading = 0.14), while the effect on violations, errors, lapses, and aggressive behaviors was insignificant (Figure 2). This indicates that older/mature pedestrians are more likely to show positive behavior than young pedestrians.
The quality of the walking environment had significant associations with violations (factor loading = −0.12) and positive behaviors (factor loading = 0.12). The negative association of the walking environment quality with violations signifies that the tendency to commit violations among pedestrians decreased with better quality of the walking environment. Further, crash history had significant associations with violations (factor loading = 0.19), errors (factor loading = 0.38), lapses (factor loading = 0.30), and aggressive behaviors (factor loading = 0.38). This indicates that even though the pedestrians had prior crash experiences, they still tend to perform risky road crossing behaviors. Pedestrians who walk at high speeds were found to engage in an increased number of road crossing violations (factor loading = 0.13). However, no significant influence of walking duration was observed on any of the factors of pedestrians’ road crossing behavior (Figure 2).
Discussion
Effect of Smartphone Distraction on Pedestrian Behavior
In the present study, smartphone distraction was found to have the strongest influence on violations, followed by errors, lapses, and aggressive behaviors. This finding indicates that pedestrians engaged with their smartphones are the ones with higher road crossing violations (e.g., crossing the road even when the signal is red). As the violations are intentional behaviors, the results suggest that distracted pedestrians knowingly commit violations which is critical to their safety. The safety risk can be further enhanced when both these behaviors of using smartphones and committing road crossing violations occur together. Pedestrians’ intention has been observed to be a strong predictor of their behavior ( 60 ). In a study on Chinese pedestrians, Jiang et al. ( 23 ) found that pedestrians who are more addicted/attached to their mobile phones have higher intentions of crossing roads while distracted .
Along with the intentional violations, the other form of behaviors such as errors, lapses, and aggressiveness, were also significantly affected by technological distractions, indicating that the distraction engagement not only impairs the intentional behavior of pedestrians but also their unintentional behavior. In a study on Australian pedestrians, O’Hern et al. ( 37 ) found the highest impact of technological distraction was on violations followed by errors, which is in line with the findings of the present study. Barton et al. ( 19 ) analyzed the psychological determinants of distracted road crossing behavior of pedestrians. They found that their behavioral intentions were mainly influenced by their perceptions about control during the distracted road crossing act. As road crossing is an everyday affair for pedestrians, they may feel they can easily perform the task even while distracted by their smartphones. In some pedestrian behavior studies, pedestrian attitudes have been reported to be the major factor affecting distracted road crossing behavior ( 60 ). If pedestrians have inherent positive attitudes toward distracted road crossing behavior, they are more likely to perform the act, which may further lead to significant associations with violations, errors, lapses, and aggressive behaviors. Another interesting finding of this study was that the frequency of smartphone distraction did not significantly influence the positive behaviors among pedestrians (e.g., thanking a driver who stopped their vehicle to let the pedestrian pass). However, the pedestrians reported the the highest frequencies of performing positive behaviors compared with the other behavioral aspects, which showcases the civilized nature of Indian pedestrians, similar to past research conducted on American, French, Iranian, and Serbian pedestrians ( 17 , 30 , 36 , 39 ).
Effect of Pedestrian Characteristics on Pedestrian Behavior
Age was found to be a significant influencing factor in the positive behaviors of pedestrians, indicating that older/mature pedestrians are more likely to show positive behavior than young pedestrians ( 60 ). In a study on pedestrians from LMICs, McIlroy et al. ( 29 ) reported that older people perform better than younger people when subjected to road crossing tasks. Deb et al. ( 30 ) revealed age as a significant factor influencing all five aspects of pedestrian behavior (violations, errors, lapses, aggressive and positive behaviors) among American pedestrians. With reference to Greek pedestrians, Papadimitriou et al. ( 4 ) found that younger pedestrians committed higher rates of errors and violations. However, in the present study, no significant influence of age was found on errors and violations of pedestrians. Interestingly, male pedestrians were more likely to commit violations, errors, lapses, and aggressive behaviors, whereas female pedestrians showed more positive behaviors. This shows that males tend to perform risky road crossing behaviors more than females ( 39 , 61 ). An investigation on American pedestrians by Deb et al. ( 30 ) also indicated a similar finding with respect to gender effects on pedestrian behavior. In Serbia, Antić et al. ( 35 ) found that young pedestrians committed the highest number of violations, whereas pedestrians who walk for short distances commit the highest number of lapses. Moreover, they reported female and old-aged pedestrians to show a higher rate of positive behaviors compared with other pedestrians.
Another observation of the present study was that pedestrians with fast walking speeds were more likely to engage in a higher frequency of violations. However, observational research on pedestrian behavior has demonstrated that pedestrians with slower walking speeds are more likely to end up in road violations while crossing ( 62 ). Moreover, pedestrians with a crash history were more likely to commit violations and show aggressive behaviors while crossing the road than those with no prior crash experience. This finding was in consensus with the observations of a previous study by McIlroy et al. ( 29 ), who reported that pedestrians who indulged in risky road crossing behaviors had a higher likelihood of prior crash history. However, the impact of walking duration was insignificant for all five factors of pedestrians’ road crossing behavior. Moreover, a better walking environment led to a lower frequency of pedestrian violations and better positive behaviors, which complements the past research stating that pedestrian crashes were reduced with better urban planning policies and improved built environment features ( 49 ).
Practical Implications
The study findings can aid policymakers in designing behavior-based interventions to minimize road traffic crashes involving pedestrians. Figure 3 illustrates a flowchart depicting the suggested approach to assist in developing pedestrian safety countermeasures and designing ITS-based applications to minimize the influence of smartphone distraction on road safety. In this context, the first step is to investigate the frequency of smartphone distraction among pedestrians, covering all the various types of audio/visual/manual distraction (e.g., talking, texting, listening to music, etc.) along with their demographic characteristics and walking attributes. The second step is to assess their road crossing behavior with the help of behavioral characteristics (violations, errors, lapses, aggressive and positive behaviors). The third step can be categorized into two parts: (a) quantification of the impact of frequency of smartphone distraction on pedestrian behavior, and (b) quantification of the influence of demographic and walking attributes on their behavior. In the fourth step, pedestrians for whom the impact of distraction on behavior is found to be high can be termed “highly distracted” pedestrians, and those who are critical with regard to their demographic and walking attributes can be called “highly vulnerable” pedestrians. Both these categories of pedestrians are more likely to be involved in a road crash compared with other pedestrians. After identifying the at-risk category of pedestrians, their identification characteristics can be used as inputs for ITS applications utilized in road safety mitigation and prevention. Accordingly, pedestrians can be alerted of their crash risk through advanced pedestrian warning systems such as bluetooth beacons ( 63 ), illuminated in-ground lights ( 64 ), and so forth. Simultaneously, drivers can be alerted through collision avoidance systems.
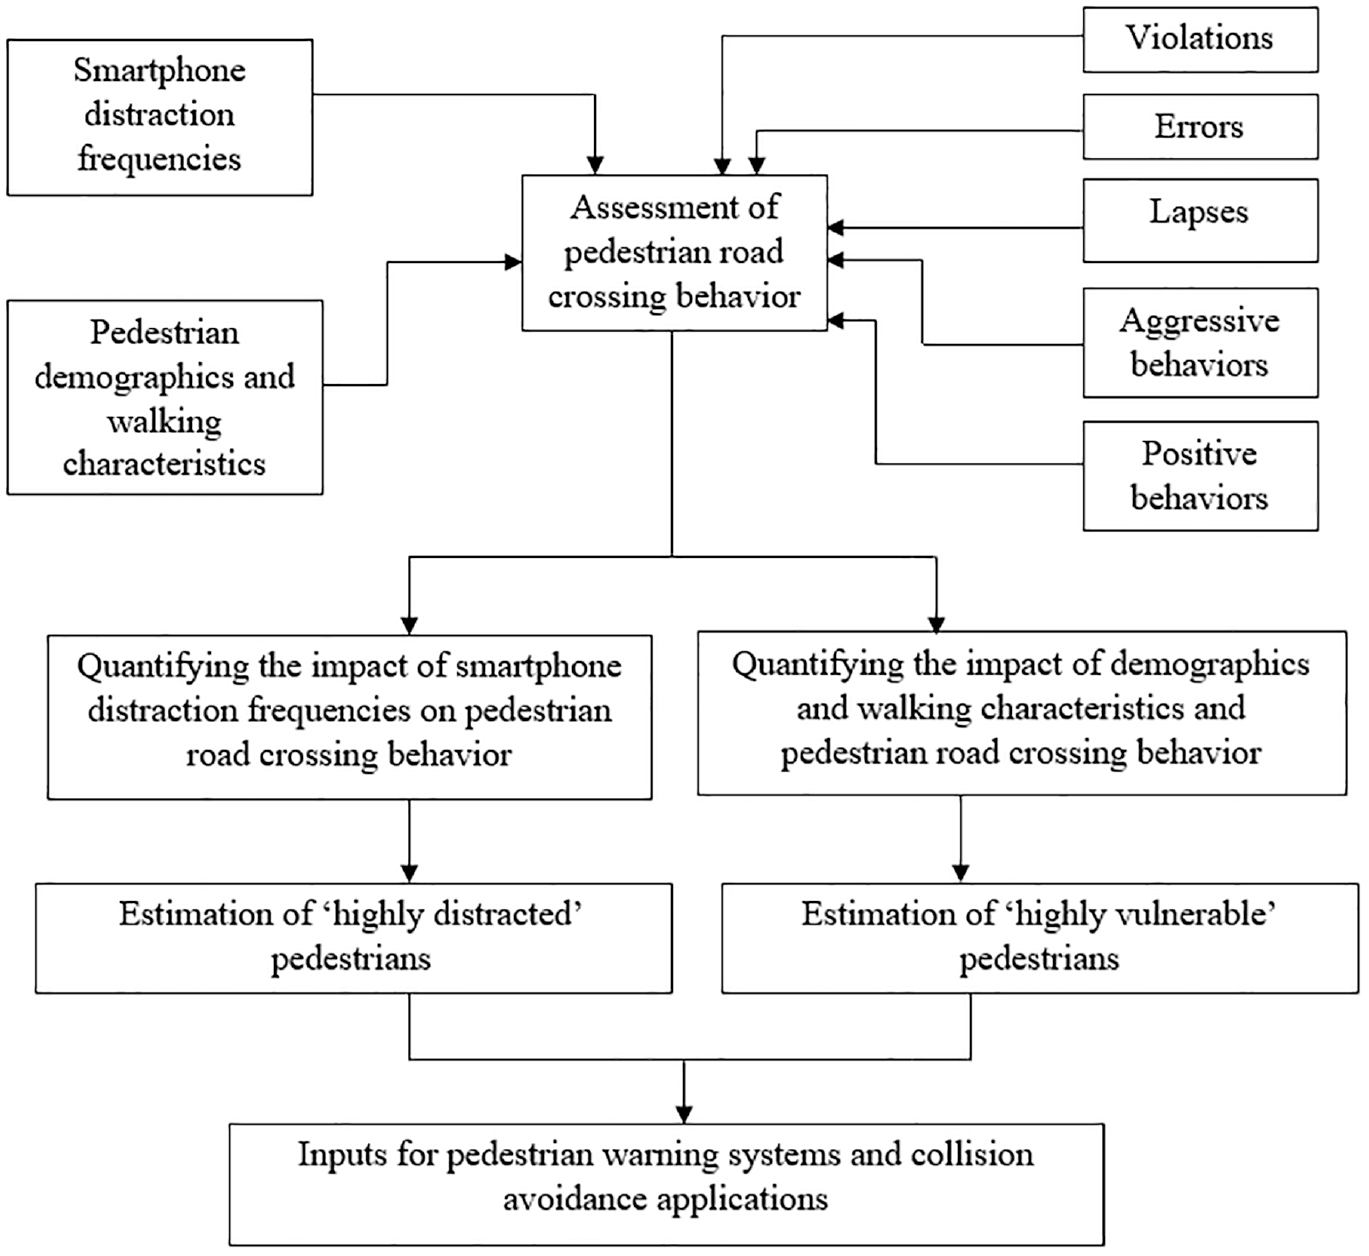
Flowchart depicting the suggested approach to aid in developing road safety countermeasures.
Limitations and Future Research
There were a few limitations observed in the present study. As the mode of conducting this study was survey-based, the responses of pedestrians about their behavior may not be exactly the same as their behavior in the field since a lot of situational traffic and environmental factors may influence their behavior. As a result of the online data collection and English as a language of the survey, people not well versed with the technology and language could not participate in the study. In this study, only adult pedestrians (18 years and above) were considered, which would have left out the child pedestrians, thereby influencing the generalizability of the study findings. Therefore, future studies should inculcate more robust sampling approaches and consider a more comprehensive demographic range of participants. Another limitation is that the area type (rural or urban) and the crosswalk type (signalized or unsignalized or midblock intersections) which the pedestrians frequently use were not enquired about in the study, which may influence their behavioral responses. Further, pedestrians’ road crossing behavior is also influenced by the type of vehicle approaching them at crosswalks. Future studies can investigate the interaction between distraction engagement and vehicle type in influencing pedestrian safety.
Conclusions
Road traffic crashes involving pedestrians are more common in developing countries than developed nations. With the increasing use of technology, smartphone distraction has emerged as a significant distracting activity observed among pedestrians ( 65 ). In recent years, research on pedestrian behavior has become quite prevalent in developed countries; however, it is scarce in LMICs. The present study is the first attempt to investigate the effect of smartphone distraction on pedestrians’ road crossing behavior in India. The study confirms the efficacy of PBQ in investigating safety-related behavior among Indian pedestrians. The strongest influence of smartphone distraction was found to be on violations, followed by errors, lapses, and aggressive behaviors. Male pedestrians were more likely to commit violations, errors, lapses, and aggressive behaviors, whereas female pedestrians showed more positive behaviors. Older pedestrians showed more positive behavior than young pedestrians. Pedestrians who walk at high speeds tend to engage in a high number of violations. Pedestrians with a crash history were more likely to commit violations and show aggressive behaviors than those with no prior crash experience. These study findings can be helpful in understanding the smartphone distraction habits of pedestrians while making road crossing decisions and in the development of pedestrian safety countermeasures.
Footnotes
Author Contributions
The authors confirm their contribution to the paper as follows: study conception and design: A. K. Yadav, N. M. Pawar, N. R. Velaga; data collection: A. K. Yadav, N. M. Pawar; analysis and interpretation of results: A. K. Yadav; draft manuscript preparation: A. K. Yadav, N. M. Pawar, N. R. Velaga. All authors reviewed the results and approved the final version of the manuscript.
Declaration of Conflicting Interests
The author(s) declared no potential conflicts of interest with respect to the research, authorship, and/or publication of this article.
Funding
The author(s) received no financial support for the research, authorship, and/or publication of this article.
Data Accessibility Statement
Data will be available on request.