



Abstract
Single-post sign supports are commonly used near to roadways. Signs can assume various configurations, yet few full-scale crash tests have been conducted to date to investigate crash performance of sign supports under current American Association of State Highway and Transportation Officials (AASHTO) Manual for Assessing Safety Hardware (MASH) criteria. This study investigated crash performance for aluminum, slip base, single-post signs under MASH criteria to determine critical configurations and develop prospective assessments of crashworthiness. These systems were supported by a four-bolt slip base and mounted on a 4 in. diameter aluminum post. Two full-scale crash tests were performed to evaluate performance of a system with a 4 × 4 ft sign panel under MASH test Nos. 3-61 and 3-62, in which the slip base activated and released the sign in a predictable manner. Safety concerns for the tested signs were raised by sign penetration through the rear window and excessive roof crush during MASH test No. 3-61. LS-DYNA models were developed and validated against test results. LS-DYNA simulations were conducted on four sign configurations to represent a range of sign panel sizes and design heights to analyze critical characteristics of single-post signs. Simulations were also conducted with increased design height to explore preliminary options for improving the performance of sign supports. Generally, signs with centroid heights at least 10 ft were deemed to have high potential of passing MASH Test Level 3 (TL-3) criteria, but it was recommended that the critical sign configuration be modified to raise the sign cluster centroid from a design height of 9 ft to 11.5 ft or greater.
Keywords
Single-post sign support systems are commonly used by many agencies for a range of commuter information purposes. The American Association of State Highway and Transportation Officials (AASHTO) Manual for Assessing Safety Hardware (MASH) 2016 currently provides guidance for evaluating breakaway sign supports, including updates from the National Cooperative Highway Research Program (NCHRP) Report No. 350, such as requiring pickup truck testing, and refined evaluation criteria ( 1 , 2 ). MASH evaluation is limited for these devices and they are implemented in a wide range of configurations.
Few full-scale crash tests have been performed to date to confirm eligibility under the MASH criteria for breakaway sign supports. The MASSH-400 Breakaway Slip Base System for Square Steel Tube Sign Supports was evaluated by the Texas A&M Transportation Institute according to MASH test Nos. 3-60, 3-61, and 3-62 ( 3 ). The test article was a dual-column sign for each test. All columns were 4 in. × 8-gauge, solid wall square steel sections on 13 in. triangular slip bases. In each test, the struck sign column broke away at the slip base location, and the sign rotated about the undamaged column. All occupant risk factors were reported to be within the preferred limits specified in MASH.
The work described in this paper is part of a broader research study sponsored by Florida DOT (FDOT), limited to focus on roadside, level terrain, MASH Test Level 3 (TL-3) applications using single aluminum pipe supports. For level terrain, FDOT standards indicate that post diameters range from 2 in. to 5 in., with specific diameters selected according to sign cluster centroid height above ground and total sign cluster area. Posts with diameters 4 in. and larger are mounted on a slip base. Two full-scale crash tests were conducted on a 4 in. diameter post sign system under MASH test Nos. 3-61 and 3-62. Results from those tests prompted further study using LS-DYNA to investigate expected MASH performance for other configurations and identify critical configurations. Baseline models of the slip base single-post sign supports were developed and validated against test results. Five sign clusters with various panel sizes and design post heights representing a wide range of sign configurations mounted on a round single post supported by a slip base were simulated and evaluated according to MASH TL-3 criteria. Additional analysis was also performed to investigate preliminary options for improving the crash performance of the modeled slip base signs.
Sign Support System Selection for Testing
Details of the sign support installation followed system details in FDOT standard plans 700-010 for single-post ground signs ( 4 ). Post diameter was determined from sign panel area and height from groundline to the centroid of the individual sign or sign cluster, as shown in Figure 1. The research investigated the performance of single-column signs on level terrain (dimension “B” in Figure 1 approximately zero) and mounted at a typical minimum height of 7 ft from bottom of sign to grade (sum of dimensions “B” and “C” in Figure 1). Given maximum sign panel sizes, the maximum centroid height, H, expected for level terrain was about 11 ft. Maximum centroid heights for a single sign panel that are greater than 11 ft would typically be on sloped ground. Tests with varying sign heights were recommended to investigate the potential interaction of the sign and vehicle after failure of the support. Based on these considerations, the research investigated posts ranging from 2 in. to 5 in., with centroid heights ranging from 8 ft to 11 ft for level terrain. Columns with outside diameters 4 in. or greater utilize a slip base with the lower stub embedded in concrete.
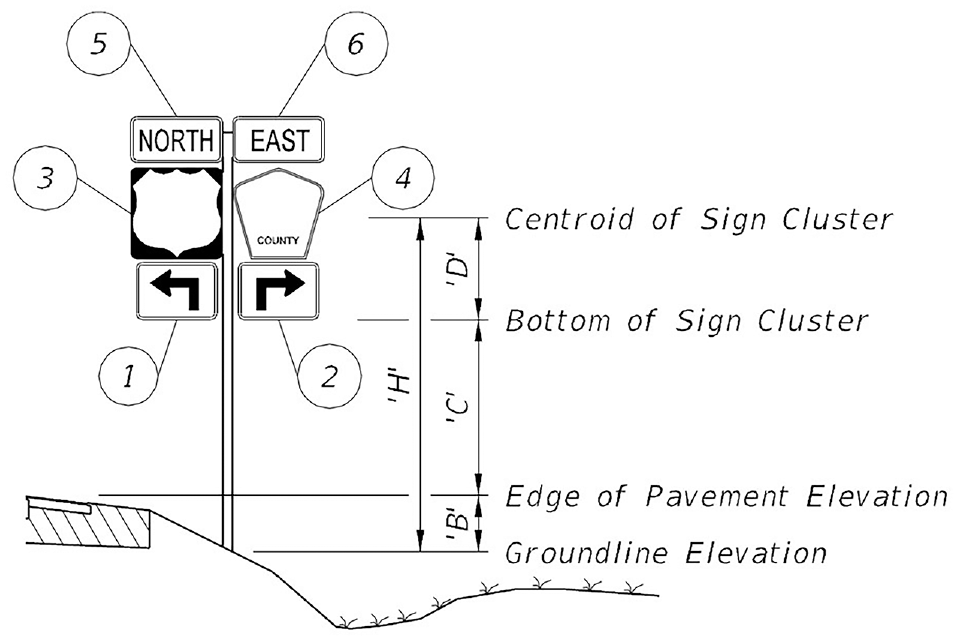
Florida Department of Transportation sign cluster centroid height ( 4 ).
The research discussed in this paper focused on crash performance of slip base single-post sign supports under MASH TL-3 criteria. A sign configuration near the lower bound combination of centroid height and area, 9 ft and 16 square feet (sf), respectively, was selected for full-scale crash testing. To provide these general parameters, the sign support system consisted of a 4 ft tall × 4 ft wide sign panel with a 7 ft clear height to the ground. In keeping with FDOT standards for the selected centroid height and area, the sign panel was mounted on a 4 in. diameter post attached to a four-bolt slip base.
Test Requirements and Evaluation Criteria
Support structures, such as slip base single-post sign supports, must satisfy impact safety standards provided in MASH 2016. According to TL-3 criteria, support structures must be subjected to three full-scale vehicle crash tests, test designation Nos. 3-60, 3-61, and 3-62, to evaluate safety performance. MASH requires consideration of critical impact angles ranging from 0° to 25° for roadside applications. Although similar signs have most often been tested at a 0° impact in the past, striking the FDOT sign systems at a 25° impact angle was believed to be most critical for this study with regard to maximizing the potential concentrated impact force from the ends of wind beams and the edge of the sign panel toward the occupant compartment. Signs that may be placed in the clear zone near an intersection may require testing at a critical angle of 90°, but were outside the scope of this study. Test designation Nos. 3-61 and 3-62 were performed in full-scale crash testing:
Test designation No. 3-62 with a 2,270 kg pickup truck, designated 2270P, striking at a speed of 100 km/h and at a critical impact angle of 25°
Test designation No. 3-61 with a 1,100 kg small car, designated 1100C, striking at a speed of 100 km/h and at a critical impact angle of 25°
Evaluation criteria for full-scale vehicle crash testing are based on three appraisal areas: 1) structural adequacy, 2) occupant risk, and 3) vehicle trajectory after collision. These evaluation criteria are defined in greater detail in MASH 2016 ( 1 ). Test designation No. 3-60 was not performed after test designation No. 3-61 failed to meet MASH 2016 criteria.
Simulation Development
Test Article Details
The test installation is shown in Figure 2. The clear height to the bottom of the sign panel was 84 in. from the ground surface, as shown in Figure 2a, and the sign panel was 48 in. tall, as shown in Figure 2b, resulting in a total height of the sign assembly of 132 in. and a sign centroid height of 108 in. The sign was set on a 2 ft diameter concrete foundation installed in MASH strong soil, with a 3 ft embedded aluminum pipe stub matching the post section. A slip plane was provided 4 in. above the ground line by a set of cast aluminum slip bases, shown in Figure 2c, composed of socket sections and base plates. The slip bases were bolted to the embedded stub and the sign post. Four 5/8 in. diameter, ASTM F3125, Grade A325, galvanized bolts were tightened to a torque of 29 ft-lb to clamp the slip plane and provide frictional shear resistance. The slip bases were unidirectional, with cutouts to allow bolts to move away from the post or stub. Each pair of two bolts aligned in the direction of traffic was constrained using an aluminum keeper plate 8 in. in length, 2 in. in width, and 28-gauge in thickness. The sign panel was 4 ft wide, 4 ft deep, and 15-gauge thick, and bolted to two horizontal wind beams. The aluminum wind beams were 46 × 1¾ × 1¾ in. Z-shapes, as shown in Figure 2d, one each located 6 in. from the top and bottom panel edges. The wind beams were attached to the post with ½ in. diameter U-bolts. The sign support system was made of ASTM International 6061-T6 aluminum with a minimum yield strength of 42.5 ksi.
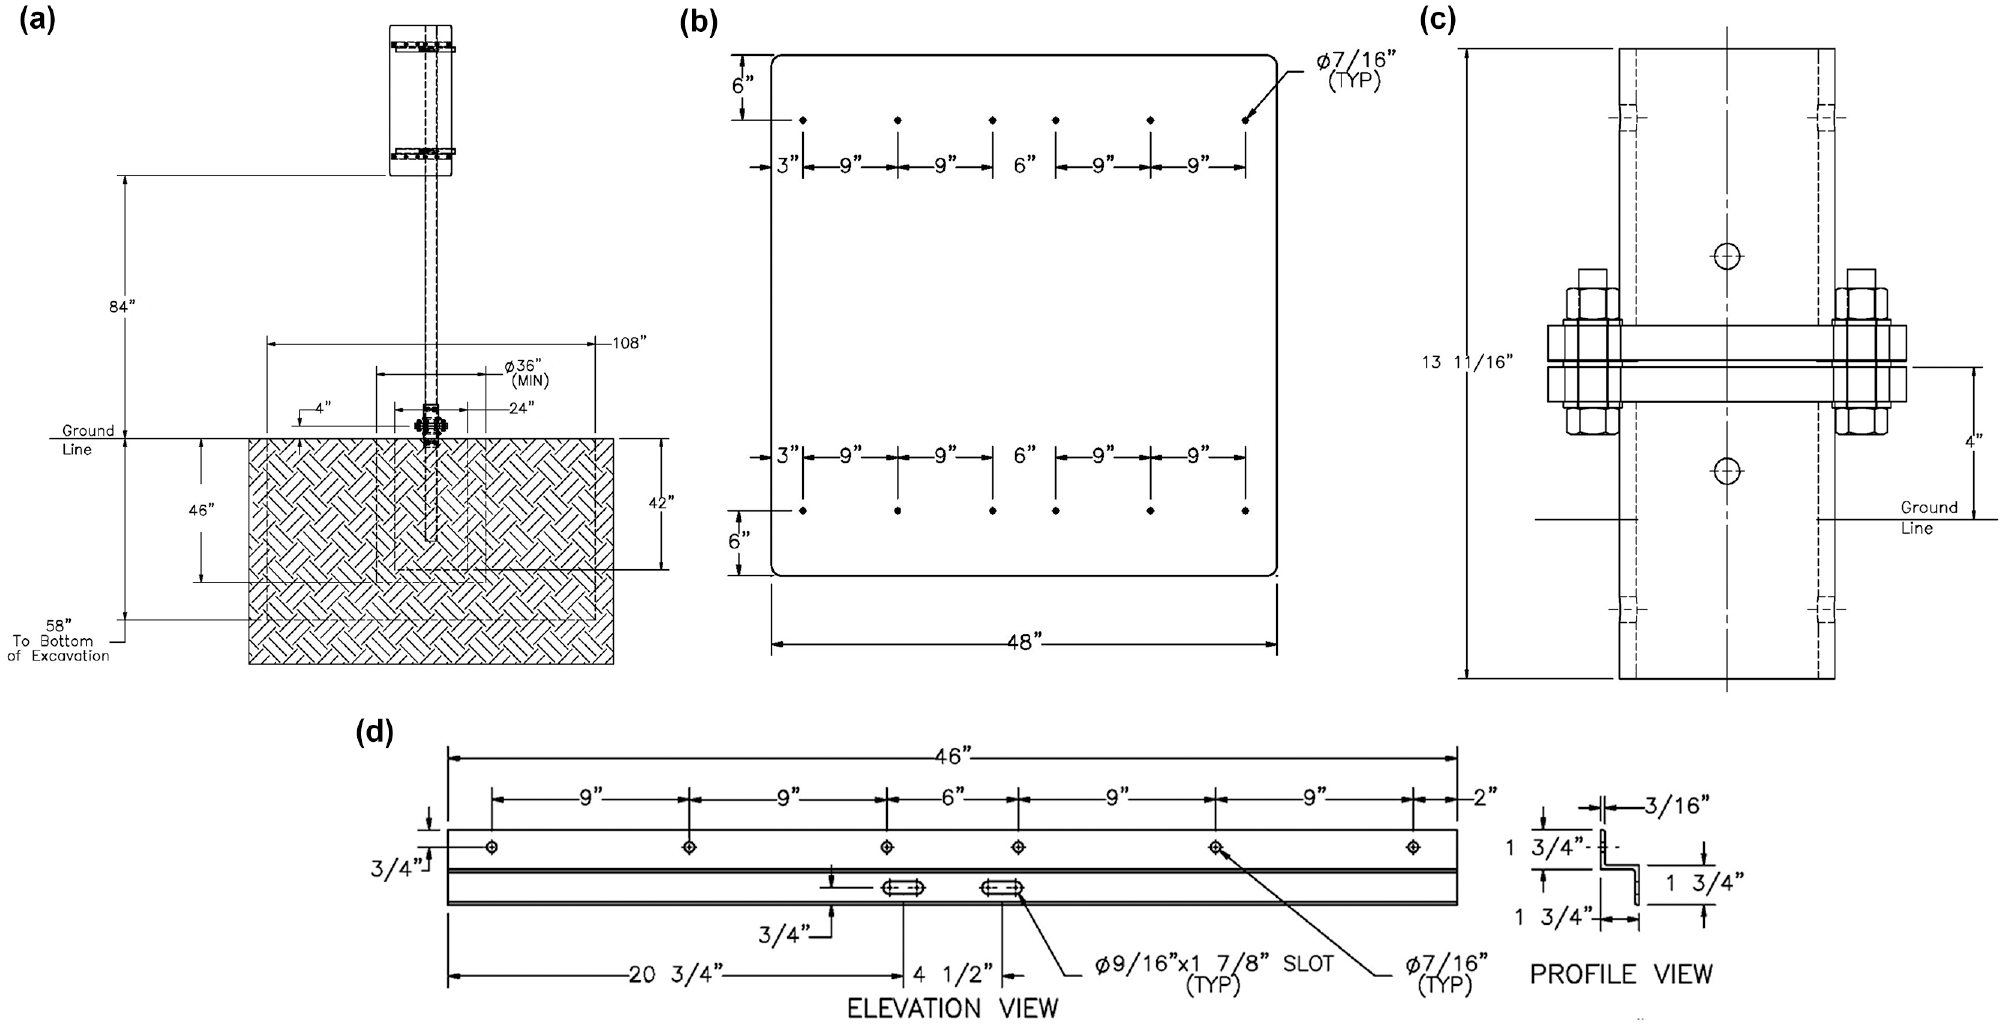
Slip base single-post sign support: (a) sign system, (b) sign panel, (c) slip base assembly, and (d) wind beam.
Simulation Model Development
Finite element models were developed using Hypermesh and LS-DYNA for the tested slip base single-post sign and validated against test results. In the model, the post, sign panel, slip base sleeves, wind beams, and keeper plates were modeled using shell elements. The material response of the post assembly was simulated with an elasto-plastic material model using MAT_PLASTIC_KINEMATIC for ASTM 6061-T6 aluminum ( 5 ). The elastic modulus of the aluminum was 10,000 ksi, and the yield strength was 42.5 ksi to match materials used in crash tests. The aluminum Poisson’s ratio was 0.33. The slip base plate and slip plane clamping steel bolts, nuts, and washers were modeled using solid elements. MAT_PIECEWISE_LINEAR_PLASTICITY was utilized as the elasto-plastic material model for the steel. The steel had an elastic modulus of 29,000 ksi and a yield strength of 92 ksi. Friction was modeled through a penalty-based contact formulation using CONTACT_AUTOMATIC_SINGLE_SURFACE ( 5 , 6 ). After a limited exploration of values confirming that results were insensitive to these parameters, the researchers selected a general friction coefficient of 0.1 and a slip base friction of 0.2, which was consistent with the published values of galvanized steel friction. Bolt preload was achieved using INITIAL_STRESS_SECTION ( 6 , 7 ). Slip base preload was selected to utilize the higher calculated value of 2.23 kips per bolt ( 8 ). The connections between the sign and wind beam and between the post and slip base sleeve were simplified and modeled as rigid constraints because of insignificant slippage and deformation observed in the crash tests. The U-bolt used for the connections of wind beams to the post was also modeled as a rigid constraint for simplicity. Test results for test Nos. FLS3-1 and FLS3-2 showed that the slip stub sleeve had negligible deformation and movement during the impact events. Thus, the slip stub sleeve was modeled using MAT_RIGID with all translations and rotations being restrained to simulate a fixed boundary condition.
Full-Scale Crash Tests and Simulation Validation
Crash Test and Simulation of Test No. FLS3-1 (MASH Test Designation No. 3-62)
In test No. FLS3-1, a 2015 Dodge Ram 1500 with a test inertial weight of 5,025 lb struck the slip base single-post sign system oriented at 25° at a speed of 63.5 mph, which satisfied requirements of test vehicle and impact conditions indicated in MASH 2016 Tables 2–5 and 4-1. Initial vehicle impact was to occur with the post centerline aligned with the right-quarter point of the vehicle, as shown in Figure 4a. During test No. FLS3-1, the slip base activated at 0.01 s. The sign post rotated and the panel and a wind beam contacted the windshield and roof at 0.082 s. Maximum vehicle roof crush was 1.5 in. The damage to the support system was relatively minor, as shown in Figure 4b, and was caused by a combination of impact with the vehicle bumper, grille, and roof, as well as later impact with the ground. The damage to the vehicle was concentrated on the right-front corner and roof where the sign contact occurred. Occupant compartment deformations were within MASH limits with no penetrations into the occupant compartment. All occupant risk values were within acceptable limits provided in MASH 2016. The test results for test No. FLS3-1 showed that the system readily activated in a predictable manner via slip base and allowed the 2270P vehicle to continue traveling without any major obstruction of windshield. Therefore, test No. FLS3-1 was determined to be acceptable according to the MASH 2016 test designation No. 3-62.
A Ram pickup truck model, originally developed by the National Crash Analysis Center (NCAC) and modified by the Midwest Roadside Safety Facility MwRSF, was used in the simulation efforts, as shown in Figure 3 ( 9 ). Graphic comparisons of tested and simulated results, as shown in Figure 4, showed that the behavior of both the vehicle and sign system in the simulation matched reasonably well with the crash test with reference to sign release, sign rotation, and contact with the pickup truck. The slip base activated as the truck struck the post. There was a slight difference in the sign rebound from the roof after 0.082 s. The simulated roof deformation was 4.8 in., which was higher than the physical test results. These differences could be a result of the lack of U-bolt rotation in the numerical model and potential differences in the roof structure of the test truck and vehicle model. Also, the damage of the simulated sign assembly matched with the test results, as shown in Figure 4b. Quantitative comparison of longitudinal change in velocity, as shown in Figure 5, indicated that the simulated and tested results were in a good agreement until the sign contacted the vehicle roof. While some differences existed between the simulation and the crash test, the baseline model provided acceptable estimates of behavior for slip base sign supports and a 2270P vehicle under MASH test designation No. 3-62 in this study, which aimed to preferably identify configurations that would not contact glass elements or vehicle roofs. In cases where roofs were contacted, actual deformations were expected to be less severe than those predicted by the models. The differences were considered throughout the analysis.

Computer models for slip base sign supports: (a) sign system, (b) simulation of test No. FLS3-1, and (c) simulation of test No. FLS3-2.

Comparison of baseline simulation and test no. FLS3-1: (a) sequential views, (b) post assembly damage, and (c) vehicle damage.
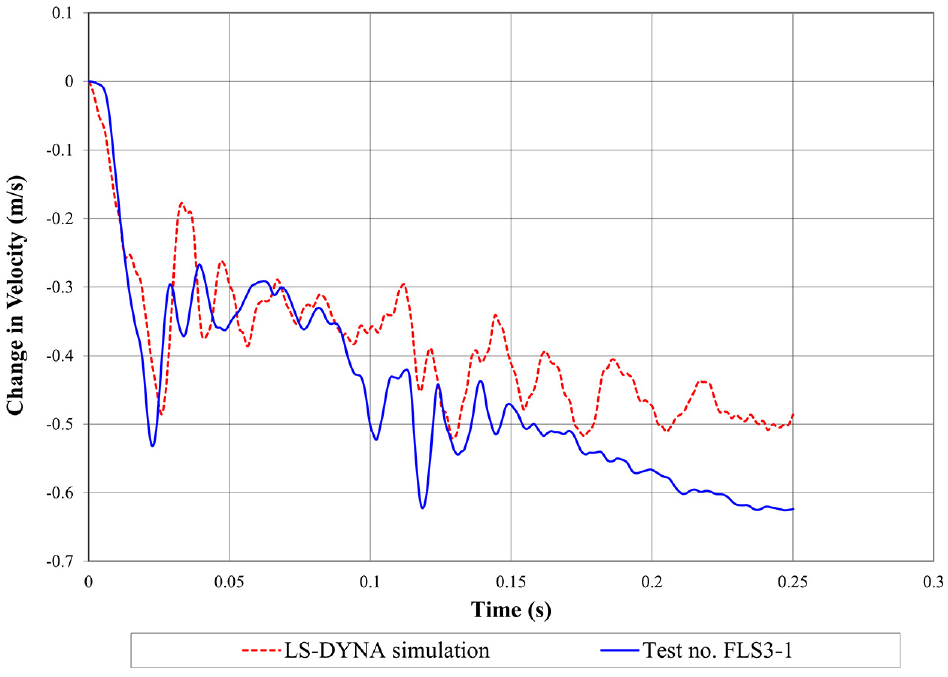
Comparison of change in velocity—test No. FLS3-1.
Crash Test and Simulation of Test No. FLS3-2 (MASH Test Designation No. 3-61)
In test No. FLS3-2, a 2011 Hyundai Accent with a test inertial weight of 2,400 lb struck the slip base single-post sign system oriented at 25° and at a speed of 61.3 mph, which satisfied requirements of test vehicle and impact conditions indicated in MASH 2016 Tables 2–5 and 4-1. Initial vehicle impact was to occur with the post centerline aligned with the right-quarter point of the vehicle, as shown in Figure 6a. During test No. FLS3-2, the slip base activated at 0.006 s. The post rotated back around a point near its center of mass and the sign panel struck the vehicle roof at the top of the rear window at 0.112 s, shattering the glass, penetrating the occupant compartment, and resulting in a maximum roof deformation of 5.75 in, as shown in Figure 6c. Occupant risk values, measured as occupant impact velocity (OIV) and occupant ridedown acceleration (ORA), were within MASH limits. However, penetration into the occupant compartment and excessive roof deformation larger than 4 in. violated MASH criteria. Thus, test No. FLS3-2 was determined to be unacceptable according to MASH safety criteria for test designation No. 3-61.
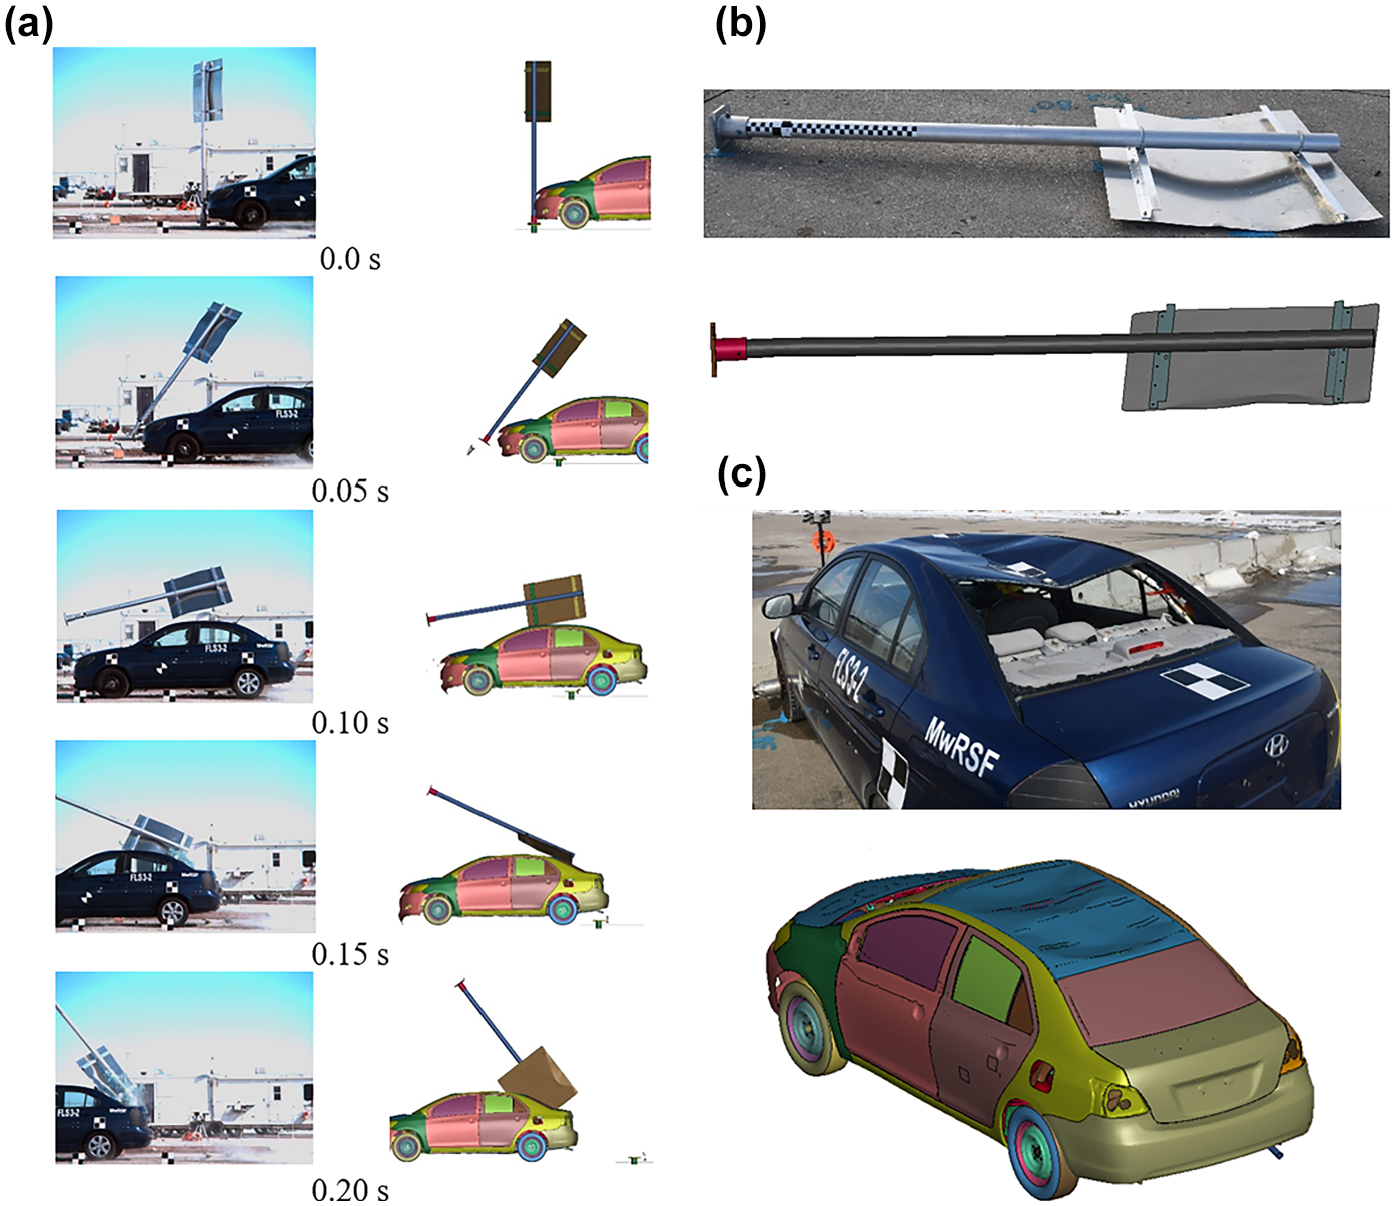
Comparison of baseline simulation and test No. FLS3-2: (a) sequential views, (b) post assembly damage, and (c) vehicle damage.
A 1100C Toyota Yaris vehicle model was used in simulations, as shown in Figure 3. The vehicle model was originally developed by NCAC and modified by MwRSF for roadside safety applications ( 9 ). Graphical comparisons of the results from both the baseline model and test No. FLS3-2, shown in Figure 6, indicated that the behavior of the vehicle and the sign system in the baseline model matched well with the crash test with regard to sign release, sign rotation, and timing and location of contact with the 1100C vehicle. The slip base released under vehicle impact, the post assembly disengaged from the base, and the sign panel contacted the vehicle roof and rear window. In the baseline simulation, the contact resulted in a maximum roof deformation of 3.1 in., which was 46% lower than the tested roof deformation. This underprediction of roof deformation was potentially a result of the inability of the modeled rear window glass to represent shattering and loss of integrity, as shown in Figure 6c, and the simplification of modeling the U-bolt connection of the wind beam to the post as rigid. Sign assembly damage in the simulation matched well with test results, with minor post deformation at the impact location. Comparison of longitudinal change in velocity, illustrated in Figure 7, shows that the simulated and tested results were in a good agreement. Based on the comparison, the developed model reasonably predicted sign panel contact timing and location along the vehicle under MASH test designation No. 3-61, but may not be able to accurately predict outcomes influenced by damage to glass elements. While some differences existed between the simulation and the crash test, model performance was deemed sufficient to evaluate sign panel contact times and locations along the 1100C vehicle for various sign configurations and to analyze preliminary retrofit options for performance improvement. The differences were considered throughout the analysis.

Comparison of change in velocity—test No. FLS3-2.
Evaluation of Sign Configuration Performance
Failure observed during the MASH test No. 3-61 prompted a detailed investigation of additional sign configurations under MASH TL-3 criteria and an exploration of potential retrofit methods to improve crash safety with minimal design modifications. The baseline models were modified to represent a range of commonly used sign clusters to evaluate safety performance under MASH TL-3 criteria. According to the system details in FDOT standard plans 700-010, four sign clusters at both the high and low end of each range with respect to design total sign area (A) and design sign cluster centroid height (H) were simulated using MASH 2016 guidelines. “Design” values differ from actual values by rounding up to the next integer value. Total sign areas are designated in units of square feet (sf). Sign panels up to 12 in. in height are backed with only one wind beam at the centerline of the sign, while sign panels with heights greater than 12 in. and less than 66 in. were backed with two wind beams. Based on these considerations, four sign cluster configurations, as shown in Figure 8, were simulated and evaluated according to the requirements of test designation Nos. 3-60, 3-61, and 3-62. For all simulations, the sign support systems were oriented at 25°, and impacts occurred with the system centerline aligned with the quarter point of the striking vehicle, similar to the baseline model.

Slip base sign supports with varied sign clusters: (a) 15 sf × 9 ft, (b) 23 sf × 10 ft, (c) 13 sf × 11 ft, and (d) 21 sf × 11 ft.
Simulation of Sign Cluster 15 sf × 9 ft
The 15 sf × 9 ft sign cluster consisted of two 21 × 15 in. upper signs and two 30 × 24 in. lower signs mounted on a 4 in. diameter single post. The slip base was unchanged from the baseline simulations. The total area of the sign cluster was 14.4 sf, corresponding to a design area of 15 sf, and the height from groundline to the centroid of the sign cluster was 8½ ft, corresponding to a design height of 9 ft. In the simulation of MASH test No. 3-60, the 1100C small vehicle struck the sign support system at a speed of 19 mph. During the simulation, the sign assembly broke away from the base and the sign panels contacted the front windshield and vehicle roof, as shown in Figure 9a. This contact resulted in maximum roof crush of 0.5 in., which was less than the MASH limit of 4 in. The maximum deformation of the front windshield was 0.2 in., as shown in Figure 10a. OIV and ORA were within the MASH limits, as listed in Table 1. The simulated front windshield did not shatter, but laminated windshield penetration may still be difficult to predict. Thus, the simulated system was deemed to have marginal potential to pass MASH 2016 safety performance criteria according to test designation No. 3-60.

Sequential views—sign cluster 15 sf × 9 ft: (a) MASH test No. 3-60, (b) MASH test No. 3-61, and (c) MASH test No. 3-62.

Vehicle damage—sign cluster 15 sf × 9 ft: (a) MASH test No. 3-60, (b) MASH test No. 3-61, and (c) MASH test No. 3-62.
Occupant Risk Values for Simulations with Various Sign Clusters and Centroid Heights

Note: sf = square feet; Long. = longitude; Lat. = latitude; MASH = Manual for Assessing Safety Hardware; na = not applicable.
In the simulation of MASH test No. 3-61, the 1100C small vehicle struck the sign system at a speed of 62 mph. During the simulation, the sign assembly released from the base and the sign assembly contacted the vehicle roof, as shown in Figure 9b. The maximum roof deformation was 4.1 in., which exceeded the limit roof deformation suggested in MASH, as shown in Figure 10b. Vehicle roll, pitch, and yaw angular displacements did not adversely influence occupant risk or cause rollover. OIV and ORA were within the MASH limits. The baseline 1100C model underpredicted roof deformation, but that instance was influenced by shattering of the rear window in the crash test which was not replicated in the baseline model. Additionally, the 1100C roof is a much older model of a different vehicle. Thus, actual roof crush may vary from simulation even if the rear window had not shattered. The system may pass MASH roof deformation criteria if overpredicted roof deformations for the baseline 2270P model are representative of inaccurate roof structures for both vehicles combined with unrealistic connection stiffness at the wind beam-to-post connections. In sum, considering the various uncertainties involved, the performance of the simulated system was deemed to have marginal potential to pass MASH 2016 safety performance criteria for test designation No. 3-61 because of roof deformation slightly exceeding 4 in.
In the simulation of MASH test No. 3-62, the pickup truck struck the sign system at a speed of 62 mph. During the simulation, the slip base activated and the sign assembly contacted the windshield, resulting in a roof crush of 7.7 in, as shown in Figures 9c and 10c. The maximum deformation of the front windshield was 7.4 in., indicating a high likelihood that the front windshield would shatter and the sign panel would penetrate into the occupant compartment. The occupant risk values and vehicle roll and pitch values were within MASH limits. Thus, based on the simulation, the system had low potential to pass MASH criteria for test designation No. 3-62 because of windshield indention greater than 3 in., roof deformation higher than 4 in., and high potential of windshield penetration.
Simulation of Sign Cluster 23 sf × 10 ft
The 23 sf × 10 ft sign cluster consisted of four 24 × 12 in. upper signs, two 30 × 24 in. middle signs, and two 21 × 15 in. lower signs mounted on a 4 in. diameter single post. The total area of the sign cluster was 22.4 sf, corresponding to a design area of 23 sf, and the height from groundline to the centroid of the sign cluster was 9.8 ft, corresponding to a design height of 10 ft. In the simulation of MASH test No. 3-60, the simulated sign assembly broke away from the base and the sign panels contacted the vehicle roof and B-pillar, as shown in Figure 11a. No deformations violated MASH criteria of occupant compartment deformation, as shown in Figure 12a. OIVs and ORAs were within MASH limits, as listed in Table 1. Thus, the performance of the simulated system had high potential to pass MASH criteria for test designation No. 3-60.
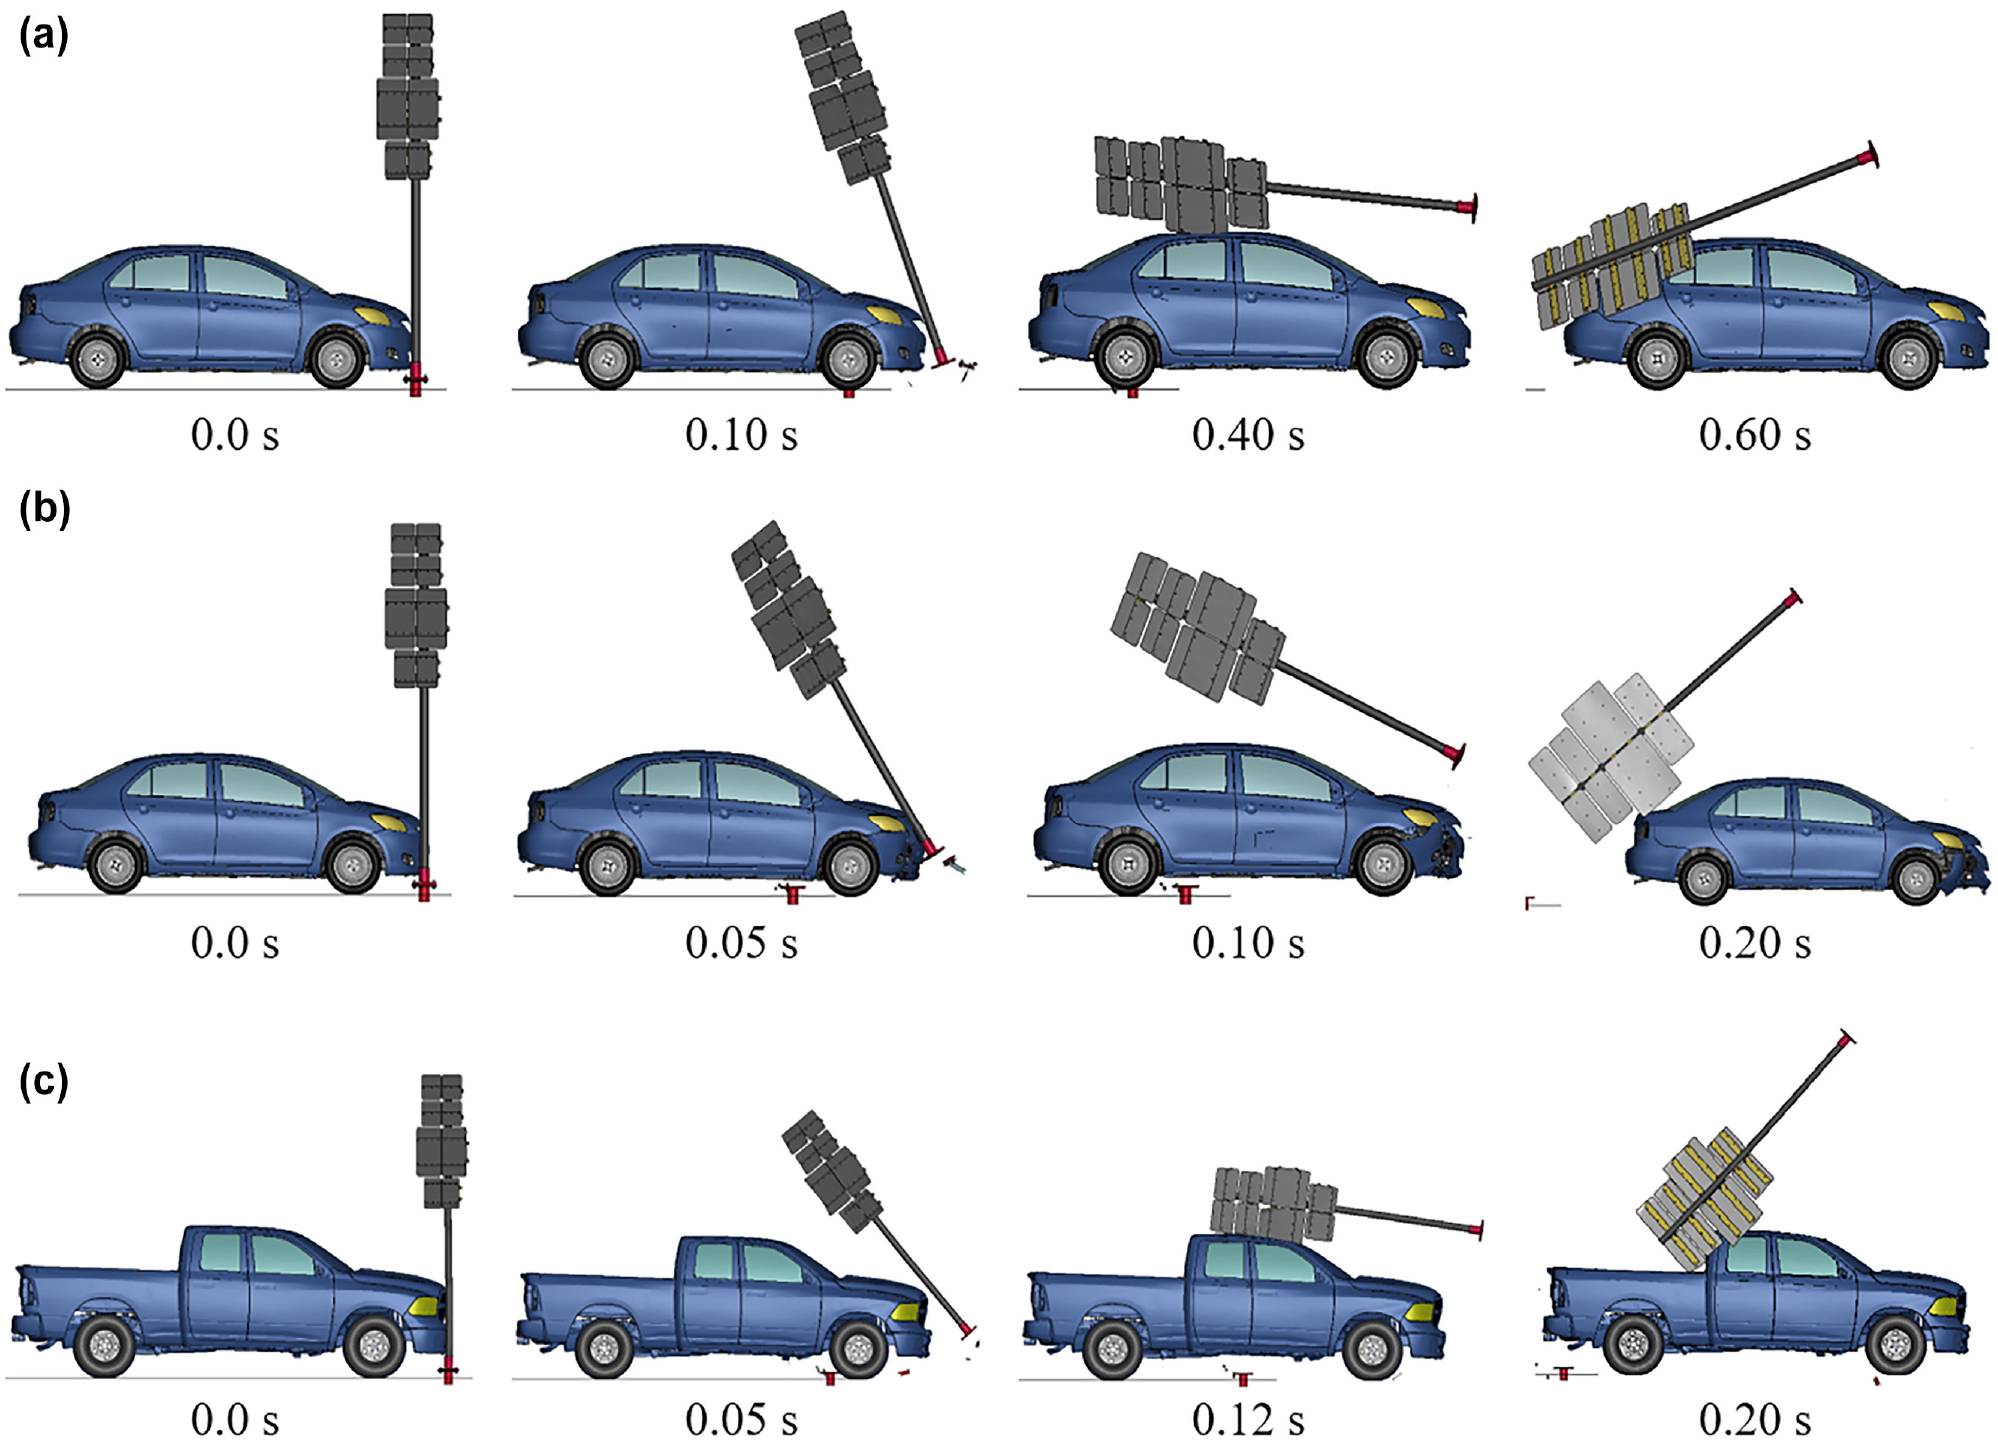
Sequential views—sign cluster 23 sf × 10 ft: (a) MASH test No. 3-60, (b) MASH test No. 3-61, and (c) MASH test No. 3-62.
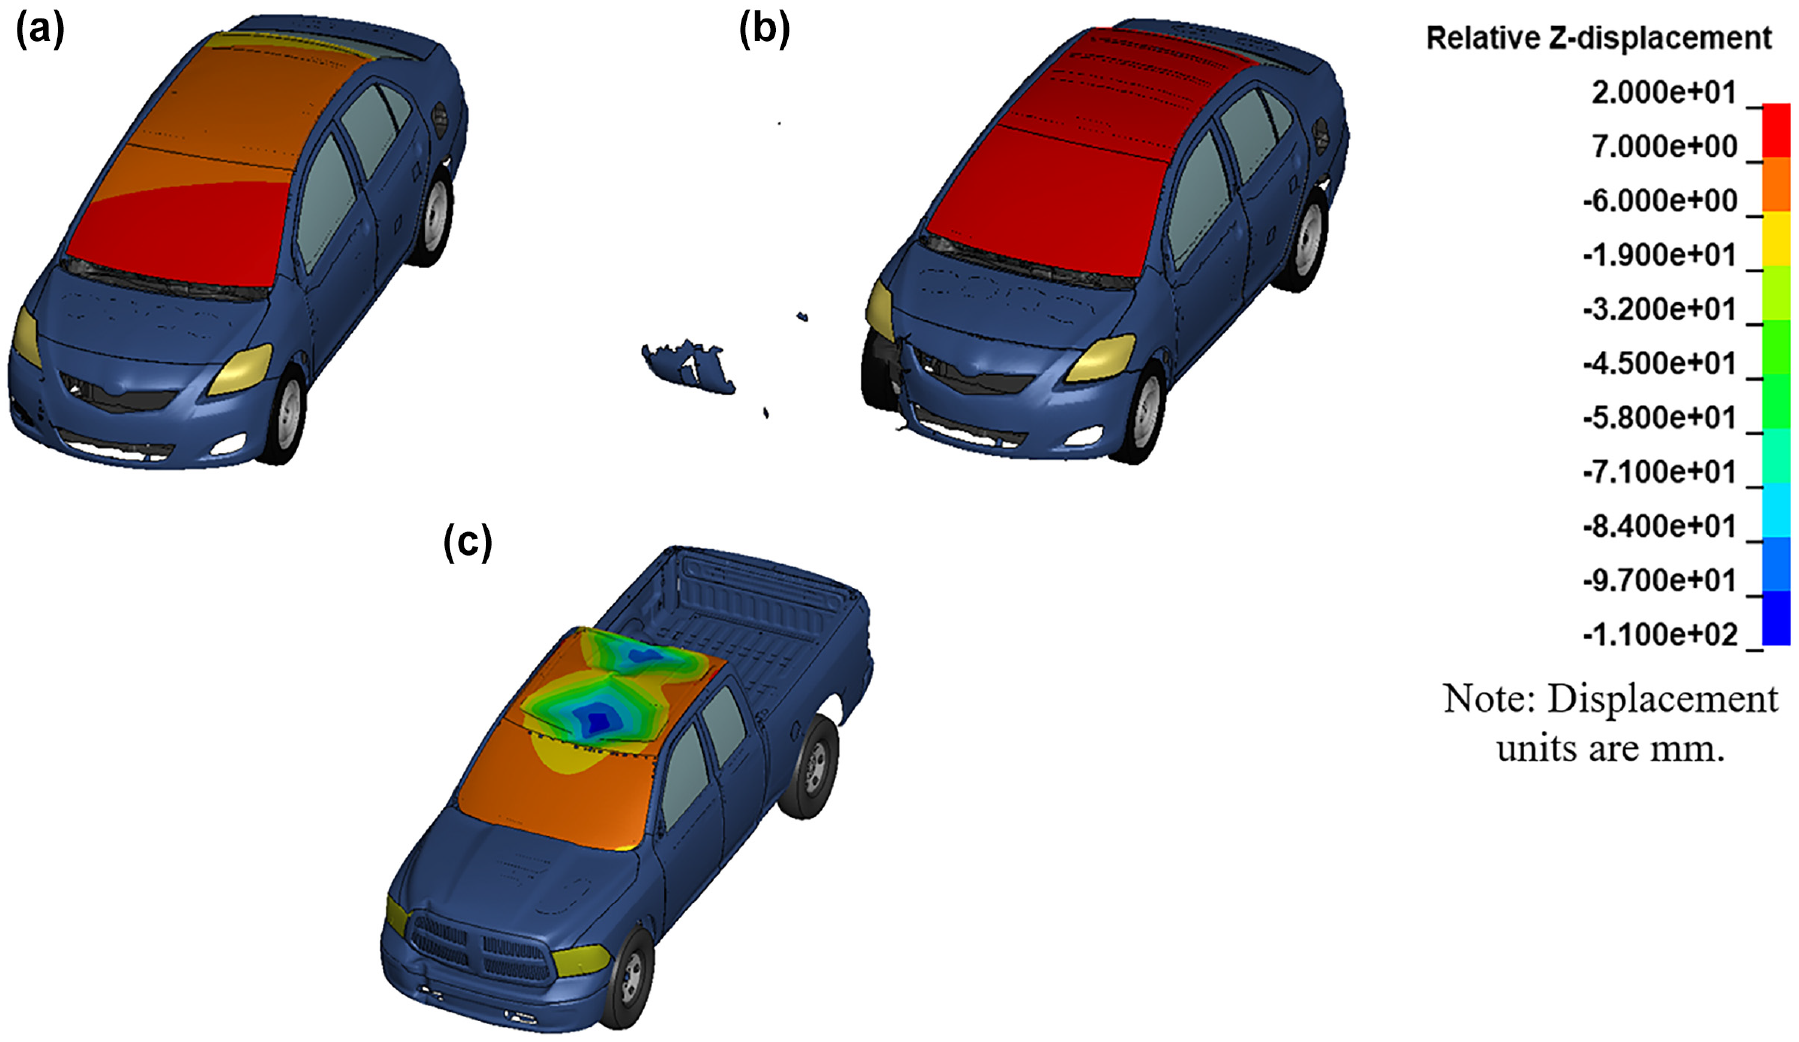
Vehicle damage—sign cluster 23 sf × 10 ft: (a) MASH test No. 3-60, (b) MASH test No. 3-61, and (c) MASH test No. 3-62.
In the simulation of MASH test No. 3-61, the sign assembly released from the base and passed over the vehicle with negligible contact, as shown in Figure 11b. No deformations violated the MASH criteria of occupant compartment deformation, as shown in Figure 12b. OIV and ORA were within MASH limits. This simulated system had high potential to pass MASH criteria for test designation No. 3-61.
In the simulation of MASH test No. 3-62, the slip base activated and the sign assembly rotated into the vehicle windshield and roof, causing roof crush of 4.1 in., as shown in Figure 11c. However, given the overpredicted roof crush in the baseline simulation, the roof deformation in the physical crash test could potentially be less than the simulated deformation, as shown in Figure 12c. The occupant risk values and vehicle roll and pitch values were within the MASH limits. Thus, the performance of the simulated system had high potential to be acceptable according to the MASH criteria for test designation No. 3-62.
Simulation of Sign Cluster 13 sf × 11 ft
The 13 sf × 11 ft sign cluster consisted of two 30 × 15 in. upper signs, a 30 × 24 in. middle sign, and a 21 × 15 in. lower sign mounted on a 4 in. diameter single post. The total area of the sign cluster was 12.4 sf, corresponding to a design area of 13 sf, and the height from groundline to the centroid of the sign cluster was 10.3 ft, corresponding to a design height of 11 ft. In the simulation of MASH test No. 3-60, the simulated sign assembly broke away from the base and the sign panels contacted the vehicle roof, as shown in Figure 13a. This contact resulted in maximum roof deformation of 1.1 in., as shown in Figure 14a, which was less than the roof deformation limit stated in MASH 2016. OIVs and ORAs were within MASH limits, as listed in Table 1. Thus, the simulated system had high potential to pass MASH criteria for test designation No. 3-60.
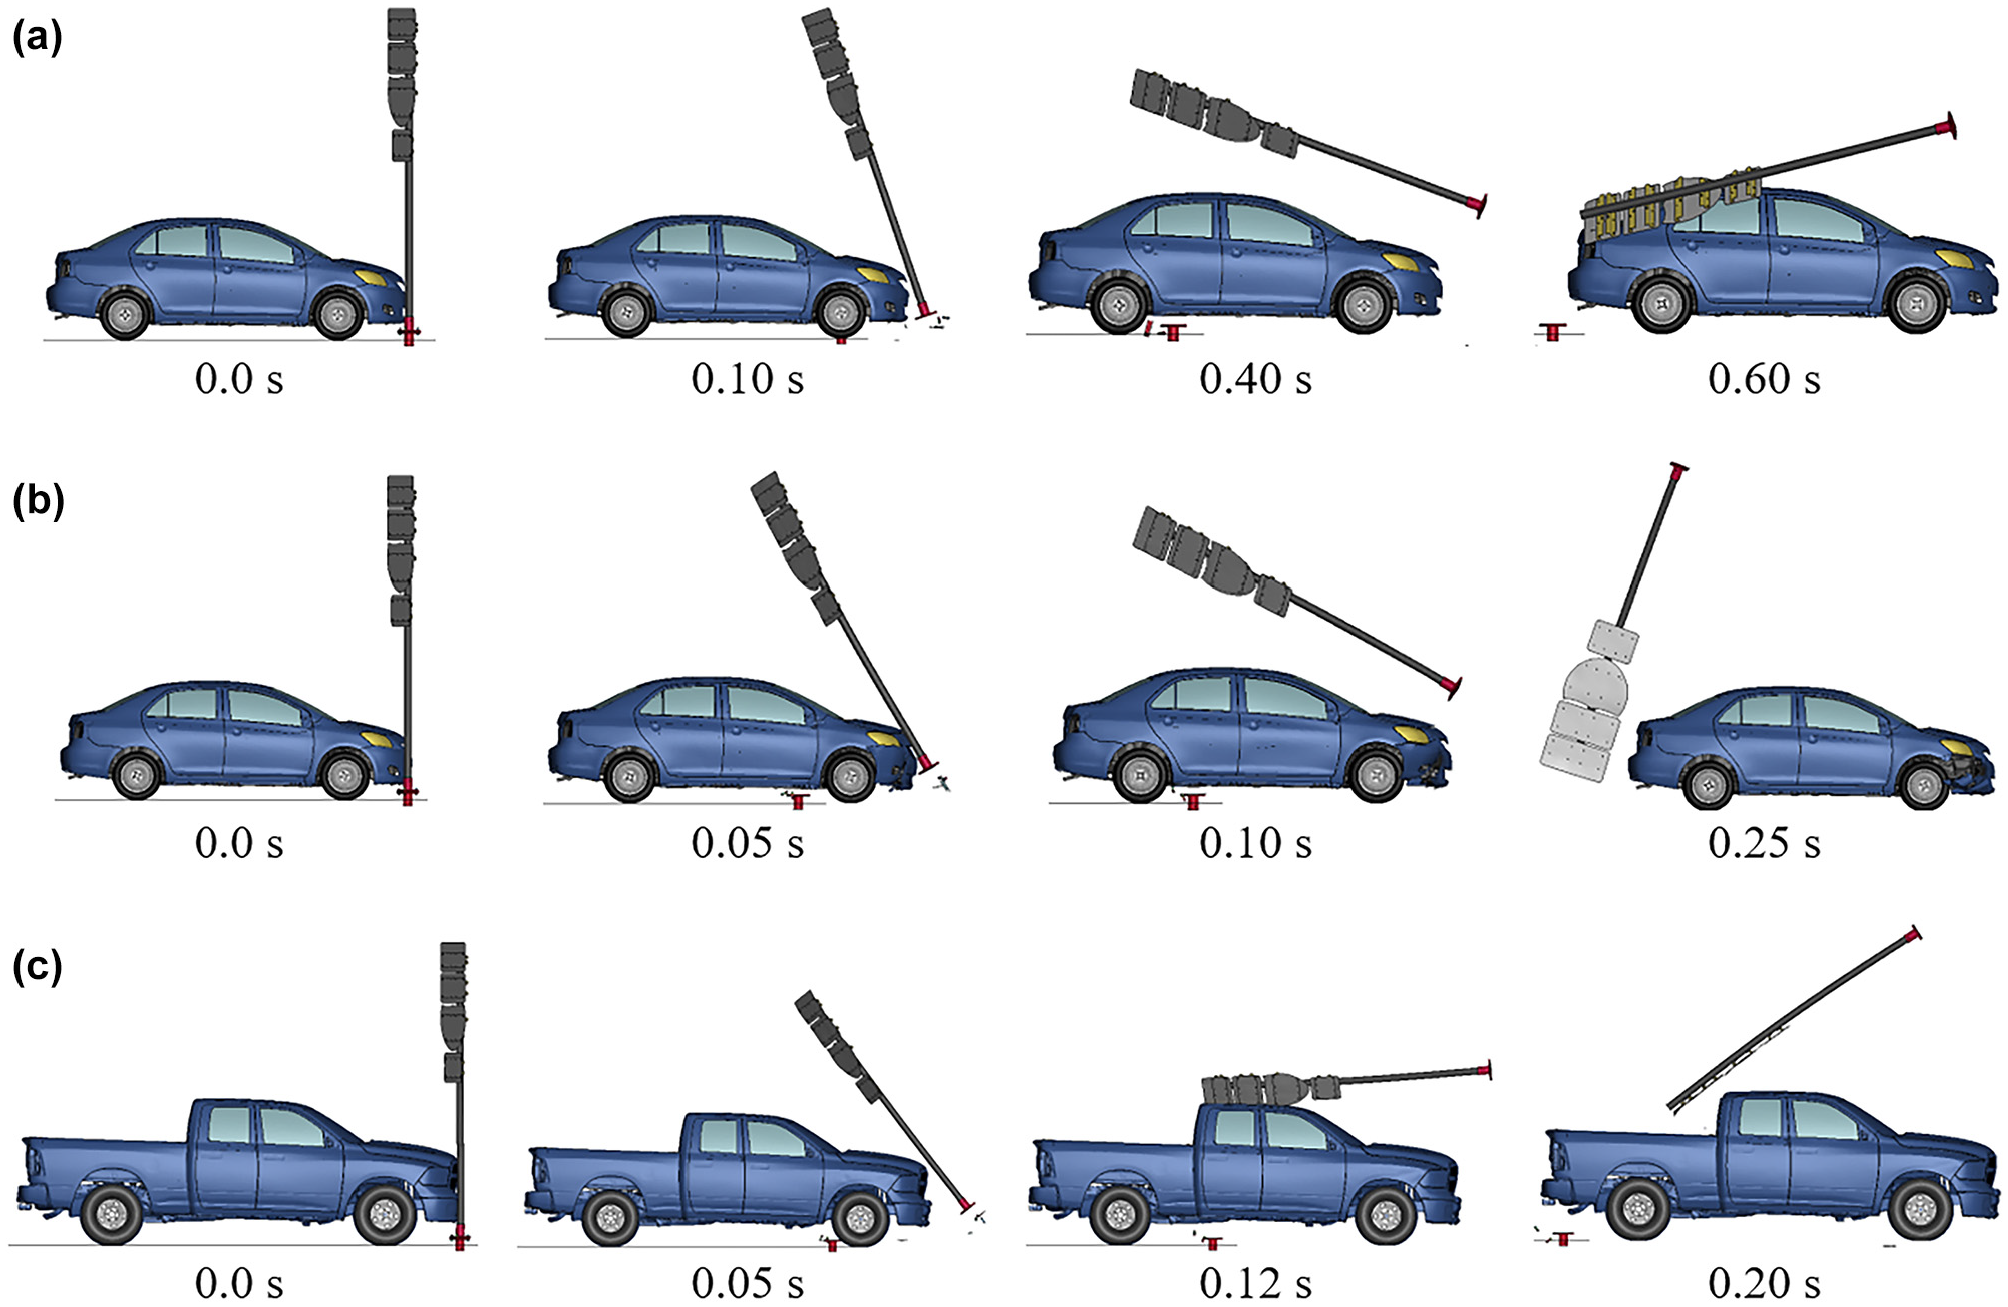
Sequential views—sign cluster 12 sf × 11 ft: (a) MASH test No. 3-60, (b) MASH test No. 3-61, and (c) MASH test No. 3-62.

Vehicle damage—sign cluster 12 sf × 11 ft: (a) MASH test No. 3-60, (b) MASH test No. 3-61, and (c) MASH test No. 3-62.
In the simulation of MASH test No. 3-61, the sign assembly released from the base and passed over the vehicle, as shown in Figure 13b. No deformations violated MASH criteria for occupant compartment deformation, as shown in Figure 14b. All performance criteria were within the MASH limits. This simulated system had high potential to pass MASH criteria for test designation No. 3-61.
In a simulation of MASH test No. 3-62, the slip base activated and the sign assembly rotated to contact the vehicle roof, causing roof crush of 5.2 in., as shown in Figure 13c. This contact violated the MASH criteria of occupant compartment deformation, as shown in Figure 14c. However, given the overpredicted roof deformation in the simulation, the roof crush in the physical test could potentially be less than 4 in. The occupant risk values and vehicle roll and pitch values were within the MASH limits. Thus, the performance of the simulated system was deemed to have marginal potential to pass MASH safety performance criteria for test designation No. 3-62.
Simulation of Sign Cluster 21 sf × 11 ft
The 21 sf × 11 ft sign cluster consisted of a 36 × 12 in. upper sign, a 48 × 48 in. middle sign, and two 21 × 15 in. lower signs mounted on a 4 in. diameter single post. The total area of the sign cluster was 20.6 sf, corresponding to a design area of 21 sf, and the height from groundline to the centroid of sign cluster was 10.1 ft, corresponding to a design height of 11 ft. In the simulation of MASH test No. 3-60, the sign assembly broke away from the base and the sign assembly contacted the vehicle roof but did not cause permanent roof deformation, as shown in Figure 15a. All occupant risk factors were within MASH limits, as listed in Table 1. Thus, the simulated system had high potential to pass MASH criteria for test designation No. 3-60.

Sequential views—sign cluster 21 sf × 11 ft: (a) MASH test No. 3-60, (b) MASH test No. 3-61, and (c) MASH test No. 3-62.
In the simulation of MASH test No. 3-61, the sign assembly released from the base and passed over the vehicle. No deformations violated MASH criteria for occupant compartment deformation, as shown in Figure 15b. Vehicle roll, pitch, and yaw angular displacements did not adversely influence occupant risk or cause rollover. OIV and ORA were within the MASH limits. Thus, the simulated system had high potential to pass MASH criteria for test designation No. 3-61.
In the simulation of MASH test No. 3-62, the slip base activated and the sign assembly rotated to contact the vehicle roof, causing roof crush of 3.9 in., as shown in Figures 15c and 16c. Thus, the roof deformation was not expected to violate MASH criteria for occupant compartment deformation. The occupant risk values and vehicle roll and pitch values were within MASH limits. Thus, the performance of the simulated system had high potential to pass MASH safety performance criteria for test designation No. 3-62.

Vehicle damage—sign cluster 21 sf × 11 ft: (a) MASH test No. 3-60, (b) MASH test No. 3-61, and (c) MASH test No. 3-62.
Discussion of Results
Simulation results for various sign clusters were reviewed to identify critical configurations. In all simulations, the slip base activated in a predictable manner. Signs generally contacted vehicle roofs and generated small occupant compartment deformations in MASH test No. 3-60 simulations. Only the sign with the lowest centroid height, which also had a relatively large width, contacted the vehicle windshield. At higher speeds in MASH test No. 3-61 simulations, taller signs tended to pass over vehicles with either no or negligible contact. Again, the sign with the lowest centroid height was the only configuration to exhibit a potentially significant sign panel contact with respect to occupant compartment risk. The outcome for the cluster 15 sf × 9 ft was less severe than the baseline for MASH test No. 3-61 because of the increased width of the simulated cluster. The lower and wider wind beams for the cluster contacted the vehicle roof, whereas the upper wind beam imparted a concentrated impact at the top of the rear window in the crash test. For the taller 2270P vehicle in MASH test No. 3-62, taller signs did not sail over the vehicle as was predicted for the 1100C MASH 3-61 test. Taller signs struck the roof, but generally caused roof deformations similar to the baseline model. Because the deformations were similar for most cluster configurations and the baseline model, and the baseline model had significantly overpredicted roof deformation in comparison with crash test results, most of the considered sign clusters are expected to be crashworthy. However, again, the configuration with the lowest centroid height struck the windshield and was deemed to pose a high risk of unacceptable windshield deformation and potentially occupant compartment penetration. Accordingly, the sign cluster with the lowest centroid height—a design height of 9 ft, with a design sign area of 15 sf—was selected as the critical configuration. In consideration of the general trends noted above, increasing the sign clear height to the ground and/or increasing the height to the center of mass were selected for further investigation as potential retrofit options.
Performance Improvement through Increased Height
Parametric studies were conducted to investigate the influence of increasing sign cluster clear height to the ground on crash performance. Ideally, sign panels will not contact vehicles, although roof impacts may be acceptable if resulting deformations are within MASH limits and the sign panel does not contact the vehicle windshield or rear window. All simulations were conducted according to MASH test designation Nos. 3-61 and 3-62 with the sign support system oriented at 25° so that wind beams, if striking, will do so near the vehicle centerline, similar to the baseline model. The impacts occurred with the system centerline aligned with the quarter point of the striking vehicle.
The critical sign configuration identified previously had a sign cluster centroid height of 8.5 ft. Increased-height sign system models raised clear heights from the ground line in 1 ft increments so that sign cluster centroids increased to 9.5 ft, 10.5 ft, and 11.5 ft. In the simulations of MASH test No. 3-61, vehicle angular displacements, OIV, and ORA were anticipated to be within the MASH limits and were not calculated because of small changes in velocity. Figure 17 shows sequential views under MASH test No. 3-61 from the increased-height analyses. Maximum roof deformations of 4.1 in., 3.9 in., 0 in., and 0 in. were measured for the system model with centroid heights of 8.5 ft, 9.5 ft, 10.5 ft, and 11.5 ft, respectively. Wind beams were predicted to strike near the top of the rear window when the centroid height is raised to 9.5 ft. Although the roof deformation is nominally predicted to satisfy MASH limits for this case, the potential for the wind beams to contact and shatter the rear window, similar to the behavior observed in the crash test, suggests that this configuration does not have a high probability of acceptable performance in a crash test. Similarly, when the centroid height is raised to 10.5 ft, the wind beams are likely to contact the rear window and this configuration is also regarded as not having a high probability of acceptable performance in a crash test, despite a 0 in. roof deformation. Because the configuration with a centroid height raised to 11.5 ft is expected to avoid contact between the sign panel and vehicle, this is the only case among those investigated that is deemed likely to be acceptable according to MASH criteria for test designation No. 3-61.
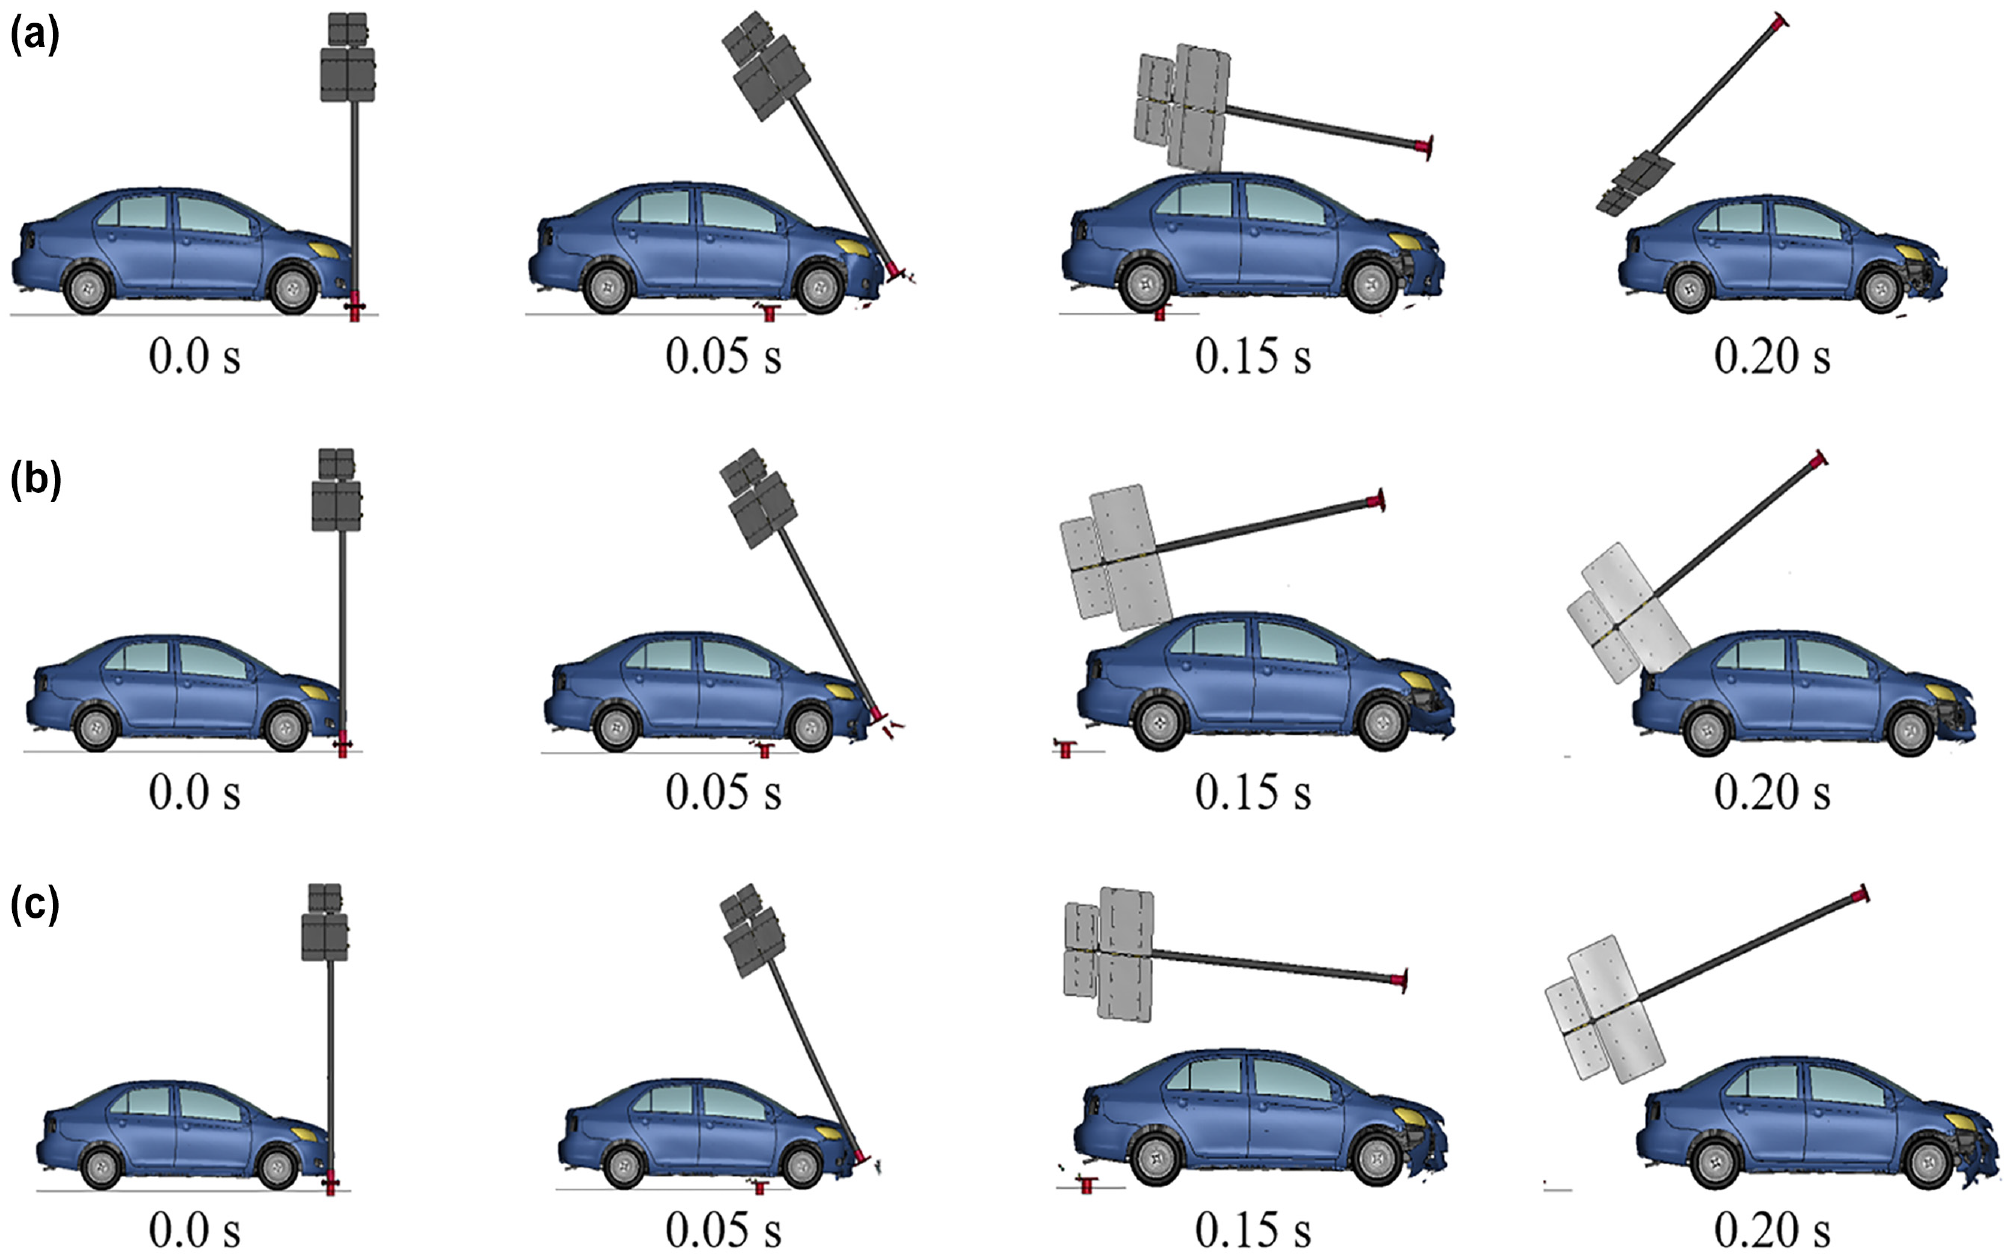
Sequential views under test No. 3-61 for sign cluster 15 sf × 9 ft with increased design height: (a) H = 9.5 ft, (b) H = 10.5 ft, and (c) H = 11.5 ft.
In simulations of MASH test No. 3-62, OIVs and ORAs were not calculated because of small changes in velocity. Figure 18 shows sequential views for the increased-height analyses simulating MASH test No. 3-62. Maximum roof deformations were 7.7 in, 4.7 in., 4.5 in., and 3.5 in. with centroid heights of 8.5 ft, 9.5 ft, 10.5 ft, and 11.5 ft, respectively. Since the simulated roof crush in the baseline model was higher than tested deformation in test No. FLS3-1, the results from the increased-height analysis are likely higher than may occur in a physical crash test, provided that the sign panel strikes a similar region of the roof and not the windshield. As the sign centroid height increased, the likelihood of windshield contact and shattering reduced significantly. Sign clusters with heights of 10.5 ft and 11.5 ft avoided contact between the sign panel and windshield. Roof deformations were near MASH limits, but are likely overestimated, recalling the discrepancies noted previously between the baseline model and crash test results. Therefore, raising the critical sign configuration centroid height to at least 10.5 ft is expected to have high potential to pass MASH safety performance criteria for test designation No. 3-62.

Sequential views under test No. 3-62 for sign cluster 15 sf × 9 ft with increased design height: (a) H = 9.5 ft, (b) H = 10.5 ft, and (c) H = 11.5 ft.
Summary and Conclusions
This study analyzed and evaluated unidirectional four-bolt slip base aluminum single-post sign supports used by Florida DOT on level terrain in accordance with MASH 2016 TL-3 safety performance criteria. Two full-scale crash tests were performed on slip base sign systems. Baseline models were developed to simulate the crash tests, and four alternative sign cluster configurations were selected to represent upper and lower bounds of design characteristics according to FDOT standard plans 700-010 and investigated using simulations. The critical alternative sign cluster configuration was further investigated through simulations with potential modifications to improve anticipated crash performance.
Two full-scale crash tests, test Nos. FLS3-1 and FLS3-2, were conducted on a system with a 4 ft tall × 4 ft wide sign mounted at a 4 in. diameter post according to MASH 2016 test Nos. 3-62 and 3-61, respectively. In test No. FLS3-1, the pickup truck struck the system oriented at 25° and at a speed of 63.6 mph. The vehicle remained upright and stable throughout the test, and all vehicle decelerations and occupant compartment deformations were within the MASH 2016 limits. Thus, test No. FLS3-1 was determined to satisfy the safety performance criteria for MASH test designation No. 3-62. In test No. FLS3-2, the 1100C vehicle struck the system oriented at 25° and at a speed of 61.3 mph. The vehicle remained upright and stable throughout the test, but the sign panel penetrated through the rear window into the occupant compartment and the roof deformation exceeded the MASH limit. Thus, the test No. FLS3-2 was determined to be unacceptable according to MASH safety criteria for test designation No. 3-61.
The baseline models of the slip base single-post sign support were developed and validated against the two full-scale crash tests. The validated models were modified for four sign systems with different panel sizes and design heights which represented a wide range of sign configurations that would be mounted to a 4 in. diameter single post according to FDOT standards. Each of the systems was subjected to all three MASH TL-3 impact conditions. Simulation results indicated that the system having a panel size of 15 sf and a deign height of 9 ft had low potential to pass MASH TL-3 criteria because of potential sign panel contact with vehicle windshields or rear windows. Simulations were conducted to investigate the potential benefit of increasing clear height from the ground line on crash performance. The critical sign configuration modified to raise the sign cluster centroid to a design height of 11.5 ft or greater was found to have high potential of passing MASH TL-3 safety performance criteria.
Future studies are needed to conduct full-scale crash tests on single-post sign systems with various panel clusters to further validate the developed models, evaluate system performance with various configuration and modification options, and verify critical conditions. This study focused on quarter point impacts with a 25° impact angle. Additional investigation should be performed for combinations of centerline impacts and lower impact-angle values. Additionally, while avoiding contact with vehicles is preferable, it may not be realistically feasible to achieve such performance in all cases. Roof deformations were noted to be larger for the simulations in comparison to crash test results, implying potentially inaccurate modeling of vehicle or sign components, which would then make determinations of anticipated crashworthiness based on simulations potentially unreliable. Sign panels striking vehicle roofs, windshields, or windows may also be sensitive to sign substrates other than the wind beam configuration used by FDOT and exclusively considered in this study. Glass behavior was also inconsistent between simulations and crash tests, suggesting that modified material models should be implemented to account for behavior when test article components contact or otherwise induce significant loading in glass elements. Lastly, consideration should be given to potential variations in vehicle bodies that satisfy MASH 2016 test vehicle properties. Sign articles may be predicted to avoid contact with glass elements in simulations, yet may produce different outcomes in crash testing because of variations in windshield and window placements for test vehicles that are not identical to those in models.
Footnotes
Acknowledgements
The authors wish to acknowledge several sources that made a contribution to this project: 1) FLDOT for sponsoring this project, 2) Mr. Derwood Sheppard, P.E., Roadway Standard Plans Administrator, FLDOT, for project guidance on the breakaway round-post, sign support study, and 3) MwRSF personnel for conducting the crash tests and performing computer simulations. This work was completed utilizing the Holland Computing Center of the University of Nebraska, which receives support from the Nebraska Research Initiative.
Author Contributions
The authors confirm contribution to the paper as follows: study conception and design: R. Bielenberg, R. Faller, J. Steelman; data collection: R. Bielenberg, C. Fang, B. Perry; analysis and interpretation of results: R. Bielenberg, C. Fang, R. Faller, J. Steelman; draft manuscript preparation: C. Fang, J. Steelman. All authors reviewed the results and approved the final version of the manuscript.
Declaration of Conflicting Interests
The author(s) declared no potential conflicts of interest with respect to the research, authorship, and/or publication of this article.
Funding
The author(s) disclosed receipt of the following financial support for the research, authorship, and/or publication of this article: The research presented herein was supported by the Florida Department of Transportation under TPF-5(193) Supplement #154.
