
Abstract
Collisions with motorized vehicles (MVs) are one of the leading causes of nonmotorized vehicle (NMV) crashes in a heterogeneous traffic stream. As well as NMVs’ inherent vulnerability, MV drivers’ risk perceptions of NMVs may also influence MV–NMV crashes. However, until now, this subjective perception has been little explored in the literature. This study examines the potential impact of numerous factors associated with motorized road users’ perception of risk and the operational aspects of NMVs on MV–NMV crashes. An ordered probit model was developed using self-reported data from 1,560 Dhaka city motorists (motorcyclists, and car and bus drivers). Findings revealed that motorists have a higher probability of becoming aggressive, deem NMV drivers’ behavior to be risky, and have low positive attitudes toward such vehicles when they have a stronger MV–NMV crash history. The results also suggest that bus drivers have fewer crashes with NMVs, although they feel these vehicles are structurally unsafe. In addition, age, education, and perceptions of lane separation, movement, stops, and users’ trip frequency were significant in predicting crash frequency. Further, older and illiterate drivers were more likely to be involved in collisions with NMVs. Because of the bias of self-reported data, analysis of variance tests were conducted, and the results demonstrated a significant difference in risk perceptions between motorcyclists, car drivers, and bus drivers. Risk perceptions of NMVs were the highest among motorcyclists. The findings of this study are expected to aid policymakers in improving motorists’ perceptions of NMVs and in increasing the latter’s safety in developing nations with heterogenous traffic systems.
Keywords
In many South Asian cities, for example, Dhaka, nonmotorized vehicles (NMVs) are a common mode of transportation. About 60% of Dhaka residents utilize cycle rickshaws (a three-wheeled NMV) for short and medium-distance trips ( 1 ), primarily for commuting, but also for social and recreational activities. If there were no cycle rickshaws in the city, women particularly, and also low- to middle-income individuals would be more likely to experience social isolation. Cycle rickshaws are widely used for school transportation, and people rely on them especially during the monsoon season; therefore, they are a valuable mode of transportation in the Dhaka metropolis ( 2 ). This immense popularity is fueled by the use of NMVs as a paratransit mode in developing cities such as Dhaka ( 3 ), where inadequate public transportation services often fail to meet the population’s mobility needs ( 4 , 5 ). The human-powered cycle rickshaw is a dominant paratransit type in Bangladeshi cities ( 6 ), and Dhaka City Corporation (DCC) reported that there were 79,554 licensed rickshaws in Dhaka in 2017 ( 1 ). Despite their popularity, most NMVs have been associated with unfavorable attitudes because of the likelihood of them being involved in fatal crashes ( 7 ). The users and drivers of these vehicles are among the most vulnerable groups in road traffic accidents ( 7 , 8 ). Previous studies showed that 67% of NMV accidents result in fatalities and they have a 50% casualty rate. Dhaka has the highest rate of NMV accidents in Bangladesh, at 71% ( 9 ). Annually, an average of 60 fatalities involving cycle rickshaws are reported by the police ( 10 ).
In recent years, the number of three-wheeler collisions has increased substantially ( 11 ). Because of the heterogeneous nature of the traffic system, collisions with motorized vehicles (MV) are the leading cause of NMV crashes. Excessive speeding and careless driving ( 9 ) are the most significant factors. Precrash behavioral analysis has revealed that the tendency of MVs to turn illegally is also an important variable in such crashes ( 12 ). In addition, cycle rickshaws have poor stability, resulting in rollovers at turns ( 1 ), and the risk of crashes and serious injuries increases when these vehicles are overloaded ( 13 ). These low-mass vehicles have limited crashworthiness and a high risk of severe injury even at moderate crash speeds ( 14 ), because they are rarely designed to sustain accidents ( 15 ).
The aforementioned factors and many more affect how road users perceive the safety of NMVs, and this subjective risk perception may influence their probability of having a crash with such vehicles. Unfortunately, studies on the safety of small low-mass vehicles are scarce, especially in relation to three-wheelers such as cycle rickshaws ( 14 ), and the existing literature has mostly investigated objective factors that increase the crash risk such as demographic and traffic characteristics ( 16 – 18 ). However, the relationship between motorized road users’ subjective perceptions of NMVs and the risk of crashes involving these vehicles has not been studied. Therefore, this study concentrates on several factors associated with motorized road users’ (bus and car drivers and motorcyclists) perceptions of the risk and operational aspects of NMVs, and analyzes the potential impact of such perceptions on MV–NMV crashes. In addition, a comparative study has been conducted to assess how different MV user groups perceive the safety risk of NMVs on the road.
This study designed and employed a self-reported survey questionnaire to collect data from road users in Dhaka and developed ordered probit models to identify the significant perceptual factors affecting MV–NMV crash events. In addition, analysis of variance (ANOVA) tests were conducted to examine any statistically significant differences in risk perceptions between the three MV groups involved.
Literature Review
Risk Perception
Risk refers to the unpredictability of outcomes and the severity of their impact on things people value, whereas risk perception is an individual’s subjective evaluation of the risk ( 19 ) Although risk perception is subjective and based on a set of values, concerns, or knowledge, when road users perceive risk, they are likely to interpret it in various ways ( 20 ). According to one study, these perceptions are influenced by two factors when driving on the roads: (a) awareness of potential risks in the traffic environment; and (b) awareness of the driver’s ability (and the capabilities of the vehicle) to prevent those potential hazards from becoming actual accidents ( 21 ).
Studies have been conducted on how road users’ risk perceptions are linked with their characteristics and behavior when driving, but there is a lack of knowledge on how they perceive risk in relation to NMVs. Perceived risk is crucial in proactive safety planning, because it supplies critical information for detecting crash risk possibilities ( 22 ). As well as demographic parameters such as gender ( 23 ) and age ( 24 ), subjective risk perception has been observed to vary according to users’ skills and confidence ( 25 ), as well as their profiles and travel frequency ( 26 ).
Because in most cases risk perceptions are ordinal variables, previous studies used ordinal logistic regression to evaluate the association between general perceptions, sociodemographics, and latent components ( 18 ). Results indicated that two latent constructs—unsafe vehicle construction and unsafe vehicle dynamics—are related to passengers’ perceptions of the safety of three-wheelers. In addition, particular user groups, for example, children, women, and the elderly (particularly those who are physically challenged), were at a higher risk. A similar approach was taken to examine how pedestrians perceive spatial risk and how the built environment affects that perception ( 27 ). The perceived risk was substantially correlated with gender, the number of lanes on the road, the width and maintenance of the sidewalks, traffic volume, and speed. Although in the case of cyclists the objective and subjective risk perception indicators are typically the same, there are some circumstances, such as cycleways traveling in the opposite direction from cars, in which cyclists underestimate the actual crash risk, especially at intersections of streets with 30 km/h speed limits and streets with higher speed limits ( 28 ). Thus, the literature demonstrates a high risk perception of nonmotorized modes, indicating their vulnerability in heterogeneous traffic systems.
NMVs
An NMV is any wheeled passenger conveyance without an engine or motor ( 29 ). The scope of NMVs is not universal, and examples vary significantly from nation to nation, particularly in African and Asian regions where they are prevalent and often used as intermediate forms of public transportation. For example, although the bicycle is the most prevalent form of NMV worldwide, in nations such as India and Bangladesh, cycle rickshaws, bullock carts, and cycle vans are all significant other examples of NMVs. Another typical NMV in some Indonesian cities is the becak or pedicab ( 30 ).
Despite their significance in metropolitan settings, most nonmotorized three-wheelers have a terrible reputation because of their involvement in deadly crashes and because they contribute significantly to increased traffic congestion ( 7 ). Studies showed that between 1998 and 2006, NMVs were responsible for 800 deaths in Bangladeshi cities, or nearly 12% of total traffic fatalities. Meena et al. ( 13 ) studied incidents involving cycle rickshaws in Lucknow, North India, and concluded that overloading is the most significant factor that causes crashes. The study also showed that collisions with moving vehicles are the most frequent cause of injury, followed by falling from the rickshaw.
Previous studies have investigated several modeling techniques for forecasting NMV crashes. Huang et al. ( 31 ) developed three nonmotorized accident prediction models, including a univariate spatial model and two multivariate models with and without spatial correlation. The models were evaluated using the posterior mean deviance and deviance information criterion. However, there was no information on mode volumes available.
Osama and Sayed ( 32 ) discovered that for exposure crash models, mode correlation has a more considerable influence on model performance than spatial correlation, but has a minimal impact on joint crash models. Because of a lack of “true” nonmotorist exposure data in earlier crash prediction models, Yasmin et al. ( 33 ) developed exposure models using hurdle-negative binomial models, crash count models using negative binomial models, and crash proportions by severity models using ordered probit fractional split models. The study demonstrated that nonmotorist-friendly infrastructures had a mixed influence on nonmotorist safety, although the data set utilized was at an aggregate level and was not easily transferrable for constructing microlevel models. Apart from crash model development and statistical analysis, studies such as Beitel et al. ( 34 ) used interactions and automated video conflict analysis to assess the safety of nonmotorized shared spaces. However, the only NMV type listed in the majority of these studies is the bicycle; therefore, we will include the cycle rickshaw in our research.
MV–NMV Interaction in Mixed Traffic
The global number of MVs has been steadily expanding over the previous few decades, with production increasing by almost 3% in 2021, which equated to about 80 million motorized vehicles produced that year ( 35 ). Dhaka’s roadways were home to more than 1.7 million registered motor vehicles as of 2021 ( 36 ). Motorcycles (41%), cars (28%), and buses (2%) account for a sizable proportion of this figure ( 37 ). In 2017, DCC reported that there were 79,554 licensed rickshaws in Dhaka; however, estimates put the real number at more like 1.1 million ( 1 ).
Interactions between such diverse modes often lead to the increased probability of a crash caused by risky driver behavior, and result in casualties. Previous researchers have explored ways of mitigating these issues. For example, to study the overtaking behaviors of NMVs on shared roads, Liu et al. ( 38 ) proposed a utility-based multinomial logit sub-lane choice model and conditional probability-based overtaking motivation model. The models predicted and estimated overtaking frequencies with a high degree of accuracy.
Liu et al. ( 39 ) provided insights into lateral interaction behaviors in mixed traffic that can aid the design of facilities to mitigate risks. Using a parametric accelerated failure time duration model, the authors concluded that the interaction likelihood increases with a greater NMV–MV speed differential and higher MV speed, and decreases with NMV or MV yaw rates. However, the NMV types utilized in the research were categorized manually, which might lead to inaccuracies. Using data from 12,327 NMV users in Hefei, China, Zhang et al. ( 40 ) discovered that the interference rate was greater during morning peak hours than during evening peak hours because of people hurrying to work. In another study, it was found that the MV flow next to the NMV lane is more severely disrupted than others as shown by a novel two-dimensional car-following model ( 41 ), emphasizing the importance of lane separation in mixed traffic.
Lee et al. ( 42 ) developed a multivariate Poisson lognormal conditional autoregressive model to study crashes by mode type in mixed traffic conditions. The sample consisted of crash data from 2008 and 2009 gathered by the Florida Department of Transportation. Several traffic/roadway variables describing the traffic volume and complexity of the traffic network were shown to be significantly associated with all crash response variables. However, high error correlations between modes indicated that several shared factors had not been addressed. In Utrecht, the cycling capital of the Netherlands, Uijtdewilligen et al. ( 43 ) investigated the exposure effects on MV–bicycle crashes using five years of crash data. The increase in exposure was less sensitive to collisions on roads with lower speed restrictions compared with those with higher limits, showing the significance of a speed reduction in mixed urban traffic. However, the crash data came from police reports, which generally suffer from underreporting.
In summary, the majority of research has shown that MV–NMV interactions in mixed traffic are related to road user behavior and infrastructural characteristics, whereas only a few studies identified exposure and vehicle-related factors along with environmental variables ( 44 ). Although studies on MV–NMV interactions are available, most of them have considered bicycles and e-bikes to be the only modes of NMV. Neither have the implications of motorized road users’ perceptions of risk been taken into account. Therefore, this study aims to explore the subjectivity of human perception and its effect on crash involvement, because each road user may be affected differently by this issue.
Data Preparation
Questionnaire Development
Data were collected through a questionnaire survey distributed among motorcyclists, and car and bus drivers on the streets of Dhaka, Bangladesh. A thorough literature review and expert judgment were used to design the survey instrument. Because examples of questionnaires that aim to capture user perceptions of risk and operational features in relation to NMVs are not commonly available, the authors relied on driver behavior questionnaires, which have been used in many studies ( 18 , 45–47), and their engineering judgment. Details of the questionnaire form can be found in the supplemental material.
The questionnaire survey consisted of three parts. First, the “Driver Information” section asked for demographic features such as age, education, and responder type. Second, the “Risk Perception” part contained 23 items on a 5-point Likert scale with answers ranging from “strongly disagree” to “strongly agree.” The risk perception section was divided into five categories: aggression (five items: e.g., “I get involved in an altercation after colliding with an NMV”); structural risk (five items: e.g., “I think NMVs will be badly affected in crashes because of their very light structure”); driver behavior (five items: e.g., “I think NMV drivers are often reluctant to give the right of way/crossing”); violation (four items: e.g., “I often disregard the right of way when an NMV is passing”); and positive attitude (four items: e.g., “I think authorities are adopting policies to improve NMV safety”). The last section contained questions on road users’“Operational Perception” of NMV movements, such as how they felt about lane separation, movement limits, and so forth, and they were also asked to report their crash frequency with regard to NMVs.
Study Area and Data Collection
Because of the unavailability of official demographic statistics on bus and car drivers, and motorcyclists in Dhaka, previous literature ( 48 – 53 ) and the national statistics for the entire population of Dhaka were used as the representative baseline. The sample population was segmented into predetermined groups, and interviews were then conducted with each user group using a stratified random sampling approach. People from a variety of demographic and socioeconomic backgrounds were surveyed to ensure that the data obtained accurately reflected the opinions of the entire population. After data screening, the missing and unresponsive responses were discarded. The final data set contained 1,560 responses: 533 from bus drivers; 517 from car drivers; and 510 from motorcyclists.
Data and Variables
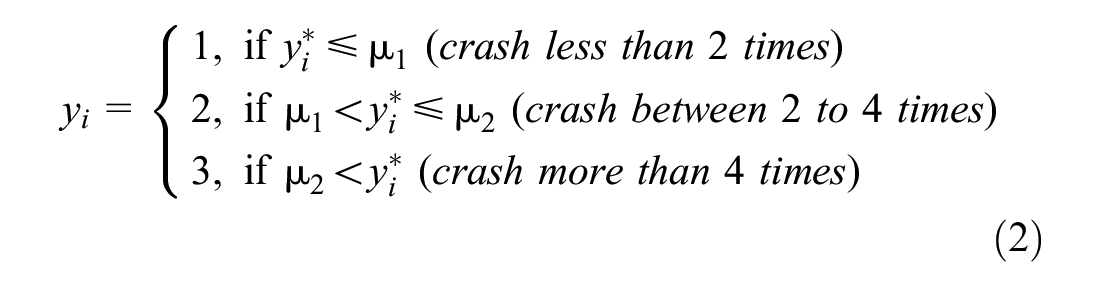
The crash frequency in relation to NMVs is categorized into three groups: zero or low crash involvement (frequency < 2); moderate crash involvement (frequency: 2–4); and high crash involvement (frequency > 4). As well as users generally underreporting crashes in self-assessed surveys ( 54 ), it is quite typical for MV users to have minor collisions with NMVs in the mixed traffic of Dhaka even though they might report not having had a severe crash. Thus, this research considers the reporting of zero collisions to be a low crash occurrence. Therefore, crash frequency is now a three-level ordinal response variable.
With regard to the independent variables for model development, several demographic and perceptual characteristics from the questionnaire survey are considered. First, the study classifies aggression into three groups based on a total score of 25: mild aggression (lower quartile: 5–11); moderate aggression (between upper and lower quartile: 12–16); and severe aggression (upper quartile: >16). Driver behavior is similarly divided into 3 categories (out of a total of 25): safe (9–18); moderate risk (19–22); and reckless (>22). The structural risk is also divided into three categories: low (9–15); moderate (16–19); and severe (>19). Finally, and using a total score of 20, the violation tendency and positive attitude toward NMVs are classified as follows: mild tendency (4–6), moderate tendency (7–11), and severe tendency (>11); and low positivity (4–9), moderate positivity (10–13), and high positivity (>13), respectively. The quartile distributions for the continuous scores are used as the basis for all classifications. Higher scores for driver behavior and structural risk indicate that the respondent views NMVs as riskier, whereas higher values for positive attitude indicate that the respondent has a favorable attitude toward NMVs.
Methodology
Overall Approach
Figure 1 illustrates the workflow followed in this study, and the following subsections provide a brief description of its methodological concepts.
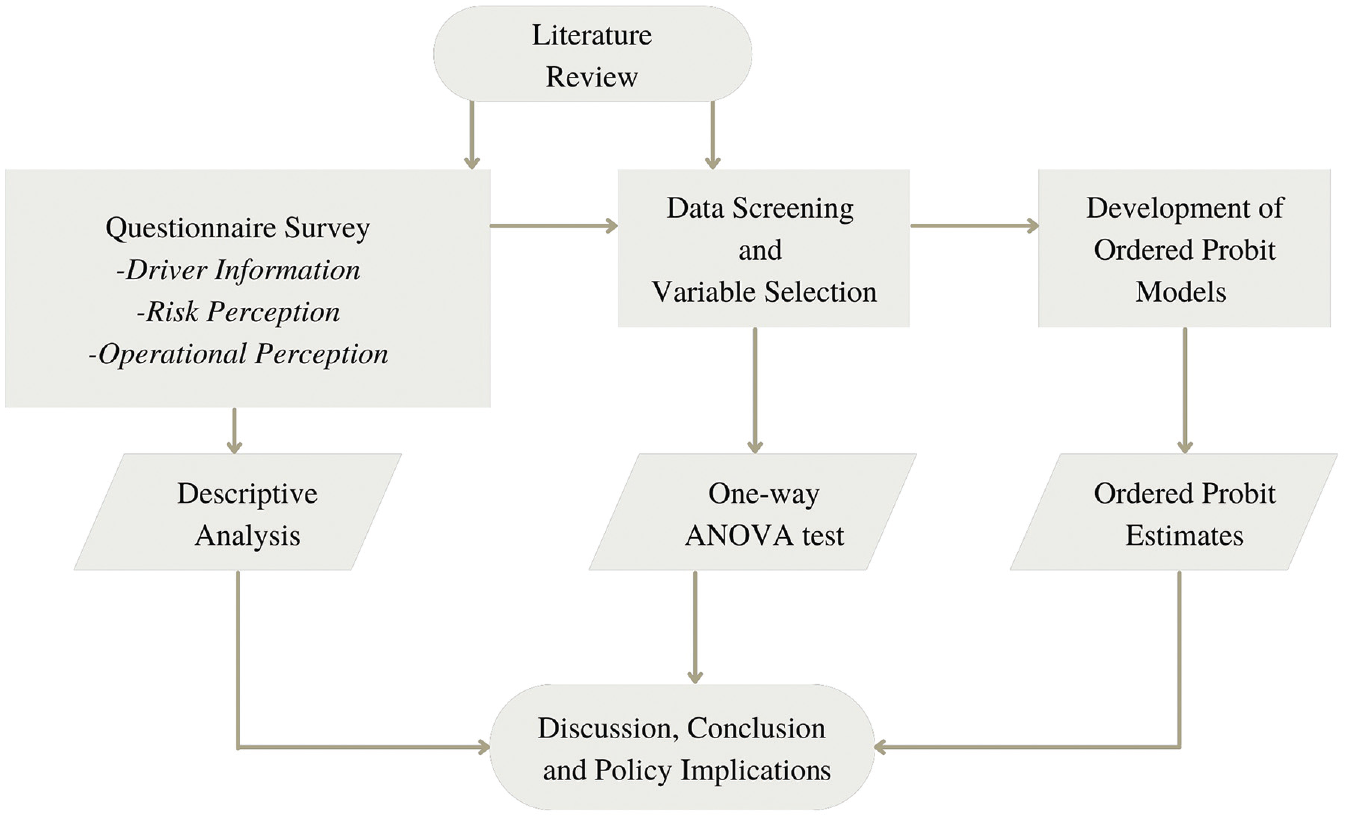
Workflow diagram.
Ordered Probit Regression Model
Ordered response models can identify the indexed nature of an ordinal dependent variable and give desired outcomes. In such models, a latent yet continuous description of the response variable underlies the indexing.
The random error connected with the continuous descriptor in an ordered probit model is considered normal distribution. The statistical analysis in our work is carried out using full information maximum likelihood estimation (MLE) in Stata version 13. The ordered response variable in our study is the number of crashes involving NMVs estimated on three levels. The general specification used here is as follows:

where
where

where
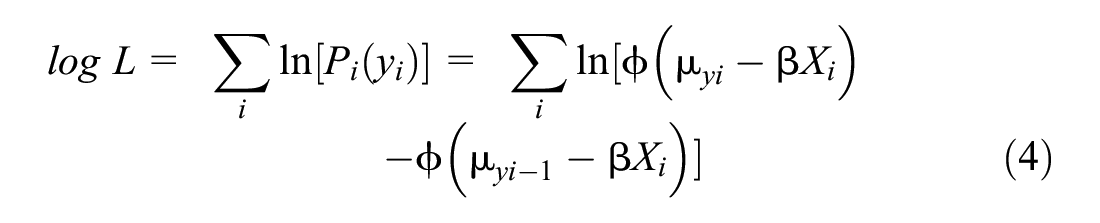
Using an iterative approach, the log-likelihood in Equation 4 is maximized for
One-Way ANOVA
ANOVA is a statistical tool used to identify statistically significant differences between the means of more than two independent samples ( 55 ). Because repeated t-tests for more than two groups increase the likelihood of Type I error, it functions as an extension of the two independent samples t-test. Under the presumptions that the observations are independent, the variances of each sample are identical, and the residuals are normally distributed, one-way ANOVA is employed when a single factor splits the data set into numerous groups. It then culminates in the following system of theories:


The null hypothesis

where SSC and SSE denote the pointwise between groups and within groups variations, respectively and are determined as:


where

The test statistic holds Fisher’s distribution F(k − 1, N − k), and when F > F1−α, k−1, N−k,
Results and Discussions
Descriptive Statistics
Table 1 shows the descriptive analysis of pertinent variables categorized by responder type, that is, motorcyclists, and car and bus drivers. Although the majority of motorcyclists and vehicle drivers are between the ages of 25 and 35, the majority of bus drivers are aged 36 or over; however, this still represents a skewness toward the lower age groups. The illiteracy rate is the highest among bus drivers, with only 1.69% ever reaching the higher secondary level; bus drivers typically come from a disadvantaged economic background and cannot pursue an education. The percentage of people with at least higher secondary education is significantly greater among the motorcyclists. A plausible explanation could be that an increasing number of educated individuals are seeking to join ride-sharing firms as a lucrative side hustle. The market for ride-sharing services in Dhaka is projected to exceed ₹200,000 or 0.2 million vehicles, with a 23% market share of transportation services, showing robust growth in the city. Among these companies, Uber and Pathao are the biggest contributors ( 57 ), and according to Kamal and Ahsan ( 58 ), the market for these services will continue to expand in the future. The proportion of motorcyclists aged under 25 is much greater than that of car or bus drivers in the same age group, indicating the popularity of this mode among young people. Unlike the bus drivers, their age data set is skewed toward the upper end of their age group. Motorcyclists are also more likely to exhibit severe aggression and a greater tendency to violate the law because of the presence of NMVs along with a high risk perception of their vulnerability. With regard to car drivers, 23% tend to have a low positive attitude toward NMVs and almost half of them think NMV lanes should be physically separated on roadways. Most MV users believe that NMVs are a significant contributor to traffic congestion. Because MV users may use feeder services such as NMVs in some capacity for last mile connectivity, most of them favor NMV stops at the local and arterial road junctions for convenience.
Characteristics of Respondents
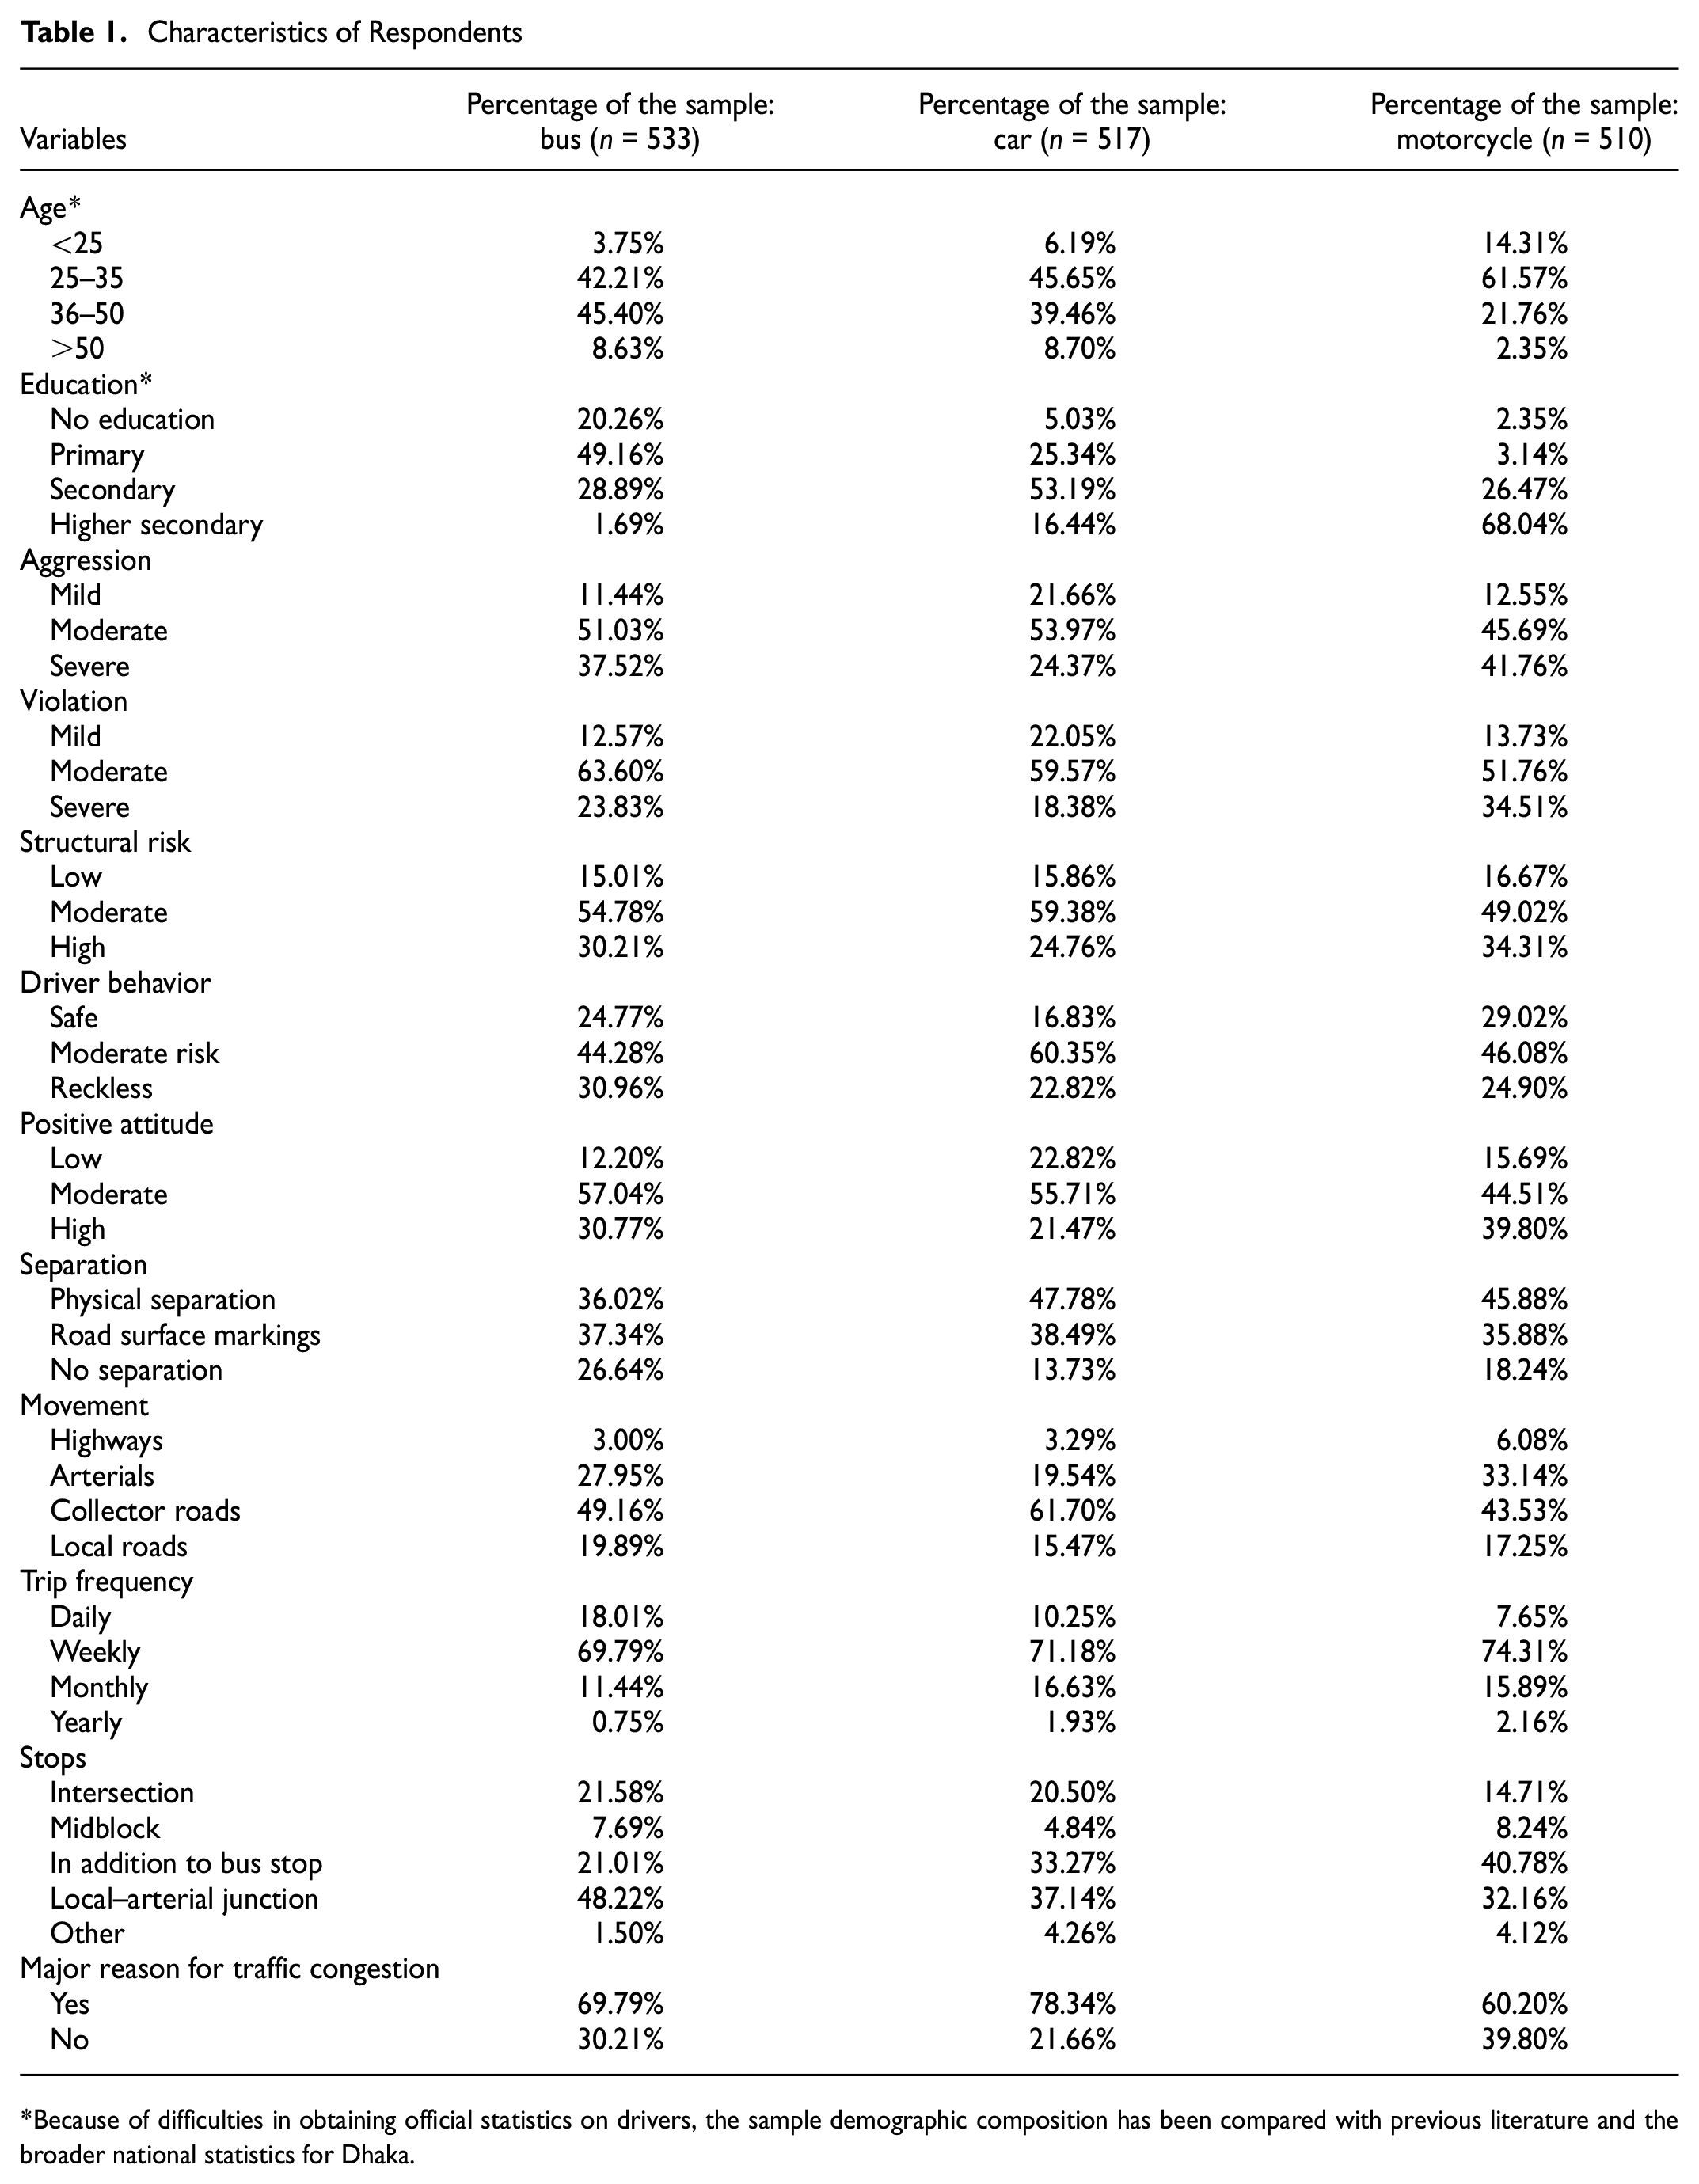
Because of difficulties in obtaining official statistics on drivers, the sample demographic composition has been compared with previous literature and the broader national statistics for Dhaka.
An overview of the study variables, which is used to find any unexpected skewness in the data set and exclude any outliers, is obtained before the descriptive analysis. The data set revealed no such anomalies and, thus, is ready for additional statistical analysis in model development.
Model Development
Effect of Perceptual Factors on MV–NMV Crashes
Table 2 shows the outputs of the ordered probit estimates for MV–NMV crash models of bus and car driver, and motorcyclist responders including all variables. The parameters are estimated using MLE, and the statistical significance of the variables is displayed at the 10% level. The results show that a total of eight parameters for each of bus and car and five parameters for motorcycle were significant in the model. The model was rerun after dropping the insignificant parameters; however, the significant variables still remained significant and there were no changes in the coefficient values up to three decimal points. In addition, explanatory variables, such as aggression, perception of NMV movement, and stops, are statistically significant across all the responder groups.
Estimation of Ordered Probit Models
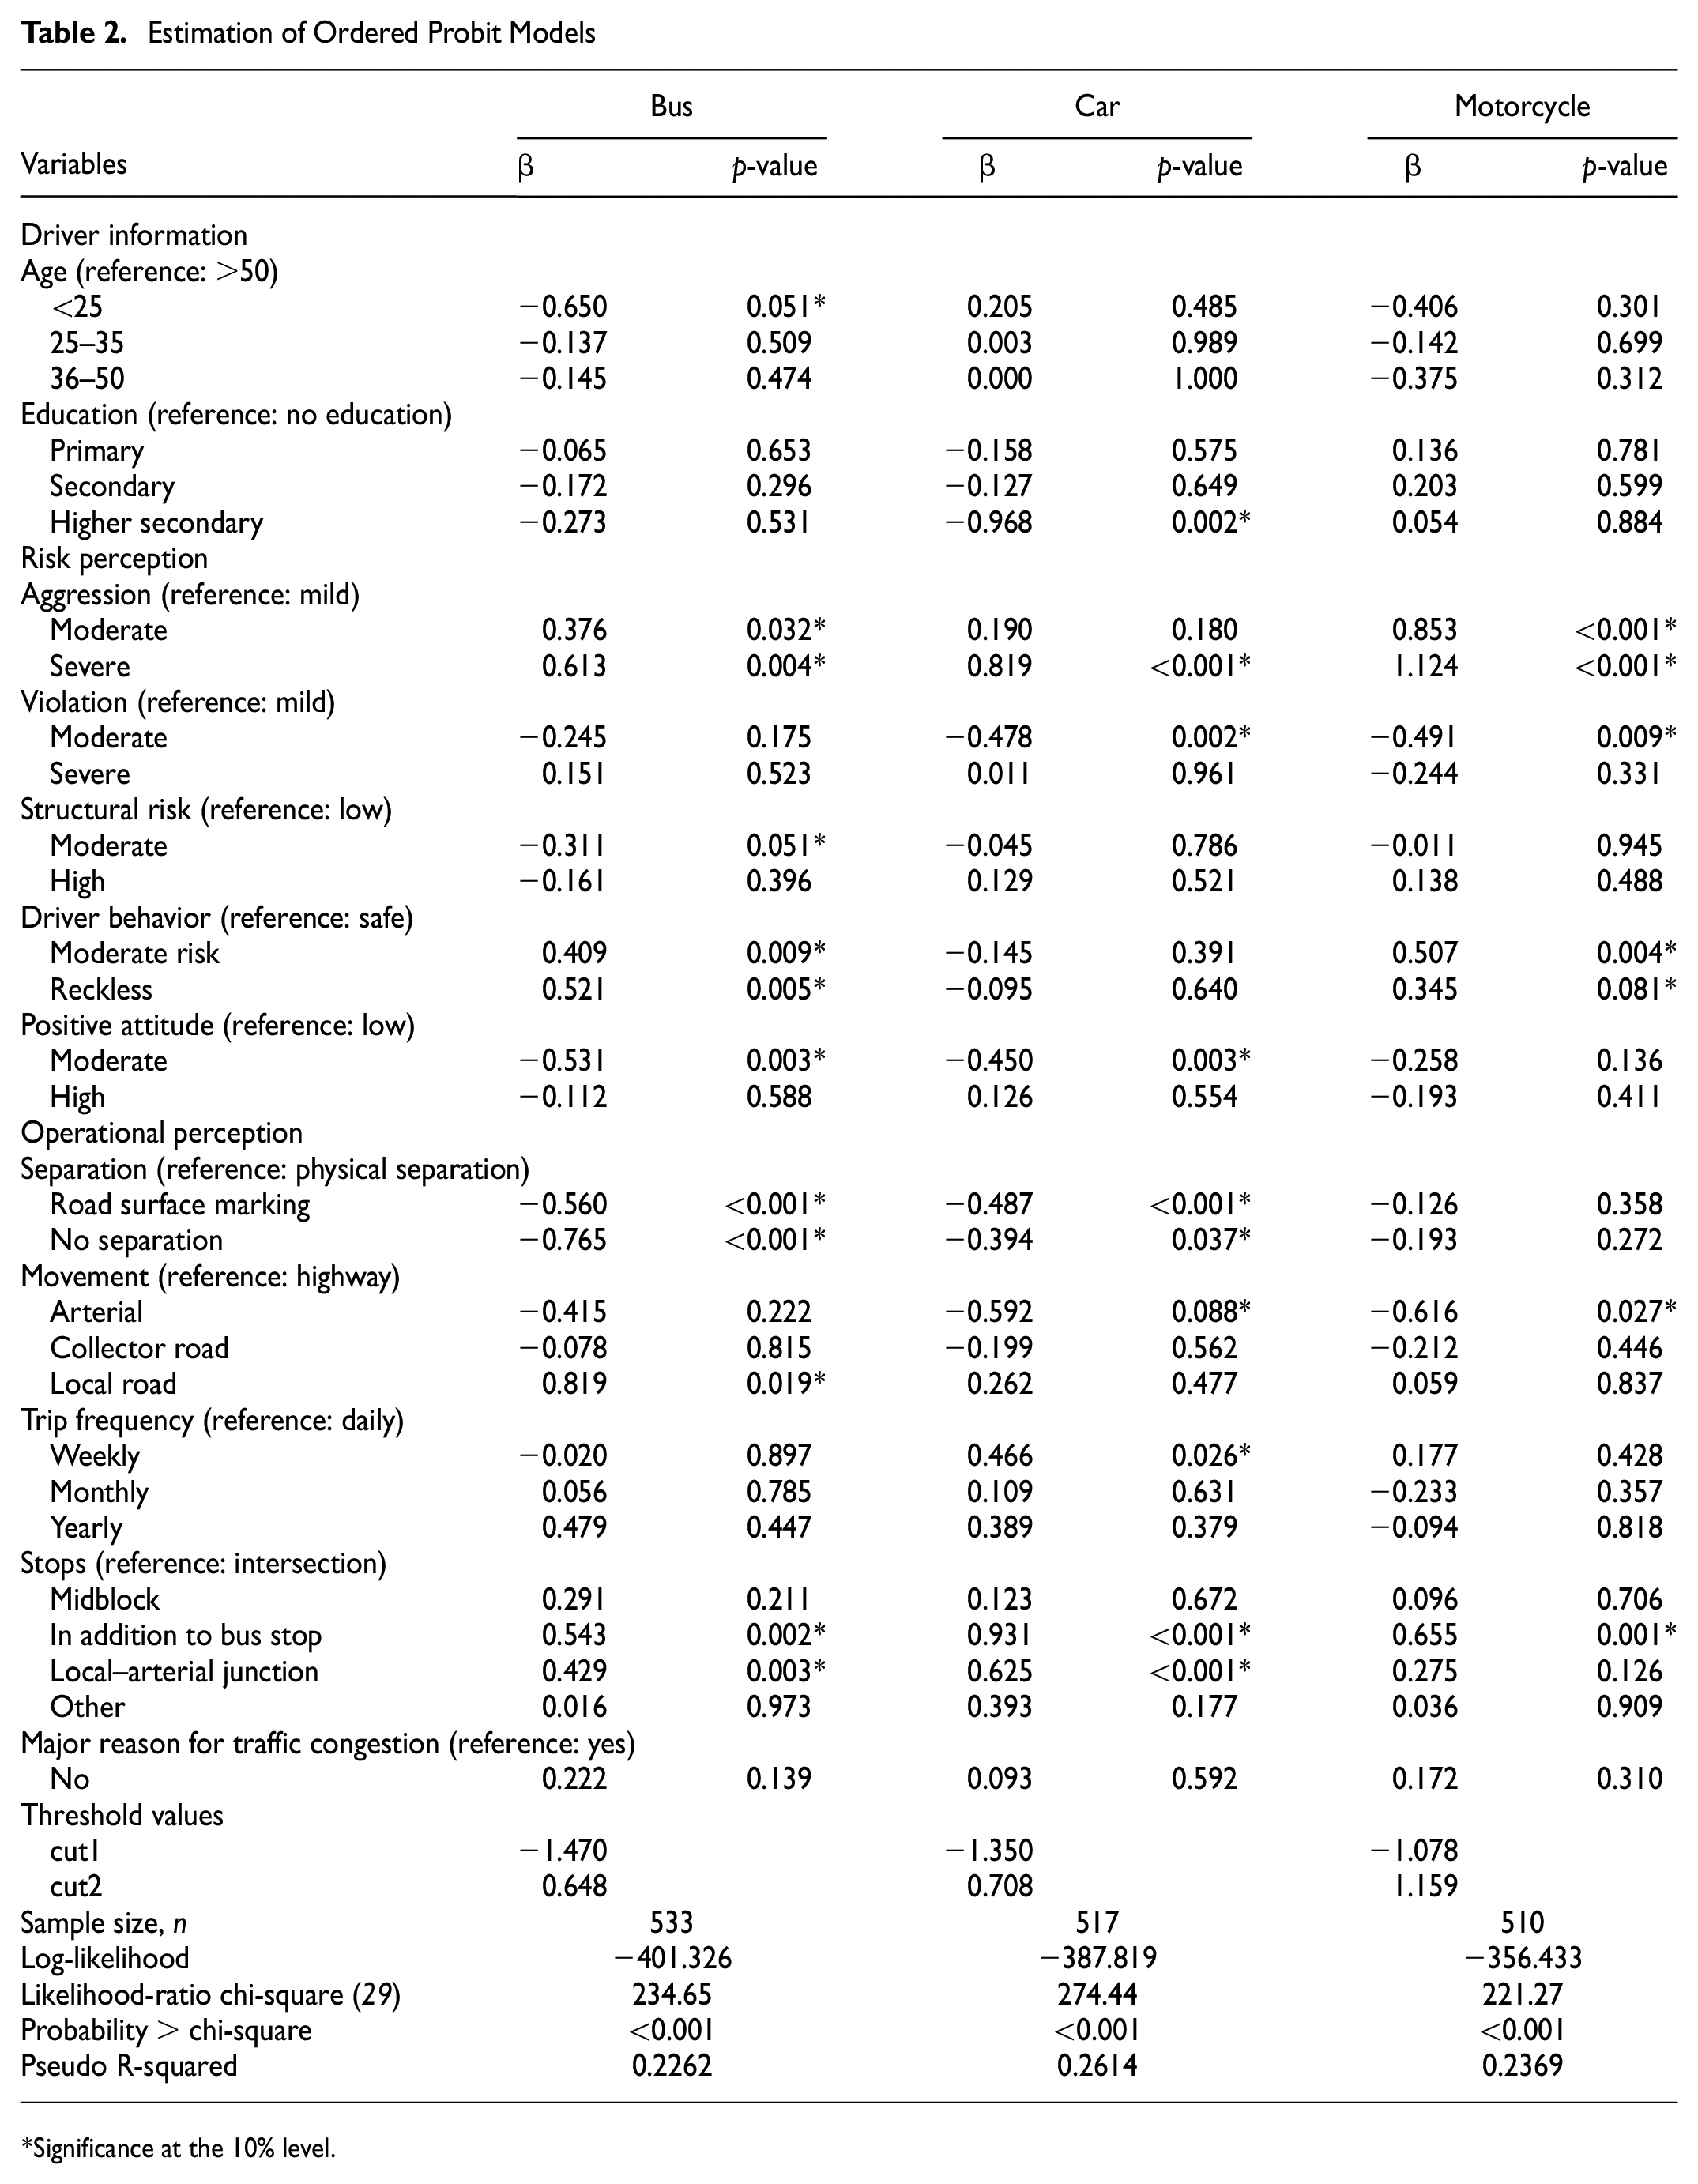
Significance at the 10% level.
A negative coefficient suggests that younger bus drivers (age < 25) will experience fewer collisions compared with senior drivers (age > 50). The reason for this may be certain age-related conditions such as deteriorating vision and hearing, which decrease cognitive abilities and reflex skills. Older drivers are also likely to suffer from muscle atrophy, which can result in reduced muscle control, and have a higher risk of heart disease; a sudden heart attack could result in complete lack of control.
Drivers with a higher level of education are less likely to collide with NMVs than those without any formal education, which suggests that education fosters the development of sophisticated cognitive skills such as reasoning, decision-making, and problem-solving, all of which help a person become more aware of his/her surroundings when driving.
Aggression levels are a strong predictor of crashes across all MV groups. Positive coefficients indicate a direct correlation between the level of aggression and crash occurrence. Because anger impairs decision-making on the road, motorized drivers with greater levels of aggression are more likely to be involved in collisions. Analysis shows that as the level of violation increases, car drivers and motorcyclists are more likely to have a collision than those who only have a mild tendency toward violation. There may be an opportunity to install distinct NMV lanes on certain arterials and highways, meaning that NMVs do not interact with MVs at all in these specific locations. Bus drivers who view the structure of NMVs as riskier are less likely to be involved in crashes than those who do not. This might be because drivers are more likely to drive cautiously when an NMV is nearby if they believe this type of vehicle is structurally unsafe.
Motorcyclists and bus drivers who perceive NMV drivers to display risky behavior are more likely to collide with them than those who perceive their behavior as safe. Reckless driving by NMV drivers may increase road rage among other drivers, increasing the likelihood of collisions. A greater positive attitude toward NMVs is also estimated to reduce the likelihood of collisions for bus and car drivers. Drivers who prefer stops for NMVs and buses next to each other exhibit a higher crash likelihood than those who favor these being located at intersections. Compared with drivers who believe NMVs should be physically separated in mixed traffic, bus and car drivers who prefer NMV lanes not to be separated or, at best, divided only by surface markings, tend to report fewer collisions. This may be because drivers who have experienced fewer collisions with NMVs tend to have a more favorable impression of these vehicles, making them less concerned about NMVs being separated in mixed traffic.
Compared with car drivers who use NMVs daily, those who use NMVs only once in a while during a typical week had a higher risk of collision. It is plausible that car drivers who often use NMVs as well, may possess a distinct perspective on the susceptibility of this transport mode. The firsthand experience might make them more attuned to the challenges. Hence, due to the heightened awareness gained from a dual perspective, such individuals may be motivated to take proactive actions to reduce the risk of collisions when they resume driving their cars.
Table 2 also displays the log-likelihood values for the three models. The ordered probit model for motorcycle shows an improvement in the log-likelihood compared with bus and car, and because the number of predictor variables is the same across the three models, it implies that the motorcycle model is better fitted to its data set. For all three models, a McFadden’s pseudo R-squared value of more than 0.2 is indicative of a satisfactory fit ( 59 ). The significance of the p-value (<0.001) in the likelihood-ratio test shows that all three models significantly outperform the null (intercept only) model with regard to fit.
Segmented Analysis of Risk Perception by ANOVA
The results from the ordered probit analysis show that MV users’ risk perception variables significantly affect the frequency of MV–NMV crashes. However, because self-reported crashes are subject to systematic biases ( 54 ), an ANOVA test is carried out to corroborate our findings further by looking for significant differences in risk perception across the three MV user groups.
Table 3 displays the Stata output for one-way ANOVA. Results show that the p-value (Prob>F) is significant for all risk perception variables (e.g., aggression, violation, structural risk, driver behavior, positive attitude). Motorcyclists show higher mean perception scores for aggression, violation, and structural risk. One factor could be that NMVs are more likely to encounter motorcycles on narrow roads and in tight alleyways where larger MVs cannot pass. In addition, because there are no designated NMV lanes in developing cities such as Dhaka, in general, NMVs and motorcycles both share the last lane of the road and, therefore, are more likely to have an altercation. Moreover, despite the substantial weight disparity between cars and NMVs, motorcyclists have a higher perception of structural risk than car drivers. Motorcycles are often a more exposed vehicle type than cars, and as a result, motorcyclists have a greater risk of (more severe) collisions than car drivers ( 52 ). In spite of being more hostile toward NMVs in practice, a higher positive attitude score indicates that motorcyclists actually view NMVs quite favorably. A possible explanation is that the majority of motorcyclists belong to lower- and middle-income groups ( 60 ) who are also frequent NMV users and experience the same perils on the roads as NMVs. Thus, they are hopeful that the introduction of appropriate policies by the authorities will increase the safety of NMVs on the roads. Car drivers have the highest perception score of NMVs’ driver behavior, which indicates they consider it to be reckless. This may be because they are generally more concerned about the potential damage to their own vehicles and the expense that would result from a collision with an NMV.
Estimation Results of One-Way ANOVA
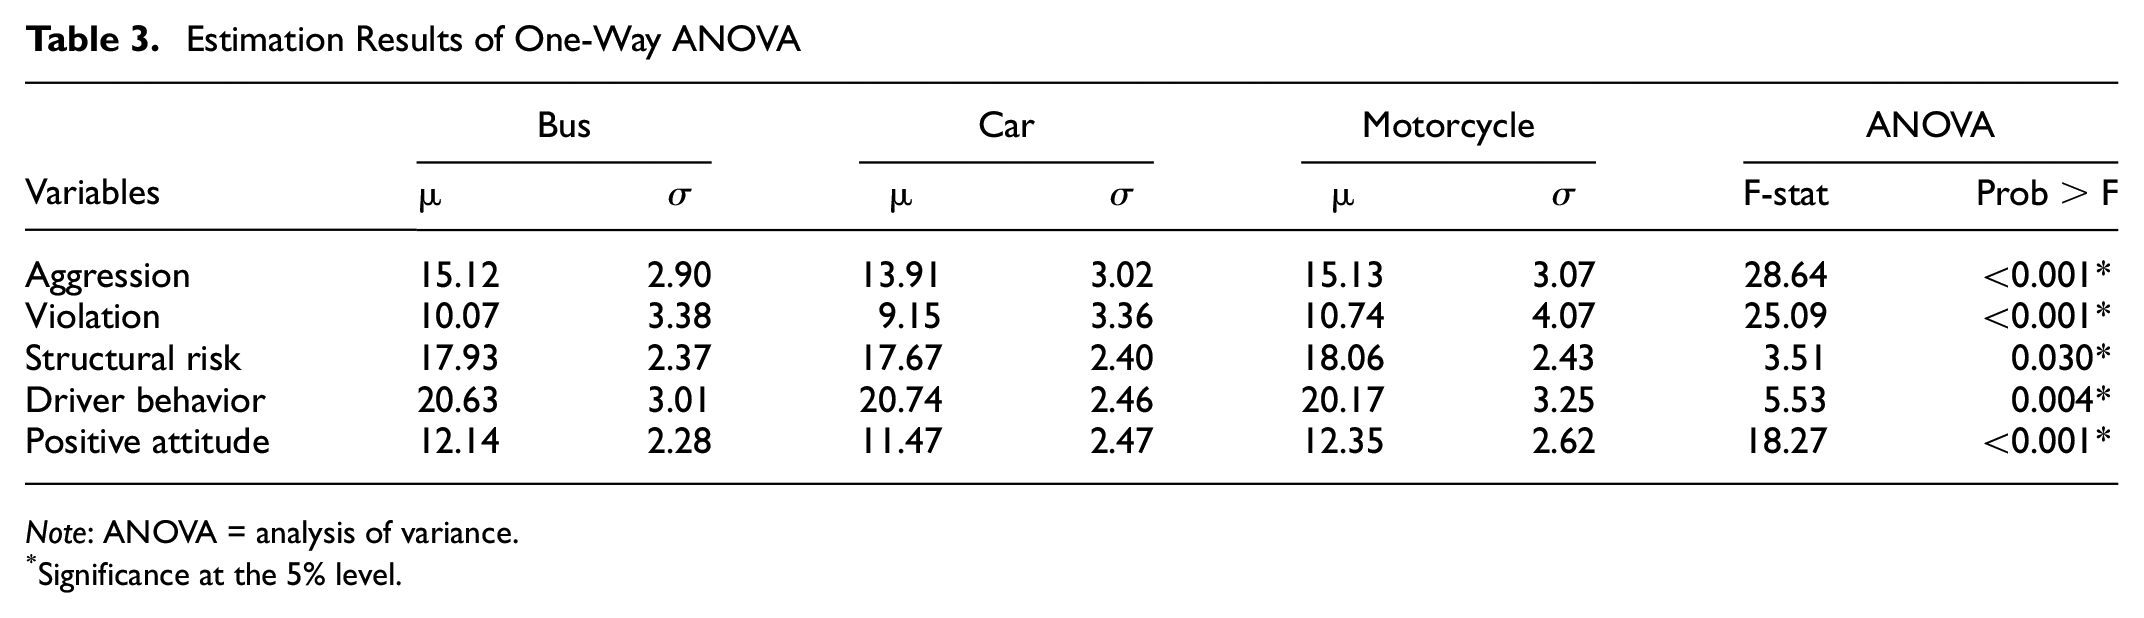
Note: ANOVA = analysis of variance.
Significance at the 5% level.
Policy Implications
From the application standpoint, the study demonstrates that safety evaluations are necessary for NMVs to improve their overall perception among other road users. The findings have practical policy implications for enhancing the overall safety of NMVs in mixed traffic environments. An important finding of the research is that motorists’ aggression toward NMVs correlates positively with collisions. Other risk perception characteristics have also been shown to have a substantial impact on crashes. Thus, it is understandable that perceived risk is essential for proactive safety planning because it provides key information for detecting potential crash risk scenarios. Moreover, the descriptive analysis of respondents reveals that the majority of MV users would like separate lanes for NMVs. This idea may be driven by respondents’ understanding of NMVs’ susceptibility in the event of MV–NMV collisions, given that MVs typically have a greater mass and speed than NMVs ( 44 ). Lack of skills and training among NMV drivers, for example, rickshaw pullers, may also contribute to an unfavorable perception. A study found that 98% of rickshaw pullers learned the skill on their own, whereas the remaining 2% learned through acquaintances ( 1 ). This lack of formal training results in inadequate driving skills and ignorance of traffic laws and, thus, the risk of a crash increases. Therefore, by adopting safety measures for NMVs, such as the provision of separate lanes, improving the design structure, training rickshaw pullers, and refining the licensing procedure ( 1 , 9 ), authorities may improve motorists’ perceptions of them, thus reducing the likelihood of crashes. If the trip patterns and trip length of NMVs are analyzed, it can be seen that they mainly cater for shorter trip lengths and sometimes provide last mile connectivity for mass transit users. Therefore, regulations that define their role and match them with the road functional classes should be formulated. Although the feasibility of such interventions in the context of the local environment remains a subject for future studies, this research could be the foundation of future efforts to encourage the use of NMVs as a sustainable mode of public transport by promoting traffic management and improving safety. Because the development of transportation infrastructure occurs in a socioeconomic context ( 61 ), the study’s findings can serve as a foundation for analyzing demand in countries with similar socioeconomic characteristics.
Conclusions
The current study aims to investigate motorized road users’ perceptions of NMVs and analyze the influence such perceptions have on MV–NMV collisions under mixed traffic situations in Dhaka, Bangladesh. Data from 1,560 MV users, including motorcyclists, and car and bus drivers, were analyzed using an ordered probit model. Results showed the significance of demographic factors (age, education), perception factors (aggression, violation, vehicle structure, driver behavior, positive attitude), and opinions on lane separation, movement, stops, and users’ trip frequency in predicting crash frequency.
Previous research lacked information on the relationship between motorized road users’ subjective risk perception of NMVs and their involvement in collisions with these vehicles. However, the current study attempted to fill the research gap in relation to MV drivers’ assessment and interpretation of the risks associated with NMVs on the roads and how this perception relates to their collision history. Analysis reveals that crash frequency with NMVs increases for “severe” aggression among MV drivers compared with “mild” or “moderate” aggression, supporting the aggression–crash association established in previous research ( 62 – 64 ). Because anger affects the capacity to make decisions ( 65 ), motorists who are more hostile toward NMVs are more likely to be involved in accidents with these vehicles. Bus drivers who perceive NMVs to be structurally risky are more cautious when NMVs are around and, thus, are involved in fewer collisions. It can be inferred that risky driving by NMV drivers causes greater road rage among MV drivers, increasing the likelihood of collisions. A greater positive attitude toward NMVs is also estimated to reduce the likelihood of collisions with bus and car drivers, and this result is supported by the literature ( 66 ).
In addition to evaluating the association between perceptual factors and collisions, the study identified substantial differences in the subjective risk perception of motorcyclists, bus drivers, and car drivers. Higher perception scores for aggression, violation, and structural risk indicate that motorcyclists are more hostile toward NMVs and perceive them to be very risky. This may be because of more altercations in shared left-hand lanes, and in narrow alleyways where the other two MV groups do not usually travel.
As well as the aforementioned perceptual risk variables, this study showed that demographic factors such as age and education also affect MV–NMV crash frequency. The findings revealed that the frequency of crashes increases with age for bus drivers. Apart from encountering more crashes with NMVs over time, this may also be because of age-related concerns such as deteriorating vision and hearing, which can cause longer reaction times ( 67 ). However, in the case of pedestrian–MV crashes, Huang et al. found the opposite was true for middle-aged people ( 31 ), and Meena et al. ( 13 ) discovered that the majority of patients from NMV crashes were between the ages of 21 and 30. Furthermore, educated car drivers have a lower likelihood of crashes, which contradicts the results found by Dash et al. ( 68 ). This finding indicates that the development of sophisticated cognitive skills such as reasoning, decision-making, and problem-solving, which education fosters, contributes to an increased awareness of the surroundings when driving.
In addition, because of their increased awareness of the challenges associated with NMVs, car drivers who often use NMVs too are involved in fewer crashes than drivers who rarely use NMVs.
Finally, it should be mentioned that the findings of the study are based on a self-reported survey. Even though enough care was taken to include all demographic and socioeconomic classes, it was difficult to collect samples from high-income groups and female drivers. Because of socioeconomic factors and entrenched gender norms, it is uncommon to encounter high-income or female drivers in Dhaka because it is usual for high-income individuals to employ chauffeurs rather than drive their own vehicles, and although the number of female drivers is gradually increasing, they still make up a negligible portion of all licensed drivers ( 69 ). The study was unable to compare the collected sample composition with demographic data on motorcyclists, and bus, car, and NMV drivers because of the lack of such official statistics. In addition, increasing the sample size, particularly for those demographic and socioeconomic classes that are underrepresented, may allow for the incorporation of random effects to address the intraclass correlation problems in multilevel data. The authors feel that comparison with a similar study incorporating naturalistic driver behavior may yield interesting outcomes.
Supplemental Material
sj-docx-1-trr-10.1177_03611981231198839 – Supplemental material for Safety Risk of Nonmotorized Vehicles from the Perspective of Motorized Vehicle Drivers
Supplemental material, sj-docx-1-trr-10.1177_03611981231198839 for Safety Risk of Nonmotorized Vehicles from the Perspective of Motorized Vehicle Drivers by Niaz Ahmed, Shoumic Shahid Chowdhury, Md Fardeen Tanim, Dewan Tanvir Ahammed, Md Asif Raihan and Moinul Hossain in Transportation Research Record
Footnotes
Author Contributions
The authors confirm contribution to the paper as follows: study conception and design: M. A. Raihan, M. Hossain; data collection: M. Hossain, S. S. Chowdhury, M. F. Tanim, D. T. Ahammed; analysis and interpretation of results: N. Ahmed, S. S. Chowdhury, M. F. Tanim, D. T. Ahammed, M. A. Raihan, M. Hossain; draft manuscript preparation: N. Ahmed, S. S. Chowdhury, M. F. Tanim, D. T. Ahammed, M. A. Raihan, M. Hossain. All authors reviewed the results and approved the final version of the manuscript.
Declaration of Conflicting Interests
The author(s) declared no potential conflicts of interest with respect to the research, authorship, and/or publication of this article.
Funding
The author(s) received no financial support for the research, authorship, and/or publication of this article.
Supplemental Material
Supplemental material for this article is available online.
References
Supplementary Material
Please find the following supplemental material available below.
For Open Access articles published under a Creative Commons License, all supplemental material carries the same license as the article it is associated with.
For non-Open Access articles published, all supplemental material carries a non-exclusive license, and permission requests for re-use of supplemental material or any part of supplemental material shall be sent directly to the copyright owner as specified in the copyright notice associated with the article.