
Abstract
At signalized intersections where pedestrian crossings are divided into two stages by using a median island, pedestrian delay can be very long if the partial-crossing phases have poor progression. One technique for reducing pedestrian delay is pedestrian–left turn overlaps, in which half-crossings that are not in conflict with a left turn are allowed to run during the left turn phase as well as during the parallel vehicle through phase. Such an overlap can enable some pedestrians to cross in a single pass, or to have a far shorter wait at the median. Because this technique requires surrendering some of the flexibility with which left turn phases normally operate—in phases with a pedestrian call, the left turn phase cannot be skipped and may require a longer minimum green—there can also be an impact on vehicle delay. A case study of two intersections in Brookline, MA found that, compared with the current timing plan, using pedestrian–left turn overlaps could reduce pedestrian delay from about 100 to 35 s, with a negligible impact on vehicle delay. A methodological innovation introduced in this study was that average pedestrian delay was calculated for three pedestrian speeds and averaged together, thus accounting for how pedestrian delay at multistage crossings can be far lower for faster pedestrians who may be able to cross in a single pass than for slower pedestrians who have to wait at the crossing island.
At some signalized intersections, pedestrian crossings are divided into two or more stages, with pedestrians potentially having to stop and wait at an island between stages. Pedestrian delay for such a crossing can be very long if the partial-crossing phases have poor progression, even longer than the signal cycle. For example, an average pedestrian delay of 123 s—double the Highway Capacity Manual limit of 60 s for Level of Service F—has been reported by one study in the literature ( 1 ), and a recent study found that average delay for a three-stage crossing in Boston, MA was 241 s ( 2 ). However, if the partial-crossing phases are coordinated so that pedestrians wait for only a short time, or not at all, at the crossing island(s), average pedestrian delay need not be long ( 1 ).
Long pedestrian delay is not only a matter of inconvenience, but also of safety, equity, and livability. The Highway Capacity Manual ( 3 ) recognizes that when average pedestrian delay exceeds 40 s, pedestrian compliance becomes poor, which can create safety issues, and create equity issues owing to selective enforcement ( 4 ). And giving pedestrians the dignity of reasonably good service only if they violate signals works against the ideal of a livable, child-friendly city with low traffic stress for pedestrians and other nonmotorized road users ( 5 ).
Multistage crossings can require pedestrians to wait at median islands and at delta islands (also known as pork chop islands, associated with channelized right turns). This study is concerned with multistage crossings in which pedestrians may have to wait on a median island.
One traffic signal control technique for reducing pedestrian delay at two-stage crossings is pedestrian–left turn overlaps, in which half-crossings that are not in conflict with a left turn are allowed to run during the left turn phase as well as during the parallel vehicle through phase ( 1 , 6 ). Such an overlap enables some pedestrians, depending on their direction of travel, to begin their crossing earlier or to end it later, which can eliminate the need to stop and wait in the median. Furth et al. describe qualitatively how pedestrian–left turn overlaps can dramatically improve pedestrian progression at multistage crossings ( 1 ). However, using this technique may require giving up some of the flexibility with which left turn phases normally operate. In cycles with a pedestrian call, and in every cycle if the pedestrian crossings are on recall, the left turn phase cannot be skipped, even if no waiting vehicle is detected, and its minimum green time (Gmin) may have to be larger. Thus, pedestrian–left turn overlaps can be expected to shift time from the coordinated phases (typically, the arterial through phases) to the left turn phases, benefiting some vehicle movements at the expense of others, with an overall impact that is undetermined.
The objective of this study was to quantify, in a case study, the impacts on pedestrians and vehicles of providing pedestrian–left turn overlaps designed for good pedestrian progression at traffic signals with multistage crossings. The hypothesis was that pedestrian delay would be greatly reduced, whereas for vehicles, the expectation was not clear—would the impact be small, large, or perhaps even negligible?
Although left turn overlaps can be applied whether left turns are protected-only or have protected-permitted phasing, left turns were protected-only at the case study site.
Study Site
The case study site was a section of Beacon Street in Brookline, MA, with a pair of neighboring intersections that involve multistage crossing (Figure 1). The western intersection is where St. Paul Street crosses Beacon Street; 800 ft to the east, Kent and Powell Streets meet Beacon Street.
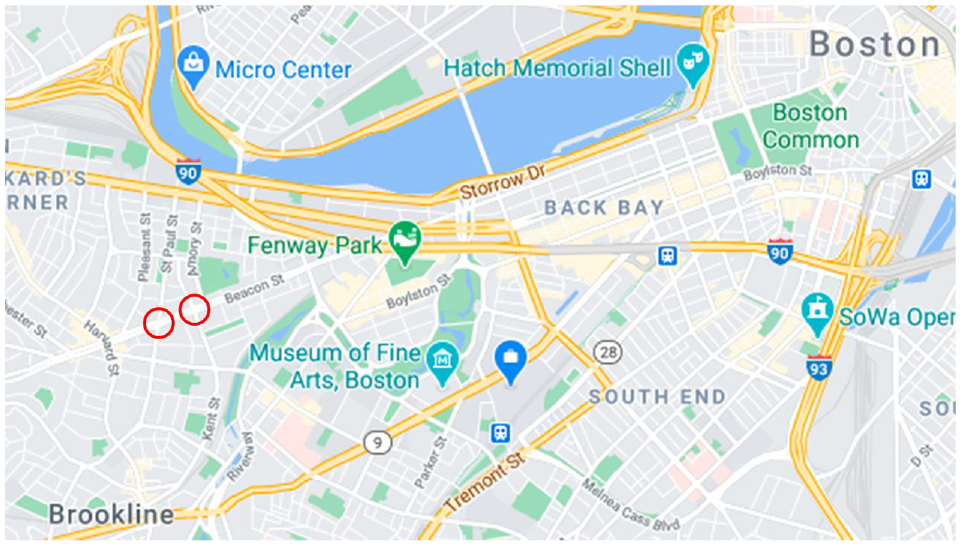
Locus map. The circled intersections are Beacon Street at St. Paul Street (left) and Beacon Street at Kent/Powell Streets.Source: Google.
Figures 2 and 3 show satellite views of the two intersections with crosswalks labeled and dimensions of interest. Beacon Street has a wide median reservation with light rail tracks. The skew angle of the St. Paul Street intersection makes its crossings particularly long—its longest full crossing is 158 ft, versus 128 ft at Kent/Powell. Neither of the cross streets (i.e., St. Paul Street or Kent/Powell Streets) has a left turn phase; the left turn overlaps in this study therefore concern left turns from Beacon Street only.
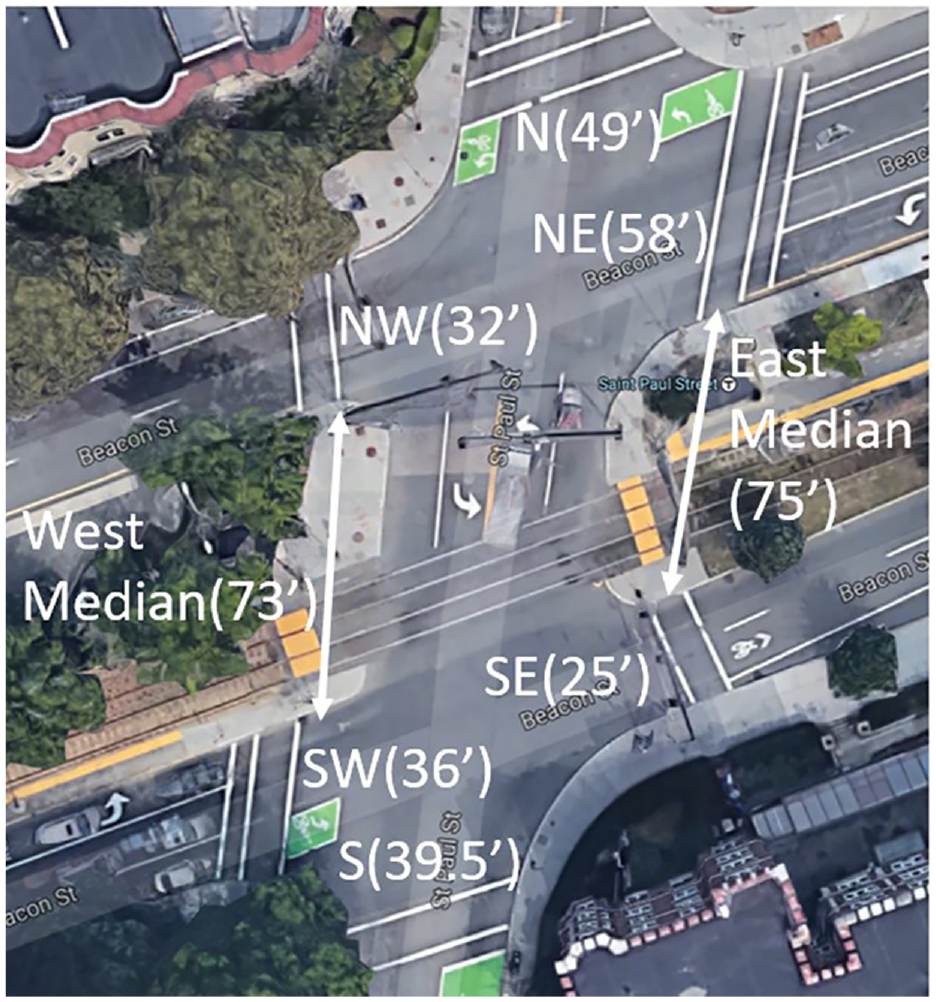
Crossing dimensions for Beacon Street (with light rail tracks in the median) at St. Paul Street.Map source: Google.

Crossing dimensions for Beacon Street at Kent Street (southern leg) and Powell Street (northern leg).Map source: Google.
Traffic Volumes
Fresh traffic counts were made for this project, obtained by setting up cameras at two opposite corners of each intersection and later reviewing the videos off-line. Counts were obtained for the a.m. peak hour (7:30 to 8:30 a.m.), a midday period (noon to 1 p.m.), and the p.m. peak hour (4:30 to 5:30 p.m.). All counts were obtained on a weekday between Monday and Thursday on days with normal traffic and weather in early 2020, before pandemic shutdowns. One of the six counts (a.m. peak count at the Kent/Powell intersection) had not yet been made when the pandemic hit, and so its traffic volumes were estimated using the biproportional method (7)., with the seed origin-destination matrix being the mirror image of the p.m. peak count at Kent/Powell and with arterial flow totals constrained to be consistent with the a.m. peak count at St. Paul Street (because they are neighboring intersections, arterial outflows from one intersection become inflows at the other).
Figure 4 shows hourly traffic volumes at the two intersections for the three different periods of the day. One can see the usual pattern of traffic being heavier in the peak periods, and of being oriented eastbound (toward downtown Boston) in the morning and westbound in the evening. Overall, there was more traffic outbound than inbound. On the north–south streets, the prevailing commute direction was northbound (toward Cambridge) in the morning and southbound in the evening.
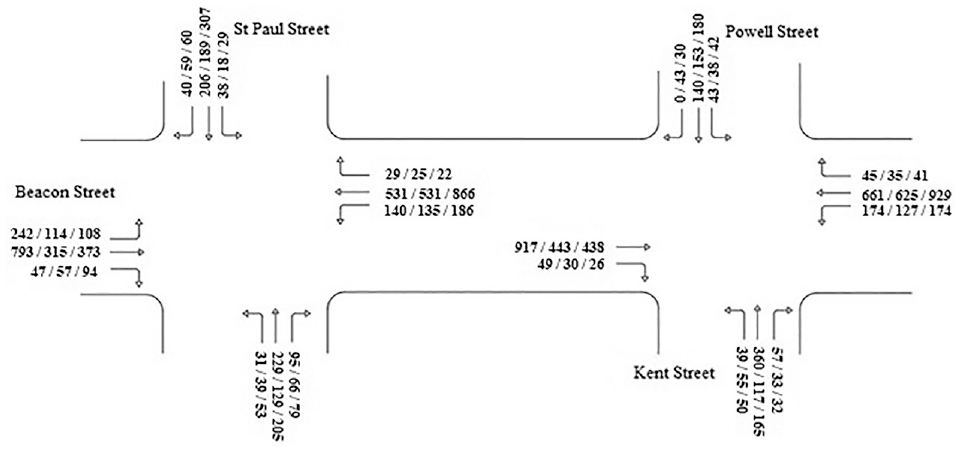
Hourly traffic volumes (a.m. peak/midday/p.m. peak).
Existing Signal Timing at St. Paul Street
The current timing plan for Beacon Street at St. Paul Street in the a.m. peak is shown in Figure 5. (For ease of comparison, shown just after it is Figure 6 with the proposed a.m. peak timing plan, which is described later.) Pedestrian phases are shown in narrow boxes; recall that for crossing Beacon Street, there are pedestrian phases for each of the half-crossings, labeled NE, NW, SE, and SW. As at both intersections and during all three periods, coordinated-actuated control with a 90-s cycle is used, all pedestrian phases are on recall, and all vehicle phases have a 7-s change interval, with 4 s for yellow and 3 s for red clearance. Figure 5 shows each phase’s typical split (split is the sum of green, yellow, and red clearance times) as well as the split range (minimum, maximum) for each phase. For phases whose split could vary, “typical” was the average split over the observation period.
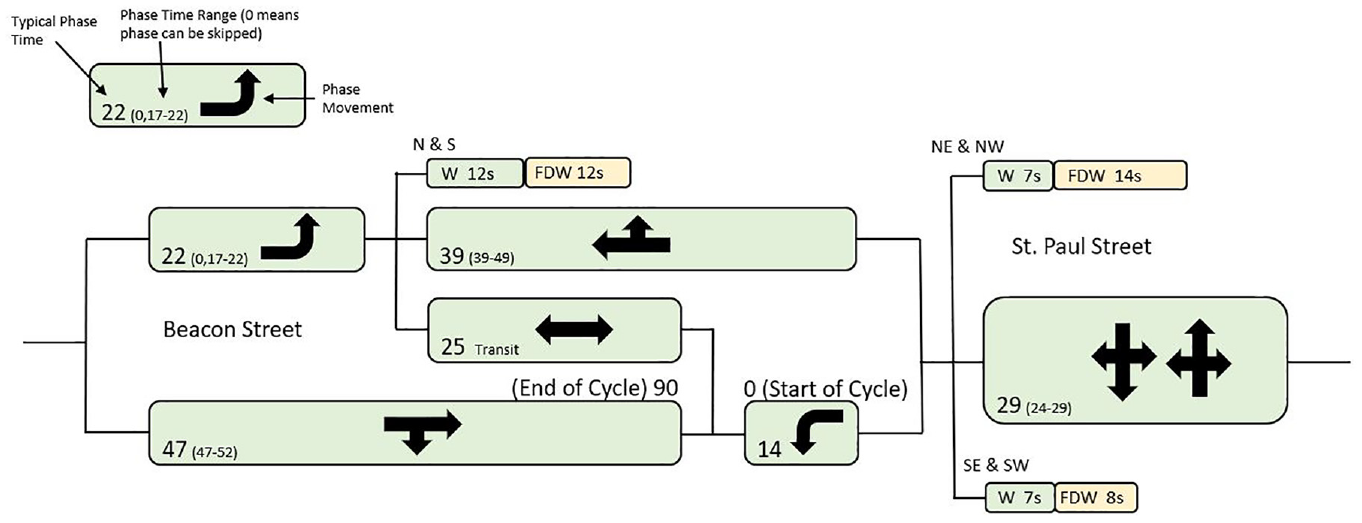
Existing a.m. peak signal timing plan for Beacon Street at St. Paul Street.

Proposed a.m. peak signal timing plan for Beacon Street at St. Paul Street.
Two phases at the St. Paul Street intersection—the cross street and eastbound left—are actuated, meaning that their green can end earlier than scheduled if their queues have dissipated; furthermore, eastbound left will be skipped altogether if no traffic is waiting, though this rarely happens except late at night. Any slack time from a phase ending early goes to starting the arterial through phases early in the next cycle, allowing them to run longer than scheduled because, being the coordinated phases, they have a fixed ending point in the cycle. Westbound left has a fixed duration, ending simultaneously with westbound through.
Because of the wide median, eastbound and westbound left turns would interlock if they ran simultaneously. To avoid that, eastbound has a leading left whereas westbound has a lagging left. Furth et al. showed that pedestrian–left turn overlaps have different impacts on pedestrians depending on whether lefts are leading or lagging, summarized as follows ( 1 ):
Both left turns leading: pedestrians walking along the left side of the street may be able cross in a single pass, whereas those walking along the right side have a relatively long wait in the median.
Both left turns lagging: pedestrians walking along the right side of the street may be able to cross in a single pass, whereas those walking along the left side have a relatively long wait in the median.
Lead–lag phasing: regardless of what side of the street they walk along, pedestrians walking in one direction (northbound if eastbound left leads, southbound if westbound left leads) may be able to cross in a single pass, whereas pedestrians walking in the other direction have to wait in the median; however, their wait is substantially shorter than it would be without overlaps.
Furth et al. also found that if pedestrian demand is equally spread by crossing direction and by side of the street, lead–lag phasing results in the lowest average pedestrian delay. In that sense, it is fortunate that lead–lag phasing is already in place at this intersection.
In the current timing plan, the four half-crossings across Beacon Street run concurrently with St. Paul Street. They have a minimum-length (i.e., 7 s) Walk window, even though the Walk interval could be longer without the pedestrian phase overrunning the concurrent vehicle phase.
The two pedestrian crossings parallel to Beacon Street run simultaneously with the transit phase, which, because of lead–lag left turns, runs only when neither eastbound nor westbound left turns have the green. This is an unnecessary restriction on pedestrians, since each pedestrian movement is in conflict with one, not two, of the left turn phases. As a result, whereas the eastbound through gets a split of at least 47 s, the crossing next to it gets only 24 s (counting both the Walk and flashing “Don’t Walk” [FDW] intervals); the other side of Beacon Street operates similarly. This odd arrangement not only forces more delay on pedestrians, it also creates a hazard for those walking along the south side of Beacon Street, because it means the Walk signal comes up after the through-right traffic stream has had the green for 22 s, allowing vehicles in that stream to reach full speed and for drivers to become accustomed to making right turns without pedestrian interference. When the Walk signal finally comes up, pedestrians are then expected to step into a moving stream of traffic. This kind of delayed pedestrian interval is the opposite of the leading pedestrian interval treatment ( 8 ), a safety treatment that helps pedestrians establish their priority before turning vehicles are released.
The current signal timing meets pedestrian clearance time needs, but in a limited and inconsistent way. Pedestrian clearance need is the crossing distance divided by the pedestrian design speed, taken as 3.5 ft/s; Table 1 shows the need for each crossing. This need can be met through a combination of FDW time, also shown in Table 1, and the pedestrian phase end buffer, when the pedestrian signal displays a solid “Don’t Walk” but before conflicting traffic movements are released. For consistency with user expectations, we favor a policy that limits the contribution of the phase end buffer to pedestrian clearance need to 3 s, though there is no national or state standard to that end beyond requiring that the phase end buffer be at least 3 s.
Pedestrian Clearance Time Analysis, St. Paul Street Intersection
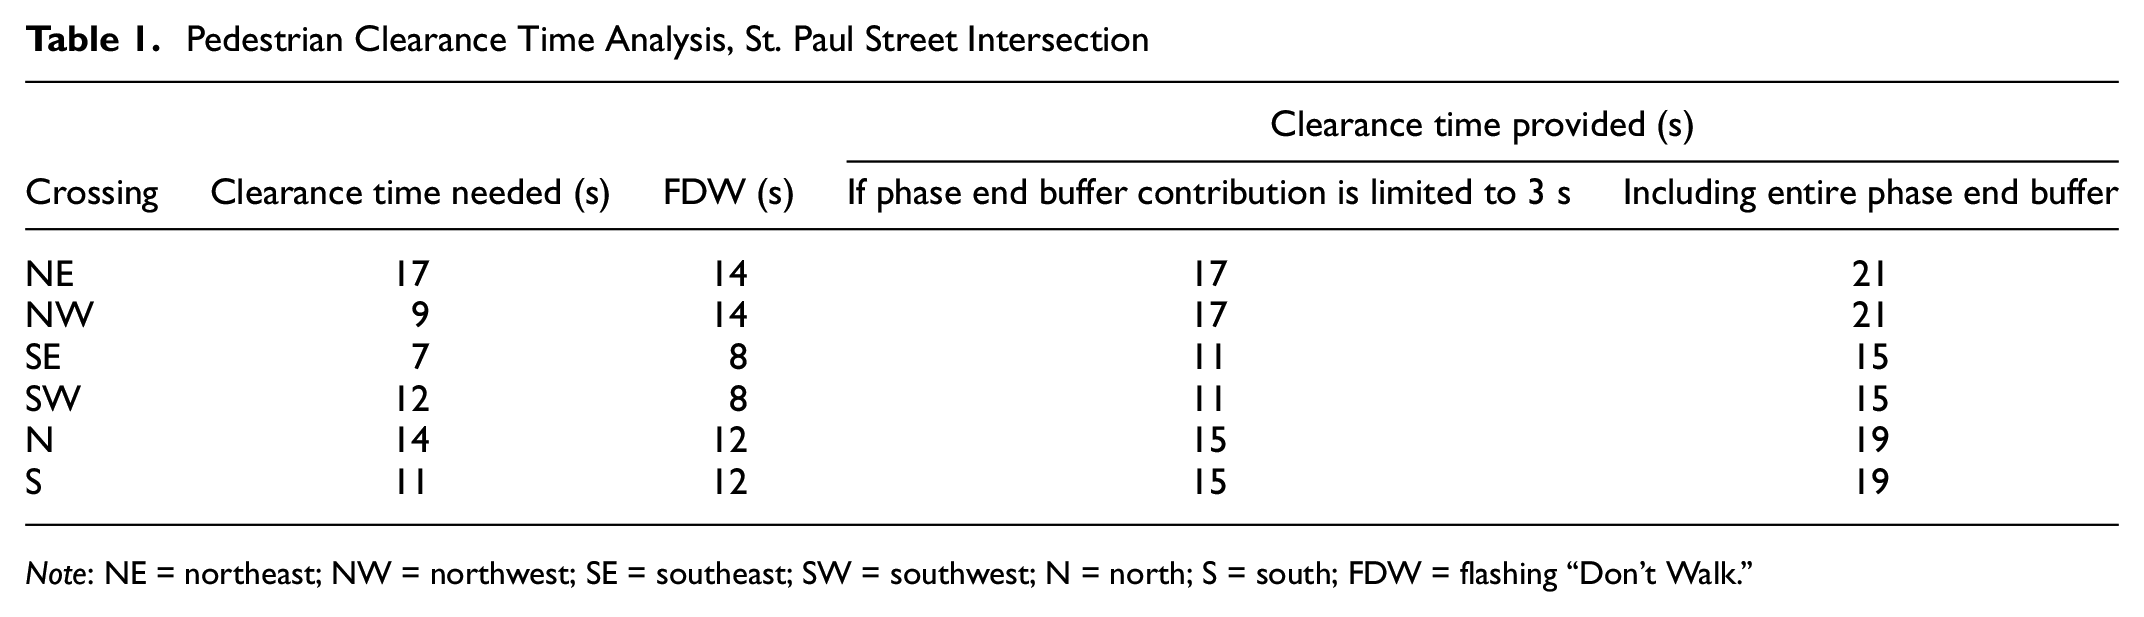
Note: NE = northeast; NW = northwest; SE = southeast; SW = southwest; N = north; S = south; FDW = flashing “Don’t Walk.”
Table 1 shows how the pedestrian clearance need for each crossing is met in the current timing plan, assuming phases run for their minimum length. One can see that if an unlimited contribution from the phase end buffer is allowed, all clearance needs are met, whereas if the contribution is limited to 3 s, the SW crossing has a 1-s deficit. One can also see that clearance time provided for some crossings exceeds the need by as much as 8 s, even with the phase end buffer limitation. This is undesirable because it unnecessarily reduces the length of the Walk interval, increasing pedestrian delay.
Proposed Changes
The proposed timing plan remains consistent with the existing framework of coordinated-actuated control. The principal change is adding pedestrian–left turn overlaps for the half-crossings that have no conflict with either the left turn or the concurrent through phase. That allows the south side half-crossings to begin earlier, and the north side half-crossings to end later. With this change, pedestrians walking northbound will be able to cross Beacon Street in a single pass. Other changes are described in the paragraphs that follow. The proposed timing plan for the a.m. peak has already been shown in Figure 6; existing and proposed plans for the other periods are shown in Figures 7 to 10.

Existing midday signal timing plan for Beacon Street at St. Paul Street.

Proposed midday signal timing plan for Beacon Street at St. Paul Street.

Existing p.m. peak signal timing plan for Beacon Street at St. Paul Street.

Proposed p.m. peak signal timing plan for Beacon Street at St. Paul Street.
Proposed Pedestrian Timing
FDW intervals were determined so that the pedestrian clearance time provided met the clearance need plus 1-s extra, while limiting the contribution of the phase end buffer to 3 s (adding one extra second for pedestrian clearance is common in metro Boston.) Because red clearance for all vehicle phases at this intersection lasted 3 s, in practice this meant ending FDW at the end of yellow, and setting FDW equal to required pedestrian clearance minus 2 s.
For both safety and improved service, the crossings parallel to Beacon Street are proposed to run concurrently with their adjacent Beacon Street vehicle through phase, not the transit phase. Because those through phases are coordinated phases, they can use the setting “rest in Walk,” meaning that the Walk interval begins with the onset of green and runs until a force-off point that leaves just enough time for pedestrian clearance.
For crossings concurrent with a noncoordinated phase, Walk interval length is maximized within the constraint of fitting into the shortest allowed concurrent phase split, subject to a minimum 7-s Walk window. The formula is

where
W = Walk interval length (s),
7 = minimum length of the Walk window (s),
Gmin = minimum green (s) for the concurrent vehicular phase,
Y = yellow time (s) for the concurrent vehicular phase,
Rclear = red clearance time (s) for the concurrent vehicular phase,
D = crosswalk length (ft),
3.5 = pedestrian crossing speed used for signal timing (ft/s), and
ExtraClear = extra pedestrian clearance time; for this project, 1 s.
Increasing Minimum Green for Actuated Phases
Selecting Gmin for the side streets involves a tradeoff: longer values allow for longer Walk intervals, but can constrain a phase to continue running after its demand has been met, denying additional time that would otherwise be given to the coordinated phase. Increasing Gmin to a range that vehicles need in most phases can benefit pedestrians by affording them a longer Walk interval with almost no impact to vehicle traffic. As shown by Cesme et al., a longer Gmin can in turn justify setting a pedestrian crossing to recall, further reducing pedestrian delay ( 9 ). Furth and Halawani suggest measuring the green time distribution and then setting Gmin equal to the 30th percentile length of the green time, arguing that in 70% of cycles, such a change will not affect vehicle operations at all, and that in the remaining 30%, the impact will be small ( 10 ).
Table 2 provides an analysis of the observed green time distribution for the two actuated phases at the St. Paul Street intersection in the three periods studied. In five of the six cases, the phase runs to its maximum green (Gmax) in 79% of cycles or more; for those five cases, therefore, it is proposed that Gmin be increased to equal Gmax, making the phase of fixed duration. For the remaining case, St. Paul Street midday, actual green nearly always exceeds the minimum of 11 s, but often does not reach the Gmax of 24 s, and so we propose increasing Gmin to the 30th percentile green duration, which is 18 s. In 30% of the cycles, this change should increase the duration of the St. Paul Street phase slightly, reducing the amount of slack given to the coordinated phases (the Beacon Street through phases); however, the coordinated phases will still get 6 s of slack (i.e., the difference between Gmax and the proposed Gmin), and so very little impact on Beacon Street traffic is expected.
Green Time Distribution Analysis for Actuated Phases, St. Paul Street Intersection

Note: Gmin = green minimum; Gmax = green maximum; EBL = eastbound left.
We propose increasing both Gmin and Gmax to 10 s to provide slightly more capacity for this left turn movement.
Making Westbound Left Actuated
Westbound left is currently a lagging movement with a fixed duration. Our proposed plan makes this movement actuated, like the lagging left at the Kent/Powell intersection, allowing it to extend its green a few more seconds if the queue has not cleared. If its green is extended, westbound through’s green will be extended with it. This change adds flexibility to the vehicle phases to compensate for the reduction in flexibility imposed elsewhere to improve pedestrian service.
Signal Timing at the Kent/Powell Intersection
Current Signal Timing Plan
The existing and proposed a.m. peak signal timing plan for Beacon Street at Kent/Powell Streets are shown in Figures 11 and 12. As at St. Paul Street, this intersection uses coordinated-actuated control with a 90-s cycle; the change intervals for all phases have 4 s of yellow time and 3 s for red clearance; all crossings are on recall; a transit phase runs while the two Beacon Street through phases overlap; and the crossings parallel to Beacon Street run concurrently with the transit phase rather than with the adjacent Beacon Street through phase.

Existing a.m. peak/p.m. peak signal timing plan for Beacon Street at Kent/Powell Streets.

Proposed a.m. peak signal timing plan for Beacon Street at Kent/Powell Streets.
Left turns from Beacon Street are prohibited eastbound. Westbound, left turns are served with a lagging, actuated phase whose split ranges from 16 to 18 s. If this phase is extended, westbound through is extended with it. Any slack from it ending early goes to starting the Beacon Street through phases early in the next cycle.
Proposed Signal Timing Improvements
The proposed plan for the Kent/Powell intersection (a.m. peak) includes pedestrian–left turn overlaps with the westbound left phase. These allow the two half-crossings on the south side of Beacon Street to start early, making it possible for northbound pedestrians to cross Beacon Street in a single pass.
As at St. Paul Street, the green time distribution was analyzed to see whether it might be appropriate to increase Gmin and, correspondingly, lengthen the Walk interval (Table 3). Westbound left runs to its Gmax in most cycles, and so our proposed timing plan makes that phase pretimed during all three periods. For the Kent/Powell phase, although we did not observe this intersection in the a.m. peak before the pandemic drastically changed traffic patterns, people familiar with it have told us that it often has an overflow queue, indicating that demand is great enough that the phase often runs to its maximum length. Therefore, for the a.m. peak, the proposed plan calls for Gmin to be increased to match Gmax, making it a fixed time phase. With these changes for the a.m. peak, pedestrians beginning at the start of the Walk interval will be able to cross Beacon Street in a single pass in both directions.
Green Time Analysis for Actuated Phases, Kent/Powell Intersection
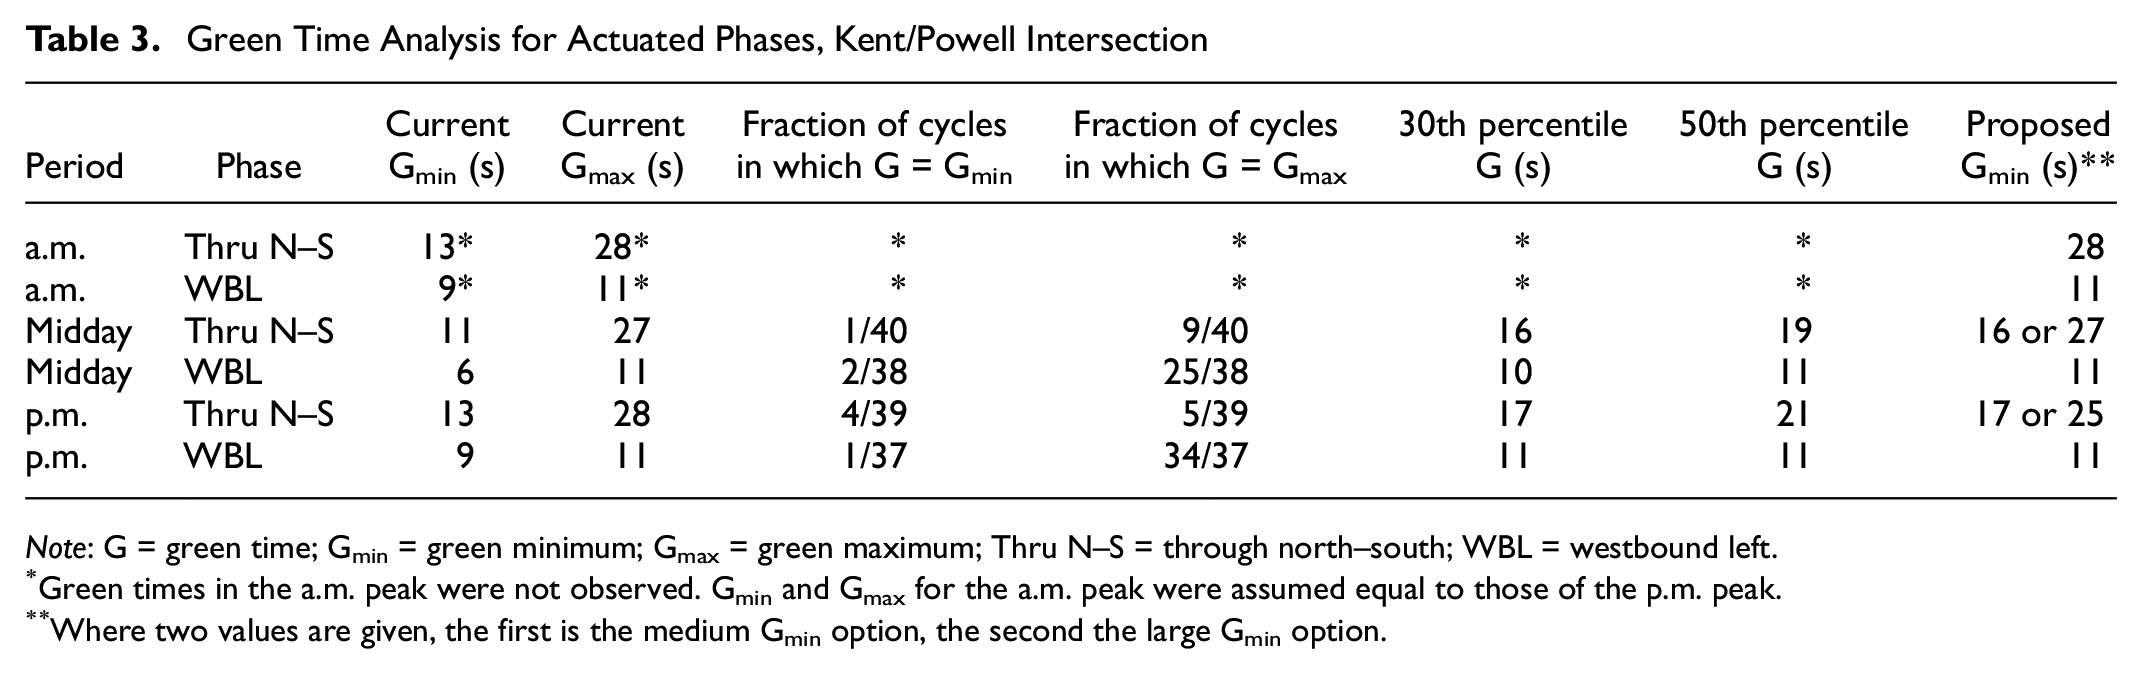
Note: G = green time; Gmin = green minimum; Gmax = green maximum; Thru N–S = through north–south; WBL = westbound left.
Green times in the a.m. peak were not observed. Gmin and Gmax for the a.m. peak were assumed equal to those of the p.m. peak.
Where two values are given, the first is the medium Gmin option, the second the large Gmin option.
For the midday and p.m. peak, we considered two options for retiming the Kent/Powell phase. One, called the medium Gmin option, is to increase the Gmin to the 30th percentile green time, meaning increasing it from 11 to 16 s at midday and from and 13 to 17 s during the p.m. peak. With this option, southbound pedestrians will still have to wait in the median, albeit for a far shorter time than they do now. The other, the large Gmin option, raises Kent/Powell’s Gmin duration to 27 s at midday and 25 s during the p.m. peak, long enough for pedestrians who walk at a moderately slow speed of 4.0 ft/s to cross Beacon Street in a single pass, whether walking southbound or northbound. The large Gmin option makes the Kent/Powell phase fixed time at midday (because its Gmax is also 27 s); in the p.m. peak, there is still a 3-s difference between Gmin and Gmax. The medium Gmin option can be seen as “making it better for pedestrians without affecting traffic operations”; the large Gmin option, “going all the way for pedestrians, and let’s see what the impact is on traffic.”
Figures 13 to 15 show signal timing plans for the Kent/Powell intersection for midday existing, midday proposed, and the p.m. peak proposed. Existing p.m. peak was shown earlier in Figure 11.

Existing midday signal timing plan for Beacon Street at Kent/Powell Streets.
Proposed midday signal timing plan, Kent/Powell intersection.

Proposed p.m. peak signal timing plan, Kent/Powell intersection.
Methods
Traffic operations were analyzed for the existing and proposed timing plans and compared. Vehicle delay was evaluated using two tools: Vistro, an intersection analysis tool that, like Synchro (a commonly used intersection analysis software tool), uses Highway Capacity Manual methods, and Vissim, a microsimulation model that tracks each vehicle’s movements in a network. A simulation video made using Vissim shows how the intersection will operate with the proposed signal timing plan in the a.m. peak ( 11 ).
Pedestrian delay for minor street crossings, which are single-stage crossings, was calculated using the standard pedestrian delay formula ( 3 ), which assumes that pedestrians arrive at random and begin crossing only during the Walk interval and the first 4 s of FDW,

where C = cycle length, and W = length of the Walk interval.
For the Beacon Street crossings, which are multistage, pedestrian delay was calculated using the Northeastern University Pedestrian and Bike Crossing Delay Calculator ( 12 ). For each moment in the signal cycle, it tracks a potential arriving pedestrian until they clear the intersection, assuming that pedestrians will depart a curb when the signal displays Walk or during the first 4 s of FDW, and wait otherwise.
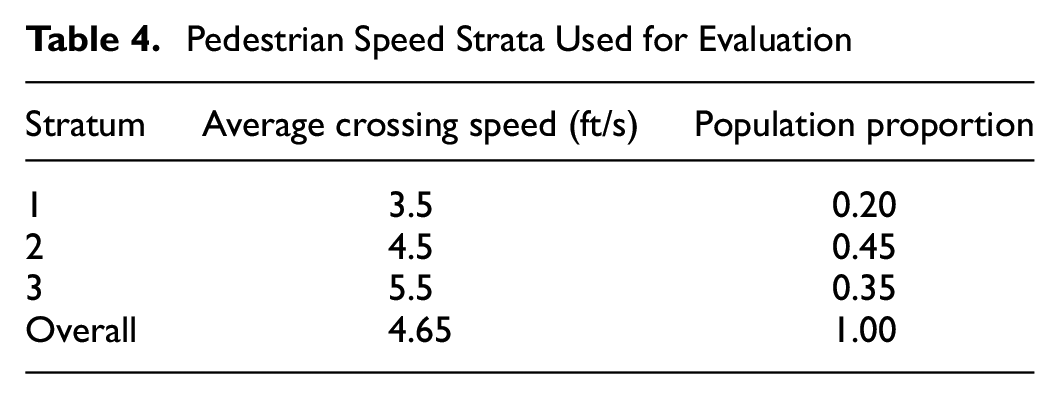
This study introduces an innovation in evaluating pedestrian delay, in that it evaluates delay for pedestrians with different walking speeds and combines those results to get average pedestrian delay. Unlike with single-stage crossings, variability in walking speed can affect average delay for multistage crossings when faster pedestrians are able to pass through an island without waiting, whereas slower pedestrians have to stop because of a signal change. For this study, pedestrian delay was evaluated for three walking speeds and averaged based on the population proportions shown in Table 4, taken from the distribution of walking speed found by Fitzpatrick et al., replicated in Figure 16. ( 13 )
Pedestrian Speed Strata Used for Evaluation
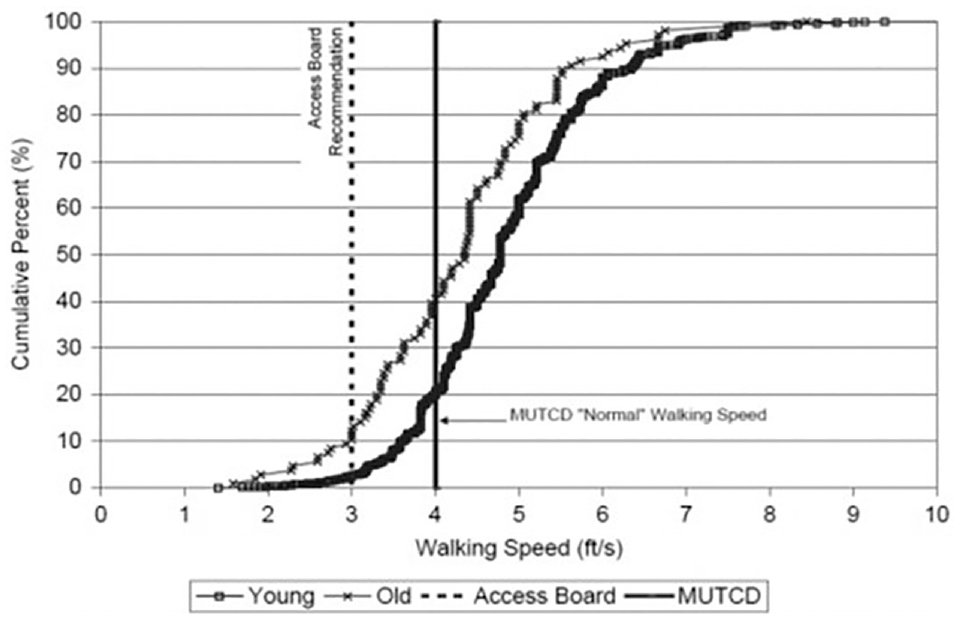
Cumulative distribution of pedestrian crossing speed, from Fitzpatrick et al. ( 12 ).
Findings
Pedestrian Delay
Figure 17 shows the average pedestrian delay for each crossing, by direction, for the three periods of the day, for the existing and proposed timing plans. These results are summarized in Figure 18, in which similar crossings, the two crossing directions, and all three periods are averaged together (simple averaging) to present a “big picture” result. For the Kent/Powell intersection, Figure 18 uses the large Gmin option’s results because the vehicle delay results, presented later, showed it to be the clearly superior option.

Average pedestrian by crossing, existing and proposed (s): (a) a.m. peak, (b) midday, and (c) p.m. peak.

Average pedestrian delay, combining periods and directions.
At both intersections, average pedestrian delay for crossing Beacon Street is currently around 100 s; with the proposed plans, that delay is slashed to about 35 s. Differences in average delay by crossing direction (owing to lead–lag left turn phasing) were evident, especially at St. Paul Street, where, for example, for the east-side crossing in the a.m. peak, average delay was about 17 s walking northbound but 41 s walking southbound.
For crossing St. Paul Street, average delay fell from 31 to 18 s by making pedestrian phases concurrent with the adjacent vehicle phase instead of the transit phase.
Diagrams produced by the Northeastern University Pedestrian and Bicycle Crossing Calculator (Figure 19) illustrate pedestrian progression through a multistage crossing and how it changes with the proposed signal timing. In that figure, which applies to the east-side crossing at St. Paul Street in the a.m. peak, the horizontal blue and black lines indicate pedestrians waiting, with the line becoming thicker as more people join the queue, whereas the diagonal lines indicate people walking. In the current plan (Figure 19b), pedestrians in both directions have very long waits to start their crossing, and then long waits in the median island. In the proposed plan (Figure 19c), initial waits are substantially reduced in both directions, and the bulk of pedestrians crossing northbound pass through the median island with no delay, whereas those crossing southbound are delayed in the median island, but for less time than in the current plan.

Progression diagrams for the two-stage east-side crossing of Beacon Street at St. Paul Street, a.m. peak., with a pedestrian crossing speed of 3.5 ft/s: (a) layout, showing waypoints (A, B, C) for crossing Beacon Street, (b) pedestrian coordination diagram, existing timing plan, and (c) pedestrian coordination diagram, proposed timing plan.
To illustrate the importance of considering a distribution of pedestrian speeds when analyzing multistage crossing delay, average pedestrian delay was calculated in two ways for the southbound east-side crossing at the St. Paul Street intersection, a.m. peak. If all pedestrians walk at an average speed (4.65 ft/s), average pedestrian delay was 51.4 s, versus 42.8 s when delay was evaluated for three different speeds and averaged together. This difference arises because, although an average-speed pedestrian could not reach the second crossing stage in time to continue without stopping, faster pedestrians could, vastly lowering their delay.
Vehicle Delay
Vehicle delay impacts, as calculated using Vistro and shown in Figure 20, were small. For the midday and p.m. peak, average vehicle delay changed by less than 1 s, and for the a.m. peak, there was actually a 5-s reduction in average vehicle delay.

Average vehicular delay (s) from Vistro analysis for a.m. peak, midday, and p.m. peak.
Figure 21 shows the delay impacts for each traffic movement. Most changes were small. The expected pattern was evident, with delay reductions for the arterial left turns (which get longer green times) and delay increases for the arterial through movements (whose green times become a slightly shorter). However, the delay increases to the arterial through movements were small, particularly with the medium Gmin option; of the 12 combinations of intersection/direction/period, only two arterial through movements saw an increase in delay of more than 2 s, the worst being an increase of 5.4 s. As expected, the large Gmin option, which gives substantially more green time to Kent/Powell Streets, reduced those streets’ delay significantly, with small offsetting increases to Beacon Street eastbound through.

Average vehicular delay from Vistro for a.m. peak (upper), midday, p.m. peak (lower).
Of particular interest are the tradeoffs involved between the medium Gmin and large Gmin options for the Kent/Powell intersection, for the midday and p.m. peak periods. With the medium Gmin option, southbound pedestrians crossing Beacon Street still had to wait in the median, but not in the large Gmin option. For brevity’s sake, only the p.m. peak results for the east-side crossing will be discussed—both midday and west-side crossing results were similar. For pedestrians walking southbound, average delay is 105 s with the existing timing plan, falling to 65 s with left turn overlaps with the medium Gmin option, and falling again to 31 s with the large Gmin option (Figure 17). At the same time, average vehicle delay between the two options (Figure 21) scarcely changed, staying within 1 s of existing delays, with some improvement for side street traffic, which was offset by a slight deterioration for Beacon Street through traffic. For this case at least, removing much of the flexibility with which coordinated-actuated logic takes slack time from minor movement phases and gives it to the arterial phase results in no net deterioration in performance, while pedestrian service improves dramatically.
A second analysis result came from using Vissim to calculate average vehicle delay. For the two intersections together, compared with the current timing plan, average vehicle delay using the proposed timing plans was about 5 s less in the a.m. peak and changed by less than 1 s during the other two periods.
Conclusions
Using left turn overlaps to improve pedestrian progression can substantially reduce pedestrian delay at multistage crossings with little net impact to vehicle traffic. In a simulation-based case study of two intersections, left turn overlaps reduced average pedestrian delay for the arterial crossing from roughly 100 to 35 s, with virtually no change in average vehicle delay.
This case study highlights two techniques for improving pedestrian progression at multistage crossings. The primary one is pedestrian–left turn overlaps, which can allow pedestrians to begin crossing earlier and/or end crossing later than if they crossed concurrently with the cross street only. The other is lengthening the cross street Gmin to increase the concurrent Walk interval. In this case study, the first technique enabled pedestrians walking in one direction to cross in a single pass, whereas with the second technique, those walking in the other direction could also do so at the Kent/Powell intersection (but not at the St. Paul Street intersection because its skew angle makes the crossings so much longer).
Improving pedestrian progression, whether with left turn overlaps or a longer cross street Gmin, reduces flexibility in the traffic signal operation. For the intersections studied, this loss in flexibility was found to have no substantial impact on the vehicular aspects of intersection performance. One reason for the lack of impact to vehicles in the case study was that some of the flexibility provided in the current plan was rarely used—left turn phases were almost never skipped for lack of demand, and several of the actuated phases often ran to, or near, their Gmax because of strong vehicular demand. A second reason was that the basic control framework, which is coordinated-actuated control, had a fixed cycle length, which means that skipping or shortening phases cannot reduce the cycle length (something that could reduce delay for all users); all it can do is reallocate green time to the arterial through phases. The changes in green time allocation from left turn overlaps and pedestrian-friendly Gmin settings resulted in small delay reductions to movements that got more green time and delay increases to those that got less, with little or no net change.
Where transit signal priority (TSP) is used, a loss in flexibility like this could reduce the effectiveness of TSP in some cases. It will not affect the most commonly used TSP tactic, which is green extension, but it could limit the effectiveness of the early green tactic unless approaching transit vehicles can be detected far enough in advance to end the Walk interval earlier than programmed (subject to a minimum of 7 s). This tradeoff is worth further exploration.
In practice, signal timing plans are usually designed using software tools that aim to minimize vehicle delay, with no consideration of pedestrian delay. Timing plans produced using such tools do not even consider pedestrian progression through multistage crossings, and because they are optimizing for vehicles, avoid pedestrian-driven constraints on vehicle phases except as required by minimum standards, using slack to maximize the flexibility of vehicular phases. The findings of this research indicate that, where coordinated-actuated logic is used, this flexibility may do very little to improve vehicle service, while giving up some flexibility to improve pedestrian progression can be of enormous benefit to pedestrians. Designers should go beyond the traditional practice of timing pedestrian phases to minimum standards, considering not only left turn overlaps but also longer Walk intervals and corresponding Gmin settings to provide good pedestrian progression, and then compare alternative timing plans to explicitly evaluate the tradeoff between pedestrian and vehicle delay rather than assume that any loss in flexibility is bound to harm performance.
At multistage crossings, pedestrian delay should be calculated using a method that accounts for variability in pedestrian speed. Although speed variability does not affect average delay calcuations at single-stage crossings, using a single average-speed pedestrian to determine average delay can be misleading at multistage crossings when faster pedestrians are able to pass through an island without stopping whereas slower pedestrians are not.
Finally, this study helps underline the business maxim “only what’s measured counts.” An unfortunate aspect of standard traffic engineering practice is that when intersection studies are undertaken, pedestrian delay is neither measured nor reported. When signal timing plans for Beacon Street were developed, if the public had been shown that average pedestrian delay was going to be 100 s whereas average vehicle delay was about 30 s, it is likely that citizens would have demanded a more balanced solution. Where there are single-stage crossings, average pedestrian delay is closely related to cycle length, and therefore easy to imagine; however, with multistage crossings, the effect of progression can be good or bad and is difficult to visualize, and so where there are multistage crossings, it is especially important that pedestrian delay be measured and reported as part of the timing plan design process.
Footnotes
Author Contributions
The authors confirm contribution to the paper as follows: study conception and design: P. Furth; data collection: F. Lao; analysis and interpretation of results: F. Lao, P. Furth; draft manuscript preparation: F. Lao, P. Furth. All authors reviewed the results and approved the final version of the manuscript.
Declaration of Conflicting Interests
The authors declared no potential conflicts of interest with respect to the research, authorship, and/or publication of this article.
Funding
The authors received no financial support for the research, authorship, and/or publication of this article.